 Open Access Article
Investigation of non-precious metal cathode catalysts for direct borohydride fuel cells†
Yu Guo a,
Yingjian Caoa,
Qinggang Tan
 b,
Daijun Yang
 a,
Yong Chec,
Cunman Zhang
 a,
Pingwen Minga and
Qiangfeng Xiao
 *a
*a
aSchool of Automotive Studies & Clean Energy Automotive Engineering Center, Tongji University (Jiading Campus), 4800 Cao'an Road, Shanghai 201804, China
bSchool of Materials Science & Engineering, Tongji University (Jiading Campus), 4800 Cao'an Road, Shanghai, 201804, China
cEnpower Beijing Corp., 13 Area 2 Jinsheng Street, Daxing, Beijing 06500, China
First published on 18th June 2024
Abstract
Borohydride crossover in anion exchange membrane (AEM) based direct borohydride fuel cells (DBFCs) impairs their performance and induces cathode catalyst poisoning. This study evaluates three non-precious metal catalysts, namely LaMn0.5Co0.5O3 (LMCO) perovskite, MnCo2O4 (MCS) spinel, and Fe–N–C, for their application as cathode catalysts in DBFCs. The rotating disk electrode (RDE) testing shows significant borohydride tolerance of MCS. Moreover, MCS has exhibited exceptional stability in accelerated durability tests (ADTs), with a minimal reduction of 10 mV in half-wave potential. DFT calculations further reveal that these catalysts predominantly adsorb  over
over  , unlike commercial Pt/C which preferentially adsorbs
  . In DBFCs, MCS can deliver a peak power density of 1.5 W cm−2, and a 3% voltage loss after a 5 hours durability test. In contrast, LMCO and Fe–N–C have exhibited significantly lower peak power density and stability. The analysis of the TEM, XRD, and XPS results before and after the single-cell stability tests suggests that the diminished stability of LMCO and Fe–N–C catalysts is due to catalyst detachment from carbon supports, resulting from the nanoparticle aggregation during the high-temperature preparation process. Such findings suggest that MCS can effectively mitigate the fuel crossover challenge inherent in DBFCs, thus enhancing its viability for practical application.
Introduction
The escalating environmental crisis, coupled with the dwindling reserves of fossil fuels, presents formidable challenges to the global energy framework's sustainability.1 Recognizing the gravity of these issues, the pursuit of alternative energy technologies has gained paramount importance. Among these technologies, proton exchange membrane fuel cells (PEMFCs) have emerged as a compelling solution, characterized by high energy efficiency and minimal pollutant emissions.2,3 However, the reliance on hydrogen as a key element in PEMFC operations encounters significant challenges, including the exorbitant and intricate infrastructure required for hydrogen production, storage, and distribution.4–6 Conversely, liquid fuels, such as methanol, offer a more practical alternative due to their relatively straightforward production, storage, and logistical frameworks.7–10 Despite its advantages, the combustion processes of methanol still generate greenhouse gas emissions.11 To address this challenge, borohydrides are proposed as an alternative liquid fuel source, owing to their carbon-free nature and absence of greenhouse gas emissions.12 Additionally, direct borohydride fuel cells (DBFCs) exhibit superior energy density and a high theoretical open circuit voltage (OCV), making them a promising and environmentally friendly solution.When oxygen is used as a cathode oxidant, the half-cell reactions occurring in a DBFC are as follows:13
| Anode: BH4− + 8OH− → BO2− + 6H2O + 8e− (E0 = −1.24 V vs. RHE) | (1) |
| Cathode: 2H2O + O2 + 4e− → 4OH− (E0 = 0.4 V vs. RHE) | (2) |
| Overall BH4− + 2O2 → BO2− + 2H2O (E0cell = 1.64 V vs. RHE) | (3) |
A significant challenge encountered by DBFCs, particularly those employing anion exchange membranes (AEMs), is the occurrence of fuel crossover.14,15 This phenomenon manifests in polarization losses at the cathode and inefficiencies in fuel conversion. It involves the migration of borohydride ions from the anode, across the polymer membrane, to the cathode catalyst layer.16 The presence of borohydride at the cathode catalyst sites reduces the effective surface area for the oxygen reduction reaction (ORR), and borohydride can undergo direct oxidation catalysed by the cathode catalyst. This oxidation reaction generates a mixed potential that leads to a decrease in the overall cell voltage.17 Furthermore, this reaction generates excess water, necessitating efficient management strategies, and increases the required oxygen stoichiometric ratio.18 Therefore, it is of paramount importance to engineer ORR cathode catalysts that can demonstrate resilience against the deleterious effects of borohydride species, thereby mitigating catalyst poisoning.
Currently, most studies employ commercially available Pt/C as the cathode catalyst. Nonetheless, it should be noted that Pt/C serves as an exceptional catalyst for BOR, a characteristic that may result in a significant mixed potential issue when borohydride permeates to the cathode. Given that the NaBH4–O2 DBFCs operate under an alkaline environment, the prioritization of non-precious metal catalysts is advocated owing to their intrinsic resistance to BOR. To date, various cathode catalysts have been utilized in DBFCs, including transition metal oxides,19–21 perovskite oxides (ABO3),22–25 and transition metals with nitrogen-doped carbon (M–N–C).26,27 Chatenet et al.28 investigated the ORR catalytic activity of various catalysts in the mixed solution of NaBH4 and NaOH. They found that only MnO2-based catalysts were unaffected by the presence of NaBH4 in the solution. Grimmer et al.29 reached a similar conclusion, further corroborating the unique BH4− tolerance property of MnO2-based catalysts in the presence of sodium borohydride. Sgarbi et al.27 investigated the ORR activity as well as the BH4− tolerance of M–N–C catalysts. They found that the atomically dispersed Fe- and Co-containing catalysts displayed good BH4− tolerance. Furthermore, perovskite oxides also have been demonstrated as an efficient BH4− tolerance catalyst. Perovskite oxides have several advantages, such as high conductivity, good catalytic activity, and thermal and chemical stability.30 Nevertheless, their synthesis usually needs high-temperature treatment, which complicates the load of precursors onto carbon support and frequently leads to the agglomeration of particles.31,32
Cobalt-based multivalent spinel catalysts, denoted as MCo2O4 (where M represents transition metals such as Fe, Ni, Cu, Mn, etc.), have garnered substantial attention due to their potential applications in ORR.33–35 This burgeoning interest stems from their high abundance, facile synthesis process, and remarkable redox stability in aqueous alkaline solutions.36,37 The structural configuration of these catalysts, characterized by a spinel framework, permits the housing of metal ions at both tetrahedral and octahedral sites. This structural versatility consequently leads to a wide spectrum of oxidation states, further enhancing their catalytic potential.38,39 Among various spinel catalysts, MnCo2O4 finds the most extensive utilization in ORR. Abruña et al.40 employed in situ X-ray absorption spectroscopy (XAS) to elucidate the catalytically active sites within MnCo2O4. Their study revealed that the Co2+/3+ and Mn2+/3+/4+ redox couples synergistically participate in ORR. Leveraging the charge transfer between Co and Mn, the peak power density of an alkaline H2–O2 fuel cell employing MnCo2O4 cathode achieves a remarkable value of 1.1 W cm−2 at 2.5 A cm−2 at 60 °C.41
In this study, three widely used non-precious metal catalysts, namely LaMn0.5Co0.5O3 (LMCO) perovskite, MnCo2O4 spinel (MCS), and Fe–N–C, were synthesized using conventional methods. The morphological and structural properties were characterized using X-ray diffraction (XRD), transmission electron microscopy (TEM), and X-ray photoelectron spectroscopy (XPS) techniques. Furthermore, the ORR activity was evaluated in the presence/absence of borohydride in alkaline solution, utilizing the rotating disk electrode (RDE) method. Subsequently, the AEM based DBFCs were fabricated using the above-mentioned catalysts as the cathode catalysts and commercial Pt/C as the anode catalyst. The effect of different cathode catalysts on the performance of DBFCs operating at 80 °C was examined. Additionally, the effect of temperature on cell performance was investigated. After conducting durability tests in a single cell environment, further TEM, XRD, and XPS tests were conducted to substantiate our claim that MCS is the superior cathode catalyst among all candidates.
Experimental
Chemical and materials
In this study, all deionized water was produced utilizing a Milli-Q system with a resistivity of 18.2 MΩ cm. BLACK PEARLS®2000 carbon black (BP2000) was obtained from Cabot Co. Nitric acid (HNO3, 65–68%), lanthanum(III) nitrate hexahydrate [La(NO3)3·6H2O, 99.99%], iron(III) nitrate hexahydrate [Fe(NO3)3·9H2O, 98.5%], zinc(II) nitrate hexahydrate [Zn(NO3)2·6H2O, 99%], manganese(II) acetate tetrahydrate [Mn(OAc)2·4H2O, 99%], cobalt(II) acetate tetrahydrate [Co(OAc)2·4H2O, 99.5%], ammonia aqueous (NH3·H2O, 25–28%), 2,4-diaminopyridine (97%), potassium hydroxide (KOH, 85%), sodium borohydride (NaBH4, 96%), ethanol (99.7%) and isopropanol (99.7%) were purchased from Sinopharm Chemical Reagent Co., Ltd. Commercial Pt/C (40%, Johnson Matthey Co.) and cation exchange ionomer Nafion® (Dupont, 5 wt%) were used as received. The anion exchange membrane Alkymer® W-211415 (15 μm) was obtained from EVE Institute of New Energy Technology.Catalyst synthesis
For chemical modification of carbon support, 2 g of BP2000 was firstly dispersed in 100 mL of HNO3. Afterwards, the suspension was heated to 70 °C and maintained for 2 hours under magnetic stirring. Then, the suspension was cooled to room temperature. Thereafter, the suspension was centrifugated and washed using deionized water repeatedly until the supernatant became neutral. Finally, the modified BP2000 was obtained by freeze-drying.The LaMn0.5Co0.5O3 (LMCO) perovskite was synthesized employing a sol–gel method. Initially, 1.08 g of La(NO3)3·6H2O, 0.32 g of Mn(OAc)2·4H2O, and 0.32 g of Co(OAc)2·4H2O were dissolved into a 40 mL of solution mixed of deionized water and ethanol in a 1![[thin space (1/6-em)]](https://www.rsc.org/images/entities/char_2009.gif) :
:![[thin space (1/6-em)]](https://www.rsc.org/images/entities/char_2009.gif) 1 volume ratio. This mixture was then subjected to rigorous stirring for 12 hours, resulting in the formation of a red gel. Subsequently, the water was completely evaporated in an oven at 80 °C for 12 hours. The resulting purple product was then mixed with pre-oxidized carbon support (with a metal loading of 40%) and further calcinated at 900 °C for 5 hours, maintaining a heating rate of 5 °C min−1. Finally, the LaMn0.5Co0.5O3 perovskite was obtained without further treatment.
1 volume ratio. This mixture was then subjected to rigorous stirring for 12 hours, resulting in the formation of a red gel. Subsequently, the water was completely evaporated in an oven at 80 °C for 12 hours. The resulting purple product was then mixed with pre-oxidized carbon support (with a metal loading of 40%) and further calcinated at 900 °C for 5 hours, maintaining a heating rate of 5 °C min−1. Finally, the LaMn0.5Co0.5O3 perovskite was obtained without further treatment.
The synthesis of Mn–Co spinel (MCS) was modified according to the previously reported procedure.41 Initially, 63.5 mg of Co(OAc)2·4H2O and 60 mg of pre-oxidized carbon support were dispersed in 30 mL of deionized water within a breaker and homogenized using ultrasonication for 30 minutes. Then, the breaker was transferred to a heating oil bath at ambient temperature, and 0.5 mL of NH3·H2O was incrementally added to the solution under continuous magnetic stirring. This was followed by incrementally increasing the temperature of the oil bath to 60 °C. Subsequently, an aqueous solution consisting of 62.5 mg of Mn(OAc)2·4H2O dissolved in 5 mL of deionized water was incorporated. After aging for 2 hours, the resultant suspension was sonicated and transferred into a 100 mL Teflon-lined stainless-steel autoclave and subjected to a reaction temperature of 150 °C for 3 hours. Finally, the mixture was cooled naturally to room temperature, rinsed with deionized water multiple times, and freeze-dried for 12 hours to yield the MCS catalyst.
The Fe–N–C catalyst was synthesized through the following procedure. Initially, 0.1 g of pre-oxidized carbon support, 0.5 g of 2,4-diaminopyridine, 0.7 g of Zn(NO3)2·6H2O, and 30 mg of Fe(NO3)3·9H2O were added into 60 mL of ethanol. This mixture was stirred at 60 °C until the ethanol was entirely evaporated. Following this, the resultant product was subjected to a drying process at 60 °C for 2 hours and subsequently milled to achieve a uniform consistency. The milled powder was then placed in a tube furnace and calcinated at 900 °C for 2 hours under N2 atmosphere, with a controlled heating rate of 5 °C min−1. Finally, the Fe–N–C catalyst was collected after a ball milling treatment on the resultant powder.
Rotating disk electrode (RDE) measurements
Electrochemical measurements were conducted using a rotating disk electrode (RDE) system (Pine Research Instruments, USA) with a CH Instruments 760E (CH Instruments Inc., USA) workstation in a three-electrode setup at 25 °C. A 250 mL jacketed glass cell contained a 1.0 M KOH-saturated Hg/HgO electrode and a graphite rod, which served as reference and counter electrodes, respectively. The working electrode was prepared by dispersing the cathode catalyst (6 mg) into a solution of isopropanol (3 mL) and Nafion® (60 μL), followed by a 1 hour sonication process in an ice bath. The polished glassy carbon RDE (5 mm in diameter with a geometric area of 0.196 cm2) was subsequently coated with 10 μL of the catalyst ink and allowed to dry at room temperature, thereby serving as the working electrode. All potentials reported in this study are referenced to the reversible hydrogen electrode (RHE). The ORR measurements were conducted in an O2-saturated 1.0 M KOH solution with or without 10 mM NaBH4 by sweeping the potential from 0.3 to 1.1 V vs. RHE at a scan rate of 20 mV s−1 with varying rotating speed from 625 to 2025 rpm. Koutecky–Levich (K–L) plots (j−1 vs. ω−1/2) were analysed at different electrode potentials. Additionally, the electron transfer numbers (![[n with combining macron]](https://www.rsc.org/images/entities/i_char_006e_0304.gif) ) can be calculated using the K–L equation:42
) can be calculated using the K–L equation:42
 | (4) |
| B = 0.2nFC0D02/3ν−1/6 | (5) |
![[thin space (1/6-em)]](https://www.rsc.org/images/entities/char_2009.gif) 485 C mol−1), C0 represents the bulk concentration of O2 (7.8 × 10⁻⁷ mol cm−3 in 1 M KOH), D0 represents the diffusion coefficient of O2 (1.8 × 10⁻⁵ cm2 s−1 in 1 M KOH), and v represents the kinematic viscosity of electrolyte (0.01 cm2 s−1 in 1 M KOH).43 The ORR polarization curves were recorded from 0.3 to 1.1 V vs. RHE at a scan rate of 20 mV s−1 with a rotation rate of 1600 rpm. The 10k accelerated durability test (ADT) cycles were carried out between 0.6 and 1.0 V vs. RHE at a scan rate of 100 mV s−1 in O2-saturated 1 M KOH.
485 C mol−1), C0 represents the bulk concentration of O2 (7.8 × 10⁻⁷ mol cm−3 in 1 M KOH), D0 represents the diffusion coefficient of O2 (1.8 × 10⁻⁵ cm2 s−1 in 1 M KOH), and v represents the kinematic viscosity of electrolyte (0.01 cm2 s−1 in 1 M KOH).43 The ORR polarization curves were recorded from 0.3 to 1.1 V vs. RHE at a scan rate of 20 mV s−1 with a rotation rate of 1600 rpm. The 10k accelerated durability test (ADT) cycles were carried out between 0.6 and 1.0 V vs. RHE at a scan rate of 100 mV s−1 in O2-saturated 1 M KOH.
Single cell fabrication
This study employed the commercial 40 wt% Pt/C catalysts as anode catalysts, while the cathode catalysts employed were MCS, LMCO, Fe–N–C and commercial 40 wt% Pt/C. The preparation of both anode and cathode catalyst inks followed a similar procedure. The catalyst powder was dispersed into isopropanol at a concentration of 5 mg mL−1 under ultrasonication in an ice bath for 30 minutes. Subsequently, Nafion® was incorporated into the solution at a catalyst/binder mass ratio of 3![[thin space (1/6-em)]](https://www.rsc.org/images/entities/char_2009.gif) :
:![[thin space (1/6-em)]](https://www.rsc.org/images/entities/char_2009.gif) 1 and ultrasonicated for an additional 30 minutes. The anode and cathode catalyst inks were sprayed onto carbon cloth (W0S1009, Ce Tech Co., Ltd, Taiwan) and carbon paper (28BC, SGL Carbon, Wiesbaden, Germany), respectively, using an airbrush. The effective area of the anode and cathode electrodes was 1.5 × 1.5 cm2. The Pt loading at the anode was approximately 0.15 mg cm−2, whereas the metal loading at the cathode was approximately 1.5 mg cm−2. Furthermore, poly(arylene piperidinium) based anion exchange membranes (Alkymer®) were used as electrolytes to separate anode and cathode reactants. The membranes were immersed in 2 M KOH aqueous solution for 24 hours to replace Cl− with OH− at 60 °C. Before MEA fabrication, the membranes were thoroughly rinsed with deionized water to remove residual KOH and KCl. The single cells were fabricated by sandwiching the membrane with the anode and the cathode, and their rear was then contacted with two graphite flow fields designated for anolyte and oxygen, respectively. Silicone sheets with the thickness of 200 and 300 μm were used as cathode and anode gaskets, respectively. Finally, a torque of 6 N m was applied to ensure the cell was entirely sealed.
1 and ultrasonicated for an additional 30 minutes. The anode and cathode catalyst inks were sprayed onto carbon cloth (W0S1009, Ce Tech Co., Ltd, Taiwan) and carbon paper (28BC, SGL Carbon, Wiesbaden, Germany), respectively, using an airbrush. The effective area of the anode and cathode electrodes was 1.5 × 1.5 cm2. The Pt loading at the anode was approximately 0.15 mg cm−2, whereas the metal loading at the cathode was approximately 1.5 mg cm−2. Furthermore, poly(arylene piperidinium) based anion exchange membranes (Alkymer®) were used as electrolytes to separate anode and cathode reactants. The membranes were immersed in 2 M KOH aqueous solution for 24 hours to replace Cl− with OH− at 60 °C. Before MEA fabrication, the membranes were thoroughly rinsed with deionized water to remove residual KOH and KCl. The single cells were fabricated by sandwiching the membrane with the anode and the cathode, and their rear was then contacted with two graphite flow fields designated for anolyte and oxygen, respectively. Silicone sheets with the thickness of 200 and 300 μm were used as cathode and anode gaskets, respectively. Finally, a torque of 6 N m was applied to ensure the cell was entirely sealed.
Single cell tests
The DBFC performance was assessed by a fuel cell test station (G20, Greenlight Innovation Corp. Canada). Before measurements, N2 and 1 M KOH aqueous solution were employed to flush the cathode and anode flow fields, respectively. When the testing temperature was stable, the oxygen and anolyte (3 M KOH + 1 M NaBH4) feeds were supplied to the cathode and anode, respectively. The oxygen was supplied with a flow rate of 0.5 NLPM, with an inlet temperature of 80 °C and a relative humidity (RH) of 80%. The anolyte was heated to 80 °C in an oil bath and delivered to the flow field via a peristaltic pump at a flow rate of approximately 5 mL min−1. The cell temperature was maintained at 80 °C using an electronic thermostat.The single cells were initially activated by applying a current density of 500 mA cm−2 until a stable voltage was achieved. The fuel cell polarization curves were acquired by incrementally stepping the current from zero to the maximum test current, with an increment of 300 mA. The maximum test current corresponded to the cell voltage dropping below 0.2 V. Each current density was maintained for 30 seconds.
Computational methods
Calculations of electronic structure were conducted using density functional theory (DFT) as implemented in the Vienna Ab initio Simulation Package (VASP).44 The electron exchange and correlation energy were treated within generalized gradient approximation (GGA), employing Perdew–Burke–Ernzerhof (PBE) functional45 and projector augmented-wave (PAW) pseudopotentials.46 The electronic energies were calculated using 3 × 3 × 1 k-point Monkhorst–Pack mesh. The cut-off energy of the plane wave is set to 520 eV. A vacuum region of 15 Å was set to ensure negligible interactions between the periodically repeated slabs. The Hubbard U values of La, Mn, and Co atoms were 6.0 eV, 4.4 eV, and 5.4 eV, respectively.47 The convergence criteria for electron self-consistent iteration and force are 10−6 eV and −0.02 eV Å−1, respectively.48 For the reasonable calculation of surface and chemisorption systems, the LMCO (001) and MCS (100) surfaces were constructed, and the valence states of Mn and Co were allowed to vary through reasonable position interchange of Mn and Co. For Fe–N–C calculation, a periodic supercell of graphene with a FeN4-coordinated structure was used.The Gibbs free energy is calculated using ΔG = EDFT + ΔZPE − TΔS. Where EDFT represents the electronic energy from DFT calculations, ZPE represents zero-point energy, and T represents the temperature of 300 K. To evaluate the ORR performance, the adsorption energies of adsorbates were calculated using the equation: Eads = Etotal − Eslab – Eadsorbate. In this equation, Eads represents the adsorption energy, Etotal represents the total energy of the system with adsorbate, Eslab represents the energy of the optimized slab, and Eadsorbate represents the energy of the isolated adsorbate in the gas phase.
Physical characterization
The morphology and crystal structure of the catalysts, derived from the prepared electrodes were examined under different microscopy techniques including transmission electron microscope (TEM) and high-angle annular dark field-scanning TEM (HAADF-STEM). The EDS elemental mapping (Thermo Fisher Scientific Super-X EDS, USA) was employed to characterize the chemical composition and distribution. The crystal phases of the electrodes were identified using powder X-ray diffraction (XRD, Rigaku Ultima IV, Japan) with Cu Kα X-rays. X-ray photoelectron spectroscopy (XPS, Thermo Fisher Scientific K-Alpha, USA) data were gathered to examine the transition metal valence and composition of the prepared catalysts. The C 1s peak at 284.8 eV was taken as an internal standard. The Brunauer–Emmett–Teller (BET) specific surface areas and pore size distributions (PSDs) of the catalysts were determined by nitrogen adsorption isotherms at 77 K (Micromeritics ASAP 2460, USA).Results and discussion
To observe the morphology of the catalysts, transmission electron microscope (TEM) images were captured as shown in Fig. 1a–c. The TEM images of the LMCO and MCS electrodes (Fig. 1a and b) exhibit irregularly shaped LaMn0.5Co0.5O3 and MnCo2O4 nanoparticles supported on BP2000 with the average particle size of dozens of nanometres. It is noteworthy that the degree of particle agglomeration is higher in LMCO compared to MCS. This can be attributed to the weak anchoring between the LaMn0.5Co0.5O3 nanoparticles and the carbon support. Fig. S1 and S3† display the HAADF-STEM images and EDS mappings of LMCO and MCS respectively, demonstrating that the transition metals are uniformly distributed within these nanoparticles. This confirms the formation of LaMn0.5Co0.5O3 perovskite and MnCo2O4 cubic spinel. The EDS spectra (Fig. S7 and S9†) reveal characteristic peaks corresponding to Mn and Co with an atomic ratio of about 1.0 for both LMCO and MCS, aligning with the experimental design. Fig. 1c confirms the uniform dispersion of Fe–N–C nanoparticles on the carbon support. Fig. S5† illustrates the well-dispersed and coinciding N and O signals from the Fe–N–C carbon support in the elemental mapping images. Additionally, the Fe element is clearly present as nanoparticles.To confirm the crystal structures of synthesized catalysts, XRD measurements were conducted on the cathode electrodes, as depicted in Fig. 1d. The XRD patterns for LMCO and MCS exhibit reflections that correspond with the characteristic cubic crystalline structure of MnCo2O4 (PDF #84-0482) and LaMn0.5Co0.5O3 perovskite (PDF #48-0123), respectively.49 In contrast, the XRD pattern of Fe–N–C shows no discernible peaks indicative of crystalline metal species, suggesting a predominately amorphous structure. The presence of two broad diffraction peaks within the range of 22–30° and 40–48° suggests that the carbon frameworks are insufficiently crystallized and possess abundant defects.50 The prevalence of such carbon defects may be ascribed to the incorporation of heteroatoms, specifically nitrogen and Fe single atoms, into the carbon lattice, which disrupts its regular structure.
The XPS measurements were performed to identify the electron structure and coordination environment of electrodes (Fig. 1e). The XPS survey spectrum of LMCO and MCS shows a Mn/Co atomic ratio of about 1.0, which is consistent with the homogeneous distribution nature as revealed by the STEM-based element mappings. The high-resolution Mn 2p and Co 2p spectra of LMCO are shown in Fig. S13,† and the high-resolution Mn 2p and Co 2p spectra of MCS are shown in Fig. S15.† The Mn 2p high-resolution spectra (Fig. S13a and S15a†) reveal that the two different peaks centred at 642.2 eV and 653.6 eV corresponded to Mn 2p3/2 and Mn 2p1/2, respectively, and the fitted peaks located at 641.8 and 653.5 eV were attributed to the binding energy of Mn2+, whereas the other two at 643.3 and 654.7 eV were ascribed to the Mn3+ signal. For the high-resolution XPS spectra of Co 2p (Fig. S13b and S15b†), the two strong peaks at 780.8 and 797.2 eV match well with Co 2p3/2 and Co 2p1/2 of the Co3O4 phase, indicating the coexistence of solid-state redox couples of Co3+ and Co2+. In the XPS survey spectrum of Fe–N–C, the peaks for Fe and N are detected with a Fe/N atomic ratio of 4. It is known from the literature that Zn is a metal that tends to evaporate at high temperatures,51 thus there is no Zn chrematistic peak in the XPS survey spectrum. The Fe 2p high-resolution spectrum (Fig. S17a†) can be deconvoluted into four main species, corresponding to the iron redox couple (Fe2+/Fe3+). The N 1s high-resolution spectrum (Fig. S17b†) is fitted with five peaks assigned to pyridinic N (398.1 eV), Fe–Nx (399.0 eV), pyrrolic N (399.6 eV), graphitic N (401.2 eV) and oxidized N (403.0 eV), respectively. The content of different N is summarized in Fig. S17c† with a sequence of graphitic N (33.5%) > pyrrolic N (21.4%) > pyridinic N (17.2%) > Fe–Nx (15.3%) > oxidized N (12.7%).
To elucidate the textural properties of the synthesized catalysts, N2 adsorption/desorption isotherms were measured at 77 K (Fig. 2a). According to the classification by IUPAC, all the isotherms display a characteristic type IV isotherm.52 At a low relative pressure (P/P0 < 0.05), the steep increase in N2 adsorption signifies the presence of a substantial number of micropores. Furthermore, the type H2 hysteresis loop observed in the LMCO and MCS substantiates the existence of mesopores.53 The pore size distribution (PSD) of the synthesized catalysts, as depicted in Fig. 2b, reveals that both LMCO and MCS exhibit a mix of micropores and mesopores. In contrast, the pore size of Fe–N–C is primarily characterized by micropores and small-sized mesopores, with a notably low pore volume of >6 nm. Further details regarding the textural parameters are summarized in Table S1.† The Brunauer–Emmett–Teller (BET) specific surface area of LMCO marginally surpasses that of MCS, despite both catalysts utilizing the same carbon carrier. This discrepancy may be attributed to the high-temperature preparation method employed for LMCO, which could have induced partial pore collapse, thereby diminishing the specific surface area. Conversely, the BET specific surface area of Fe–N–C is considerably lower, measuring only 734 m2 g−1, suggesting that the carbon derived from 2,4-diaminopyridine and Zn(NO3)2–6H2O exhibits a reduced pore volume.
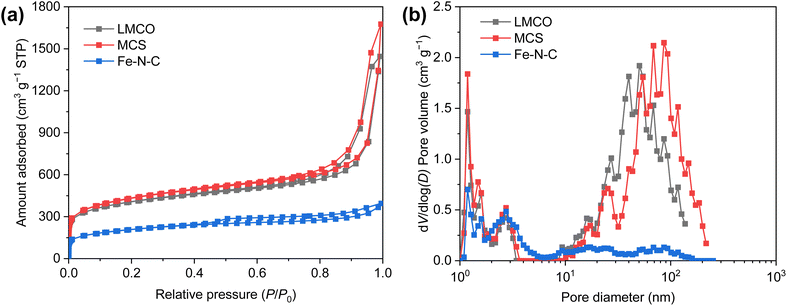 | ||
| Fig. 2 (a) Nitrogen absorption–desorption isotherms and (b) corresponding pore size distribution curves of LMCO, MCS and Fe–N–C. | ||
The ORR activity of the candidate catalysts was initially assessed by linear sweep voltammetry (LSV). The LSV curves of all samples were collected within a potential range of 1.1–0.3 V vs. RHE in an O2-saturated KOH (1.0 M) solution at 1600 rpm and presented in Fig. 3a. The commercial Pt/C demonstrated the highest ORR activity, with a half-wave potential (E1/2) of 0.85 V vs. RHE. The other three non-precious metal catalysts displayed marginally lower half-wave potential (0.81 V vs. RHE for LMCO, 0.83 V vs. RHE for MCS, 0.82 V vs. RHE for Fe–N–C). Overall, all catalysts exhibited commendable ORR activity in the pure KOH solution.
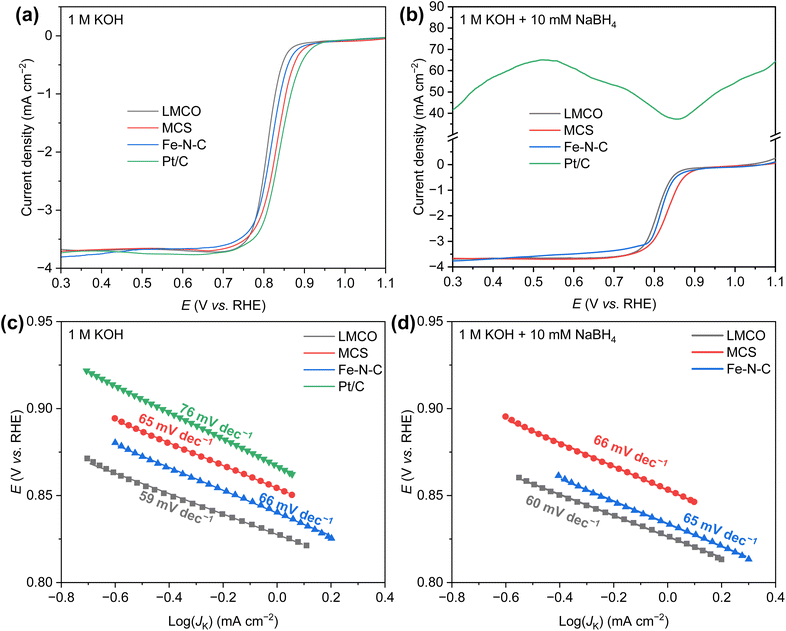 | ||
| Fig. 3 ORR polarization curves of various catalysts in (a) 1 M KOH and (b) 1 M KOH + 10 mM NaBH4; Tafel plots of various catalysts in (c) 1 M KOH and (d) 1 M KOH + 10 mM NaBH4. | ||
However, in AEM based single cell environment, borohydride can readily permeate from anode to cathode through membrane. Therefore, evaluating the ORR activity in the presence of borohydride is of paramount importance. To this end, 10 mM NaBH4 was added to the pure KOH solution, maintaining all other environmental conditions and operating methods unchanged. Resulting LSV curves are illustrated in Fig. 3b. In the presence of NaBH4, the LSV curve of the commercial Pt/C deviated from the typical ORR LSV curve, generating a significantly higher positive current, which can be attributed to borohydride oxidation. Under this condition, a catalyst with high BOR activity is not suitable as a cathode catalyst for DBFCs. In contrast, the other three non-precious metal catalysts demonstrated commendable resistance to borohydride. Notably, the current density of Fe–N–C within the potential range of 0.3–0.8 V vs. RHE exhibited a slight decrease, possibly due to the blockage of the catalyst's predominant micropores by the hydrogen produced from the hydrolysis of borohydride. This blockage could hinder the transport of a minimal amount of oxygen. Both MCS and LMCO, however, displayed superior borohydride tolerance, indicating their potential as promising DBFC cathode catalysts.
The Tafel slope, as depicted in Fig. 3c and d, indicates the kinetics and activity of the catalyst for ORR. It provides an estimation of the rate-determining step in the electrochemical reaction. Shallower slopes represent higher current densities achieved at lower overpotentials. In a 1.0 M KOH solution, the Tafel slope for commercial Pt/C is 76 mV dec−1, which aligns well with previous studies.54 It is noteworthy that the three non-precious metal catalysts exhibit comparable Tafel slopes, yielding values of 59, 65, and 66 mV dec−1 for LMCO, MCS, and Fe–N–C, respectively, suggesting faster reaction kinetics in comparison to Pt/C catalyst. In the alkaline solution containing NaBH4, the Tafel slopes of these three non-precious metal catalysts remain virtually unchanged, demonstrating their robust tolerance to borohydride. In contrast, the Pt/C catalyst appears to preferentially facilitate the borohydride oxidation. Consequently, the Pt/C catalyst is not deemed suitable as a promising cathode catalyst for DBFCs.
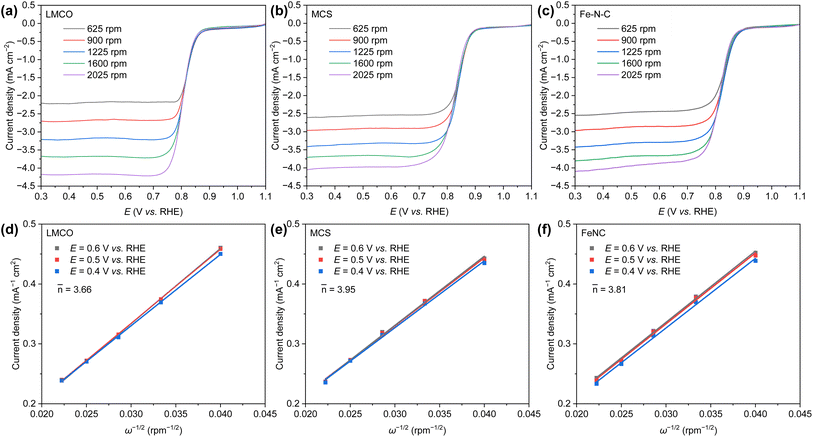
The kinetic activity, as determined by the Koutecky–Levich (K–L) method (Fig. 4a–c), demonstrates that the current density of LMCO, MCS, and Fe–N–C proportionally escalates with the rotation rate at varying applied potentials. This results in linearly fitted K–L plots (Fig. 4d–f). The number of electrons (![[n with combining macron]](https://www.rsc.org/images/entities/i_char_006e_0304.gif) ) transferred at different potentials during the electroreduction of oxygen, as inferred from the corresponding K–L plots, are calculated to be 3.66, 3.95, and 3.81 for LMCO, MCS, and Fe–N–C, respectively. Regardless of the potential pertinent to ORR, the electrochemical oxygen reduction on MCS proceeds via the four-electron pathway. This can be attributed to the fact that the metal precursors of MCS can be loaded onto the carbon support and MCS is prepared via a low-temperature hydrothermal method. Consequently, the transition-metal nanoparticles can be effectively anchored on carbon supports. Conversely, LMCO and Fe–N–C are prepared under high-temperature conditions, and the precursors are not well loaded onto the carbon support. This leads to a lack of strong interactions between transition-metal nanoparticles and the carbon support, which in turn results in inferior ORR activity.
) transferred at different potentials during the electroreduction of oxygen, as inferred from the corresponding K–L plots, are calculated to be 3.66, 3.95, and 3.81 for LMCO, MCS, and Fe–N–C, respectively. Regardless of the potential pertinent to ORR, the electrochemical oxygen reduction on MCS proceeds via the four-electron pathway. This can be attributed to the fact that the metal precursors of MCS can be loaded onto the carbon support and MCS is prepared via a low-temperature hydrothermal method. Consequently, the transition-metal nanoparticles can be effectively anchored on carbon supports. Conversely, LMCO and Fe–N–C are prepared under high-temperature conditions, and the precursors are not well loaded onto the carbon support. This leads to a lack of strong interactions between transition-metal nanoparticles and the carbon support, which in turn results in inferior ORR activity.
The durability of the electrocatalysts has been evaluated through accelerated durability tests (ADT) employing cyclic voltammetry (CV) within the potential range 0.6–1.1 V vs. RHE in an O2 saturated 1.0 M KOH + 10 mM NaBH4 solution. The tests were conducted at a scan rate of 20 mV s−1 for 10k cycles. Fig. 5 presents the LSV curves of the three candidate catalysts obtained before and after ADT. The limiting current density of LMCO after ADT decreased from −3.65 mA cm−2 to −3.35 mA cm−2 (Fig. 5a), a decrease that could potentially be attributed to the agglomeration of transition-metal or detachment from the support material surface. Conversely, MCS demonstrated no significant change in the LSV curve, with E1/2 reduced by a mere 10 mV and the limiting current remaining steady −3.75 mA cm−2, thereby indicating superior durability (Fig. 5b). In the case of Fe–N–C, it appears that the catalyst encountered challenges with oxygen mass transfer, likely due to the leaching of Fe species55 and the obstruction of micropores by hydrogen (Fig. 5c).
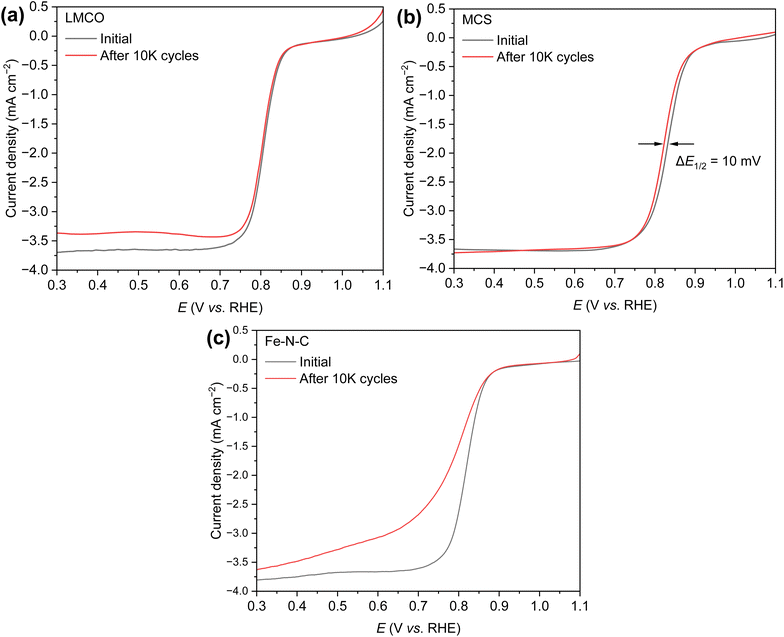 | ||
| Fig. 5 ORR polarization curves of (a) LMCO, (b) MCS, and (c) Fe–N–C before and after 10k ADT cycles in O2-saturated 1 M KOH + 10 mM NaBH4 solution at 25 °C and 1600 rpm. | ||
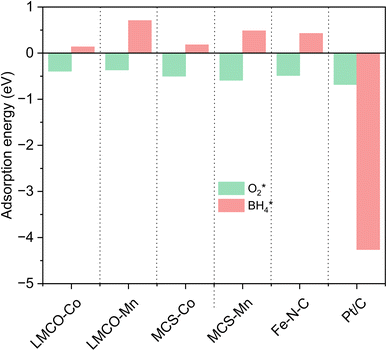
Concerns regarding borohydride crossover in DBFCs extend beyond the mere loss of fuel due to the permeation of the membrane from anode to cathode, which reduces fuel utilization. The issue is further compounded by the adsorption of borohydride species onto the catalytically active sites, causing a significant decline in cathodic performance and impeding oxygen adsorption. To comprehensively investigate the relative significance of borohydride and oxygen molecule adsorption on the catalytic activity of ORR, we conducted density functional theory (DFT) calculations. Fig. 6 summarizes the theoretical calculations of adsorption energies associated with the different molecules on various active sites (the optimized structures are shown in Fig. S20†). The data demonstrates that Pt/C tends to adsorb  over
over  , with the adsorption energy of
  on the Pt surface being considerably more negative compared to that of
  . This finding elucidates why, in an O2-saturated alkaline solution containing NaBH4, the LSV curve of Pt/C displays a significant positive current in comparison to the other three non-precious metal catalysts. For these non-precious metals, despite their ORR activity being lower than that of Pt/C in the absence of borohydride, they still exhibit a preference for oxygen molecule adsorption when borohydride is present, further facilitating the reduction of O2 molecules.
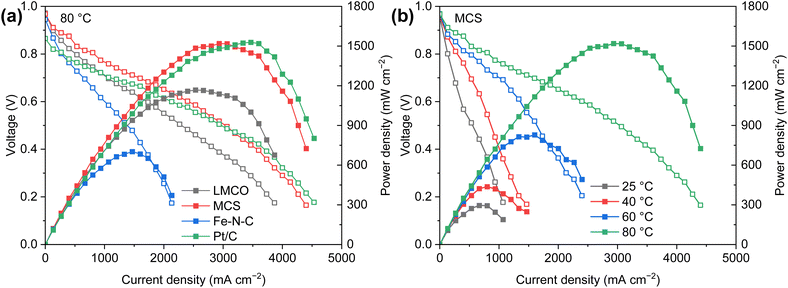
Fig. 7a presents the polarization curves of AEM-based DBFCs with varying cathodes (1.5 mgcatalyst cm−2) and Pt/C (0.15 mgPt cm−2) anodes. While maintaining a steady cell temperature of 80 °C, both commercial Pt/C and MCS cathodes exhibit comparable peak power densities of approximately 1.5 W cm−2. This is markedly superior to the performance of LMCO and Fe–N–C. The high power density of the Pt/C cathode can be ascribed to its exceptional ORR activity. Meanwhile, the superior performance of the MCS cathode is a consequence of the efficient anchoring of nanoparticles to the carbon support coupled with the robust borohydride resistance of Mn and Co. Such a high power output is outstanding compared with previous studies of DBFCs, as displayed in Table S2.† The relatively inferior cell performance of LMCO and Fe–N–C is primarily attributable to their preparation methods, which involve high-temperature processes and less comprehensive precursor mixing in comparison to MCS. In these methods, the carbon support is not as thoroughly mixed with the metal precursors. Moreover, the Fe–N–C catalyst's low specific surface area, along with the dominance of micropores and small-sized mesopores, impedes the release of hydrogen generated by borohydride hydrolysis, thereby obstructing the diffusion of O2. Fig. 7b further illustrates the temperature sensitivity of the DBFC employing an MCS cathode. The peak power density of the single cell exhibits an upward trend as the temperature rises. This temperature escalation enhances the diffusion and mass transfer coefficients of reactants, in addition to accelerating the kinetics of borohydride oxidation and oxygen reduction.
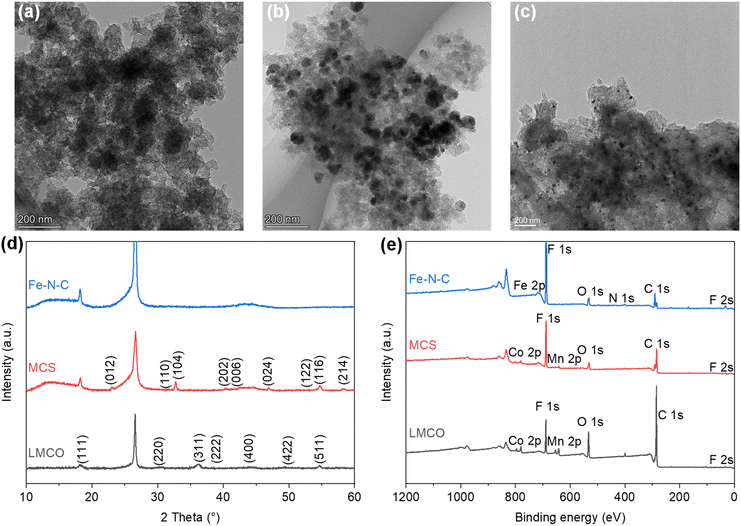
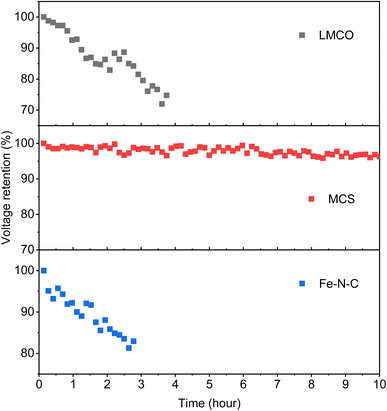
Furthermore, as illustrated in Fig. 8, the voltages of the DBFCs utilizing three non-precious metal cathodes were evaluated in relation to the operation time, under a consistent current of 500 mA cm−2, to validate the durability of the catalysts. MCS showed a negligible loss of 3.4% in voltage after 10 hours of the durability test, indicating its commendable stability. Contrastingly, both LMCO and Fe–N–C showcased inferior stability, characterized by a more rapid voltage decay over time, with the operation time only being able to sustain for 3–4 hours. To interpret these findings, we performed TEM, XRD, and XPS analyses on the electrodes after the stability assessment. The TEM micrographs reveal that MCS (Fig. 9b) maintains a high degree of consistency before and after the stability test. In contrast, both LMCO (Fig. 9a) and Fe–N–C (Fig. 9c) exhibit significant agglomeration, coupled with a discernible detachment of a portion of the nanoparticles from the carbon support. The EDS mappings of LMCO (Fig. S2 and S8†) and Fe–N–C (Fig. S6 and S12†) disclose a considerable reduction in the distribution of transition metal elements on carbon support, corresponding with the detachment of nanoparticles. Moreover, the EDS mapping of MCS (Fig. S4 and S10†) demonstrates a Mn/Co atomic ratio of 1.0, consistent with its initiate state. Additionally, The XRD patterns illustrate the well-preserved crystalline structure of LMCO and MCS, whereas Fe–N–C continues to exhibit an amorphous structure, devoid of any discernible peaks corresponding to crystalline Fe species. After the stability test, it was observed that only faint signals attributable to Mn and Co can be detected by XPS from the surface of LMCO (Fig. 9e and S14†). This phenomenon is a consequence of the surface being occluded by K/Na salt depositions and the concomitant detachment of the nanoparticles from the carbon support. MCS exhibits a Mn/Co atomic ratio of approximately 1.0, corroborating with the EDS result (Fig. S15†). According to the high-resolution spectra of Mn 2p and Co 2p, there is a marginal decrement in atomic ratios of Mn3+/Mn2+ and Co3+/Co2+, which could likely be attributed to the reducing characteristic inherent to borohydride (Fig. S16†). Fe–N–C mainly shows the alteration in the N 1s spectrum after the durability test (Fig. S18†). The high-resolution N 1s spectrum reveals a notable reduction in graphitic N with an increase of pyrrolic N and Fe–Nx. This observation suggests the detachment of highly graphitized BP2000.56
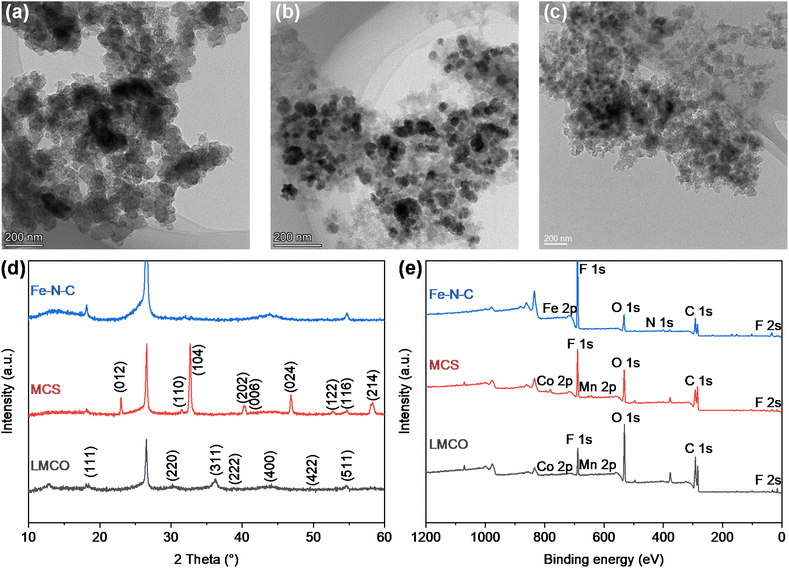 | ||
| Fig. 9 TEM images of (a) LMCO, (b) MCS, and (c) Fe–N–C, (d) XRD patterns, and (e) XPS survey spectra after durability tests. | ||
Conclusions
In this investigation, an extensive study was performed on three prevalent non-precious metal catalysts for ORR: LaMn0.5Co0.5O3 (LMCO) perovskite, MnCo2O4 (MCS) spinel, and Fe–N–C, to assess their potential application in DBFCs as cathode catalysts. Their morphology, phase identification, and surface elemental state analyses were initially analysed by TEM, XRD, and XPS, confirming that the synthesized carbon-supported catalysts were consistent with our experimental design. RDE tests showed all three catalysts had slightly lower ORR activity than commercial Pt/C in a pure alkaline solution. However, in borohydride-containing electrolytes, Pt/C showed significant oxidation currents, while LMCO and MCS had high borohydride tolerance. After durability tests, the half-wave potential of MCS only decreased by 10 mV after 10k cycles, while LMCO and Fe–N–C showed a noticeable reduction in current density. DFT calculations also indicated that these three non-precious metal catalysts preferentially adsorb in the presence of both
  and
and  , while Pt/C favours catalysing the electro-oxidation of borohydride.
When employed in DBFCs, MCS and Pt/C reached comparable peak power density of approximately 1.5 W cm−2, whereas the peak power densities of LMCO and Fe–N–C were significantly lower. Moreover, MCS demonstrated superior stability compared to LMCO and Fe–N–C after durability tests. After the durability tests, the TEM, XRD and XPS characterizations on the electrodes revealed that the perovskite and M–N–C catalysts suffered from weakened anchoring between metal nanoparticles and carbon supports due to the requisite high-temperature calcination during preparation, making metal nanoparticles more prone to agglomeration. Consequently, MCS displayed the best performance among all evaluated catalysts and emerged as the most promising candidate for DBFC cathode.
Author contributions
Yu Guo: data curation, investigation, methodology, visualization, writing – original draft. Yingjian Cao: validation. Qinggang Tan: writing – review & editing. Daijun Yang: writing – review & editing. Yong Che: supervision. Cunman Zhang: project administration. Pingwen Ming: project administration. Qiangfeng Xiao: conceptualization, supervision, funding acquisition, writing – review & editing.Conflicts of interest
There are no conflicts to declare.Acknowledgements
We are greatly thankful for the financial support from the Foundation of China (Grants 52073215).Notes and references
- D. van Vuuren, N. Nakicenovic, K. Riahi, A. Brew-Hammond, D. Kammen, V. Modi, M. Nilsson and K. Smith, Curr. Opin. Environ. Sustain., 2012, 4, 18–34 CrossRef.
- R. Dahlberg, Int. J. Hydrogen Energy, 1982, 7, 121–142 CrossRef CAS.
- W. Zhang, X. Fang and C. Sun, J. Environ. Manage., 2023, 341, 118019 CrossRef CAS PubMed.
- R. B. Moore and V. Raman, Int. J. Hydrogen Energy, 1998, 23, 617–620 CrossRef CAS.
- B. E. Lebrouhi, J. J. Djoupo, B. Lamrani, K. Benabdelaziz and T. Kousksou, Int. J. Hydrogen Energy, 2022, 47, 7016–7048 CrossRef CAS.
- M. Genovese and P. Fragiacomo, J. Energy Storage, 2023, 61, 106758 CrossRef.
- G. L. Soloveichik, Beilstein J. Nanotechnol., 2014, 5, 1399–1418 CrossRef PubMed.
- U. B. Demirci, J. Power Sources, 2007, 169, 239–246 CrossRef CAS.
- N. Shaari, S. K. Kamarudin, R. Bahru, S. H. Osman and N. A. I. Md Ishak, Int. J. Energy Res., 2021, 45, 6644–6688 CrossRef CAS.
- J. Chang, G. Wang, W. Zhang and Y. Yang, J. Energy Chem., 2022, 68, 439–453 CrossRef CAS.
- U. B. Demirci, Environ. Int., 2009, 35, 626–631 CrossRef CAS PubMed.
- D. M. F. Santos and C. A. C. Sequeira, Renewable Sustainable Energy Rev., 2011, 15, 3980–4001 CrossRef CAS.
- L. Liu, J. Zhang, Y. Zhao, M. Zhang, L. Wu, P. Yang and Z. Liu, Chem. Commun., 2024, 60, 1965–1978 RSC.
- D. M. F. Santos and C. A. C. Sequeira, J. Electrochem. Soc., 2011, 159, B126–B132 CrossRef.
- N. A. M. Harun and N. Shaari, Int. J. Energy Res., 2022, 46, 17873–17898 CrossRef CAS.
- R. Jamard, J. Salomon, A. Martinent-Beaumont and C. Coutanceau, J. Power Sources, 2009, 193, 779–787 CrossRef CAS.
- R. G. Akay, K. C. Ata, T. Kadıoğlu and C. Çelik, Int. J. Hydrogen Energy, 2018, 43, 18702–18711 CrossRef CAS.
- B. H. Liu and S. Suda, J. Power Sources, 2007, 164, 100–104 CrossRef CAS.
- J. Jia, X. Li, H. Qin, Y. He, H. Ni and H. Chi, J. Alloys Compd., 2020, 820, 153065 CrossRef CAS.
- B. Šljukić, D. M. F. Santos and C. A. C. Sequeira, J. Electroanal. Chem., 2013, 694, 77–83 CrossRef.
- X. Yang, Y. Liu, S. Li, X. Wei, L. Wang and Y. Chen, Sci. Rep., 2012, 2, 567 CrossRef PubMed.
- C. Grimmer, R. Zacharias, M. Grandi, B. Cermenek, A. Schenk, S. Weinberger, F.-A. Mautner, B. Bitschnau and V. Hacker, J. Phys. Chem. C, 2015, 119, 23839–23844 CrossRef CAS.
- D. M. F. Santos, T. F. B. Gomes, B. Sljukic, N. Sousa, C. A. C. Sequeira and F. M. L. Figueiredo, Electrochim. Acta, 2015, 178, 163–170 CrossRef CAS.
- Y. Liu, J. Ma, J. Lai and Y. Liu, J. Alloys Compd., 2009, 488, 204–207 CrossRef CAS.
- Y. Duan, S. Li, Q. Tan, Y. Chen, K. Zou, X. Dai, M. Bayati, B. B. Xu, L. Dala and T. X. Liu, Int. J. Hydrogen Energy, 2021, 46, 15471–15481 CrossRef CAS.
- Y. Ko, J. Park, X. Zhang, L. Kang, T. H. M. Pham, V. Boureau, C. Pham-Huu, J. Kim, L. Zhong and A. Züttel, ACS Appl. Energy Mater., 2024, 7, 639–648 CrossRef CAS.
- R. Sgarbi, E. A. Ticianelli, F. Maillard, F. Jaouen and M. Chatenet, Electrocatalysis, 2020, 11, 365–373 CrossRef CAS.
- M. Chatenet, F. Micoud, I. Roche, E. Chainet and J. Vondrák, Electrochim. Acta, 2006, 51, 5452–5458 CrossRef CAS.
- C. Grimmer, M. Grandi, R. Zacharias, S. Weinberger, A. Schenk, E. Aksamija, F.-A. Mautner, B. Bitschnau and V. Hacker, J. Electrochem. Soc., 2016, 163, F885 CrossRef CAS.
- L. Zhang, L. Mei, K. Wang, Y. Lv, S. Zhang, Y. Lian, X. Liu, Z. Ma, G. Xiao, Q. Liu, S. Zhai, S. Zhang, G. Liu, L. Yuan, B. Guo, Z. Chen, K. Wei, A. Liu, S. Yue, G. Niu, X. Pan, J. Sun, Y. Hua, W.-Q. Wu, D. Di, B. Zhao, J. Tian, Z. Wang, Y. Yang, L. Chu, M. Yuan, H. Zeng, H.-L. Yip, K. Yan, W. Xu, L. Zhu, W. Zhang, G. Xing, F. Gao and L. Ding, Nano-Micro Lett., 2023, 15, 177 CrossRef PubMed.
- X. Han, T. Zhang, J. Du, F. Cheng and J. Chen, Chem. Sci., 2013, 4, 368–376 RSC.
- J. Du, T. Zhang, F. Cheng, W. Chu, Z. Wu and J. Chen, Inorg. Chem., 2014, 53, 9106–9114 CrossRef CAS PubMed.
- S. Kang, S. Li, X. Xiao, Z. Zhang, Y. Shi, M. Zhao and Y. Wang, Nanotechnology, 2022, 33, 455705 CrossRef CAS PubMed.
- P. Tan, Z. Wu, B. Chen, H. Xu, W. Cai, S. Jin, Z. Shao and M. Ni, J. Electrochem. Soc., 2019, 166, A3448–A3455 CrossRef CAS.
- C. Wei, Z. Feng, G. G. Scherer, J. Barber, Y. Shao-Horn and Z. J. Xu, Adv. Mater., 2017, 29, 1606800 CrossRef PubMed.
- V. Kumar, C. R. Mariappan, R. Azmi, D. Moock, S. Indris, M. Bruns, H. Ehrenberg and G. Vijaya Prakash, ACS Omega, 2017, 2, 6003–6013 CrossRef CAS PubMed.
- M. Harada, F. Kotegawa and M. Kuwa, ACS Appl. Energy Mater., 2022, 5, 278–294 CrossRef CAS.
- Y. Liang, H. Wang, J. Zhou, Y. Li, J. Wang, T. Regier and H. Dai, J. Am. Chem. Soc., 2012, 134, 3517–3523 CrossRef CAS PubMed.
- C. Wei, Z. Feng, G. G. Scherer, J. Barber, Y. Shao-Horn and Z. J. Xu, Adv. Mater., 2017, 29, 1606800 CrossRef PubMed.
- Y. Yang, Y. Wang, Y. Xiong, X. Huang, L. Shen, R. Huang, H. Wang, J. P. Pastore, S.-H. Yu, L. Xiao, J. D. Brock, L. Zhuang and H. D. Abruña, J. Am. Chem. Soc., 2019, 141, 1463–1466 CrossRef CAS PubMed.
- Y. Wang, Y. Yang, S. Jia, X. Wang, K. Lyu, Y. Peng, H. Zheng, X. Wei, H. Ren, L. Xiao, J. Wang, D. A. Muller, H. D. Abruña, B. J. Hwang, J. Lu and L. Zhuang, Nat. Commun., 2019, 10, 1506 CrossRef PubMed.
- P. Yin, T. Yao, Y. Wu, L. Zheng, Y. Lin, W. Liu, H. Ju, J. Zhu, X. Hong, Z. Deng, G. Zhou, S. Wei and Y. Li, Angew. Chem., Int. Ed., 2016, 55, 10800–10805 CrossRef CAS PubMed.
- G. Zhang, Q. Wei, X. Yang, A. C. Tavares and S. Sun, Appl. Catal., B, 2017, 206, 115–126 CrossRef CAS.
- G. Kresse and J. Hafner, Phys. Rev. B: Condens. Matter Mater. Phys., 1993, 47, 558–561 CrossRef CAS PubMed.
- J. P. Perdew, J. A. Chevary, S. H. Vosko, K. A. Jackson, M. R. Pederson, D. J. Singh and C. Fiolhais, Phys. Rev. B: Condens. Matter Mater. Phys., 1992, 46, 6671–6687 CrossRef CAS PubMed.
- P. E. Blöchl, Phys. Rev. B: Condens. Matter Mater. Phys., 1994, 50, 17953–17979 CrossRef PubMed.
- V. I. Anisimov, J. Zaanen and O. K. Andersen, Phys. Rev. B: Condens. Matter Mater. Phys., 1991, 44, 943–954 CrossRef CAS PubMed.
- G. Kresse and J. Furthmüller, Phys. Rev. B: Condens. Matter Mater. Phys., 1996, 54, 11169–11186 CrossRef CAS PubMed.
- J. Sun, L. Du, B. Sun, G. Han, Y. Ma, J. Wang, H. Huo, P. Zuo, C. Du and G. Yin, J. Energy Chem., 2021, 54, 217–224 CrossRef CAS.
- S. Gao, G. Wang, L. Guo and S. Yu, Small, 2020, 16, 1906668 CrossRef CAS PubMed.
- H. Xu, D. Wang, P. Yang, L. Du, X. Lu, R. Li, L. Liu, J. Zhang and M. An, Appl. Catal., B, 2022, 305, 121040 CrossRef CAS.
- S. Wang, Y. Li, S. Dai and D. Jiang, Angew. Chem., Int. Ed., 2020, 59, 19645–19648 CrossRef CAS PubMed.
- M. Z. Hossain, M. R. Karim, S. Sutradhar, M. B. I. Chowdhury and P. A. Charpentier, Int. J. Hydrogen Energy, 2023, 48, 39791–39804 CrossRef CAS.
- G. Kumar, S. K. Das, C. Nayak and R. S. Dey, Small, 2024, 20, 2307110 CrossRef CAS PubMed.
- Y.-P. Ku, K. Ehelebe, A. Hutzler, M. Bierling, T. Böhm, A. Zitolo, M. Vorokhta, N. Bibent, F. D. Speck, D. Seeberger, I. Khalakhan, K. J. J. Mayrhofer, S. Thiele, F. Jaouen and S. Cherevko, J. Am. Chem. Soc., 2022, 144, 9753–9763 CrossRef CAS PubMed.
- S. Muthusamy, A. Sabbah, P. Sabhapathy, Y. Chang, T. Billo, Z. Syum, L. Chen and K. Chen, ChemElectroChem, 2023, 10, e202300272 CrossRef CAS.
Footnote |
| † Electronic supplementary information (ESI) available. See DOI: https://doi.org/10.1039/d4ra02767a |
| This journal is © The Royal Society of Chemistry 2024 |

