DOI:
10.1039/D4RA02984D
(Paper)
RSC Adv., 2024,
14, 17413-17433
Design of a new palladium(II) halide complex as a bio-active material: synthesis, physico-chemical studies, DFT-computations and evaluation of anti-inflammatory, antioxidant and anti-gastric damage activities†
Received
22nd April 2024
, Accepted 18th May 2024
First published on 30th May 2024
Abstract
Colorless single crystals of the zero-dimensional hybrid compound, (C6H10N2)2[PdCl6]·2H2O were acquired through the slow evaporation technique. The crystal structure was explored using SC-XRD, which demonstrates that the material crystallizes in the centrosymmetric space group P![[1 with combining macron]](https://www.rsc.org/images/entities/char_0031_0304.gif) of the triclinic system. The density functional theory method at the B3LYP/Lan2mb basis set level was employed to establish the optimized geometry and vibrational frequencies of the title compound. An acceptable correspondence was observed between the results obtained through calculation and the experimental data, including the structure, and IR spectra. The optical characteristics revealed a direct band gap energy of 2.35 eV, validating the semiconductor characteristics of this new material. The results suggest strong agreement with the experimental data and validate the involvement of metal orbitals in defining the HOMO–LUMO boundary. Simultaneous TGA-DTA shows that this material remains solid up to 210 °C. Beyond these temperatures, a gradual decomposition process occurs, extending up to 440 °C and unfolding in several steps. This process entails the liberation of diverse compounds, encompassing organic molecules, and the evaporation of chlorine ions, ultimately leading to the formation of palladium oxide (PdO) as the final product. When given to rats with gastric ulcers at a dose of 100 mg kg−1, these compounds inhibit the key enzyme responsible for neutrophil infiltration as myeloperoxidase (MPO) by 38.7%. The compound also alleviates cellular damage induced by free radicals, demonstrated by a notable 48.3% decrease in thiobarbituric acid reactive substance rates (TBARS) compared to untreated rats. Additionally, these compounds bring about a substantial 30.6% reduction in the surface area of ulcers.
of the triclinic system. The density functional theory method at the B3LYP/Lan2mb basis set level was employed to establish the optimized geometry and vibrational frequencies of the title compound. An acceptable correspondence was observed between the results obtained through calculation and the experimental data, including the structure, and IR spectra. The optical characteristics revealed a direct band gap energy of 2.35 eV, validating the semiconductor characteristics of this new material. The results suggest strong agreement with the experimental data and validate the involvement of metal orbitals in defining the HOMO–LUMO boundary. Simultaneous TGA-DTA shows that this material remains solid up to 210 °C. Beyond these temperatures, a gradual decomposition process occurs, extending up to 440 °C and unfolding in several steps. This process entails the liberation of diverse compounds, encompassing organic molecules, and the evaporation of chlorine ions, ultimately leading to the formation of palladium oxide (PdO) as the final product. When given to rats with gastric ulcers at a dose of 100 mg kg−1, these compounds inhibit the key enzyme responsible for neutrophil infiltration as myeloperoxidase (MPO) by 38.7%. The compound also alleviates cellular damage induced by free radicals, demonstrated by a notable 48.3% decrease in thiobarbituric acid reactive substance rates (TBARS) compared to untreated rats. Additionally, these compounds bring about a substantial 30.6% reduction in the surface area of ulcers.
1 Introduction
Hybrid systems stand out due to their compelling characteristics, which stem from the amalgamation of exceptional traits found in both organic and inorganic molecules. This unique blend has sparked considerable scientific interest, making hybrid systems a prominent area of research that captivates researchers worldwide. Taking applications one step further, hybrid materials cover a wide range of fields, including sensors,1,2 magnetic,3–5 optical (nonlinear optics),6,7 electroluminescence,8 ionic,9 and medical9–11 fields. In the literature, many organic molecules are utilized as templates for metal halides. However, several studies have identified 3-(aminomethyl)pyridine (3-Amp) as a liquid with an evident yellowish color, which serves as a crucial amine in the pharmaceutical sector.12,13
The palladium has been combined with 3-AMP to produce a new hybrid compound that merges inorganic and organic elements. Typically, the inorganic lattice is formed by layers of octahedra (MX6) or tetrahedra (MX4) along with organic cations, which can be linear or aromatic. The interaction between these components results in the creation of a supramolecular network characterized as a pseudo-zero-dimensional structure, largely facilitated by noncovalent interactions. These complexes are generally stabilized by hydrogen bonds and low-energy van der Waals forces. In this study, we present the crystal structure, as well as analyses including Infrared spectroscopy (IR), Raman spectroscopy, optical absorption, and photoluminescence measurements. Additionally, we conduct Hirshfeld surface (HS) analysis, cyclic voltammetry, and thermal analysis of the compound. Furthermore, we compare our experimental findings with density functional theory (DFT) calculations.
Inflammation has a major role in pathological complications such cancer, metabolic, cardiovascular, rheumatic, and arthritic conditions. Various analgesic and anti-inflammatory drugs could be used therapeutically to treat the diseases linked to inflammation.14–16 Corticosteroids and non-steroidal anti-inflammatory medicines (NSAIDs) are currently being used clinically to treat inflammatory illnesses. However, long-term usage of corticosteroids is linked to osteoporosis, weight gain, and an immunosuppressive effect; chronic high-dose NSAID intakes are often linked to GIT toxicity.17 Therefore, finding and creating alternative anti-inflammatory drugs from other sources that are more effective and tolerable at this point is difficult for researchers. Numerous anti-inflammatory and analgesic effects of the compounds containing palladium thiocarbamate in their structure have been outlined.14–18 According to reports, the dithiocarbamates show promise in preventing nitrative stress, cytokine production, and oxidative stress.19 In light of the discovery mentioned above, we therefore decided to investigate the newly produced new palladium(II) halide complex for possible therapeutic effects, including anti-inflammatory and antioxidant properties in gastric tissues.
2 Experimental details
2.1. Synthesis of the crystal sample
The organic–inorganic compound was prepared by mixing, in stoichiometric proportions [2![[thin space (1/6-em)]](https://www.rsc.org/images/entities/char_2009.gif) :
:![[thin space (1/6-em)]](https://www.rsc.org/images/entities/char_2009.gif) 1], a solution of 3-(aminomethyl)pyridine (C6H8N2) (2 mmol) and a solution of palladium chloride [PdCl2] (1 mmol) previously dissolved in 10 ml of distilled water with a small amount of hydrochloric acid present. The blend was stirred magnetically for 10 minutes at room temperature, leading to the creation of homogeneous solutions. The reaction sequence for the synthesis is shown in the following schema (Scheme 1).
1], a solution of 3-(aminomethyl)pyridine (C6H8N2) (2 mmol) and a solution of palladium chloride [PdCl2] (1 mmol) previously dissolved in 10 ml of distilled water with a small amount of hydrochloric acid present. The blend was stirred magnetically for 10 minutes at room temperature, leading to the creation of homogeneous solutions. The reaction sequence for the synthesis is shown in the following schema (Scheme 1).
 |
| | Scheme 1 Synthesis of complex (C6H10N2) [PdCl6]·2H2O. | |
The resulting block and colorless crystals of (C6H10N2)[PdCl6]·2H2O were acquired following several days of gradual evaporation of the mixture at room temperature. The crystals underwent washing with ether, meticulous filtration, and air-drying for a day before being gathered for subsequent physical and chemical analyses.
2.2. X-ray data collection
A solitary colorless crystal block of specified dimensions of 0.35 × 0.34 × 0.16 mm3 was carefully selected for data collection using Xcalibur, Atlas, Gemini ultra diffractometer employing fine-focus sealed X-ray tube, enhance (Mo) X-ray source, to gather all reflections at room temperature. The angular range between 3.4° < θ < 29.3° gives the following values as bounds of the Miller indices (h, k, l) of the measured reflections h = −10 → 10, k = −10 → 10, l = −13 → 13. 13![[thin space (1/6-em)]](https://www.rsc.org/images/entities/char_2009.gif) 853 reflections were recorded, of which 2682 independent reflections, 2179 having intensity I > 2σ(I). The different structural parameters: atomic positions, isotropic (Uiso) or anisotropic (Uaniso) displacement parameters, and statistical occupancy of crystallographic sites, the refinement of these parameters utilized the least squares method applied to the square of the modulus of the structure factors |F2|. The structure was solved with SHELXS-97 (ref. 20) and refined using SHELXL-97(ref. 21) all of which were used with the WINGX software.22 The hydrogen atom positions of the protonated amine [C6H10N2]2+ were fixed geometrically using the HFIX option included in SHELXL-97.21 The molecular structure drawing was constructed using Diamond 3.2.23 The final values of the unweighted and weighted reliability factors are R1 = 0.056 and wR2 = 0.159 respectively. The recording conditions and refinement results are summarized in Table 1 and 2 summarizes the atomic coordinates, equivalent thermal stirring factors (Ueq.) of the compound, and the equivalent thermal stirring factors and anisotropy are given in Table 3.
853 reflections were recorded, of which 2682 independent reflections, 2179 having intensity I > 2σ(I). The different structural parameters: atomic positions, isotropic (Uiso) or anisotropic (Uaniso) displacement parameters, and statistical occupancy of crystallographic sites, the refinement of these parameters utilized the least squares method applied to the square of the modulus of the structure factors |F2|. The structure was solved with SHELXS-97 (ref. 20) and refined using SHELXL-97(ref. 21) all of which were used with the WINGX software.22 The hydrogen atom positions of the protonated amine [C6H10N2]2+ were fixed geometrically using the HFIX option included in SHELXL-97.21 The molecular structure drawing was constructed using Diamond 3.2.23 The final values of the unweighted and weighted reliability factors are R1 = 0.056 and wR2 = 0.159 respectively. The recording conditions and refinement results are summarized in Table 1 and 2 summarizes the atomic coordinates, equivalent thermal stirring factors (Ueq.) of the compound, and the equivalent thermal stirring factors and anisotropy are given in Table 3.
Table 1 Crystal data and structure refinement parameters for (C6H10N2)2[PdCl6]·2H2O
| R1 = ∑|Fo| − |Fc|/∑|Fo|. wR2 = [∑w(Fo2 − Fc2)2/∑w(Fo2)2]1/2. |
| Empirical formula |
C12H24Cl6PdN4O2 |
| Formula weight (g mol−1) |
575.45 |
| Temperature (K) |
150 |
| Crystal system |
Triclinic |
| Space group |
P![[1 with combining macron]](https://www.rsc.org/images/entities/char_0031_0304.gif) |
| a (Å) |
7.720(8) |
| b (Å) |
7.794(8) |
| c (Å) |
9.597(9) |
| α (°) |
81.799(8) |
| β (°) |
83.134(8) |
| γ (°) |
66.739(10) |
| V (Å3) |
523.91(10) |
| Z |
1 |
| Dx (mg m−3) |
1.824 |
| μ (mm−1) |
1.67 |
| Crystal size (mm3) |
0.35 × 0.34 × 0.16 |
| Crystal color/shape |
Block, colourless |
| hkl range |
−10 ≤ h ≤ 10; −10 ≤ k ≤ 10; −13 ≤ l ≤ 13 |
| θ (°) |
2.9–29.5 |
| Diffractometer |
Xcalibur, Atlas, Gemini ultra diffractometer |
| R1a, wR2b [I > 2(I)] |
0.056, 0.159 |
| GooF on F2 |
1.19 |
| Δρmax (e Å−3) |
1.71 |
| Δρmin (e Å−3) |
−1.69 |
Table 2 Experimental and optimized molecular geometric parameters of (C6H10N2)2[PdCl6]·2H2O
| Geometric parameters |
Calculated |
XRD data |
Δ (%) |
| Symmetry code: −x + 1, −y + 1, −z. |
| Bond lengths (Å) calc. |
| Pd1–Cl1a |
2.642 |
2.7106(14) |
2.5 |
| Pd1–Cl1 |
2.573 |
2.7106(14) |
5.05 |
| Pd1–Cl2 |
2.570 |
2.6130(15) |
1.64 |
| Pd1–Cl2a |
2.447 |
2.6130(15) |
6.35 |
| Pd1–Cl3a |
2.465 |
2.6363(14) |
6.49 |
| Pd1–Cl3 |
2.470 |
2.6364(14) |
6.31 |
| N1–C1 |
1.448 |
1.347(10) |
6.97 |
| N1–C5 |
1.405 |
1.338(9) |
4.76 |
| N2–C6 |
1.560 |
1.488(8) |
4.61 |
| C1–C2 |
1.405 |
1.357(11) |
3.41 |
| C2–C3 |
1.364 |
1.373(10) |
0.65 |
| C3–C4 |
1.463 |
1.396(9) |
4.57 |
| C4–C5 |
1.378 |
1.377(9) |
0.07 |
| C4–C6 |
1.526 |
1.512(9) |
0.91 |
![[thin space (1/6-em)]](https://www.rsc.org/images/entities/char_2009.gif) |
| Bond angles (°) |
| Cl1i–Pd1–Cl1 |
178.22 |
180.0 |
0.98 |
| Cl2–Pd1–Cl1 |
92.12 |
91.98(5) |
0.15 |
| Cl2–Pd1–Cl1a |
90.06 |
88.02(5) |
2.26 |
| Cl2i–Pd1–Cl1a |
90.19 |
91.98(5) |
1.94 |
| Cl2i–Pd1–Cl1 |
89.95 |
88.02(5) |
2.14 |
| Cl2–Pd1–Cl2a |
178.66 |
180.0 |
0.74 |
| Cl2–Pd1–Cl3a |
89.95 |
89.94(5) |
0.01 |
| Cl2–Pd1–Cl3 |
89.21 |
90.06(5) |
0.94 |
| Cl3i–Pd1–Cl1 |
88.32 |
87.66(4) |
0.74 |
| Cl3–Pd1–Cl1a |
87.75 |
87.66(4) |
0.10 |
| Cl3–Pd1–Cl1 |
93.57 |
92.34(4) |
1.31 |
| Cl3–Pd1–Cl3a |
176.36 |
180.0 |
2.02 |
| C5–N1–C1 |
122.35 |
122.4(6) |
0.04 |
| N1–C1–C2 |
117.02 |
119.5(6) |
2.07 |
| C1–C2–C3 |
120.14 |
120.3(7) |
0.13 |
| C2–C3–C4 |
121.85 |
119.1(6) |
2.25 |
| C3–C4–C6 |
121.35 |
121.4(6) |
0.04 |
| C5–C4–C3 |
117.83 |
119.0(6) |
0.98 |
| C5–C4–C6 |
120.75 |
119.6(6) |
0.95 |
| N1–C5–C4 |
120.64 |
119.5(6) |
0.94 |
| N2–C6–C4 |
109.42 |
111.2(5) |
1.60 |
Table 3 Intermolecular hydrogen bonds (Å, °) in (C6H10N2)2[PdCl6]·2H2O
| D–H···A |
D–H |
H⋯A |
D⋯A |
D–H···A |
| Symmetry code: x + 1, y, z. Symmetry code: −x + 1, −y + 1, −z + 1. Symmetry code: x, y + 1, z + 1. Symmetry code: x, y, z + 1. Symmetry code: −x + 2, −y + 1, −z + 1. Symmetry code: −x + 2, −y + 1, −z. Symmetry code: x, y + 1, z. Symmetry code: −x + 1, −y + 2, −z + 1. |
| O1–H1B⋯Cl1 |
0.85 |
2.47 |
3.210(5) |
146 |
| O1–H1C⋯Cl3 |
0.85 |
2.33 |
3.149(5) |
161 |
| N1–H1⋯O1a |
0.86 |
1.87 |
2.706(8) |
163 |
| N2–H2A⋯Cl1b |
0.89 |
2.36 |
3.240(5) |
172 |
| N2–H2B⋯Cl1c |
0.89 |
2.36 |
3.199(6) |
158 |
| N2–H2C⋯Cl2d |
0.89 |
2.62 |
3.259(6) |
129 |
| N2–H2C⋯Cl2e |
0.89 |
2.58 |
3.238(6) |
131 |
| C1–H1A⋯Cl2f |
0.93 |
2.69 |
3.588(7) |
164 |
| C2–H2⋯Cl1g |
0.93 |
2.73 |
3.571(7) |
152 |
| C5–H5⋯Cl3e |
0.93 |
2.63 |
3.424(7) |
143 |
| C6–H6A⋯Cl1e |
0.97 |
2.89 |
3.767(7) |
151 |
| C6–H6B⋯Cl2c |
0.97 |
2.95 |
3.770(6) |
143 |
| C6–H6B⋯Cl3h |
0.97 |
2.85 |
3.623(7) |
137 |
2.3. Spectroscopic measurements
Spectroscopic measurements were employed to identify functional groups and gain additional insights into the molecular structure of the synthesized compound. FT-IR is regarded as one of the most powerful techniques utilized for identifying the vibrational frequencies of the atomic bonds comprising the material. The infrared absorption spectrum of the compound in question was recorded using a PerkinElmer BX FT-IR spectrometer, covering the range of 400–4000 cm−1 at room temperature.
The optical absorption spectrum of the films was obtained at room temperature utilizing a standard UV-visible absorption spectrometer, spanning wavelengths from 190 nm to 800 nm. Meanwhile, the photoluminescence spectrum was recorded employing a Dilor XY configuration, with an excitation wavelength of 586 nm, covering the range from 200 to 500 nm using a solid sample at room temperature. The determination of the HOMO–LUMO energy levels and the electrochemical band gaps (Eg) involved considering the oxidation and reduction onset values.
2.4. Electrochemical measurements
Room temperature electrochemical evaluations were performed using a CHI 660B electrochemical analyzer. The setup utilized a standard three-electrode configuration, comprising a glassy carbon electrode as the working electrode, an Ag/AgCl electrode as the reference electrode, and a platinum wire as the counter electrode.
2.5. Thermal analysis
The thermal stability of the crystal under investigation was examined through thermogravimetric analysis (TGA) combined with differential thermal analysis (DTA) using a TGA/DTA instrument named “SETSYS Evolution” with a Pt crucible and Al2O3 as the reference material. The analysis was conducted under airflow conditions with a heating rate of 5 °C min−1, starting from room temperature and reaching up to 550 °C. The sample initially weighed 19 mg, and thermograms were collected throughout the process.
2.6. Computational studies
In this study, the Gaussian 09W program package24 was utilized with DFT/B3LYP/Lanl2mb basis set level for calculating the properties of the title molecule. Furthermore, a cluster was constructed from extracted single crystal X-ray data containing one [PdCl6] anion, one [3-AMP]2+ cation and one isolated molecule of water connected by N–H⋯O hydrogen bonds (Fig. 1b). Subsequently, the optimized geometry was utilized as an input file for calculating the infrared spectrum, UV-visible absorption, HOMO–LUMO and second hyperpolarizability. Corrective measures were employed to obtain the harmonic vibrational frequencies, ensuring a robust correlation between the experimental and calculated outcomes.
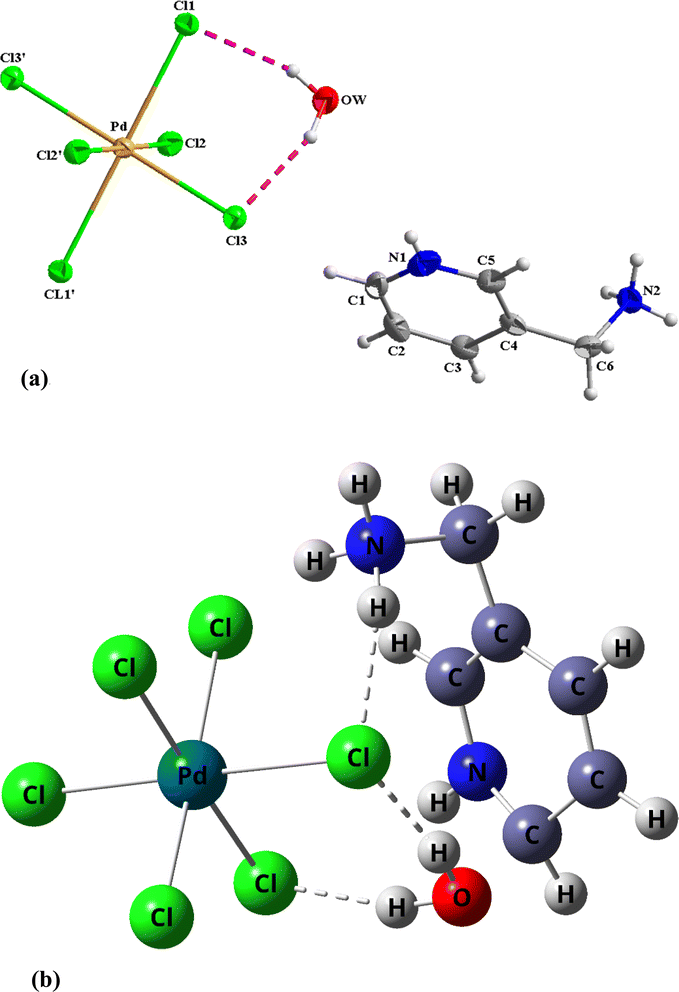 |
| | Fig. 1 (a). Representation of the asymmetric unit of (C6H10N2)2[PdCl6]·2H2O. (b) Optimized geometry of (C6H10N2)2[PdCl6]·2H2O. | |
The quartet ground state geometry optimization of the complex was conducted using the default convergence criteria, without imposing any constraints on the geometry.25 Frequency analysis of the optimized geometry, performed at the same level of theory, confirmed the structure as a true local minimum, exhibiting no imaginary frequencies. To correct for systematic errors arising from basis set incompleteness, neglect of electron correlation, and vibrational anharmonicity, an empirical scaling factor of 0.961 was applied.26 Electronic properties were evaluated using a time-dependent DFT (TD-DFT) approach27 at the same level of theory. The calculated results, including vertical excitation energies, oscillator strength (f), and frequencies, were compared with experimentally measured wavelengths. The simulated absorption spectrum, employing the GAUSSIAN 09, was generated using the GAUSSUM version 2.2 software package,28 while the GaussView 05 program29 was utilized to visualize the iso-density plots of frontier orbitals.
2.7. Conductivity evaluations
Electrical measurements were conducted on a pellet measuring 8 mm in diameter and 1 mm in thickness. Conducting silver paint was applied to the opposing sides of the pellet to establish a robust electrical connection. AC impedance spectroscopy was used to investigate the sample's transport characteristics using a 1260 Solartron Impedance Analyzer in vacuum, working over a frequency range of 102 to 107 Hz and at temperatures ranging from 313 to 358 K with an AC voltage of 0.5 V.
2.8. Animals
For this investigation, male mice weighing roughly 30 g were used. The rats had access to water and were fed pellets. The setting in which the animals were kept was regulated. Rat experiments were conducted in accordance with international care and use Laboratory Animals (code: 86/609/EEC) criteria at Monastir University. EtOH was given to the rats at a dose of 5 mL kg−1 in order to cause stomach ulcers.30,31 After that, 20 mice in total—15 with stomach ulcers and 5 healthy mice—were split up into 4 groups. Rats in the first group, known as the control group, were given a regular diet. Rats with ulcers were divided into two groups, U-3A50 and U-3A100, respectively, and given doses of 3A of 50 mg and 100 mg kg−1. As the ulcerated group, the fourth group was administered omeprazole at a dosage of 20 mg kg−1. After the rats were sacrificed, their stomachs were quickly taken out, rinsed with distilled water, and reopened. The entire area of the ulcer was then computed utilizing an e-ruler-provided digital calculable distance and an inverted microscope equipped with a digital camera and Image J software. The measurement of gastric juice MPO activity was done using spectrophotometry at 460 nm. At 25 °C, the consumption rate of one micromole of peroxide per minute was established as one unit of myeloperoxidase (MPO) activity.32 Stomach juice TBARS rates were calculated using the method outlined by Buege and Aust.33
3 Results and discussion
3.1. Structure description
The present compound crystallizes in the triclinic system, exhibiting a centrosymmetric space group P![[1 with combining macron]](https://www.rsc.org/images/entities/char_0031_0304.gif) , with lattice parameters as provided below: a = 7.720(8) Å; b = 7.794(8) Å; c = 9.597(9) Å; α = 81.799(8)°; β = 83.134(8)°; γ = 66.739(10)° and Z = 1.
, with lattice parameters as provided below: a = 7.720(8) Å; b = 7.794(8) Å; c = 9.597(9) Å; α = 81.799(8)°; β = 83.134(8)°; γ = 66.739(10)° and Z = 1.
The fundamental unit of the investigated material, depicted in Fig. 1a, consists of one inorganic [PdCl6]2− isolated octahedra anion, two-diprotonated 3-aminomethyl pyridinium cation (C6H10N2)2+ and one water molecule. This aligns well with the optimized geometry of the title compound model depicted in Fig. 1b. The electrical neutrality of this 0D compound is ensured by the alternating cationic layers formed by two [C6H10N2]2+ entities and the anionic layers formed by the octahedra [PdCl6]4− projected in the (a, c) plane as shown in Fig. 2. The parallel arrangement of organic cations between the planes of two adjacent aromatic rings suggests interactions of the type π⋯π in this compound. Hydrogen bonds of the C/N–H⋯Cl and N–H⋯O type, facilitated by nitrogen atoms, ensure the connection between the mineral anion, the organic cation, and the water molecule. Table 4 provides an overview of the primary characteristics of the bond lengths and bond angles in the title compound. In the organic part of the title compound, either of the two nitrogen atoms (N1 or N2) of the amine becomes protonated. Thus, equalizing the two charges borne by the inorganic component. The C–C distances range from 1.357(11) to 1.512(9) Å, while the N–C distances vary between 1.347(10) and 1.338(9) Å. The angles C–N–C, N–C–C, and C–C–C are in the range of 122.4(6)°, 119.5(6)–111.2(5)° and 119.6(6)–120.3(7)°, respectively.
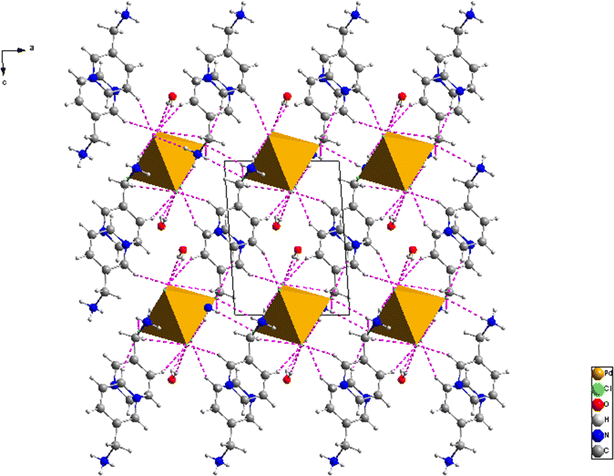 |
| | Fig. 2 Projection of the structure of (C6H10N2)2[PdCl6]·2H2O on the (a, c) plane. The dotted lines indicate the hydrogen bonds. | |
Table 4 Vibrational assignments, experimental and calculated wavenumbers (cm−1)
| Experience |
DFT |
Assignments |
| 3424 |
3686 |
Asym. O–H (H2O) stretching |
| 3409 |
3415 |
Sym. O–H (H2O) stretching |
| 3167 |
3170 |
C–H (ring) stretching |
| 3064 |
3076 |
N–H stretching |
| 3043 |
3079 |
Asym. CH2 stretching |
| 2925 |
3019 |
Sym. CH2 stretching |
| 1729 |
1739 |
Ring deformation |
| 1627 |
1651 |
H–N–H in plane bending |
| 1602 |
1625 |
C–C stretching, in plane bending of H–N–C and H–C–C |
| 1580 |
1596 |
C–C–C (ring) deformation |
| 1549 |
1567 |
CH2 deformation |
| 1483 |
1497 |
In plane bending of H–C–H |
| 1467 |
1481 |
C–H in plane bending |
| 1425 |
1443 |
N–H in plane bending |
| 1390 |
1406 |
H–C–C–N torsion |
| 1379 |
1385 |
N–C stretching |
| 1317 |
1329 |
N–C stretching |
| 1246 |
1261 |
In plane bending of H–C–N |
| 1225 |
1239 |
C–C stretching |
| 1189 |
1182 |
C–C–N deformation |
| 1122 |
1137 |
CH2 torsion |
| 1091 |
1108 |
Sym. CCN stretching |
| 1070 |
1087 |
C–C stretching |
| 1050 |
1063 |
H–C–C–H torsion |
| 972 |
988 |
C–N elongation |
| 911 |
924 |
C–H bending |
| 870 |
895 |
C–H (ring) bending |
| 823 |
859 |
N–C–C deformation |
| 793 |
805 |
H–C–C–H torsion |
| 637 |
654 |
Ring deformation |
| 566 |
578 |
O–H (H2O) bending |
| 494 |
5013 |
H–C–C–C torsion |
| 406 |
417 |
C–C–C–C torsion |
The C–C distances exhibit a range between 1.357(11) and 1.512(9) Å, while the N–C distances fall within 1.347(10) to 1.338(9) Å. The angles C–N–C, N–C–C, and C–C–C are measured within the ranges of 122.4(6)°, 119.5(6)–111.2(5)°, and 119.6(6)–120.3(7)°, respectively.
The inorganic entities PdCl6 consist of six Cl atoms that surround the Pd2+ cation forming an octahedral geometry. The Pd–Cl distances vary between 2.6367(14) and 2.7106(14) Å whereas the Cl–Pd–Cl angles range from 87.66(4) to 180.0°. Table 4 displays the geometrically and experimentally determined parameters. After a thorough examination of these parameters, it becomes evident that the majority of the calculated values are very close to those obtained experimentally. The relative difference for inorganic structural parameters is approximately 2.8%, while it stays below 1% for organic parameters when comparing experimental and calculated values. Water plays an important role in stabilizing the crystal structure. The resulting H- bonding networks can be characterized by a three-dimensional supramolecular framework. According to Brown,34 hydrogen bonds of the N–H⋯Cl type existing in this compound are considered weak. As can be seen in Table 5, the organic and mineral components are connected via weak hydrogen bonds involving donor–acceptor interactions D⋯A with an upper limit of 3.623(7) Å and a lower limit of 137 Å for D–H⋯A bond angles. This compound under study exhibits three types of hydrogen bonds: the first one, C–H⋯Cl ranging from 2.36 Å to 2.58 Å, while the second one, N–H⋯Cl with distances ranging from 2.69 Å to 2.85 Å, and thirdly N–H⋯O bonds, with H⋯O distance 1.87 Å facilitates the interaction between organic cations and the anionic chains.
Table 5 Global reactivity descriptors
| Parameters |
Values |
| EHOMO (eV) |
−6.11 |
| ELUMO (eV) |
−4.39 |
| ΔEH–L (eV) |
1.72 |
| IP (eV) |
6.11 |
| EA (eV) |
4.39 |
| χ (eV) |
5.25 |
| μ (eV) |
−5.25 |
| η (eV) |
1.72 |
| ω (eV) |
8.01 |
3.2. Hirshfeld surfaces analysis
The description of the bonds existing in this material was studied using Hirshfeld surface calculations with CrystalExplorer 3.0 software35–37 which accepts an input file in CIF format. These interactions were quantified through Hirshfeld surface analysis38 along with the corresponding two-dimensional fingerprint.39 The identification of contacts is facilitated through the normalized contact distance (dnorm), which considers the distances between the surface and the nearest nucleus inside (di) and outside (de) the surface, along with the van der Waals radii of the atom, using the following equation:40| |
 | (1) |
The Hirshfeld surface mapped according to dnorm (−0.5087; 1.2448) Å of the compound representing a hybrid architecture based mainly on hydrogen bonds already presented in Table 5 is shown in Fig. 3. The red circular areas are indicators of contacts between the different entities present with shorter contacts (dnorm < 0), the blue spots indicate the longest contacts within the structure (dnorm > 0), whereas the white spots represent contacts occurring at the sum of the van der Waals separations (dnorm = 0). The variation in color intensity indicates the intensity of the interaction. As for Fig. 3b, it displays the occurrence of red and blue triangles on the shape index regions indicating the existence of electrostatic interactions π⋯π between organic entities. In addition, analysis of the 2D fingerprint graphs (Fig. 4) allows us to relate numerical values to dnorm-mapped Hirshfeld surfaces and to determine the different contributions relative to the various interactions between the organic molecules and the inorganic part. All these interactions overlap in the total footprint equal to 100% shown in the figure below. The first part of this study highlights the dominance of H⋯Cl/Cl⋯H type hydrogen bonds by a percentage equal to 65%, reflected on the footprint by a wing at the top level. H⋯H interactions have a significant contribution with a percentage of 19.3% as shown in Fig. 4b. Still in the study of the percentage contributions of hydrogen bonds in this structure the presence of H⋯O/O⋯H, H⋯C/C⋯H and, H⋯N/N⋯H interactions account for only 6%, 4.2% and 1.5% of the total contributions, respectively. Calculation of the void in the crystal is illustrated in Fig. 5. The void within the crystalline material was visualized by generating an isosurface (0.002 au) of procrystal density. The resulting void volume is 26.99 Å3 according to single-crystal XRD analysis, the filled volume is 523.91 Å3, so the void percentage is 5.15% per unit cell.
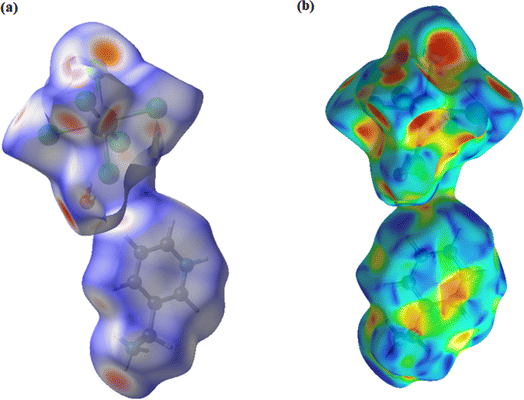 |
| | Fig. 3 Hirshfeld surface (a) mapped to dnorm (b) shape index. | |
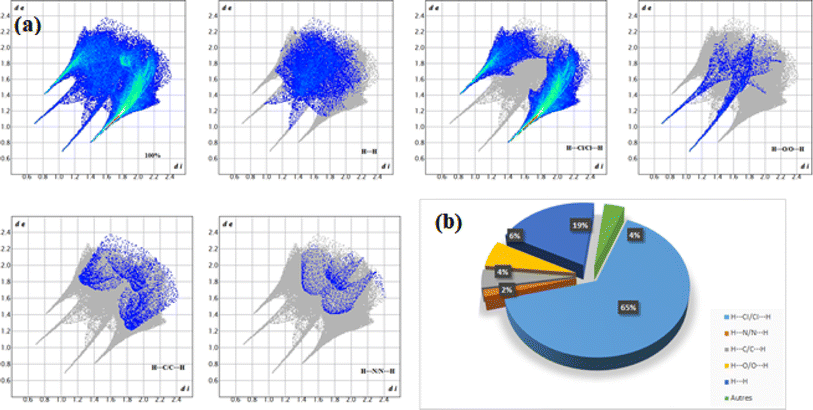 |
| | Fig. 4 (a) Fingerprints of interatomic contacts and Hirshfeld surfaces in dnorm; (b) relative contribution of different contacts. | |
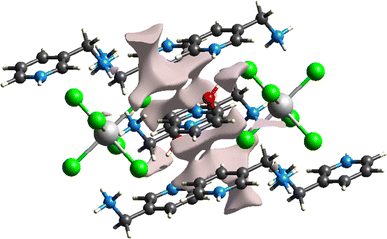 |
| | Fig. 5 The surface area of voids in the structure of the compound (C6H10N2)2[PdCl6]·2H2O. | |
3.3. Infrared spectroscopy study
To obtain more information in the description of the crystal structure, focusing on the layers of cationic–anionic functional groups, we have undertaken vibrational spectroscopy using infrared absorption at room temperature. The infrared spectrum of the different bands recorded between 400 and 4000 cm−1 of the experimental and the DFT computed superposed are presented in Fig. 6. According to a comparison between the theoretical and experimental modes and frequencies reported in the literature for comparable compounds,41–43 the assignments of the observed bands are provided in Table 6. Initially, we observe a close match between the experimental and simulated spectra for both infrared and Raman characteristics. Hereafter, we won't provide a comprehensive assignment. Instead, we aim to extract the most pertinent and distinctive information that correlates with structural properties. It's worth mentioning that the regions of high frequencies, specifically 3424 cm−1 and 3409 cm−1, correspond to the symmetric and asymmetric stretching of OH. The observed band at 3167 cm−1 in experimental IR is assigned to the stretching of C–H (ring). Furthermore, the band around 3064 cm−1 is attributed to the N–H stretching mode. However, the bands located at 3043 cm−1 and 2925 cm−1 in FT-IR are due to the asymmetric and symmetric stretching vibration of CH2. In addition, the band located at 1549 cm−1 is attributed to the CH2 deformation. The band located around 1729 cm−1 is attributed to ring deformation. The band observed at 1627 cm−1 in infrared corresponds to the H–N–H in plane bending. However, the band located at 1602 cm−1 is assigned to the (C–C) stretching, in plane bending of H–N–C and H–C–C. Nevertheless, the C–C–C (ring) deformation wavenumbers attributed at 1580 cm−1. In fact, the H–C–H in the plane-bending vibration is observed at 1483 cm−1. The band located at 1390 cm−1 in FT-IR is assigned to the H–C–C–N torsion. However, the bands observed at 1379 cm−1 and 1317 cm−1 in infrared correspond to N–C stretching while the C–N elongation observed at 972 cm−1 and the symmetric CCN stretching is observed at 1091 cm−1. The band observed at 1182 cm−1 is attributed to the C–C–N deformation. The bands located around 1050 and 793 cm−1 are attributed to the H–C–C–H torsion. In fact, the OH (H2O) bending vibration is observed at 566 cm−1. Finally, the bands that appear at 494 cm−1 and 416 cm−1 are attributed to the H–C–C–C torsion and C–C–C–C torsion, respectively.
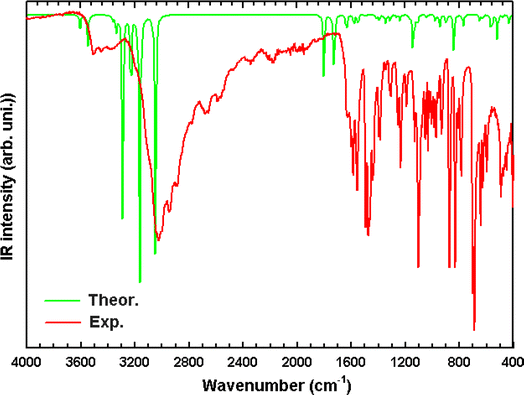 |
| | Fig. 6 Superposition of the experimental (red) and the DFT computed (green) FT-IR spectra of (C6H10N2)2[PdCl6]·2H2O in the 400–4000 cm−1 region. | |
Table 6 The electric dipole moment, the average polarizability, and second hyperpolarizability
| Dipole moment (D) |
Second hyperpolarizability (10−36 esu) |
| μx |
8.40 |
γxxxx |
3.19 |
| μy |
17.14 |
γyyyy |
2.32 |
| μz |
1.58 |
γzzzz |
0.71 |
| μtot |
19.16 |
γxxxy |
0.12 |
| Polarizability (10−24 esu) |
γyyyx |
0.04 |
| αxx |
25.02 |
γxxxz |
0.11 |
| αyy |
19.05 |
γyyyz |
0.11 |
| αzz |
26.61 |
γxxyy |
0.94 |
| αxy |
3.84 |
γxxzz |
0.60 |
| αxz |
0.62 |
γyyzz |
0.51 |
| αyz |
0.33 |
γ |
2.06 |
| αtot |
23.56 |
3.4. Optical absorption
The UV-visible spectra of the organic molecule 3-AMP and (3-AMP)2[PdCl6]·2H2O complex are shown in Fig. 7. The data is depicted as a function of wavelength (190–800 nm). From these spectra, we observed six clear peaks located at λ = 430 nm. The initial peak observed at λ = 355 nm is attributed to π → π* transitions involving the ring in the organic cation. This peak is also visible in the spectrum of the cation at 206 nm. The peaks centered at λ2 = 218 nm, λ3 = 238 nm, λ4 = 253 nm, and λ5 = 276 nm are attributed to n → π* transitions involving the ring within the organic cation. Charge transfer from the organic to inorganic part in (3-AMP)2[PdCl6]·2H2O complex can be assigned to the strong peak at λ6 = 294 nm. The optical absorption coefficient (α) and the band gap energy (Eg) are the most critical parameters. To determine the band gap energy of our complex an accurate spectrophotometric method has been applied using the Tauc relationship given by this formula:where α, h, C, ν, Eg are the absorption coefficient, the Planck's constant, the absorption constant, the light frequency, and the optical band gap energy, respectively. Such that the optical absorption coefficient (cm−1) was derived from the absorbance using the following correlation:44| |
 | (3) |
where; t is the sample thickness and A is the absorbance.
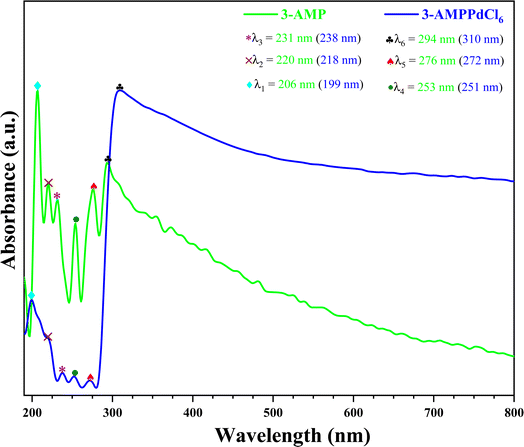 |
| | Fig. 7 Experimental and simulated optical absorption spectra of C6H10N2 and (C6H10N2)2[PdCl6]·2H2O. | |
Moreover, the optical band gap value is determined by extending the linear segment of the plot along the energy axis, where (αhν)2 = 0 using the Tauc model. The curves (αhν)2 as a function of hν for the organic molecule 3-AMP and (3-AMP)2[PdCl6]·2H2O complex are shown in Fig. 8. Thus, the linear interpolation on the x-axis of the graph (αhν)2 is used to determine the band gap energy, which is approximated at 3.15 eV and 2.35 eV, respectively. These energies can classify this material as a semiconductor.
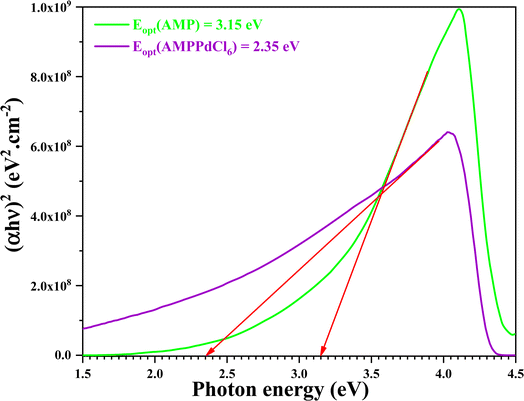 |
| | Fig. 8 Optical band gap determination of C6H10N2 and (C6H10N2)2[PdCl6]·2H2O. | |
3.5. Frontier molecular orbital analysis
We conducted a comprehensive investigation of the optical properties and chemical stability by analyzing the energies of the highest occupied molecular orbital (HOMO) and lowest unoccupied molecular orbital (LUMO), along with the boundary molecular orbitals, using the TD-DFT method. The latter plays an interesting role in electrical, optical properties and in chemical reactions.45 The electronic distribution of the molecular orbitals of the compound studied is shown in Fig. 9. HOMO and LUMO energies are used to determine global reactivity descriptors, such as ionization potential (IP), electron affinity (EA), electrophile index (ω), chemical potential (μ), electronegativity (χ) and hardness (η). In simple molecular orbital theory approaches, the HOMO energy (EHOMO) is related to (IP) and the energy of LUMO (ELUMO) is linked to (EA) by Koopmann's theorem.46,47 The key parameter for confirming the stability of our investigated compound is ΔEH–L, this energy found as 1.72 eV. These parameters are computed based on the following equations and presented in Table 5:| | |
ΔEH–L = ELUMO − EHOMO
| (4) |
| |
 | (7) |
| |
 | (8) |
| |
 | (9) |
| |
 | (10) |
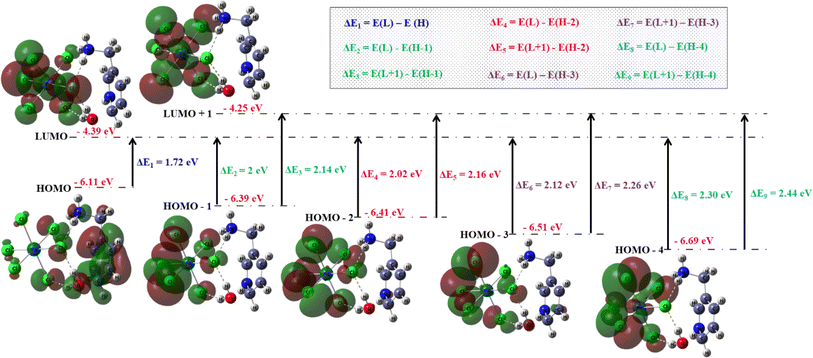 |
| | Fig. 9 Frontier molecular orbitals involved in some computed transitions of (C6H10N2)2[PdCl6]·2H2O. | |
3.6. Fluorescence property
Additionally, we investigated the luminescent properties of the compound at room temperature. Fig. 10 illustrates the fluorescence spectrum of (C6H10N2)2[PdCl6]·2H2O observed in the solid state at room temperature, with excitation at 227 nm. The result showed a wide fluorescence band from 440 nm to 700 nm.
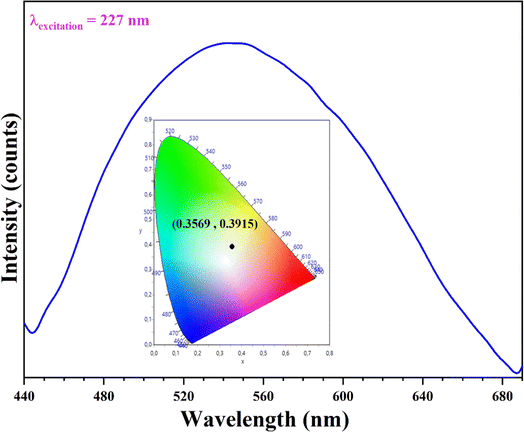 |
| | Fig. 10 Emission spectrum of (C6H10N2)2[PdCl6]·2H2O. | |
When excited with 227 nm light, the established compound displays vibrant blue-violet, green, and orange emissions in aggregated states, collectively forming the components of white light. The CIE coordinates (0.3569, 0.3915) define a triangular area encompassing the white light energy point (0.33, 0.33) on the CIE chromaticity diagram. This compound's emission covers nearly the entire visible light spectrum, resulting in a pure white light.
3.7. Electrochemical behavior
The electrochemical studies of (3-AMP)2[PdCl6]·2H2O were conducted in a distilled water aqueous solution (10−3 mol L−1) within a potential range from −600 to 1200 mV at a scan rate of 100 mV s−1. The voltammetric pattern displayed a single redox wave, attributed to the palladium redox process (Fig. 11). Due to the limited reversibility of the waves, we were able to ascertain the average peak potentials between the respective anodic and cathodic peaks E1/2. The mean peak potential E1/2 = (Epa + Epc)/2 is +0.61 V. The reduction step involves 2 electrons, calculated from the equation Ep (V) = 0.06/n. Hence, we deduce that the reduction is a one-reversible, one-electron process. Electrochemical band gaps  are determined from the cyclic voltammetry (CV) measurements using the following equations:48
| | |
EHOMO = −(4.39 + Eox)
| (11) |
| | |
ELUMO = −(4.39 + Ered)
| (12) |
| |
 | (13) |
where Eox is the oxidation peak potential and Ered is the reduction peak potential. The electrochemical band gap  between HOMO–LUMO energy levels is 1.32 eV. The complex's oxidation and reduction characteristics explains the stability of the metal ion.
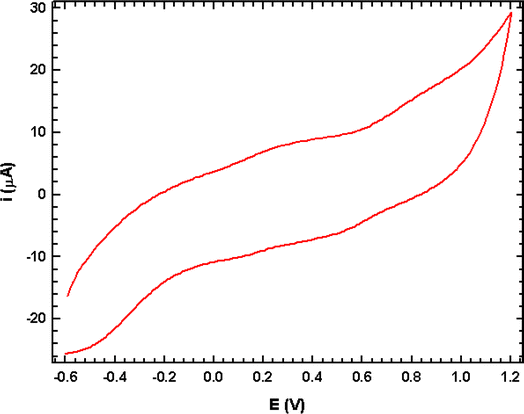 |
| | Fig. 11 Cyclic voltammogram of (C6H10N2)2[PdCl6]·2H2O (scan rate 100 mV s−1). | |
3.8. Thermal analysis
The crystals' thermal stability was investigated through simultaneous thermogravimetric analysis and measurements of differential thermal analysis (TGA-DTA) simultaneously for the synthesized compound, carried out at a specified heating rate of 5 °C min−1 from 25 to 550 °C, is depicted in Fig. 12.
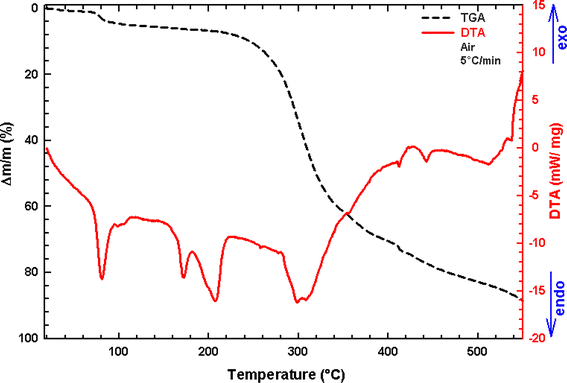 |
| | Fig. 12 Thermogravimetric and differential thermal analysis plots for (C6H10N2)2[PdCl6]·2H2O. The scan was performed in flowing air with a ramp rate of 5 °C min−1. | |
According to the TGA curve, compound (C6H10N2)2[PdCl6]·2H2O does not show any mass loss before 230 °C, beyond this temperature, the sample undergoes continuous decomposition. The first thermal phenomenon undergone by our compound is located between 25 and 110 °C, associated with a more intense endothermic peak around 85 °C, and corresponds to the departure of two water molecules, indicated by a weight loss of 5.86%, which aligns with the calculated weight loss (6.25%) and formation of the anhydrous phase (C6H10N2)2[PdCl6]. In the 210 °C to 350 °C temperature range, an endothermic peak accompanies a weight loss observed on the TGA curve at around 305 °C. During this process, the material theoretically corresponds to 61.48% of the total mass. This loss is ascribed to the degradation of two organic molecules and the volatilization of two Cl2 molecules, the compound formed as a result of this mass loss is represented by the chemical formula [PdCl2]. From 350 °C, the compound continues to decompose with a mass loss of two chloride ions, ultimately resulting in the formation of palladium oxide (PdO) as the end product.
3.9. Dielectric studies
3.9.1. Dielectric constant. Fig. 13 shows the frequency dependence of the real part (ε′) of the dielectric permittivity for the studied material at different temperatures. The dielectric constant shows a significant rise at low frequencies, and this rise alters in shape with temperature variations, attributed to the motion of conducting ions. However, the ε′ values decrease with increasing frequency (f > 102 Hz) and almost reach a plateau, enhancing the capacity for storing energy.49 Moreover, the dielectric constant values increase with temperature at a specific frequency. The dielectric characteristics observed in this material is due to the Maxwell–Wagner type interfacial polarization.50
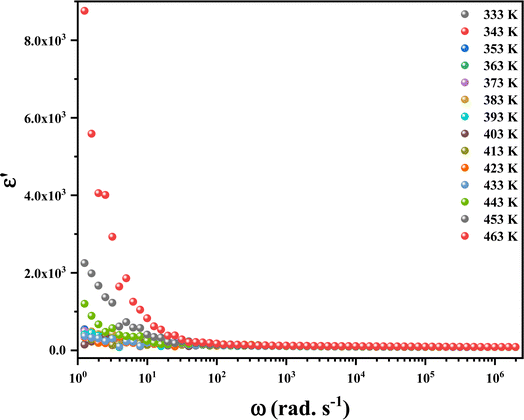 |
| | Fig. 13 The variation of the real part of the permittivity of (C6H10N2)2[PdCl6]·2H2O sample. | |
3.9.2. Dielectric loss factor. Investigating the “dissipation factor” in materials intended for optoelectronic applications, as illustrated by tan(δ) in Fig. 14, was crucial. The dielectric loss mainly arises from several physical phenomena, including the conduction process, molecular dipole moment, dielectric relaxation, and interfacial polarization.51 This factor can be computed based on:| |
 | (14) |
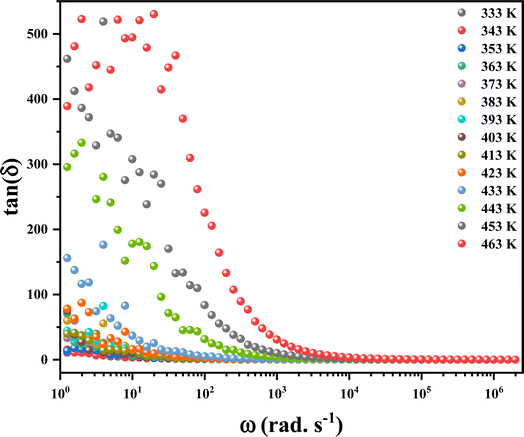 |
| | Fig. 14 The variation of the dielectric loss factor at different temperatures. | |
With increasing temperature, the dielectric loss shifts towards higher frequencies, signifying the thermal activation of polarization. This advancement has prompted the consideration of these materials for use in electrical devices.52 Moreover, it suggests that elevated temperatures and lower frequencies lead to heightened dielectric loss, offering a clear indication of enhanced conductivity in the materials.53
3.9.3. Impedance spectroscopy analysis. Impedance spectroscopy is a widely recognized method for examining the electrical properties of a material. For that, complex impedance spectra −Z′′ = f(Z′) of the (C6H10N2)2[PdCl6]·2H2O compound were measured at various temperatures (333–463 K) as shown in Fig. 15. These diagrams confirm the presence of characteristic semi-circular patterns, positioned below the horizontal axis, which diminish noticeably with rising temperature, suggesting a relaxation mechanism that deviates from the Debye type.54
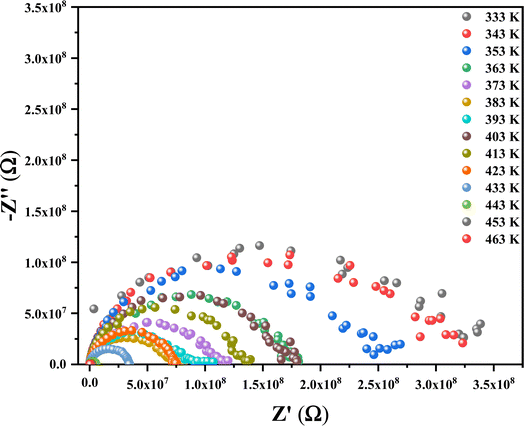 |
| | Fig. 15 Nyquist plots of the compound at room temperature. | |
As shown in Fig. 16a, it is clear that the amplitude of the real parts, denoted as Z′ and representing electrical resistance, decreases with increasing frequency and temperature. This phenomenon involves the negative temperature coefficient of resistance (NTCR) in the (C6H10N2)2[PdCl6]·2H2O compound. At higher frequencies, the Z′′ values for all temperatures converge to a single point, suggesting a potential discharge of space charge and consequently lower energy barrier characteristics.
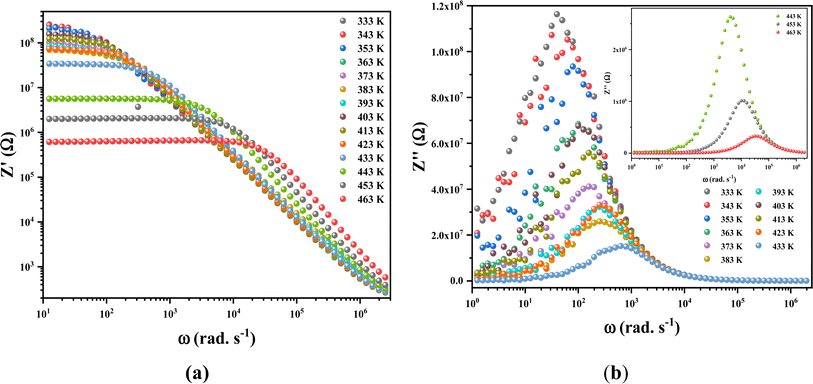 |
| | Fig. 16 The frequency dependence of Z′ (a) and Z′′ (b) at different temperatures for (C6H10H2)2[PdCl6]·2H2O crystal. | |
Examining the change in Z′′ (see Fig. 16b) with angular frequency reveals the emergence of singular peaks at specific frequencies, along with a reduction in peak height as the temperature increases. Additionally, we observed peak broadening with a decrease in the value of  implying an escalating loss in the resistive properties of the sample.
3.9.4. Complex modulus analysis. We have also examined the electrical modulus to explore the relaxation mechanism in the hybrid material (C6H10N2)2[PdCl6]·2H2O. This offers valuable insights into various aspects including the electrode effect, grain boundary effect, grain characteristics, conductivity, and relaxation behavior of the material. This compound is depicted by the equation: M = M′ + iM′′. The formula below has been utilized to determine M′:| |
 | (15) |
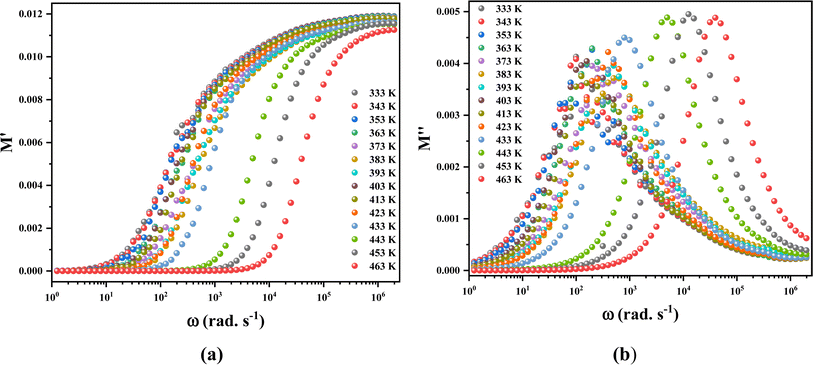
Fig. 17a illustrates the frequency-dependent behavior of the real components of the modulus spectra M′(T, f) within the temperature range of 333 to 463 K. At all temperatures, M′ increases as frequency rises. At low frequencies, M′ approaches zero, indicating no electrode influence. Fig. 17b demonstrates the change in the imaginary part of the electric modulus (M′′) with frequency at various temperatures. The M′′ value exhibited a consistent increase with the rising frequency, reaching its maximum  and then rapidly declining, as illustrated in this graph. As the temperature rises, the peak shifts towards higher frequencies, suggesting the occurrence of a relaxation process. At low frequencies, M′′ values approach zero, indicating that the electrode influence can be ignored.55 The approximation of the imaginary part of M′′(ω) is proposed by Bregman:56
| |
 | (16) |
where,
ωmax is the frequency at which the maximum modulus

occurs, and
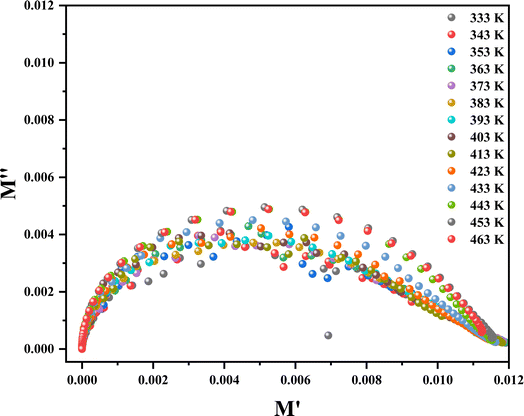
β suggests the importance of coupling between mobile ions in the conduction process, falling within the range of (0–1). To understand the effects of clear grain and grain boundaries, we utilized master modulus spectra in
M′′ =
f(
M′).
Fig. 18 exhibits the complex modulus spectrum of (C
6H
10N
2)
2 [PdCl
6]·2H
2O at specified temperatures. It reveals a multiple semicircular arc, with the point of intersection on the real axis signifying the capacitive contribution of the grains. The arcs overlapped, creating a curve, suggesting that the underlying conduction mechanism remains unchanged.
 |
| | Fig. 17 Frequency dependent of M′ (a) and M′′ (b) at different temperatures for (C6H10N2)2[PdCl6]·2H2O. | |
 |
| | Fig. 18 Complex modulus spectra at 333–463 K. | |
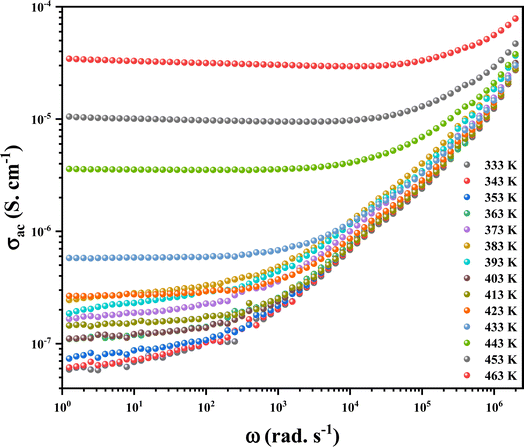
3.9.5. Conductivity study. AC conductivity analysis aids in determining the mode of transport for charge carriers, which governs the conduction process and its variation with frequency and temperature. The frequency dependence of AC conductivity for the (C6H10N2)2 [PdCl6]·2H2O sample is documented in Fig. 19. The AC conductivity rises as the frequency increases. The conductivity spectra can be characterized by two regions: the first, at low frequencies, a plateau is remarked as described through the initial term of the Jonscher equation, which defines the direct current conductivity (dc) is present.
 |
| | Fig. 19 Frequency dependence of AC conductivity at various temperatures. | |
Secondly, at high frequencies, the conductivity demonstrates an asymptotic form, known as the dispersive regime, characterized by the second term AωS, representing the charge species accumulated at the grain boundaries. These species possess enough energy to surpass the energy barrier with increasing temperature. This variation follows the Jonscher power law:57
The expression involves σac, the conductivity of the alternating current, σdc the frequency-independent conductivity obtainable by extending the low-frequency plateau to zero frequency, A, a temperature-dependent constant determining the polarization strength, and |s|, the power law exponent typically falling within the range 1 < s < 2.58 The diminished energy gap (3.56 eV) and elevated conductivity, approximately 10−4 Ω−1 cm−1, establish that this material is a semiconductor suitable for application in photovoltaic cells, serving as a photodetector that transforms optical signals into electrical signals. An essential characteristic that classifies this material as an optoelectronic material is its thermal stability, which extends up to 483 K, credited to the presence of palladium.
3.10. Biological activities
The results of this study show that consumption of ethanol induces the recruitment of neutrophils to the stomach tissues, which causes ulceration. This is indicated by a marked increase in gastric juice MPO activity, which in turn causes an increase in oxidative stress, as evidenced by a marked increase in gastric juice TBARS levels. Damage to the stomach mucosa tissues was produced by both inflammation and oxidative stress. On the other hand, there was a noticeable protective effect against this oxidative stress when 3-AMP was given via gastric gavage to ulcerated rats. This was demonstrated by a notable 26 and 58% decrease in TBARS after ingestion of 3-AMP compounds at doses 50 and 100 mg kg−1. This compound's anti-inflammatory and anti-oxidant effects shield stomach mucosa against damage and erosion, as evidenced by a significant decrease in stomach ulcer area by 16 and 30% following the consumption of 3-AMP supplements at doses of 50 and 100 mg kg−1 respectively. Certainly, our study unequivocally demonstrates that the intake of this compound safeguards against damage and ulceration of gastric tissues through two distinct mechanisms. First, it induces and stimulates the antioxidant system within gastric tissues, leading to the neutralization and suppression of free radicals. This, in turn, protects against cellular damage, as evidenced by the reduction in TBARS levels in gastric juice. Second, the compound inhibits the pivotal inflammatory enzyme, specifically the activity of MPO, subsequently impeding inflammatory cascades and, thereby, protecting against gastric tissue ulceration. Additionally, prior research has revealed alternative mechanisms of compounds containing palladium, including the suppression of inflammatory reaction mediators,14–16 reduction in pro-inflammatory cytokines, and nitrite production. Simultaneously, these compounds enhance the activity of antioxidant enzymes.59,60 In addition, compounds containing different polyphenolic chemicals have been shown to target particular molecules and modify a variety of signaling pathways, resulting in varied physiological effects. One such example of an active component for the treatment of inflammation is the phenolic compound's ability to block the NF-κB pathway, which has anti-inflammatory properties (Fig. 20).61,62
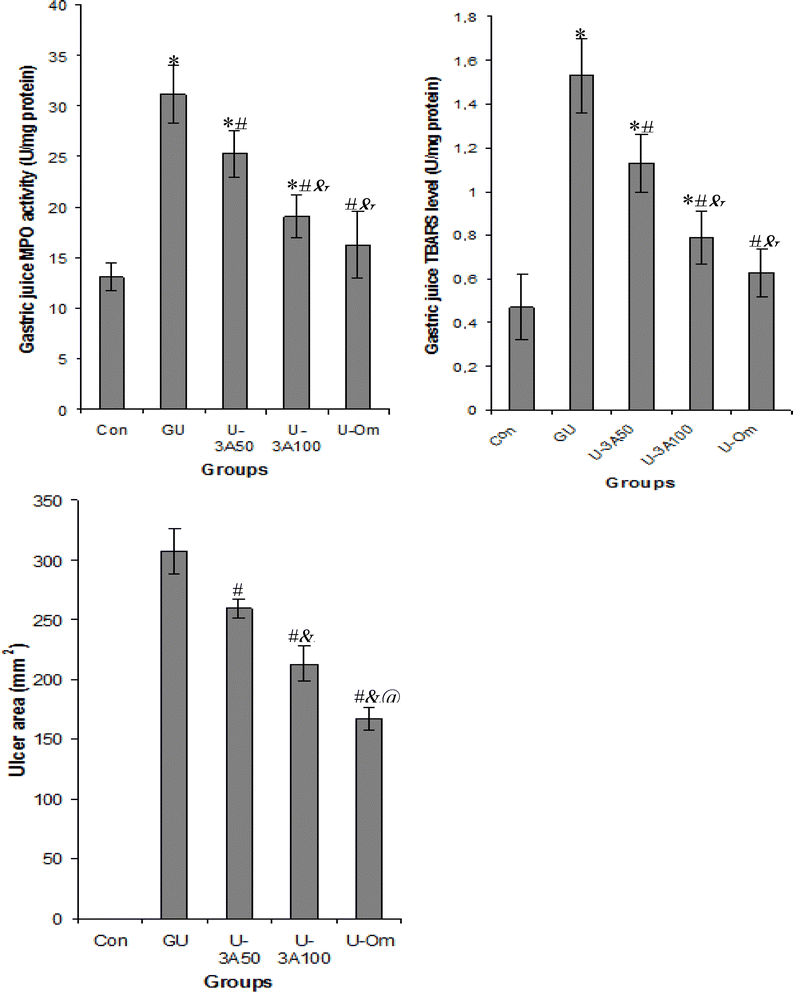 |
| | Fig. 20 Effects of new palladium(II) halide complex on key indice related to inflammation as MPO activity, to stress as TBARS rates and gastric ulcer as ulcer area (mm2). *P < 0.05 significant differences compared to controls; #P < 0.05 significant differences compared to ulcerated rats; &P < 0.05 significant differences compared to ulcerated rats treated with palladium(II) halide complex at dose 50 mg kg−1 (3A50); @P < 0.05 significant differences compared to ulcerated rats treated with palladium(II) halide complex at dose 50 mg kg−1 (3A100). | |
4 Conclusion
In summary, this paper focuses on the synthesis and characterization of a novel hybrid compound. The compound was synthesized using slow evaporation conditions and characterized through various techniques including single-crystal X-ray diffraction, electrochemical analysis, spectroscopic studies, and thermal analysis. The structural, vibrational, and optical spectra (UV-Vis, PL, HOMO–LUMO), calculated using the DFT/B3LYP/Lanl2mb level of theory, align well with experimental findings. Analysis of the X-ray diffraction data reveals that the grown crystal possesses a triclinic structure with a centrosymmetric space group P![[1 with combining macron]](https://www.rsc.org/images/entities/char_0031_0304.gif) .
.
The crystal structure is made up of organic [C6H10N2]2+ entities, which are connected by weak hydrogen bonds to [PdCl6]4− anions and free water molecules, creating a three-dimensional network. The crystal's cohesion is ensured by a three-dimensional system of hydrogen bonds. The optical properties have good transparency in the visible region and are suitable for use in nonlinear optics devices. The UV-visible spectra analysis reveals a band gap energy of 2.35 eV for the title compound. In addition, analysis of the HOMO and LUMO energy levels yields a gap energy (Eg) of 3.56 eV, along with determination of global reactivity descriptors such as ionization potential (IP), electron affinity (EA), electrophile index (ω), chemical potential (μ), electronegativity (χ), and hardness (η). Furthermore, understanding of the stability of the metal ion is enhanced by examining the oxidation and reduction behavior of the complex.
Moreover, at room temperature, the investigated compound displays blue luminescence. Thermal analyses indicate that the thermal decomposition of the palladium complex takes place in several stages: the first involves dehydration, leading to the formation of the anhydrous phase (C6H10N2)2[PdCl6]. The second one pertains to the decomposition of two organic molecules and the evaporation of four chloride ions, probably in the form (C6H8N2Cl)2·(HCl)2, leading to PdCl2, and the last corresponds to the decomposition of palladium dichloride to its oxide PdO. The considerable dielectric permittivity, strong capacitance, elevated conductivity, and minimal dielectric loss of this material render it exceptionally adaptable for FET (Field-Effect Transistor) applications when compared to alternative dielectric materials. The current research underscores the need for additional investigations into these novel materials, potentially leading to the development of new drugs targeting inflammation, oxidation, and gastric issues. While the compound (C6H10N2)2[PdCl6]·2H2O shows promise, additional research is required to thoroughly explore its potential utility and application in various fields, such as catalysis.
Author contributions
Sarra Bougossa: formal analysis, writing – original draft; Noureddine Mhadhbi, Mohamed Hamdi: writing, investigation, validation; Ali Ben Ahmed, Khaled Hamden, Abderrazek Oueslati: review & editing, visualization, data curation; Kais Elghniji, Jeanneau Erwann: data curation, methodology, resources; Houcine Naïli: project administration, validation, supervision.
Conflicts of interest
The authors declare no competing financial interest.
Acknowledgements
The authors extend their appreciation to the Deanship of Scientific Research at Northern Border University, Arar, KSA for funding this research work through the project number “NBU-FFR-2024-2924-04”.
References
- C.-B.-C. Sanchez, S. Cassaignon, C. Chaneac, O. Durupthy, M. Faustini, D. Grosso., C. Laberty-Robert, L. Nicole, D. Portehault, F. Ribot, L. Rozes and C. Sassoye, Molecular Engineering of Functional Inorganic and Hybrid Materials, Chem. Mater., 2014, 26, 221–238 CrossRef CAS.
- S. Boufas, N. Mohamedi, P. Bénard-Rocherullé, P. Roussel and T. Roisnel, CdCl3− vs CdCl42− in Hybrid Materials, Procedia. Soc. Behav. Sci., 2015, 195, 1639–1647 CrossRef.
- T. Sekine, T. Okuno and K. Awaga, Mol. Cryst. Liq. Cryst. Sci. Technol., Sect. A, 1996, 279, 65–72 CrossRef CAS.
- W.-Q. Chen, M.-H. Feng, D.-D. Zhou, Y.-Q. Peng, S. Han, X.-P. Liu, L.-M. Yang, J.-R. Zhou and C.-L. Ni, Synth. React. Inorg., Met.-Org., Nano-Met. Chem., 2012, 42(6), 811–817 CrossRef CAS.
- M. Mathlouthi, E.-J. Daron, M. Rzaigui and W. Smirani, J. Supercond. Novel Magn., 2016, 29, 1573–1581 CrossRef.
- D.-B. Mitzi, C.-D. Dimitrakopoulos and L.-L. Kosbar, Structurally Tailored Organic−Inorganic Perovskites: Optical Properties and Solution-Processed Channel Materials for Thin-Film Transistors, Chem. Mater., 2001, 13(10), 3728–3740 CrossRef CAS.
- S. Weina, H. Chunyin, Z. Wang, G. Yachen, Y. Yixiao, W. Yiqun, C. Zhimin, L. Xiaochen and D. Yongli, Carbon, 2014, 77, 1020–1030 CrossRef.
- M.-D. Birowosuto, D. Cortecchia, W. Drozdowski, K. Brylew, W. Lachmanski, A. Bruno and C. Soci, X-ray Scintillation in Lead Halide Perovskite Crystals, Sci. Rep., 2016, 6(1), 37254 CrossRef CAS PubMed.
- Y. Tominaga and H. Ohno, Lithium ion conduction in linear- and network-type polymers of PEO/sulfonamide salt hybrid, Electrochim. Acta, 2000, 45(19), 3081–3086 CrossRef CAS.
- L. M. Novena, S. S. Kumar and S. Athimoolam, Improved solubility and bioactivity of theophylline (a bronchodilator drug) through its new nitrate salt analysed by experimental and theoretical approaches, J. Mol. Struct., 2016, 1116, 45–55 CrossRef.
- S. Gatfaoui, A. Sagaama, N. Issaoui, T. Roisnel and H. Marouani, Synthesis, experimental, theoretical study and molecular docking of 1-ethylpiperazine-1,4-diium bis(nitrate), Solid State Sci., 2020, 106326 CrossRef CAS.
- R. G. Lacoste and A. E. Marttel, New Multidentate Ligands. I. Coordinating Tendencies of Polyamines Contaimng α-Pyridyl Groups with Divalent Metal Ions, Inorg. Chem., 1964, 3(6), 881–884 CrossRef CAS.
- T. M. Hseu, Y. H. Tsai and C. W. Cheng, Spectrophotometric Studies of Nickel(II) Chelate of 2-Picolylamine, J. Chin. Chem. Soc., 1975, 22(4), 299–308 CrossRef CAS.
- S. Bhuvaneswari, M. Umadevi and R. Vanajothi, Effects on Anti-Inflammatory, DNA Binding and Molecular Docking Properties of 2-Chloroquinolin-3-Yl-Methylene-Pyridine/Pyrazole Derivatives and Their Palladium (II) Complexes, Bioorg. Med. Chem. Lett., 2020, 30, 127593 CrossRef CAS PubMed.
- M. Naveed, R. Ullah, A. Khan, B. Shal, A. U. Khan, S. Z. Khan, Z. U. Rehman and S. Khan, Anti-Neuropathic Pain Activity of a Cationic Palladium (II) Dithiocarbamate by Suppressing the Inflammatory Mediators in Paclitaxel-Induced Neuropathic Pain Model, Mol. Biol. Rep., 2021, 48, 7647–7656 CrossRef CAS PubMed.
- M. Naveed, S. Z. Khan, S. Zeeshan, A. Khan, B. Shal, A. Atiq, H. Ali, R. Ullah and S. Khan, A New Cationic Palladium (II) Dithiocarbamate Exhibits Anti-Inflammatory, Analgesic, and Antipyretic Activities through Inhibition of Inflammatory Mediators in in Vivo Models, Naunyn-Schmiedeberg's Arch. Pharmacol., 2019, 392, 961–977 CrossRef CAS PubMed.
- E. A. Afify, H. M. Alkreathy, A. S. Ali, H. A. Alfaifi and L. M. Khan, Characterization of the Antinociceptive Mechanisms of Khat Extract (Catha Edulis) in Mice, Front. Neurol., 2017, 8, 69 Search PubMed.
- P. Kwemo, A. Saafane, M. Vanharen, I. Durocher and D. Girard, Impact of Palladium Nanoparticles (Pd-NPs) on the Biology of Neutrophils in Vitro and on Leukocyte Attraction in Vivo, J. Nanoparticle Res., 2020, 22, 1–11 CrossRef.
- B. Y. A. El-Aarag, T. Kasai, M. A. H. Zahran, N. I. Zakhary, T. Shigehiro, S. C. Sekhar, H. S. Agwa, A. Mizutani, H. Murakami and H. Kakuta, In Vitro Anti-Proliferative and Anti-Angiogenic Activities of Thalidomide Dithiocarbamate Analogs, Int. Immunopharmacol., 2014, 21, 283–292 CrossRef CAS PubMed.
- I. Hamdi, N. Mhadhbi, N. Issaoui, A. Roodt, M. M. Turnbull and H. Naïli, J. Mol. Struct., 2021, 1237, 130384 CrossRef CAS.
- I. Hamdi, N. Mhadhbi, N. Issaoui, M. El-Ghozzi, A. Tozri and H. Naïli, J. Mol. Struct., 2022, 1251, 132051 CrossRef CAS.
- Nonius, KappaCCD Program Software, Nonius BV, Delft, The Netherlands, 1998 Search PubMed.
- C. J. O'Connor, Prog. Inorg. Chem., 1982, 30, 203 CrossRef.
- M. J. Frisch, G. W. Trucks, H. B. Schlegel, G. E. Scuseria, M. A. Robb, J. R. Cheeseman, G. Scalmani, V. Barone, B. Mennucci, G. A. Petersson, H. Nakatsuji, M. Caricato, X. Li, H. P. Hratchian, A. F. Izmaylov, J. Bloino, G. Zheng, J. L. Sonnenberg, M. Hada, M. Ehara, K. Toyota, R. Fukuda, J. Hasegawa, M. Ishida, T. Nakajima, Y. Honda, O. Kitao, H. Nakai, T. Vreven, J. A. Montgomery Jr, J. E. Peralta, F. Ogliaro, M. Bearpark, J. J. Heyd, E. Brothers, K. N. Kudin, V. N. Staroverov, R. Kobayashi, J. Normand, K. Raghavachari, A. Rendell, J. C. Burant, S. S. Iyengar, J. Tomasi, M. Cossi, N. Rega, J. M. Millam, M. Klene, J. E. Yazyev, J. E. Knox, J. B. Cross, V. Bakken, C. Adamo, J. Jaramillo, R. Gomperts, R. E. O. Stratmann, A. J. Austin, R. Cammi, C. Pomelli, J. W. Ochterski, R. L. Martin, K. Morokuma, V. G. Zakrzewski, G. A. Voth, P. Salvador, J. J. Dannenberg, S. Dapprich, A. D. Daniels, O. Farkas, J. B. Foresman, J. V. Ortiz, J. Cioslowski and D. J. Fox, GAUSSIAN 09, Revision A.1, GAUSSIAN, Inc., Wallingford CT, 2009 Search PubMed.
- H. B. Schlegel, Optimization of equilibrium geometries and transition structures, J. Comput. Chem., 1982, 3, 214e218 CrossRef.
- National Institute of Standards and Technology (NIST). Computational Chemistry Comparison and Benchmark Database: Precomputed Vibrational Scaling Factors Search PubMed.
- E. Runge and E. K. U. Gross, Density-functional theory for time-dependent systems, Phys. Rev. Lett., 1984, 52, 997e1000 CrossRef.
- N. M. O'Boyle, A. L. Tenderholt and M. K. Langner, J. Comput. Chem., 2008, 295, 839 CrossRef PubMed.
- R. Dennington, T. Keith and J. Millam, GaussView. Journal of Semi Chemical Inorganic, 2009, vol. 5, p. 8 Search PubMed.
- F. Saad, T. M. Al-Shaikh, F. Zouidi, M. A. Taher, S. A. Saidi and K. Hamden, Betalain-Enriched Beetroots Exhibit Antiulcer and Anti-Inflammatory Potentials, J. Food Process. Preserv., 2023, 2023, 9522830 Search PubMed.
- S. A. Saidi, T. M. Al-Shaikh and K. Hamden, Evaluation of Gastroprotective Effect of Betalain-Rich Ethanol Extract from Opuntia Stricta Var. Dillenii Employing an In Vivo Rat Model, J. Food Qual., 2023, 2023, 2215454 Search PubMed.
- P. P. Bradley, D. A. Priebat, R. D. Christensen and G. Rothstein, Measurement of Cutaneous Inflammation: Estimation of Neutrophil Content with an Enzyme Marker, J. Invest. Dermatol., 1982, 78, 206–209 CrossRef CAS PubMed.
- A. Buege and S. D. Aust, Microsomal Lipid Peroxidation. in Methods in Enzymology, Elsevier, 1978, vol. 52, pp. 302–310, ISBN 0076-6879 Search PubMed.
- I. D. Brown, Acta Crystallogr., 1976, A32, 24–31 CrossRef.
- K. C. Nakamoto, Infrared and Raman Spectra of Inorganic and Coordination Compounds, Part A, 5th edn, 1997 Search PubMed.
- A. Tounsi, B. Hamdi, R. Zouari and A. B. Salah, DFT (B3LYP/LanL2DZ), non-linear optical and electrical studies of a new hybrid compound: [C6H10(NH3)2]CoCl4·H2O, Phys. E, 2016, 84, 384–394 CrossRef CAS.
- K. Azouzi, B. Hamdi, R. Zouari and A.-B. Salah, Ionics, 2016, 22, 1669–1680 CrossRef CAS.
- M. A. Spackman and J. McKinnon, CrystEngComm, 2002, 4, 378 RSC.
- P. Manna, S. K. Seth, A. Das, J. Hemming, R. Prendergast, M. Helliwell, S. R. Choudhury, A. Frontera and S. Mukhopadhyay, Inorg. Chem., 2012, 51, 3557 CrossRef CAS PubMed.
- J. Sivaraman, K. Subramanian, D. Velmurugan, E. Subramanian and K. Balakrishna, Structure of vicogenin, Acta Crystallogr., Sect. C: Cryst. Struct. Commun., 1993, 49(6), 1240–1242 CrossRef.
- I. B. Saad, N. Hannachi, T. Roisnel and F. Hlel, J. Adv. Dielectr., 2019, 9(5), 1950040 CrossRef.
- M. Hamdi, A. Oueslati, I. Chaabane and F. Hlel, Condens. Matter Phys., 2012, 750497, 1 Search PubMed.
- Z.-H. Gan, N. Ni, J.-Y. Liang, C.-H. Liu, W.-X. Zheng, L. M. Yang and J.-R. Zhou, Polyhedron, 2018, 158, 408 CrossRef.
- J. Wang, X. Deng, F. Zhang, D. Chen and W. Ding, ZnO nanoparticle-induced oxidative stress triggers apoptosis by activating JNK signaling pathway in cultured primary astrocytes, Nanoscale Res. Lett., 2014, 9, 117 CrossRef PubMed.
- L. Merker and H. Wondratschek, Fortschr. Mineral., 1957, 35, 45–46 CAS.
- D. G. Samsonenko, O. A. Greas'ko, T. V. Mit'kina, J. Lipkowski, A. V. Virovets, D. Fenske and V. P. Fedin, Coord. Chem., 2003, 29, 178 Search PubMed.
- I. B. Saad, N. Hannachi, T. Roisnel and F. Hlel, J. Adv. Dielectr., 2019, 9(5), 1950040 CrossRef.
- R. Cervini, X. Li, G. Spencer, A. Holmes, S. Moratti and R. Friend, Synth. Met., 1997, 84, 359–360 CrossRef CAS.
- F. Hcini, S. Hcini, B. Alzahrani, S. Zemni and M. L. Bouazizi, Appl. Phys. A, 2020, 126, 362 CrossRef CAS.
- K. W. Wagner, Ann. Phys., 1913, 4, 817 CrossRef.
- K. C. Kao, Dielectric Phenomena in Solids, Elsevier, Amsterdam, 2004 Search PubMed.
- S. Singh, G. Banappanavar and D. Kabra, ACS Mater. Lett., 2020, 5, 728 CAS.
- W. Wan, J. Luo, C. Huang, J. Yang, Y. Feng, W.-X. Yuan, Y. Ouyang, D. Chen and T. Qiu, Ceram. Int., 2018, 44, 5086–5092 CrossRef CAS.
- H. Nefzi, F. Sediri, H. Hamzaoui and N. Gharbi, Mater. Res. Bull., 2013, 48, 1978 CrossRef CAS.
- B. Louati, K. Guidara and M. Gargouri, J. Alloys Compd., 2009, 472, 347–351 CrossRef CAS.
- M. D. Migahed, N. A. Bakr, M. I. Abdel-Hamid, O. El-Hanafy and M. El-Nimr, J. Appl. Polym. Sci., 1996, 59, 655–662 CrossRef CAS.
- A. K. Pradhan, S. Saha and T. K. Nath, Appl. Phys. A, 2017, 123, 715 CrossRef.
- G. C. Psarras, E. Manolakaki and G. M. Tsangaris, Composites, Part A, 2003, 34, 1187 CrossRef.
- A. Singh, H. P. Gogoi and P. Barman, Comparative Study of Palladium (II) Complexes Bearing Tridentate ONS and NNS Schiff Base Ligands: Synthesis, Characterization, DFT Calculation, DNA Binding, Bioactivities, Catalytic Activity, and Molecular Docking, Polyhedron, 2022, 221, 115895 CrossRef CAS.
- H. Kargar, V. Torabi, A. Akbari, R. Behjatmanesh-Ardakani and M. N. Tahir, Synthesis, Characterization, Crystal Structure and DFT Studies of a Palladium (II) Complex with an Asymmetric Schiff Base Ligand, J. Mol. Struct., 2019, 1179, 732–738 CrossRef CAS.
- L. Toma, G. M. Sanda, L. S. Niculescu, M. Deleanu, A. V. Sima and C. S. Stancu, Phenolic Compounds Exerting Lipid-Regulatory, Anti-Inflammatory and Epigenetic Effects as Complementary Treatments in Cardiovascular Diseases, Biomolecules, 2020, 10, 641 CrossRef CAS PubMed.
- T. Behl, T. Upadhyay, S. Singh, S. Chigurupati, A. M. Alsubayiel, V. Mani, C. Vargas-De-La-Cruz, D. Uivarosan, C. Bustea and C. Sava, Polyphenols Targeting MAPK Mediated Oxidative Stress and Inflammation in Rheumatoid Arthritis, Molecules, 2021, 26, 6570 CrossRef CAS PubMed.
|
| This journal is © The Royal Society of Chemistry 2024 |
Click here to see how this site uses Cookies. View our privacy policy here.  Open Access Article
 c,
Mohamed Hamdi
 *d,
Kais Elghnijie,
Jeanneau Erwannf,
Khaled Hamden
 g,
Abderrazek Oueslati
 h and
Houcine Naïli
 *a
*a
![[1 with combining macron]](https://www.rsc.org/images/entities/char_0031_0304.gif) of the triclinic system. The density functional theory method at the B3LYP/Lan2mb basis set level was employed to establish the optimized geometry and vibrational frequencies of the title compound. An acceptable correspondence was observed between the results obtained through calculation and the experimental data, including the structure, and IR spectra. The optical characteristics revealed a direct band gap energy of 2.35 eV, validating the semiconductor characteristics of this new material. The results suggest strong agreement with the experimental data and validate the involvement of metal orbitals in defining the HOMO–LUMO boundary. Simultaneous TGA-DTA shows that this material remains solid up to 210 °C. Beyond these temperatures, a gradual decomposition process occurs, extending up to 440 °C and unfolding in several steps. This process entails the liberation of diverse compounds, encompassing organic molecules, and the evaporation of chlorine ions, ultimately leading to the formation of palladium oxide (PdO) as the final product. When given to rats with gastric ulcers at a dose of 100 mg kg−1, these compounds inhibit the key enzyme responsible for neutrophil infiltration as myeloperoxidase (MPO) by 38.7%. The compound also alleviates cellular damage induced by free radicals, demonstrated by a notable 48.3% decrease in thiobarbituric acid reactive substance rates (TBARS) compared to untreated rats. Additionally, these compounds bring about a substantial 30.6% reduction in the surface area of ulcers.
of the triclinic system. The density functional theory method at the B3LYP/Lan2mb basis set level was employed to establish the optimized geometry and vibrational frequencies of the title compound. An acceptable correspondence was observed between the results obtained through calculation and the experimental data, including the structure, and IR spectra. The optical characteristics revealed a direct band gap energy of 2.35 eV, validating the semiconductor characteristics of this new material. The results suggest strong agreement with the experimental data and validate the involvement of metal orbitals in defining the HOMO–LUMO boundary. Simultaneous TGA-DTA shows that this material remains solid up to 210 °C. Beyond these temperatures, a gradual decomposition process occurs, extending up to 440 °C and unfolding in several steps. This process entails the liberation of diverse compounds, encompassing organic molecules, and the evaporation of chlorine ions, ultimately leading to the formation of palladium oxide (PdO) as the final product. When given to rats with gastric ulcers at a dose of 100 mg kg−1, these compounds inhibit the key enzyme responsible for neutrophil infiltration as myeloperoxidase (MPO) by 38.7%. The compound also alleviates cellular damage induced by free radicals, demonstrated by a notable 48.3% decrease in thiobarbituric acid reactive substance rates (TBARS) compared to untreated rats. Additionally, these compounds bring about a substantial 30.6% reduction in the surface area of ulcers.![[thin space (1/6-em)]](https://www.rsc.org/images/entities/char_2009.gif) :
:![[thin space (1/6-em)]](https://www.rsc.org/images/entities/char_2009.gif) 1], a solution of 3-(aminomethyl)pyridine (C6H8N2) (2 mmol) and a solution of palladium chloride [PdCl2] (1 mmol) previously dissolved in 10 ml of distilled water with a small amount of hydrochloric acid present. The blend was stirred magnetically for 10 minutes at room temperature, leading to the creation of homogeneous solutions. The reaction sequence for the synthesis is shown in the following schema (Scheme 1).
1], a solution of 3-(aminomethyl)pyridine (C6H8N2) (2 mmol) and a solution of palladium chloride [PdCl2] (1 mmol) previously dissolved in 10 ml of distilled water with a small amount of hydrochloric acid present. The blend was stirred magnetically for 10 minutes at room temperature, leading to the creation of homogeneous solutions. The reaction sequence for the synthesis is shown in the following schema (Scheme 1).
![[thin space (1/6-em)]](https://www.rsc.org/images/entities/char_2009.gif) 853 reflections were recorded, of which 2682 independent reflections, 2179 having intensity I > 2σ(I). The different structural parameters: atomic positions, isotropic (Uiso) or anisotropic (Uaniso) displacement parameters, and statistical occupancy of crystallographic sites, the refinement of these parameters utilized the least squares method applied to the square of the modulus of the structure factors |F2|. The structure was solved with SHELXS-97 (ref. 20) and refined using SHELXL-97(ref. 21) all of which were used with the WINGX software.22 The hydrogen atom positions of the protonated amine [C6H10N2]2+ were fixed geometrically using the HFIX option included in SHELXL-97.21 The molecular structure drawing was constructed using Diamond 3.2.23 The final values of the unweighted and weighted reliability factors are R1 = 0.056 and wR2 = 0.159 respectively. The recording conditions and refinement results are summarized in Table 1 and 2 summarizes the atomic coordinates, equivalent thermal stirring factors (Ueq.) of the compound, and the equivalent thermal stirring factors and anisotropy are given in Table 3.
853 reflections were recorded, of which 2682 independent reflections, 2179 having intensity I > 2σ(I). The different structural parameters: atomic positions, isotropic (Uiso) or anisotropic (Uaniso) displacement parameters, and statistical occupancy of crystallographic sites, the refinement of these parameters utilized the least squares method applied to the square of the modulus of the structure factors |F2|. The structure was solved with SHELXS-97 (ref. 20) and refined using SHELXL-97(ref. 21) all of which were used with the WINGX software.22 The hydrogen atom positions of the protonated amine [C6H10N2]2+ were fixed geometrically using the HFIX option included in SHELXL-97.21 The molecular structure drawing was constructed using Diamond 3.2.23 The final values of the unweighted and weighted reliability factors are R1 = 0.056 and wR2 = 0.159 respectively. The recording conditions and refinement results are summarized in Table 1 and 2 summarizes the atomic coordinates, equivalent thermal stirring factors (Ueq.) of the compound, and the equivalent thermal stirring factors and anisotropy are given in Table 3.
![[1 with combining macron]](https://www.rsc.org/images/entities/char_0031_0304.gif)
![[thin space (1/6-em)]](https://www.rsc.org/images/entities/char_2009.gif)

![[1 with combining macron]](https://www.rsc.org/images/entities/char_0031_0304.gif) , with lattice parameters as provided below: a = 7.720(8) Å; b = 7.794(8) Å; c = 9.597(9) Å; α = 81.799(8)°; β = 83.134(8)°; γ = 66.739(10)° and Z = 1.
, with lattice parameters as provided below: a = 7.720(8) Å; b = 7.794(8) Å; c = 9.597(9) Å; α = 81.799(8)°; β = 83.134(8)°; γ = 66.739(10)° and Z = 1.


 are determined from the cyclic voltammetry (CV) measurements using the following equations:48
 between HOMO–LUMO energy levels is 1.32 eV. The complex's oxidation and reduction characteristics explains the stability of the metal ion.


 implying an escalating loss in the resistive properties of the sample.
 and then rapidly declining, as illustrated in this graph. As the temperature rises, the peak shifts towards higher frequencies, suggesting the occurrence of a relaxation process. At low frequencies, M′′ values approach zero, indicating that the electrode influence can be ignored.55 The approximation of the imaginary part of M′′(ω) is proposed by Bregman:56
 occurs, and β suggests the importance of coupling between mobile ions in the conduction process, falling within the range of (0–1). To understand the effects of clear grain and grain boundaries, we utilized master modulus spectra in M′′ = f(M′). Fig. 18 exhibits the complex modulus spectrum of (C6H10N2)2 [PdCl6]·2H2O at specified temperatures. It reveals a multiple semicircular arc, with the point of intersection on the real axis signifying the capacitive contribution of the grains. The arcs overlapped, creating a curve, suggesting that the underlying conduction mechanism remains unchanged.

![[1 with combining macron]](https://www.rsc.org/images/entities/char_0031_0304.gif) .
.


