 Open Access Article
Creative Commons Attribution 3.0 Unported Licence
Intense interaction between biochar/g-C3N4 promotes the photocatalytic performance of heterojunction catalysts
Rundong Maab,
Yihui Sun c,
Hui Zhangc,
Jie Zhuc,
Han Tiana,
Xiong Guoc,
Ruifen Wangc,
Xiangzhi Cui
 *a,
Xinmei Hou
 b and
Shengli Anc
aShanghai institute of Ceramics, Chinese Academy of Sciences, Shanghai, China. E-mail: cuixz@mail.sic.ac.cn
bBeijing University of Science and Technology, Carbon Neutrality Institute, Beijing, China
cSchool of Materials and Metallurgy Inner Mongolia University of Science and Technology, Baotou, China
First published on 19th June 2024
Abstract
In recent decades, environmental protection and energy issues have gained significant attention, and the development of efficient, environmentally friendly catalysts has become especially crucial for the advancement of photocatalytic technology. This study employs the sintering method to produce biochar. A hybrid photocatalyst for the degradation of RHB under visible light was prepared by loading varying proportions of biochar onto g-C3N4 using ultrasonic technology. Among them, 2% CGCD (2% biochar/g-C3N4) achieved a degradation rate of 91.3% for RHB after 30 minutes of visible light exposure, which was more than 25% higher than GCD (g-C3N4), and exhibited a higher photocurrent intensity and lower impedance value. The enhancement in photocatalytic activity is primarily attributed to the increased utilization efficiency of visible light and the electron transfer channel effect from a minor amount of biochar, effectively reducing the recombination of photo-generated charge carriers on the g-C3N4 surface, thereby significantly improving photocatalytic activity. The degradation of RHB is synergistically mediated by O2−, h+ (photo-generated holes), and ˙OH. The free radical capture experiment indicates that O2− and ˙OH are the primary active components, followed by h+.
Introduction
With the rapid development of the global economy and technology, the accompanying environmental pollution and energy crisis have become focal points of human concern. In the vast energy system of nature, solar energy is inexhaustible, which also propels the advancement of cutting-edge fields such as the semiconductor industry and photovoltaic technology. Among them, photocatalysis technology utilizes solar energy as its energy source, effectively addressing the energy crisis.1–3 Therefore, the key to photocatalysis technology lies in the development of low-cost, efficient, and stable photocatalysts.Graphite phase carbon nitride (g-C3N4) is an excellent N-type semiconductor with stable physical and chemical properties, high surface charge density, which makes it easier to modify and regulate.4 Its two-dimensional layered structure similar to graphene gives it a large specific surface area, which also lays a good advantage in the field of photocatalysis.5,6 However, g-C3N4 suffers from poor visible light absorption ability, large bandgap width, and high recombination rate of photo generated charge carriers, greatly limiting its effective application in the field of photocatalysis.7,8 At present, many researchers have carried out a series of modification works on g-C3N4,9–11 such as microstructure control, heterojunction loading/construction, element doping, etc.12,13 Dai et al. prepared g-C3N4/Ag3VO4 composite materials containing Ag nanoparticles using chemical deposition method, and tested the photocatalytic degradation effect of MB under visible light. The results showed that the optimal photocatalytic performance was achieved when the ratio of Ag3VO4 to g-C3N4 was 5![[thin space (1/6-em)]](https://www.rsc.org/images/entities/char_2009.gif) :
:![[thin space (1/6-em)]](https://www.rsc.org/images/entities/char_2009.gif) 2. The improvement of photocatalytic performance of composite materials is due to the strong coupling heterojunction formed between Ag3VO4 and g-C3N4. In addition, the porous structure of g-C3N4 and the surface plasmon resonance (SPR) effect of Ag accelerate the separation and transport of photo induced electron hole pairs, and effectively reduce carrier recombination.14 The composite modification of noble metal nanoparticles and ion doping can effectively reduce the recombination rate of g-C3N4 carrier and greatly improve photocatalytic efficiency. However, the preparation of this type of composite catalyst typically requires electrochemical deposition and hydrothermal methods, which may increase the cost of catalyst preparation and reduce the yield of the catalyst. Meanwhile, charge transfer at heterogeneous interfaces is often considered an important reason for the improvement of catalyst activity, and there is currently limited progress in this research.
2. The improvement of photocatalytic performance of composite materials is due to the strong coupling heterojunction formed between Ag3VO4 and g-C3N4. In addition, the porous structure of g-C3N4 and the surface plasmon resonance (SPR) effect of Ag accelerate the separation and transport of photo induced electron hole pairs, and effectively reduce carrier recombination.14 The composite modification of noble metal nanoparticles and ion doping can effectively reduce the recombination rate of g-C3N4 carrier and greatly improve photocatalytic efficiency. However, the preparation of this type of composite catalyst typically requires electrochemical deposition and hydrothermal methods, which may increase the cost of catalyst preparation and reduce the yield of the catalyst. Meanwhile, charge transfer at heterogeneous interfaces is often considered an important reason for the improvement of catalyst activity, and there is currently limited progress in this research.
Owing to the low loading/doping costs, as well as their ease of scaling up and industrialization.15 Carbon-based functional materials are playing a vital role in environmental protection, electrochemistry, and photocatalysis,16 with vast research opportunities ahead.
Biochar is the product of high-temperature pyrolysis of biomass under anaerobic conditions. Due to its low cost, environmental friendliness, and ease of preparation, biochar has also been widely used in various research fields, such as catalysis and the adsorption of heavy metal ions in soil.17,18 The graphite structure in biochar also endows it with good photoelectric properties. Luo et al. prepared tea residue biochar/g-C3N4 composite photocatalyst using high-temperature calcination method for reducing uranium in water.19 The results show that the removal rate of U(VI) by the composite photocatalyst TBC/g-C3N4 composite material can reach 99.64%, which is much higher than that of pure g-C3N4 (58.8%). The photogenerated electrons on the conduction band of g-C3N4 transitioning to TBC can effectively delay the recombination of g-C3N4 photogenerated carriers.20 Wang et al. prepared magnetism γ−. The catalytic performance of Fe2O3/O2-g-C3N4/BC composite material was tested. The results showed that the composite photocatalyst can rapidly and completely degrade the antibiotic sulfamethoxazole (SMX), with a mineralization rate of up to 62.3%. Sulfates and hydroxyl radicals are the main species in photocatalytic reactions.21
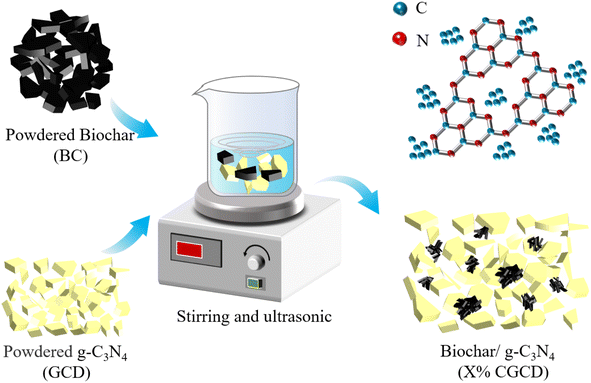
In this article, we prepared biochar using calcination method under anaerobic conditions, and prepared biochar/g-C3N4 (x% CGCD, x = 1, 2, 3, 5) composite catalyst with easy amplification and simple operation using ultrasonic composite method. Then, we characterized the microstructure of the prepared catalyst, tested its photoelectrochemical properties, and applied the catalyst to the degradation of RHB. The characteristics and advantages of composite catalysts were comprehensively analyzed from the perspectives of charge transfer, utilization of light and bandgap transformation, as well as the degradation mechanism of RhB.
Results and discussion
Powder biochar preparation
Put 300 g of wheat straw powder sieved with a 100-mesh sieve into a cylindrical crucible, fill the muffle furnace with heat-resistant bricks, and fix the crucible to maintain its airtightness. Gradually increase the temperature to 500 °C at a rate of 3 °C min−1 and hold for 2 hours, then remove the sample and label the resulting black powder (biochar) as BC. Soak and clean the black biochar powder BC obtained by washing with 2 M hydrochloric acid, and further wash repeatedly with ethanol and deionized water.Powder g-C3N4 preparation
Weigh 40 grams of urea (CH4N2O), place it in a 200 milliliter corundum crucible, seal it with tin foil, and place it in a muffle furnace. Gradually heat it up to 550 °C at a heating rate of 5 °C min−1, maintain it for 240 minutes, and cool naturally to room temperature. Take out the sample and grind it thoroughly to obtain a light-yellow powder of g-C3N4, which is labeled as GCD.Composite photocatalysts preparation
As shown in Fig. 1, the biochar to g-C3N4 ratios is adjusted to 1, 2, 3, and 5![[thin space (1/6-em)]](https://www.rsc.org/images/entities/char_2009.gif) :
:![[thin space (1/6-em)]](https://www.rsc.org/images/entities/char_2009.gif) 100, respectively. The particles were dispersed in 30 mL of ethanol and 40 mL of deionized water using ultrasound for 2 hours, then stirred with a magnetic stirrer for 2 hours to obtain a biochar/g-C3N4 composite photocatalyst, denoted as X% CGCD (X = 1, 2, 3, 5).
100, respectively. The particles were dispersed in 30 mL of ethanol and 40 mL of deionized water using ultrasound for 2 hours, then stirred with a magnetic stirrer for 2 hours to obtain a biochar/g-C3N4 composite photocatalyst, denoted as X% CGCD (X = 1, 2, 3, 5).
Photocatalytic experiment design
Activity testing
Adding 30 mg of photocatalyst to 50 mL of RHB solution with a concentration of 20 mg L−1, stirring the photocatalyst under no light conditions for 30 minutes to achieve adsorption desorption equilibrium, and absorb the supernatant to measure its absorbance A. Open the visible light disc (with a light intensity of 260 mW cm−2) for degradation experiments, and extract 4 mL of the upper clear liquid every 10 minutes before centrifugation for 10 minutes. Test its A value at 554 nm and take a total of 7 samples. The degradation efficiency of RHB is measured by the following formula.| η = (A0 − A)/A0 × 100% = (C0 − C)/C0 × 100% | (1) |
In the eqn (1), η represents the photocatalytic degradation efficiency, A0 represents the initial absorbance of RHB, A represents the absorbance at the time of sample removal, C0 is the initial concentration, C is the concentration value of RHB at different time periods. Typically, A value is the absorbance of RHB at 554 nm, which is the maximum absorbance of RHB solution. This is also used to distinguish RHB from other organic compounds. The photocatalytic performance of the sample was tested using the Beijing Perfect light PCX-50C multi-channel photochemical reactor, with a light intensity of 260 mW cm−2.
Cyclic performance testing and free radical capture experiment
The remaining suspension in the reaction flask after the light dark reaction is collected, filtered, washed, and then collected for the second photocatalytic reaction experiment. The reaction stability of the catalyst is evaluated by a total of five cycles of tests. 30 mg BQ (O2−), 30 mg KI (h+), and 20 mL TBA (˙ OH) free radical collectors are added to participate in the carrier capture experiment, and further explore the mechanism of the photocatalytic reaction.Crystalline phase and morphology of materials
The XRD diagram of the sample is shown in Fig. 2. Among them, Fig. 2a shows the XRD diagram of wheat straw biochar. Biochar without acid washing, ethanol, and deionized water treatment contains a large amount of ash and exhibits high diffraction peaks. From the perspective of composition, the ash is mainly composed of inorganic salts and some metal elements. After acid washing treatment, the diffraction peak of amorphous at around 22° of wheat straw biochar is more obvious, indicating a more orderly and compact arrangement of its C structure. The diffraction peak at around 27° is the (002) crystal plane of graphite, which is likely the ordered carbon crystal structure after cellulose combustion. Fig. 2b shows the XRD spectrum of the composite photocatalyst. The characteristic peaks around 13.1° and 27.3° represent the in-plane stacking and interlayer stacking of triazine rings in g-C3N4, respectively.22,23 From the graph, it can be observed that as the amount of biochar introduced increases, the spacing between the (002) crystal planes of g-C3N4 decreases, and the half peak width increases, meanwhile, the diffraction peak of the (002) crystal plane of g-C3N4 shifts towards higher angles. Which suggest there may be a strong interaction between biochar and g-C3N4, leading to a significant reduction in the interplanar spacing of g-C3N4 and grain refinement, which in turn diminishes agglomeration in g-C3N4.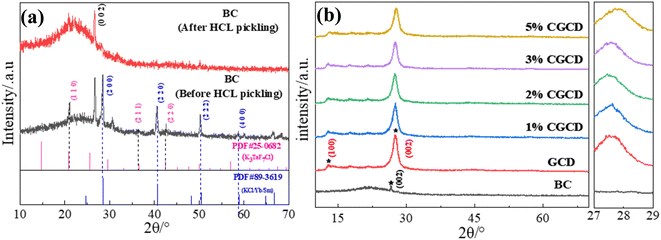 | ||
| Fig. 2 XRD spectra of different samples. (a) XRD comparison of wheat straw biochar before and after acid leaching; (b) XRD patterns of different samples. | ||
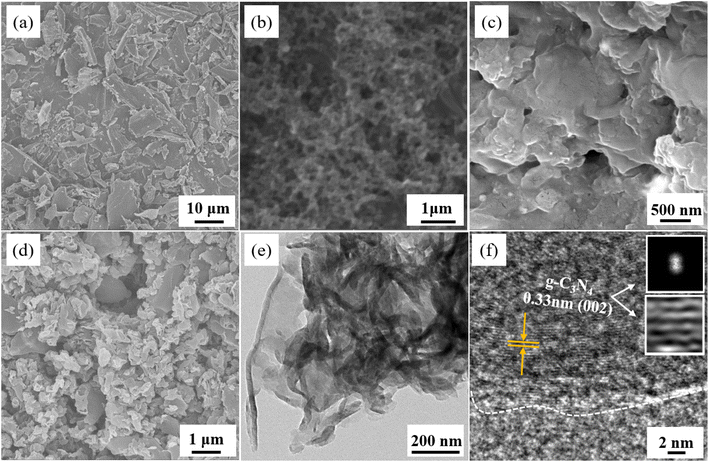
Fig. 3 shows the SEM and HR-TEM images of different samples. Wherein, Fig. 3a shows the powdered biochar obtained by direct grinding after calcination and preparation, which presents an irregular block shape; Fig. 3b shows the biochar washed via HCL, and its surface exposes a rich microporous structure, which indicates that the corrosion of hydrochloric acid can effectively increase the specific surface area of biochar. Fig. 3c shows the microscopic morphology of g-C3N4 (GCD). The results indicate that the sample exhibits a block/layered structure formed via the stacking of nanosheets, which is formed via the gradual stacking and recombination of g-C3N4 molecules. Fig. 3d shows the microstructure of 2% CGCD, which can be seen to be formed via the continuous stacking of nanoparticles or nanosheets of varying sizes. Fig. 3e and f shows the HR-TEM images of 2% CGCD, and it can be observed that the sample after ultrasonic treatment still maintains a nanosheet morphology. In Fig. 3f, lattice stripes on the (002) crystal plane of g-C3N4 in the composite sample can be observed, with a crystal plane spacing of 0.33 nm. This also proves the good mechanical stability of g-C3N4, which is consistent with the analysis of XRD results.
The functional groups of the sample were characterized using FT-IR spectroscopy. As depicted in Fig. 4a, the reflection peak at 2820 cm−1 is attributed to the stretching vibration of the relevant N–H bonds, which belong to the non-condensed NH2 groups.24,25 The reflection peak at 3500 cm−1 is due to the vibration (surface adsorption) of hydroxyl (−OH) in the associated state,26 likely resulting from the adsorbed oxygen formed by the sample's interaction with ethanol and water molecules during ultrasonic treatment. This peak range is absent in the biochar's spectral profile, likely attributed to the binding of H+ with surface hydroxyl groups during the acid leaching process, or it may be related to the size of biochar pores. As shown in Fig. 4b, it is observed that as the biochar dosage increases, the intensity of the absorption peak at 1600 cm−1 of the heptane triazole ring varies, signifying that the introduction of biochar alters the chemical environment surrounding g-C3N4, indicating successful composite formation between the two samples.
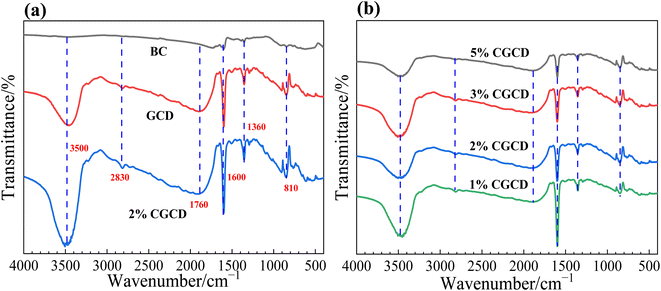 | ||
| Fig. 4 FT-IR spectra of different samples; (a) FT-IR diagrams of different samples before and after recombination; (b) FT-IR spectra of composite photocatalysts. | ||
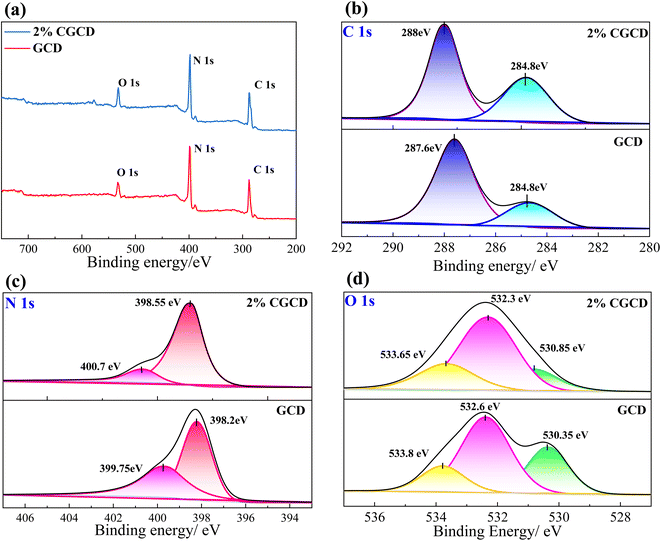
The surface elemental composition of GCD and 2% CGCD was analysed by using XPS. Fig. 5a displays the total spectrum of the photocatalyst, revealing three elements, C, N, and O, in the XPS spectrum. Notably, 2% CGCD has a larger O peak area, indicating an increase in oxygen atoms adsorbed on the surface of the composite sample. Fig. 5b shows the spectral peak of the C 1s energy level in the sample. Among them, the binding energy at 287.6 eV corresponds to the N–C![[double bond, length as m-dash]](https://www.rsc.org/images/entities/char_e001.gif) N characteristic peak of sp2 hybrid C in GCD, the peak at 398.2 eV in Fig. 5c corresponds to the C
N characteristic peak of sp2 hybrid C in GCD, the peak at 398.2 eV in Fig. 5c corresponds to the C![[double bond, length as m-dash]](https://www.rsc.org/images/entities/char_e001.gif) N–C structure in GCD,27 and the peak at 399.75 eV corresponds to the –NH2 group of non-polymerizations, which together form triazine ring structural units. From Fig. 5b and c, it can be seen that in the composite sample, all three peaks shift towards higher chemical shifts, indicating the presence of charge transfer on the surface of the triazine ring, which mainly shows a trend of losing electrons. This indicates that biochar, as a charge transfer channel, can attract electrons from the conduction band of GCD, and the two exhibit strong interactions. As shown in Fig. 5d, the positions at 530.35 eV, 532.6 eV, and 533.8 eV correspond to the C
N–C structure in GCD,27 and the peak at 399.75 eV corresponds to the –NH2 group of non-polymerizations, which together form triazine ring structural units. From Fig. 5b and c, it can be seen that in the composite sample, all three peaks shift towards higher chemical shifts, indicating the presence of charge transfer on the surface of the triazine ring, which mainly shows a trend of losing electrons. This indicates that biochar, as a charge transfer channel, can attract electrons from the conduction band of GCD, and the two exhibit strong interactions. As shown in Fig. 5d, the positions at 530.35 eV, 532.6 eV, and 533.8 eV correspond to the C![[double bond, length as m-dash]](https://www.rsc.org/images/entities/char_e001.gif) O, C–O, and O–C (O) bonds, respectively. Among them, the C
O, C–O, and O–C (O) bonds, respectively. Among them, the C![[double bond, length as m-dash]](https://www.rsc.org/images/entities/char_e001.gif) O content in 2% CGCD is significantly lower than that in GCD, and the binding energy undergoes a red shift, indicating that ultrasound method has a destructive effect on the C
O content in 2% CGCD is significantly lower than that in GCD, and the binding energy undergoes a red shift, indicating that ultrasound method has a destructive effect on the C![[double bond, length as m-dash]](https://www.rsc.org/images/entities/char_e001.gif) O bond, which is more conducive to the recombination of BC and GCD.28
O bond, which is more conducive to the recombination of BC and GCD.28
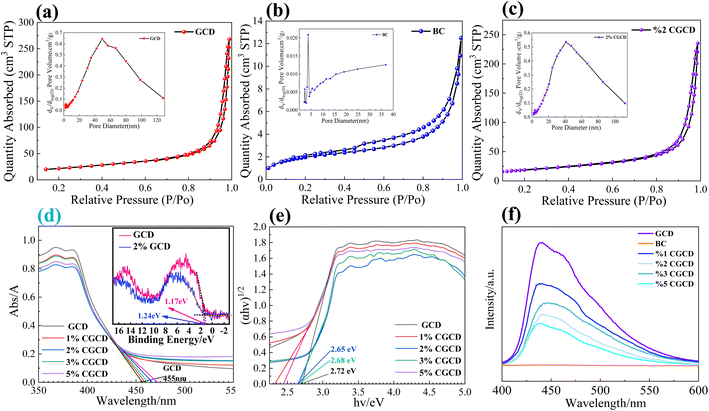
N2 adsorption desorption and pore size distribution tests were conducted on different samples. As shown in Fig. 6a–c, the pore types of powdered GCD are mostly mesoporous structures, with a pore size of approximately 48 nm; The pore size of 2% CGCD is approximately 40–50 nm, slightly larger than that of GCD. This can be attributed to the fragmentation and formation of smaller particles and nanosheets in bulk GCD under ultrasound action. BC has abundant micropores and a small amount of mesoporous structure. Among them, the pore size of the micropores is about 3–4 nm, which may be attributed to the pores left by the evaporation of water molecules during the combustion of lignin and cellulose in wheat. The mesoporous pore size is approximately 30–40 nm, which may be attributed to the collapse and merging of micropores. All three samples have hysteresis loops, and the shape of the pores is mostly H4-type fine pores formed by the stacking of layered molecules, which is consistent with the characterization results of SEM and XRD. Table 1 shows the statistical distribution of sample specific surface area. It can be observed that the specific surface area of GCD located between biochar and GCD is about 73.9 m2 g−1, and the specific surface area of the composite photocatalyst sample is about 66.7 m2 g−1. This may be related to the shortening of the spacing between GCD crystal planes in the composite sample, indicating the successful recombination of the two samples.29
| Sample name | GCD | BC | 2% CGCD |
|---|---|---|---|
| BET surface area (m2 g−1) | 73.87 | 7.10 | 66.73 |
As shown in Fig. 6d, the absorption edge of pure graphite phase carbon nitride is about 455 nm. As the amount of biochar introduced increases, the absorption band edge gradually shifts to red, indicating a significant improvement in the response of the photocatalyst to visible light. As shown in Fig. 6e, according to the formula Eg = 1240/λ, the estimated bandgap of g-C3N4 is approximately 2.72 eV. Meanwhile, according to the Tauc plot formula, a Tauc plot is drawn, which also satisfies this condition, the Tauc plot also satisfies this condition The position of the valence band (VB) and conduction band (CB) of GCD can be calculated according to formulas (2) and (3). In the formula, Ec is the dipole moment of the standard hydrogen electrode, which is 4.5 eV in value, Eg is the band gap width of the semiconductor, and ECB and EVB represent the conduction band and valence band values of the semiconductor, respectively. X is the absolute electronegativity of the semiconductor, which is numerically equal to the geometric average value of each component atom in the semiconductor. Through consulting the literature, the empirical value of XGCD is 4.73,30 and further calculation shows that its EVB and ECB are 1.13 eV and −1.59 eV, respectively. In order to further refine the band data, we conducted XPS valence band spectrum testing, the top energy of GCD's CB is 1.17 eV, which is close to the calculated value (Fig. 6d). With the increase in biochar, the band gap of the composite photocatalyst is shorter than that of pure g-C3N4, and the absorption band edge is gradually red shifted, indicating that the introduction of biochar enhances the response of the g-C3N4 system to visible light, and shortens its band gap, which is more conducive to the transition of photogenerated carriers and increases the charge density of the catalyst surface, thus improving the activity of the photocatalyst.
| ECB = X − EC − Eg/2 | (2) |
| EVB = ECB + Eg | (3) |
The recombination of photo-generated carriers in the sample was analysed via PL fluorescence spectroscopy. As shown in Fig. 6f, when visible light's energy is greater than the sample bandgap used to irradiate the sample, the photo-generated electrons undergo energy level transitions. When photo-generated charge carriers recombine, some of the energy is released in the form of phonons, manifested as lattice vibrations, while the other part is released in the form of photons (fluorescence).31 From the figure, it can be seen that with an excitation of 370 nm wavelength light, the carrier recombination rate of 2% CGCD is significantly lower than that of pure graphite phase carbon nitride. Biochar does not produce fluorescence in this band, indicating that the introduction of biochar significantly reduces the recombination of g-C3N4 carriers, which helps to efficiently carry out photocatalytic reactions.
Photocatalytic performance test
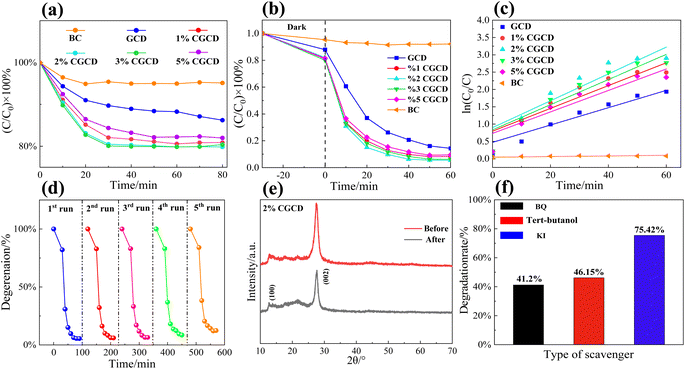
Evaluate the reaction activity of photocatalysts based on the degradation rate of RHB. Firstly, we tested the adsorption activity of different samples on RHB, and the catalyst dosage and dye concentration in this adsorption experiment were the same as those in the photocatalytic activity experiment. As shown in Fig. 7a, with the passage of reaction time, RHB is gradually adsorbed by the catalyst. When the reaction time is 30 minutes, all samples are close to adsorption equilibrium, and the degradation rate of RHB no longer changes significantly with time. Based on the results of adsorption experiments, the photocatalytic activity of different samples was tested. As shown in Fig. 7b, the degradation efficiency of RHB by different samples is 2% CGCD > 3% CGCCD > 1% CGCCD > 5% CGCCD > GCD. Among them, 2% CGCD reacted under light for 30 minutes, and the degradation rate of RHB was 91.3%, which was 25% higher than GCD. The composite sample exhibits stronger photocatalytic activity than GCD, which may be due to the introduction of biochar enhancing the catalyst's absorption of visible light and improving the utilization efficiency of visible light. This may also be due to the shortened bandgap of the composite sample, the reduced resistance of the photo to the generated electronic transitions, and the increased surface charge density of the composite sample. It is worth noting that g-C3N4 composite with biochar exhibited excellent degradation effects on RhB during the dark reaction stage, which means electrons in g-C3N4 transfer to biochar and are in a charge deficient state, which also helps to enhance the oxidation of g-C3N4 and enhance the oxidation reaction with the adsorbed RhB, thereby accelerating the adsorption degradation kinetics of RhB.32 Meanwhile, crystalline graphite in biochar can also serve as a charge transfer channel, promoting the spatial separation of photo generated charges at the conduction band of GCD, thereby reducing the recombination rate of photo generated carriers in GCD and placing GCD in a charge deficient state, enhancing its oxidizing ability. The degradation reaction data was fitted using quasi first-order kinetic linear regression, and the results are shown in Table 2 and Fig. 7c. The fitting curve is obtained from formula (4), where C0 is the initial concentration of RHB and C is the concentration of RHB at a certain moment in the hydrolysis reaction.33,34 The slope kt represents the reaction rate constant of the first-order reaction. All data fitting regression coefficients R2 are above 0.87, and the order of reaction rates is 2% CGCD > 3% CGCCD > 1% CGCCD > 5% CGCCD > BC. Overall, with the increase of biochar content, the photocatalytic efficiency of the sample first increases and then decreases. When the content of biochar is 5%, the photocatalytic efficiency of the sample decreases, which may be due to the lack of photocatalytic activity of biochar itself. The increase in its content may cover the active sites of g-C3N4 and compete with it for photo generated electrons, resulting in a light shielding effect.35| ln(C0/C) = kt + constant | (4) |
| Sample name | GCD | BC | 1% CGCD | 2% CGCD | 3% CGCD | 5% CGCD |
|---|---|---|---|---|---|---|
| Rate constant (k/min−1) | 2.53 × 10⁻² | 0.9 × 10⁻² | 3.29 × 10⁻² | 3.88 × 10⁻² | 3.63 × 10⁻² | 3.09 × 10⁻² |
| R2 | 0.929 | 0.877 | 0.914 | 0.908 | 0.925 | 0.924 |
Fig. 7d shows the cyclic performance test of 2% CGCD. After five cycles of experiments, the degradation rate of RHB in the sample can still reach 91.7%, indicating that the sample has good photocatalytic stability. The 2% CGCD sample after cycling was characterized via secondary XRD, as shown in Fig. 7e. After 5-times' cycling, the (100) and (002) crystal plane diffraction peaks of g-C3N4 in the sample did not show a red or blue shift, indicating that the sample can still maintain its stable phase structure after cycling testing. After cyclic testing, the diffraction peaks of the composite photocatalyst on the (100) and (002) crystal planes slightly decreased, which may be due to the slight damage and de-formation of the crystal state of the catalyst sample caused via ultrasound and washing. With tert-butyl alcohol, KI, and BQ as quenching agents, the photocatalytic degradation experiments of ˙ OH, h+, and O2− were carried out, respectively. As shown in Fig. 7f, after the addition of tert-butyl alcohol, potassium iodide, and p-benzoquinone, the degradation rates of RHB via the composite photocatalyst de-creased to 46.15%, 75.42%, and 41.2%, respectively. It can be concluded that the main active species in the photocatalytic degradation experiment are ˙ OH and O2−, followed by h+. Due to the negative conduction band potential of GCD, it is more conducive to the reduction reaction of surface-adsorbed O2 and the generation of active species such as O2− and ˙ OH. At the same time, GCD belongs to N-type semiconductors, and its surface has a high e− density, while the density of h+ is relatively small, which may also make its oxidation effect less obvious.36,37
To delve into the separation and recombination of charge carriers in biochar/g-C3N4 composite samples, transient chronoamperometry and electrochemical impedance spectroscopy were applied to the catalyst before and after the recombination process. As depicted in Fig. 8a, the transient current intensity of 2% CGCD is notably greater than that of GCD, implying that the composite photocatalyst boasts an outstanding level of photo-induced carrier separation, thereby facilitating carrier migration at the membrane electrode/electrolyte interface. The arc radius on the EIS spectrum is linked to the charge transfer at the interface between the working electrode and electrolyte,38 as illustrated in Fig. 8b. The arc radius of the EIS electrode reflects the charge transfer resistance in the electrode/electrolyte solution, with a larger radius corresponding to a higher charge transfer resistance. Notably, the charge transfer resistance of 2% CGCD is significantly reduced compared to that of pure graphite phase carbon nitride, indicating that the composite sample exhibits reduced electrode/electrolyte transfer resistance and enhanced charge transfer capability.
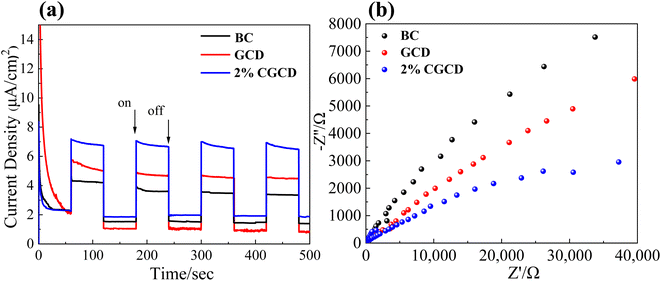 | ||
| Fig. 8 Electrochemical characterization of different samples; (a) electrochemical characterization test of composite photocatalysts; (b) electrochemical AC impedance spectroscopy. | ||
Mechanism investigation and discussion
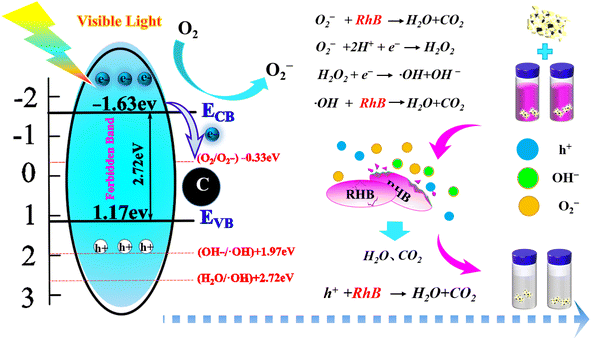
To further elucidate the reaction mechanism behind the degradation of RHB by reactants, we computed the valence band potential and conduction band potential of GCD using the energy band formula, which were found to be 1.17 eV and −1.59 eV, respectively. Photocatalytic mechanism was followed by a comprehensive analysis in conjunction with radical trapping experiments. As depicted in Fig. 9, the degradation of RHB is primarily categorized into three pathways. The first type involves redox reactions between RHB and the exposed photo-generated holes on the catalyst surface. Upon exposure to visible light, photo-generated electrons transition from the valence band of GCD to the conduction band, generating oxidative photo-generated holes. These holes, by their own oxidation properties, oxidize RHB and breaking its benzene ring and disrupting its C![[double bond, length as m-dash]](https://www.rsc.org/images/entities/char_e001.gif) C structure, ultimately mineralizing RHB into H2O and CO2.39 The second type is the reduction reaction between the reducing electrons transitioning to the conduction band in photocatalysts and the catalyst surface in solution, yielding O2− with strong redox properties. Owing to the unpaired electrons in O2−, it also exhibits strong redox characteristics and can mineralize and degrade RHB. In the third pathway, because of the N-type semiconductor properties of GCD, photo-generated electrons originate not only from the 2p orbital of C in GCD but also from the 2p orbital of N. As a result, the reduction reaction on the GCD surface is quite active, likely generating an excessive amount of O2−. O2− can also react with H+ in water, producing a strong oxidizing and non-selective hydroxyl radical (˙OH), thereby oxidizing and degrading RHB. During the degradation process of RHB, photogenerated holes, O2−, and ˙OH exhibit a synergistic effect.
C structure, ultimately mineralizing RHB into H2O and CO2.39 The second type is the reduction reaction between the reducing electrons transitioning to the conduction band in photocatalysts and the catalyst surface in solution, yielding O2− with strong redox properties. Owing to the unpaired electrons in O2−, it also exhibits strong redox characteristics and can mineralize and degrade RHB. In the third pathway, because of the N-type semiconductor properties of GCD, photo-generated electrons originate not only from the 2p orbital of C in GCD but also from the 2p orbital of N. As a result, the reduction reaction on the GCD surface is quite active, likely generating an excessive amount of O2−. O2− can also react with H+ in water, producing a strong oxidizing and non-selective hydroxyl radical (˙OH), thereby oxidizing and degrading RHB. During the degradation process of RHB, photogenerated holes, O2−, and ˙OH exhibit a synergistic effect.
Conclusions
In this article, a simple method was used to calcined corn straw into conductive biochar, and the ultrasound stirring co mixing method, which is easy to amplify, was used to prepare biochar/g-C3N4 heterojunction catalyst. Composite catalysts exhibit excellent adsorption and photocatalytic activity for RhB degradation. The strong interaction between biochar and g-C3N4 promotes the electron transfer from g-C3N4 to biochar, leaving g-C3N4 in a charge deficient state, which promotes A's strong oxidizing ability and enables more efficient degradation of RhB. Among them, biochar serves as a co-catalyst.Author contributions
The author's contributions to this article are as follows: writing – original draft: Rundong Ma. Writing – review & editing: Rundong Ma, Xiangzhi Cui, Han Tian. Funding acquisition, resources: Xiangzhi Cui. Supervision: Xiangzhi Cui, Han Tian, Ruifen Wang, Xinmei Hou, Shengli An. Formal analysis: Yihui Sun, Hui Zhang, Jie Zhu, Xiong Guo. Conceptualization: Rundong Ma, Xiangzhi Cui. We thank all authors for their contributions to this article.Conflicts of interest
There are no conflicts to declare.Acknowledgements
The authors gratefully acknowledge the support of this research by National Natural Science Foundation of China (52172110), the “Scientific and Technical Innovation Action Plan” Hong Kong, Macao and Taiwan Science & Technology Cooperation Project of Shanghai Science and Technology Committee (21520760500), Shanghai “Science and Technology Innovation Action Plan” intergovernmental international science and technology cooperation project (23520710600).References
- D. Liang, J. Wu and C. Xie, et al., Efficiently and selectively photocatalytic cleavage of C–C bond by C3N4 nanosheets: defect-enhanced engineering and rational reaction route, Appl. Catal., B, 2022, 317(4), 121690 CrossRef CAS.
- Y. Zhu, T. Wang and T. Xu, et al., Size effect of Pt co-catalyst on photocatalytic efficiency of g-C3N4 for hydrogen evolution, Appl. Surf. Sci., 2019, 464(2), 36–42 CrossRef CAS.
- Y. Zhong, C. Wu and D. Chen, et al., Design of lateral and vertical Bi4O5I2/BiOCl heterojunctions with different charge migration pathway for efficient photo redox activity, Appl. Catal., B, 2023, 329(11), 122554 CrossRef CAS.
- Y. Pang, Z. Law and S. Lim, et al., Enhanced photocatalytic degradation of methyl orange by coconut shell–derived biochar composites under visible LED light irradiation, Environ. Sci. Pollut. Res., 2021, 28(5), 27457–27473 CrossRef CAS.
- Y. Xiao, H. Liu and C. Yang, et al., Graphitic carbon nitride/biochar composite synthesized by a facile ball-milling method for the adsorption and photocatalytic degradation of enrofloxacin, J. Environ. Sci., 2021, 103(3), 93–107 CrossRef CAS.
- J. Hou, M. Yang and Q. Dou, et al., Defect Engineering in Polymeric Carbon Nitride with Accordion Structure for Efficient Photocatalytic CO2 Reduction and H2 Production, Chem. Eng. J., 2022, 450(4), 138425 CrossRef CAS.
- T. Xiao, Z. Tang and Y. Yang, et al., In situ construction of hierarchical WO3/g-C3N4 composite hollow microspheres as a Z-scheme photocatalyst for the degradation of antibiotics, Appl. Catal., B, 2018, 220(11), 417–428 CrossRef CAS.
- C. Ye, J. Li and Z. Li, et al., Enhanced Driving Force and Charge Separation Efficiency of Protonated g-C3N4 for Photocatalytic O2 Evolution, ACS Catal., 2015, 5(21), 6973–6979 CrossRef CAS.
- X. Zhang, X. Yuan and L. Jiang, et al., Powerful combination of 2D g-C3N4 and 2D nanomaterials for photocatalysis: recent advances, Chem. Eng. J., 2020, 390(12), 124475 CrossRef CAS.
- D. Huang, Z. Li and G. Zeng, et al., Megamerger in photocatalytic field: 2D g-C3N4 nanosheets serve as support of 0D nanomaterials for improving photocatalytic performance, Appl. Catal., B, 2019, 240(5), 153–173 CrossRef CAS.
- Y. Yuan, Z. Shen and S. Wu, et al., Liquid exfoliation of g-C3N4 nanosheets to construct 2D–2D MoS2/g-C3N4 photocatalyst for enhanced photocatalytic H2 production activity, Appl. Catal., B, 2019, 246(7), 120–128 CrossRef CAS.
- H. Qie, M. Ren and C. You, et al., High-efficiency control of pesticide and heavy metal combined pollution in paddy soil using biochar/g-C3N4 photo responsive soil remediation agent, Environ. Chem. Eng. J., 2023, 452(14), 107728 Search PubMed.
- M. Ai, L. Pan and Y. Chen, et al., Atomic symmetry alteration in carbon nitride to modulate charge distribution for efficient photocatalysis, J. Catal., 2023, 418(10), 22–30 CrossRef CAS.
- F. Mei, K. Dai and J. Zhang, et al., Construction of Ag SPR-promoted step-scheme porous g-C3N4/Ag3VO4 heterojunction for improving photocatalytic activity, Appl. Surf. Sci., 2019, 488(15), 151–160 CrossRef CAS.
- J. Hou, T. Jiang and X. Wang, et al., Variable dimensional structure and interface design of g-C3N4/BiOI composites with oxygen vacancy for improving visible-light photocatalytic properties, J. Clean. Prod., 2021, 287(12), 125072 CrossRef CAS.
- R. Tang, D. Gong and Y. Deng, et al., π–π stacking derived from graphene-like biochar/g-C3N4 with tunable band structure for photocatalytic antibiotics degradation via peroxymonosulfate activation, J. Hazard Mater., 2022, 423(part A), 126944 CrossRef CAS.
- J. Sun, X. Lin and J. Xie, et al., Facile synthesis of novel ternary g-C3N4/ferrite/biochar hybrid photocatalyst for efficient degradation of methylene blue under visible-light irradiation, Colloids Surf. A Physicochem. Eng. Asp., 2020, 606, 125556 CrossRef CAS.
- K. Li, Z. Huang and S. Zhu, et al., Removal of Cr(VI) from water by a biochar-coupled g-C3N4 nanosheets composite and performance of a recycled photocatalyst in single and combined pollution systems, Appl. Catal., B, 2019, 243, 386–396 CrossRef CAS.
- S. Luo, S. Li and S. Zhang, et al., Visible-light-driven Z-scheme protonated g-C3N4/wood flour biochar/BiVO4 photocatalyst with biochar as charge-transfer channel for enhanced RhB degradation and Cr(VI) reduction, Sci. Total Environ., 2022, 806, 150662 CrossRef CAS.
- S. Wang and J. Wang, Magnetic 2D/2D oxygen doped g-C3N4/biochar composite to activate peroxymonosulfate for degradation of emerging organic pollutants, J. Hazard Mater., 2022, 423(5), 127207 CrossRef CAS.
- Y. Li, X. Li and H. Zhang, et al., Design and application of active sites in g-C3N4-based photocatalysts, J. Mater. Sci. Technol., 2020, 56(1), 69–88 CrossRef CAS.
- B. Yang, J. Zhao and W. Yang, et al., A step-by-step synergistic stripping approach toward ultra-thin, porous g-C3N4 nanosheet, tests with high conduction band position for photocatalytic CO2 reduction, Colloid Interface Sci., 2021, 589(12), 179–192 CrossRef CAS.
- X. Li, X. Li and Z. Mu, et al., An Experimental Study on Biochar/Polypyrrole Coating for Blade Anti-Icing of Wind Turbines, Coatings, 2023, 13(4), 759–772 CrossRef CAS.
- X. Yang, F. Qian and G. Zou, et al., Facile fabrication of acidified g-C3N4/g-C3N4 hybrids with enhanced photocatalysis performance under visible light irradiation, Appl. Catal., B, 2016, 193(15), 22–35 CrossRef CAS.
- Z. Zhang, R. Zhou and Z. Dong, et al., Visible-light induced photocatalytic removal of U(VI) from aqueous solution by MoS2/g-C3N4 nanocomposites, Nucl. Chem., 2021, 328(2), 9–17 CrossRef CAS.
- F. Dong, Y. Sun and W. Ho, et al., Controlled synthesis, growth mechanism and highly efficient solar photocatalysis of nitrogen-doped bismuth subcarbonate hierarchical nanosheets architectures, Dalton Trans., 2012, 41(27), 8270–8284 RSC.
- F. Dong, Z. Zhao and T. Xiong, et al., In situ construction of g-C3N4/g-C3N4 metal-free heterojunction for enhanced visible-light photocatalysis, ACS Appl. Mater. Interfaces, 2013, 5(21), 11392–11401 CrossRef CAS.
- J. Wang, D. Liu and Y. Zhu, et al., Supramolecular packing dominant photocatalytic oxidation and anticancer performance of PDI, Appl. Catal., B, 2018, 231(5), 251–261 CAS.
- W. Huang, Z. Xu and R. Liu, Tungstenic acid induced assembly of hierarchical flower-like MoS2 spheres, Mater. Res. Bull., 2008, 43(10), 2799–2805 CrossRef CAS.
- Y. Liu, H. Liu and H. Zhou, et al., A Z-scheme mechanism of N-ZnO/g-C3N4 for enhanced H2 evolution and photocatalytic degradation, Appl. Surf. Sci., 2019, 466(1), 133–140 CrossRef CAS.
- L. Du, B. Gao and S. Xu, et al., Strong ferromagnetism of g-C3N4 achieved by atomic manipulation, Nat. Commun., 2023, 14(5), 2278 CrossRef CAS.
- R. Ma, X. Guo and K. Shi, et al., S-type Heterojunction of MOS2/g-C3N4: Construction and Photocatalysis, J. Inorg. Mater., 2023, 38(10), 1176–1182 CrossRef.
- J. Li, Y. Xiong and H. Wan, et al., In situ investigation of dye pollutant adsorption performance on graphitic carbon nitride surface: ATR spectroscopy experiment and MD simulation insight, Hazard, Mater, 2021, 418(15), 126297 CAS.
- J. Matos, J. Laine and J. Herrmann, et al., Synergy effect in the photocatalytic degradation of phenol on a suspended mixture of titania and activated carbon, Appl. Catal., B, 1998, 18(3–4), 281–291 CrossRef CAS.
- Z. Cui, H. Wu and K. Bai, et al., Fabrication of a g-C3N4/MoS2 photocatalyst for enhanced RhB degradation, Phys. E, 2022, 144(3), 115361 CrossRef CAS.
- J. Hou, H. Wang and R. Qin, et al., Grinding preparation of 2D/2D g-C3N4/BiOCl with oxygen vacancy heterostructure for improved visible-light-driven photocatalysis, Carbon Research, 2024, 3(1), 1–12 CrossRef.
- M. Ai, L. Pan and C. Shi, et al., Spin selection in atomic-level chiral metal oxide for photocatalysis, Nat. Commun., 2023, 14(2), 4562 CrossRef CAS.
- A. Muslimov, F. Orudzhev and M. Gadzhiev, et al., Facile Synthesis of Ti/TiN/TiON/TiO2 Composite Particles for Plasmon-Enhanced Solar Photocatalytic Decomposition of Methylene Blue, Coatings, 2022, 12(11), 1741 CrossRef CAS.
- Y. Zhao, H. Shi and D. Yang, et al., Fabrication of a Sb2MoO6/g-C3N4 Photocatalyst for Enhanced RhB Degradation and H2 Generation, J. Phys. Chem., 2020, 124(25), 13771–13778 CAS.
| This journal is © The Royal Society of Chemistry 2024 |

