 Open Access Article
Creative Commons Attribution 3.0 Unported Licence
Enhancement of the ammonia synthesis activity of a Cs- or Ba-promoted ruthenium catalyst supported on barium niobate
Minxuan Chen ab,
Qiang Zhang*ab and
Zhixiong You*c
aEco-Environmental Damage Judicial Expertise Center, Hubei Provincial Academy of Eco-Environmental Sciences, Wuhan 430079, PR China
bHubei Key Laboratory of Pollutant Damage Assessment and Environmental Health Risk Prevention and Control, Wuhan 430079, PR China
cSchool of Resources and Environmental Sciences, Wuhan University, Wuhan 430079, PR China
First published on 10th June 2024
Abstract
Barium niobates with different crystalline structures and morphologies were prepared via a hydrothermal method and applied as a support for a ruthenium catalyst in ammonia synthesis. The sample synthesized with a nominal Ba/Nb ratio = 2.0, having a pure Ba5Nb4O15 crystalline phase and uniform flake-like structure, exhibited the best performance as a support in ammonia synthesis. The flake-like substrate favored the uniform distribution of ruthenium on its surface, which could promote ruthenium to expose more B5 sites. Addition of a Ba- or Cs-promoter enhanced the activity of the Ru/Ba5Nb4O15 catalyst markedly. The highest rate of ammonia synthesis over 2Cs- and 1Ba-4 wt% Ru/Ba5Nb4O15 was 4900 and 3720 (μmol g−1cat h−1) at 0.1 MPa and 623 K, respectively. Both catalysts were stable during the reaction for 72 h at 673 K and 0.1 MPa. Thus, the synthesized Ba5Nb4O15 is expected to be a promising oxide support for ruthenium catalysts for ammonia synthesis.
1. Introduction
Ammonia plays a very important role in the chemical industry and is often used in fields such as fertilizers and pharmaceutical intermediates. In recent years, liquid ammonia as a hydrogen-storage material has received widespread attention. Industrial synthesis of ammonia mainly adopts the Haber–Bosch process under high temperature and pressure, and often uses iron-based catalysts, which causes high energy consumption and considerable pollution.1 Therefore, developing catalysts that can achieve a high performance at low temperature and low pressure is the key to this process.In the Haber–Bosch process, ruthenium-based catalysts exhibit high activity for ammonia synthesis under mild conditions, making them the most promising second-generation catalysts to replace industrial iron-based catalysts.2–4 The ruthenium-base catalyst requires a suitable support to disperse and support the ruthenium component. At present, electronic compounds,5–7 hydrides,8 carbon materials9–11 and metal oxides12,13 are used as supports of ruthenium-based catalysts. Li et al.14 investigated Nvs-g-C3N4/graphene as a support. Related studies have shown that electronic compounds and hydrides have good electron-transfer capabilities, but their preparation is complex and difficult to put into practical application. Carbon materials have a large specific surface area but are prone to methanation.15 Metal oxides have attracted the attention of researchers due to their stable structure, simple synthesis, good conductivity and thermal stability. In addition to traditional metal oxides such as MgO16–18 and Al2O3,19–21 special structures such as BaCeO3,22 Sr2Nb2O7,23 Mo2TiC2O2 (ref. 24) and MgAl-LDO (ref. 25) have been reported in recent years.
The introduction of promoters can improve the dispersion of Ru, increase the electron density on the surface of Ru, reduce the activation energy of dissociated N2, and thereby enhance the activity of ammonia synthesis.26,27 There are various forms and types of additives, among which some alkali metals (K, Cs) and alkali-earth metals (Ba) are widely studied due to their lower electronegativity, which is more conducive to electron transfer to the surface of Ru and promotes the ammonia synthesis reaction.28–31
We have studied Sr2Nb2O7 and Sr2Ta2O7 as supports for ruthenium catalysts, which can exhibit high activity at milder reaction conditions. Numerous studies have shown a strong interaction between alkaline oxide carriers and Ru, making them ideal metal-oxide carriers. Ba and Sr belong to the same group of elements, and Ba has stronger alkalinity. Herein, we demonstrate that Ba- or Cs-promoted Ru supported on a barium niobate substrate exhibited superior activity.
2. Materials and methods
2.1 Preparation of the Ba5Nb4O15 support
The Ba5Nb4O15 support was prepared by a hydrothermal method. First, a precursor of niobium (Nb2O5·nH2O) was synthesized from NbCl5 via a hydrothermal method according to a published report.32 An alcohol solution of NbCl5 (0.37 mol L−1) was prepared by dissolving an appropriate amount of NbCl5 (99.0%; MilliporeSigma) in ethanol (analytical purity; Sinopharm Chemical Reagents). Then, the pH of the solution was adjusted to ∼10.5 by adding NH4OH aqueous solution (4 wt%) with stirring at room temperature for 4 h. Then, a Teflon™-lined autoclave was used to hold this mixture, followed by treatment at 473 K for 24 h. Subsequently, a solid product was recovered by centrifugation (8000 rpm for 30 min) and washed repeatedly with pure water until the filtrate was confirmed to be free of chloride anions using AgNO3. Finally, the product was dried at 353 K under a vacuum of ∼1.0 kPa.Second, Ba(OH)2·8H2O (99.5%; MilliporeSigma) and the resultant Nb2O5·nH2O was dispersed in 45 mL of pure water and stirred for 0.5 h at room temperature. Then, a Teflon-lined autoclave was used to hold this mixture, followed by treatment at 473 K for 24 h. The resultant product was filtered and washed with pure water to near neutral pH. The product was dried in a vacuum (∼1.0 kPa) at 353 K for 10 h.
2.2 Preparation of the supported Ru catalyst
Ruthenium catalysts were synthesized by an impregnation method. A certain amount of Ru3(CO)12 (99.0%; MilliporeSigma) was dissolved in approximately 10–25 mL of tetrahydrofuran (THF) solution. Then, dried Ba5Nb4O15 (0.20 g) was added. The mixture was stirred at room temperature for 12 h. Then, the solvent was removed using a rotary evaporator (313 K, 10 kPa). Dried samples were decomposed at 723 K for 3 h in an Ar (99.999%) flow of 5 mL min−1. The catalysts obtained had a nominal Ru loading of 4 wt%. An appropriate amount of CsNO3 or Ba(NO3)2 was added to the obtained Cs- or Ba- Ru/Ba5Nb4O15 catalyst by impregnation.2.3 Activity measurements
The activity of the Cs- or Ba- Ru/Ba5Nb4O15 catalysts for ammonia synthesis was tested in a fixed-bed plug-flow reaction system. Prior to tests, the dried catalyst samples were ground, pelletized, crushed and sieved. Then, the pellets (0.1000 g) of size 0.22–0.45 mm were loaded into a quartz tubular reactor (I.D. = 7 mm). Before ammonia synthesis, the catalysts were treated in H2 (99.999%) flow at 573–873 K for 3 h to reduce ruthenium cations to a metallic state and to decompose CsNO3 or Ba(NO3)2. Ammonia synthesis reactions were carried out at 573 to 773 K and 0.10 MPa in a synthesis gas flow (H2/N2 = 3/1, 99.999%, 60 mL min−1). The rate of ammonia formation was calculated based on the rate of decrease of the conductivity of H2SO4 solution. During activity tests, after the product gas had been stabilized under each reaction condition for 30 min, it was introduced into a sulfuric acid solution for measurement.2.4 Characterization
The crystalline structure of samples was analyzed by X-ray diffraction (XRD) performed on an X'Pert Pro diffractometer (PANalytical) equipped with a Cu-Kα radiation source (λ = 1.5405 Å). All diffraction patterns were recorded in a 2θ range of 10–70° at a scan speed of 2° min−1.The data for the N2 adsorption–desorption isotherms collected at 77.3 K on an apparatus for automatic measurement of specific surface area and pore-size distribution (BELSORP-mini II; Microtrac) were applied for evaluating the Brunauer–Emmett–Teller (BET) surface area of the prepared samples. The samples were degassed at 473 K under 10−2 kPa for 2 h before the tests. The specific surface area was calculated from the linear part of the BET plot, where the P/P0 ratios were 0.05–0.25.
The content of Nb and Ba in the products was detected by inductively coupled plasma-atomic emission spectroscopy (ICP-AES) using the IRIS Intrepid II XSP system (Thermo Fisher Scientific).
The morphology of synthesized Ba5Nb4O15 samples was observed by scanning electron microscopy (SEM) using a Zeiss system (Sigma) at an acceleration voltage of 20 kV. Images of Ru nanocrystallites on supports were recorded by transmission electron microscopy (TEM) on a JEM-2100 system (JEOL) at an acceleration voltage of 200 kV.
Temperature programmed desorption (TPD) tests were carried out on a self-built device, which was connected to a gas chromatograph (GC-2020; Trustworthy) equipped with a thermal conductivity detector (TCD). Before the desorption test, the catalyst (100.0 mg) was pretreated in N2 (99.999%) flow of 15 mL min−1 at 773 K for 3 h, cooled down to 373 K, and exposed to a flow of 5 vol% NH3 (balanced by 99.999% N2) of 10 mL min−1 for 30 min to allow the sample to reach an adsorption equilibrium. Then, N2 (99.999%) flow of 15 mL min−1 at 373 K for 30 min was used to remove the physically adsorbed ammonia molecules. In the desorption test, the catalyst was heated from 373 to 1073 K at 10 K min−1. The desorbed ammonia was carried in N2 flow (15 mL min−1) into the gas chromatograph for quantification.
3. Results and discussion
3.1 Effect of the Ba/Nb molar ratio on the morphology of barium-niobate samples
Fig. 1 displays the XRD patterns of the samples of synthesized barium niobate. It can be seen that the molar ratio of Ba(OH)2/Nb2O5 affected the formation of a crystalline structure of obtained materials. Ba4Nb2O9 and Nb2O5 phases (Fig. 1a) were observed in the sample while an equal amount of Ba(OH)2 and Nb2O5 (Ba/Nb = 0.5) was mixed and hydrothermally treated. By increasing Ba/Nb to 2.0, the other phases disappeared (Fig. 1b) and we could obtain a sample containing Ba5Nb4O15 mainly in the orthorhombic phase (PDF#14-0028). Increasing Ba/Nb to 4.0 led to no apparent change in the crystalline structure of the samples (Fig. 1c). It can be inferred that the added Ba(OH)2 exceeding the stoichiometry of Ba5Nb4O15 had almost no impact on the crystalline structure of the resultant barium niobates. ICP-AES (Table 1) confirmed the XRD results that the measured Ba/Nb values agreed well with nominal Ba/Nb (added Ba/Nb) when the Ba/Nb ratio = 1. For Ba/Nb = 2 and 4, the measured Ba/Nb values were close to 1.2, which was consistent with the XRD pattern. These results indicated that excessive addition of Ba(OH)2 was lost during filtration and water-washing after hydrothermal treatment.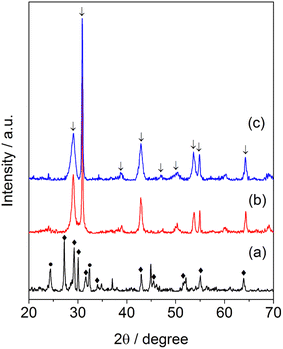 | ||
| Fig. 1 XRD patterns of barium-niobate samples prepared by a hydrothermal reaction at 473 K for 24 h with different molar ratios of Ba/Nb. (a) Ba/Nb = 0.5, (b) Ba/Nb = 2.0, (c) Ba/Nb = 4.0. | ||
| Property | ||
|---|---|---|
| Sample weight (g) | Added Ba/Nb | Measured Ba/Nb (mole ratio) |
| 0.0103 | 1 | 1.01 |
| 0.0110 | 1.25 | 1.10 |
| 0.0106 | 2 | 1.11 |
| 0.0102 | 4 | 1.20 |
| Support | BET surface area (m2 g−1) | Adsorbed NH3 | |
|---|---|---|---|
| (μmol g−1) | (μmol m−2) | ||
| Sr2Nb2O7 | 83 | 122.3 | 0.13 |
| Ba5Nb4O15 | 19 | 30.4 | 0.15 |
| Al2O3 | 85 | 236.2 | 0.28 |
| MgO | 14 | 74.3 | 0.54 |
Corresponding to their crystalline structures, elongated crystalline grains of size 200 × 1000 nm (Fig. 3a) could be obtained when the sample was prepared with a nominal Ba/Nb = 1. Increasing the addition amount of Ba(OH)2 to Ba/Nb ≥2.0, we obtained Ba5Nb4O15 flakes, and the size of the flakes decreased slightly with increasing the nominal Ba/Nb (Fig. 3b and c). These results indicated that excessive addition of Ba(OH)2 accelerated the nucleation rate of niobates in hydrothermal synthesis and, as a result, aggregates of flakes were formed.
 | ||
| Fig. 3 SEM images of barium-niobate samples prepared by a hydrothermal reaction at 473 K for 24 h with different molar ratios of Ba/Nb: (a) Ba/Nb = 1.0, (b) Ba/Nb = 2.0, (c) Ba/Nb = 4.0. | ||
3.2 Catalytic activity of Ru/Ba5Nb4O15
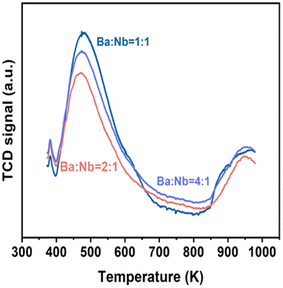
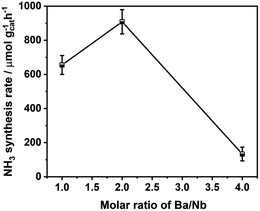
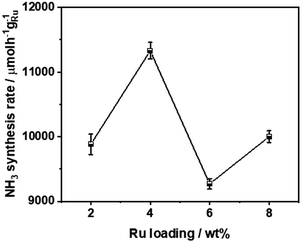
Fig. 4 compares the ammonia synthesis rates over 4 wt% Ru catalysts supported on barium niobates synthesized with different nominal molar ratios of Ba/Nb at 673 K and 0.1 MPa. The 4 wt% Ru/Ba5Nb4O15 catalyst prepared with a nominal Ba/Nb = 2.0 gave the highest activity of 909 μ mol g−1cat h−1. Further increase in the nominal Ba/Nb to >2.0 reduced the activity slightly (Fig. 4). Therefore, we chose Ba5Nb4O15 prepared at Ba/Nb = 2.0 as the support for Ru catalysts to study the effect of promoters. The acidity of the oxide support is detrimental to the activity of Ru catalysts for ammonia synthesis, and the surface acidity can be reflected by TPD. The TPD profile (Fig. 2) suggested that the acid sites were weaker on a catalyst prepared with a nominal Ba/Nb = 2.0 than other catalysts, which was consistent with the results of the activity test.The ammonia synthesis rate of different Ru loadings on Ba5Nb4O15 is shown in Fig. 5. The-ammonia synthesis rate increased first and then decreased with an increase in the addition amount of Ru, and reached a peak at 4 wt% Ru loading. Therefore, we chose 4 wt% Ru/Ba5Nb4O15 to study the effect of promoters.
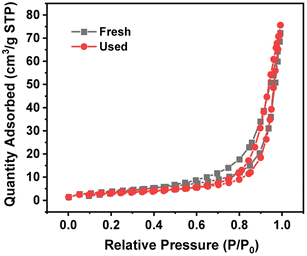
Table 3 lists the BET specific surface area, total pore volume and pore width of 4 wt% Ru/Ba5Nb4O15. Fig. 6 shows the adsorption/desorption isotherms of fresh and used 4% Ru/Ba5Nb4O15. The BET specific surface area and pore volume of the fresh catalyst and used catalyst showed almost no change. The average pore size increased after the reaction, possibly due to the detachment of impurities caused by a high temperature.
| Catalyst | SBET (m2 g−1) | Pore volume (cm3 g−1) | Average pore width (nm) |
|---|---|---|---|
| Fresh | 15 | 0.11 | 29.67 |
| Used | 13 | 0.11 | 38.32 |
3.3 Catalytic activity of Ba- or Cs-promoted Ru/Ba5Nb4O15
Tables 4 and 5 list the ammonia synthesis rates over 1Ba- and 2Cs-4 wt% Ru/Ba5Nb4O15 activated in the synthesis gas (3H2 + N2) flow at different temperatures for 3 h. For both catalysts, the ammonia synthesis rate first increased and then decreased when increasing the activation temperature. The optimal activation temperature for Ba- and Cs-promoted catalysts was 773 and 673 K, respectively. The activation process could transform the promoter into the oxide and/or hydroxide form. In addition, it could form and grow the Ru nanoparticle. A low activation temperature may not be sufficient to decompose the nitrate precursor of the promoter. However, sintering of supported Ru particles would occur and their particle size could increase at higher activation temperatures (e.g., 500 °C). Therefore, too low or high activation temperatures are not conducive to the formation of high performance.| Activation temperature (K) | NH3 synthesis rate at 0.1 MPa (μmol g−1cat h−1) | ||
|---|---|---|---|
| 623 K | 673 K | 723 K | |
| 673 | 126 | 800 | 3196 |
| 773 | 1936 | 3720 | 2471 |
| 873 | 93 | 630 | 3062 |
| Activation temperature (K) | NH3 synthesis rate at 0.1 MPa (μmol g−1cat h−1) | ||
|---|---|---|---|
| 623 K | 673 K | 723 K | |
| 573 | 10 | 1416 | 4974 |
| 673 | 2363 | 4900 | 3283 |
| 773 | 0 | 560 | 2685 |
Table 6 details the catalytic activity of Ru-based catalysts promoted with Ba(NO3)2 and CsNO3. It can be seen that all the promoters promoted the catalytic performance of the Ru/Ba5Nb4O15 catalyst markedly for ammonia synthesis. Table 6 also compares the effect of different molar ratios of promoters. For the Ba-promoter, the ammonia synthesis rate was first improved when the molar ratio of Ba/Ru was raised from 0 to 1, and then decreased when the molar ratio increased to 2. Therefore, the optimal molar ratio of Ba/Ru was 1, corresponding to ammonia synthesis of 3720 μ mol g−1cat h−1 at 400 °C and 0.1 MPa. For the Cs-promoter, a molar ratio of Cs/Ru at 1 and 2 could both exhibit preferable activity for ammonia synthesis, but 2Cs/Ru could elicit higher activity at milder reaction conditions, and ammonia synthesis was 2363 and 4900 μ mol g−1cat h−1 at 573 K and 623 K, respectively. Both were 20- or 30-times higher than that of the unpromoted catalyst. Therefore, we postulated that 2Cs/Ru was the best loading ratio. A structural promoter can synthesize more B5 active sites.33,34 In the 1Ba-4 wt% Ru/Ba5Nb4O15 catalytic system, Ba is considered to be a structural promoter. This status leads to surface reconstruction of Ru and an increase in the number of B5 active sites, thereby improving the performance of the catalyst. In the 2Cs-4 wt% Ru/Ba5Nb4O15 catalytic system, Cs is considered to be an electronic promoter that can transfer electrons to the surface of active metals and reduce the dissociation energy of N2. In addition, barium in the carrier could have a synergistic effect with the Cs-promoter to improve the activity of ammonia synthesis significantly.
| Catalyst | NH3 synthesis rate (μmol g−1cat h−1) | |||
|---|---|---|---|---|
| 573 K | 623 K | 673 K | 723 K | |
| a Conditions for ammonia synthesis: 100.0 mg of catalyst, 60 mL (STP) min−1 of synthesis gas (3H2 + N2, 99.999%) at 0.1 MPa. Prior to activity tests, catalysts were activated at 573 K for 3 h in 60 mL (STP) min−1 the synthesis gas (3H2 + N2, 99.999%). Each rate of ammonia synthesis was determined over 30 min after 30 min stabilization under given conditions. Values before the promoter in the catalyst names are the molar ratios of Ba or Cs to Ru. | ||||
| Ru/BN | 64 | 164 | 453 | 1106 |
| Ba(0.5)–Ru/BN | 519 | 2607 | 3262 | 2084 |
| Ba(1)–Ru/BN | 1936 | 3720 | 2471 | 1371 |
| Ba(2)–Ru/BN | 343 | 1743 | 3331 | 2754 |
| Cs(1)–Ru/BN | 1404 | 5048 | 3896 | 2413 |
| Cs(2)–Ru/BN | 2363 | 4900 | 3283 | 1773 |
| Cs(4)–Ru/BN | 1128 | 3454 | 2704 | 1523 |
Fig. 7 shows the morphology of Ru nanoparticles on Ba5Nb4O15 substrate after reduction by exposure to H2 and N2 at 573 K for 3 h. Ru nanoparticles were evenly distributed on the surface of the Ba5Nb4O15 support. The HRTEM image (Fig. 7b) shows hexagonal ruthenium particles uniformly deposited on the substrate. The lattice spacing of Ru particles was 0.211 nm, which corresponds to the (101) planes of Ru crystals.35,36 The lattice spacing of 0.293 and 0.309 nm corresponded to the (103) planes of Ru crystals and (110) planes of Ba5Nb4O15 crystals, respectively.37,38 From the XRD spectrum of Ba5Nb4O15 synthesized with Ba/Nb = 2.0, the (110) and (103) peaks were the top-two most intensive diffractions, indicating that they were the preferred exposed facets of the Ba5Nb4O15 flakes. These exposed facets, consisting of oxygen anions, can induce the epitaxial growth of Ru nanocrystallites.39 It was demonstrated that the density of B5 sites on the epitaxial growth of Ru was likely to be substantially greater than that for round particles. Fig. 7b reveals that the Ru particles seemed to be encapsulated, which explained why Ru/Ba5Nb4O15 did not adsorb H2 in the H2-pulse titration method. This phenomenon was attributed to the strong metal–support interaction (SMSI), which results in partial covering of Ru particles by the reduced support species.40
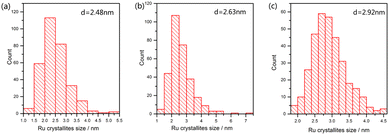
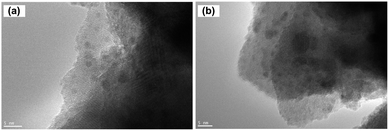
In order to explore the effect of reduction temperature on the size of ruthenium nanoparticles, over 300 ruthenium particles were measured from TEM images. Fig. 8 shows the size distribution of Ru particles at 573, 673 and 773 K; the average particle size of ruthenium was 2.48, 2.63 and 2.92 nm, respectively. The average particle size of ruthenium became larger as the temperature increased. Due to cover by Ba- or Cs-promoters (Fig. 9a and b) at room temperature, much fewer Ru particles were observed. However, they presented comparable sizes with those of Ru catalysts on Ba5Nb4O15. These Ru particles became exposed to the reactants at ammonia synthesis conditions.41,42
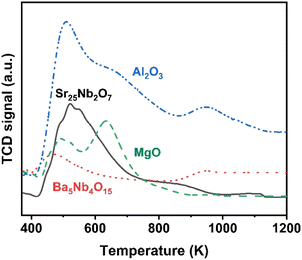
The surface acidity of Ba5Nb4O15, Sr2Nb2O7, γ-Al2O3 and MgO determined by the TPD of ammonia is shown in Fig. 10. The amount of chemisorbed ammonia on these supports is given in Table 2. The amount of adsorbed ammonia by weight of oxides followed the sequence of γ-Al2O3 ≫ Sr2Nb2O7 > MgO > Ba5Nb4O15. The acid strength of oxides, reflected by desorption temperatures, was also very different. The ammonia molecules bound on Ba5Nb4O15 desorbed at 400–600 K with the gentle peak around 480 K. The ammonia TPD profile of Sr2Nb2O7 showed a main peak at around 520 K. MgO over a similar temperature range split into two main peaks located at about 490 and 630 K. This result suggested that the acid sites were weaker on Ba5Nb4O15 than on MgO. γ-Al2O3 and Sr2Nb2O7 desorbed ammonia over a wide temperature range (400–1075 K), indicating that Ba5Nb4O15 had stronger electron-donating ability and could provide electrons to ruthenium to improve the rate of ammonia synthesis.
Table 7 compares the catalytic performance of Ba- or Cs–Ru/Ba5Nb4O15 catalyst with that of Ru catalyst supported on other substrates.43–45 Due to different Ru-loading, we calculated the ammonia synthesis rate based on Ru weight. The Ba- or Cs-promoted Ru/Ba5Nb4O15 catalyst exhibited a distinguished activity for ammonia synthesis, which was 10% higher than that of Cs–Ru/MgO, and 10-times higher than that of Ba–Ru/AC (industrial catalyst). Although Ru/C12A7:e−, Ru/La2Ce2O7, and Ru/CaCN catalysts show higher activity compared with our catalysts, the synthesis and reduction of mayenite electride are slightly difficult and, for the other two catalysts, the reaction conditions are stricter than those for Ru/Ba5Nb4O15.
| Catalysts | Ru loading (%) | Reaction condition | NH3 synthesis rate (μmol g−1cat h−1) | NH3 synthesis rate (μmol g−1Ru h−1) | Ref. |
|---|---|---|---|---|---|
| Ba–Ru/Ba5Nb4O15 | 4 | 623 K, 0.1 MPa | 3720 | 93 | This work |
| Cs–Ru/Ba5Nb4O15 | 4 | 623 K, 0.1 MPa | 5048 | 126.2 | This work |
| Ba–Ru/Sr2Nb2O7 | 2 | 623 K, 0.1 MPa | 421 | 21 | 22 |
| Cs–Ru/Sr2Nb2O7 | 2 | 623 K, 0.1 MPa | 1060 | 53 | 22 |
| Ba–Ru/AC | 9.1 | 623 K, 0.1 MPa | 2228 | 25 | 5 |
| Cs–Ru/MgO | 6 | 623 K, 0.1 MPa | 3353 | 56 | 5 |
| Ru/C12A7:e− | 1.2 | 673 K, 0.1 MPa | 2757 | 230 | 5 |
| Ru/Pr2O3 | 5 | 673 K, 0.1 MPa | 3600 | 72 | 41 |
| Ru/La2Ce2O7 | 4 | 723 K, 10 MPa | 5500 | 137.5 | 42 |
| Ru/CaCN | 4 | 673 K, 0.9 MPa | 6500 | 162.5 | 43 |
3.4 Catalytic stability of Ba- or Cs–Ru/Ba5Nb4O15
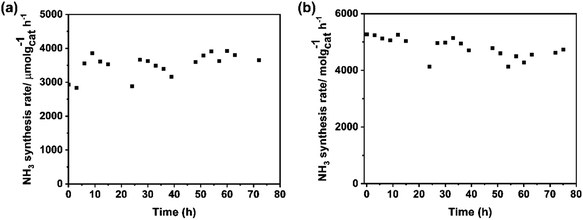
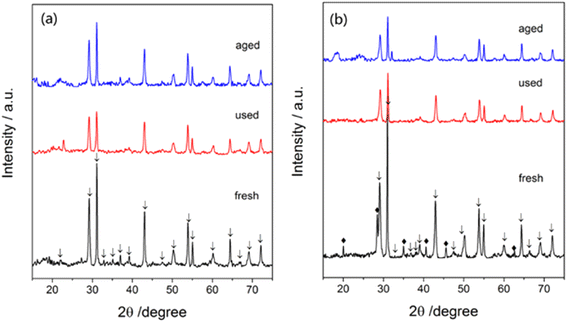
The stability of catalysts is the other important factor for practical application. The change in the rate of ammonia synthesis over Ba–Ru/Ba5Nb4O15 and Cs–Ru/Ba5Nb4O15 measured at 673 K and 0.1 MPa with time is shown in Fig. 11a and b. The ammonia synthesis rate showed no obvious change during 72 h reaction for the two catalysts, suggesting that the catalysts were stable.The catalysts in three stages (i.e., as-prepared (fresh), after 5 h activity tests (used) and after 72 h stability test (aged)) were analyzed by BET and XRD. After stability tests, the corresponding surface area of aged Ba–Ru/Ba5Nb4O15 and Cs–Ru/Ba5Nb4O15 was 15 and 13 m2 g−1, respectively, with a change in the surface area of <5% (Table 8). These results indicated that the textural morphology of the catalysts was stable under ammonia synthesis conditions.
| Catalyst | BET surface area (m2 g−1) | ||
|---|---|---|---|
| Fresh | Used | Aged | |
| 1Ba-4 wt% Ru/Ba5Nb4O15 | 18 | 16 | 15 |
| 2Cs-4 wt% Ru/Ba5Nb4O15 | 12 | 11 | 13 |
A crystalline phase of Ba(NO3)2 (Fig. 12a) was not found but a crystalline phase of CsNO3 (Fig. 12b) was found in fresh catalysts. In contrast, no significant phase of CsNO3 was detected in used and aged catalysts, indicating the cesium promoter was present in an amorphous or well-dispersed state. After 72 h tests, the crystalline structure of the Ba5Nb4O15 substrate showed no obvious change, suggesting the catalysts to be of high performance and high stability for ammonia synthesis.
4. Conclusions
We demonstrated that flake-like Ba5Nb4O15 was an excellent support for an Ru catalyst for ammonia synthesis. Ba- or Cs-promoted Ru catalysts supported on Ba5Nb4O15 synthesized with a nominal Ba/Nb ratio = 2.0 exhibited high activity and stability for ammonia synthesis under mild reaction conditions compared to Cs–Ru/MgO (which is considered to be one of the most active oxide supports at present). Compared with other catalysts, Ba5Nb4O15 as a support exhibited higher activity at a lower temperature (623 K). Thus, barium niobate can be a promising candidate as a Ru catalyst for ammonia synthesis.Author contributions
Minxuan Chen: conceptualization, investigation, data analysis, and writing (original draft, review and editing). Zhixiong You: methodology, writing (review and editing), and data curation. Qiang Zhang: supervision and methodology.Conflicts of interest
The authors declare no conflict of interest.Acknowledgements
This work was financially supported by the National Natural Science Foundation of China (21573163, 22172114).References
- H. Zhang, L. Wang and F. Maréchal, Appl. Energy, 2020, 259(1), 114135 CrossRef CAS.
- M. Kitano, Y. Inoue and M. Sasase, Angew. Chem., Int. Ed., 2018, 130(10), 2678–2682 CrossRef.
- Y. P. Zhou, Y. C. Ma and G. J. Lan, Chin. J. Catal., 2019, 40(1), 114–123 CrossRef CAS.
- S. Y. Kim, H. W. Lee and S. J. Pai, et al., ACS Appl. Mater. Interfaces, 2018, 10(31), 26188–26194 CrossRef CAS PubMed.
- M. Kitano, Y. Inoue and Y. Yamazaki, Nat. Chem., 2012, 4(11), 934–940 CrossRef CAS PubMed.
- M. Hattori, T. Mori and T. Arai, ACS Catal., 2018, 8(12), 10977–10984 CrossRef CAS.
- J. LI, J. WU and H. WANG, et al., Chem. Sci., 2019, 10(22), 5712–5718 RSC.
- R. J. J. Davis, Catal, 2003, 216(1–2), 396–405 CrossRef CAS.
- Y. C. Ma, G. J. Lan and W. Z. Fu, J. Energy Chem., 2020, 41, 79–86 CrossRef.
- M. Nishi, S. Y. Chen and H. Takagi, ChemCatChem, 2018, 10(16), 3411–3414 CrossRef CAS.
- B. Y. Lin, Y. J. Guo and C. F. Cao, Catal. Today, 2018, 316, 230–236 CrossRef CAS.
- B. Y. Lin, L. Heng and B. Y. Fang, ACS Catal., 2019, 9(3), 1635–1644 CrossRef CAS.
- J. Ni, B. Q. Jing and J. X. Lin, et al., J. Rare Earths, 2018, 36(2), 135–141 CrossRef CAS.
- D. Li, J. Gao and M. Hao, Mol. Catal., 2023, 547, 113353 CrossRef CAS.
- V. Borisov, K. Iost and V. Temerev, Diamond Relat. Mater., 2020, 108, 107986 CrossRef CAS.
- K. Aika, T. Takano and S. Murata, J. Catal., 1992, 136, 126–140 CrossRef CAS.
- F. Rosowski, A. Hornung, O. Hinrichsen, D. Herein, M. Muhler and G. Ertl, Appl. Catal., A, 1997, 151, 443–460 CrossRef CAS.
- M. Muhler, F. Rosowski, O. Hinrichsen, A. Hornung and G. Ertl, Stud. Surf. Sci. Catal., 1996, 101, 317–326 CrossRef CAS.
- K. Aika, K. Shimazaki, Y. Hattori, A. Ohya, S. Ohshima, K. Shirota and A. Ozaki, J. Catal., 1985, 92, 296–304 CrossRef CAS.
- K. Aika, M. Kumasaka, T. Oma, O. Kato, H. Matsuda, N. Watanabe, K. Yamazaki, A. Ozaki and T. Onishi, Appl. Catal., 1986, 28, 57–68 CrossRef CAS.
- A. Miyazaki, I. Balint, K. Aika and Y. Nakano, J. Catal., 2001, 204, 364–371 CrossRef CAS.
- J. Huang, M. Yuan and Z. You, J. Catal., 2020, 389, 556–565 CrossRef CAS.
- M. Chen, M. Yuan and Z. You, Appl. Catal., A, 2018, 554, 1–9 CrossRef CAS.
- P. Shu, X. Qi and Q. Peng, MoCat, 2023, 539, 113036 CAS.
- S. Marakatti and M. Gaigneaux, ChemCatChem, 2020, 12(23), 5838–5857 CrossRef.
- M. Kitano, Y. Inoue and M. Sasase, Angew. Chem., 2018, 130(10), 2678–2682 CrossRef.
- M. Nishi, S. Chen and H. Takagi, ChemCatChem, 2018, 10(16), 3411–3414 CrossRef CAS.
- K.-I. AIKA, Catal. Today, 2017, 286, 14–20 CrossRef CAS.
- B. Y. Lin, Y. J. Guo and C. F. Cao, Catal. Today, 2018, 316, 230–236 CrossRef CAS.
- R. J. Davis, J. Catal., 2003, 216(1–2), 396–405 CrossRef CAS.
- J. Z. Qiu, J. B. Hu and J. G. Lan, Chem. Mater., 2019, 31(22), 9413–9421 CrossRef CAS.
- W. Fan, Q. Zhang, W. Deng and Y. Wang, Chem. Mater., 2013, 25, 3277–3287 CrossRef CAS.
- W. Rarogpilecka, E. Miskiewicz, D. Szmigiel and Z. Kowalczyk, J. Catal., 2005, 231, 11–19 CrossRef CAS.
- J. Huang, M. Yuan and X. Li, Appl. Catal., A, 2021, 615, 118058–118067 CrossRef CAS.
- Z. Song, T. Cai, J. C. Hanson, J. A. Rodriguez and J. Hrbek, J. Am. Chem. Soc., 2004, 126, 8576 CrossRef CAS PubMed.
- H. Topsøe, J. B. Wagner, P. L. Hansen, S. Dahl, T. W. Hansen and C. J. H. Jacobsen, Science, 2001, 294, 1508 CrossRef PubMed.
- J. Kehres, J. G. Jakobsen and J. W. Andreasen, Phys. Chem. C., 2012, 116, 21407–21415 CrossRef CAS.
- K. Wang, X. Y. Wu and G. K. Zhang, Chem. Eng., 2018, 6, 6682–6692 CAS.
- S. Havelia, S. Wang and M. Schultz, CrystEngComm, 2013, 15, 5434–5441 RSC.
- J. Feng, H. Fu and J. Wang, Catal. Commun., 2008, 9, 1458–1464 CrossRef CAS.
- Z. X. You, K. Inazu, K. Aika and T. Baba, J. Catal., 2007, 251, 321–331 CrossRef CAS.
- T. W. Hansen, P. L. Hansen, S. Dahl and C. J. H. Jacobsen, Catal. Lett., 2002, 84, 7–12 CrossRef CAS.
- K. Sato, K. Imamura, Y. Kawano, S. Miyahara, T. Yamamoto, S. Matsumurac and K. Nagaoka, Chem. Sci., 2017, 8, 674–679 RSC.
- W. Han, Z. Li and H. Liu, J. Rare Earths, 2019, 37, 492–499 CrossRef CAS.
- K. Kishida and M. Kitano, ACS Appl. Energy Mater., 2020, 3, 6573–6658 CrossRef CAS.
| This journal is © The Royal Society of Chemistry 2024 |

