 Open Access Article
Water solubility and folate receptor affinity-driven plasma membrane-targeted carbon dots for cancer cell imaging†
Tian Jin‡
a,
Longdi Zhang‡a,
Yudie Zhaoa,
Jianping Wang*b,
Zhengjie Liua,
Ruilong Zhang a,
Junlong Genga,
Guangmei Han
 *a and
Zhongping Zhang
 a
a
aInstitute of Physical Science and Information Technology, School of Chemistry and Chemical Engineering, Information Materials and Intelligent Sensing Laboratory of Anhui Province, Key Laboratory of Structure and Functional Regulation of Hybrid Materials of Ministry of Education, Anhui University, Hefei, Anhui 230601, China. E-mail: gmhan@ahu.edu.cn
bZhejiang Provincial Key Laboratory of Biometrology and Inspection & Quarantine, College of Life Sciences, China Jiliang University, Hangzhou, 310018, China
First published on 31st October 2024
Abstract
Long-term labeling of the plasma membrane is crucial for visualizing membrane protein expression and morphological changes but is challenging due to the high fluidity of the plasma membrane, which can lead to probe diffusion or internalization of cells. Here, we precisely control the localization of carbon dots (M-CDs) on the plasma membrane without internalization after long-term observation under fluorescence microscopy. Adjusting the molar ratio of folic acid to o-phenylenediamine allowed fine-tuning of the water solubility and fluorescence emission of the carbon dots. Notably, carbon dots synthesized with a folic acid to o-phenylenediamine molar ratio of 1![[thin space (1/6-em)]](https://www.rsc.org/images/entities/char_2009.gif) :
:![[thin space (1/6-em)]](https://www.rsc.org/images/entities/char_2009.gif) 10 (referred to as M-CD) exhibit excellent cell membrane targeting, likely due to the combination of suitable water-solubility and FA–FR affinity. The photostability of M-CDs is significantly superior to that of the commercial CellMask Crimson, allowing for specific recognition of folic acid receptor-positive cancer cells and minimal internalization over a period of up to 9 hours. This photostable, membrane-targeting M-CD provides a powerful tool for accurately, real-time, and non-invasively assessing the expression of folic acid receptors on cancer cell membranes and tumor metastasis.
10 (referred to as M-CD) exhibit excellent cell membrane targeting, likely due to the combination of suitable water-solubility and FA–FR affinity. The photostability of M-CDs is significantly superior to that of the commercial CellMask Crimson, allowing for specific recognition of folic acid receptor-positive cancer cells and minimal internalization over a period of up to 9 hours. This photostable, membrane-targeting M-CD provides a powerful tool for accurately, real-time, and non-invasively assessing the expression of folic acid receptors on cancer cell membranes and tumor metastasis.
Introduction
Cancer is one of the major diseases that seriously threatens human health.1 The specific recognition and imaging of cancer cells play key roles in the early diagnosis and targeted therapy of cancer.2,3 The heterogeneity between the plasma membranes of cancer cells and normal cells, including the expression of specific membrane proteins, lipid composition, and membrane fluidity, provides potential targets for cancer diagnosis and therapy.4–6 Among them, the folate receptor (FR) is a glycoprotein membrane receptor that is overexpressed in various cancer cells. The water-soluble vitamin folate acid (FA) can specifically bind to the FR through the pterin moiety.7 This binding mechanism renders the FR an ideal target for numerous cancer detection and drug delivery strategies.8–11Due to their excellent photostability, FA-modified fluorescent nanoparticles,12 including quantum dots,13,14 metal–organic framework materials,15 organic dye nanoparticles16 and carbon dots,17,18 have been engineered for cancer cell imaging and drug delivery. The design of these nanoparticles utilizes FR-mediated endocytosis to enhance the uptake efficiency by cancer cells for drug delivery. However, it fails in the visualization of FRs on plasma membranes and the changes in plasma membrane morphology, which is equally important for tumour metastasis and assessment. Moreover, the post-modification strategy typically involves complex steps such as nanoparticle preparation, functionalization, and purification.
Carbon dots (CDs) are new carbon-based fluorescent nanomaterials, featuring low cytotoxicity, good solubility, strong photostability, and tunable fluorescence, have become an ideal fluorescence imaging tool.19–22 Unlike other nanomaterials that require complex post-functionalization,23–25 CDs can achieve desired specificities, such as organelle targeting and cancer cell specificity, by retaining the intrinsic functional groups of their precursors through a one-step synthesis.26–29 For example, Shuang et al. synthesized four types of carbon dots with distinct organelle targeting capabilities by controlling the self and copolymerization reaction of oPD and lysine within a one-step hydrothermal system.28 Li et al. developed red, green, and blue fluorescent FR-targeting CDs for cervical cancer cellular and tissue imaging by hydrothermal treatment of FA and phenylenediamine isomers.29 Tong et al. prepared blue fluorescence emission CDs by tris-assisted one-step hydrothermal treatment of FA and L-arginine.30 Nevertheless, most reported FA-based CDs either emit blue fluorescence or rapidly internalize into the cytoplasm. Recently, Wu et al. developed photostable carbon-dot liposomes (CDsomes)-based fluorophores for organellar and suborganellar imaging. The selective imaging of cytoplasm and membrane structures including plasma membrane, nuclear membrane, and endoplasmic reticulum were realized by controlling the hydrophilicity and hydrophobicity of CDsomes. However, due to the similarity of these membrane structures, they interfere with each other to some extent.31 Therefore, it is important but challenging to design a photostable fluorescent probe with long-wavelength emission and long-term plasma membrane staining capability to visualize in situ information of FRs on cell membranes.
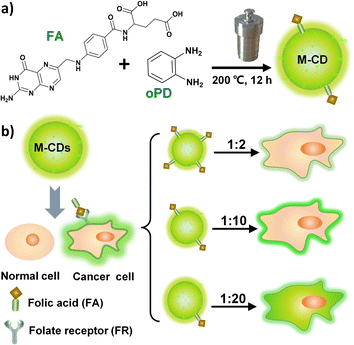
To address these challenges, we controlled the intracellular behaviour of CDs by adjusting the molar ratio of the precursors: FA and o-phenylenediamine (oPD). Among them, oPD was chosen as the carbon source for generating the carbon core and adjusting the emission centres due to its propensity for polymerization. FA, on the other hand, contributes to the targeting capability of cancer cell membranes. Yellow-green fluorescent carbon dots (M-CD) with cell membrane targeting capability were synthesized via a one-step solvothermal method using FA and oPD (molar ratio 1![[thin space (1/6-em)]](https://www.rsc.org/images/entities/char_2009.gif) :
:![[thin space (1/6-em)]](https://www.rsc.org/images/entities/char_2009.gif) 10) in ethanol at 200 °C for 12 hours (Scheme 1a). And when the molar ratio was increased to 1
10) in ethanol at 200 °C for 12 hours (Scheme 1a). And when the molar ratio was increased to 1![[thin space (1/6-em)]](https://www.rsc.org/images/entities/char_2009.gif) :
:![[thin space (1/6-em)]](https://www.rsc.org/images/entities/char_2009.gif) 20, the synthesized carbon dots (M-CD2) were internalized into the cytoplasm, similar to the behaviour observed in most FA-based carbon dots reported in the literature (Scheme 1b). Compared to CellMask Deep Red (a commercial dye for plasma membrane), M-CD was more photostable and remain capable of labeling the cell membrane with bright fluorescence without being internalized into the cytoplasm even after 9 hours of incubation with live cells. This observation period was longer than the 6 hours reported for small molecule probes.32
20, the synthesized carbon dots (M-CD2) were internalized into the cytoplasm, similar to the behaviour observed in most FA-based carbon dots reported in the literature (Scheme 1b). Compared to CellMask Deep Red (a commercial dye for plasma membrane), M-CD was more photostable and remain capable of labeling the cell membrane with bright fluorescence without being internalized into the cytoplasm even after 9 hours of incubation with live cells. This observation period was longer than the 6 hours reported for small molecule probes.32
Experimental section
Materials and instruments
o-Phenylenediamine and folic acid were purchased from Sigma. 3-(4,5-Dimethylthiazol-2-yl)-2,5-diphenyltetrazolium bromide (MTT) and CellMask Deep Red were purchased from Thermo Fisher. Other chemical reagents were obtained from Sinopharm Chemical Reagent Co. Ltd. HepG2 (human liver carcinoma cells), KB (human oral epidermoid carcinoma cells) and A549 (human non-small cell lung cancer cells) were obtained from Institute of Intelligent Machines, Hefei Institutes of Physical Science (Chinese Academy of Science). HeLa (human cervical carcinoma cells) was supplied by Shanghai Institute of Biochemistry and Cell Biology (Chinese Academy of Science, China). MCF 10A (human breast cells) and QSG (human liver cells) were purchased from Shanghai Bioleaf Biotech Co. Ltd.UV-vis absorption spectra and fluorescent spectra were measured using HITACHI UH5300 spectrometer and HITACHI F-7000 fluorescence spectrophotometer, respectively. X-ray photoelectron spectroscopy (XPS) spectra were obtained on an ESCALAB250 XPS. Fluorescence decay spectrum was collected on FS5 fluorometer (Edinburgh Instruments, UK). Fluorescent images were acquired on a Leica TCS SP8X microscope. TEM images were obtained on a transmission electron microscope (JEM-2100, JEOL, Tokyo, Japan). Fourier transform infrared (FTIR) spectroscopy was recorded by a Nexus 870 FTIR spectrometer. Dynamic light scattering (DLS) were measured on NanoBrook 90Plus PLAS (Brookhaven Instrument Corp., USA).
Synthesis of M-CD1, M-CD and M-CD2
The M-CDs were prepared by one-step solvothermal treatment of o-PD and FA. In brief, o-PD (0.196 g) and FA (0.08 g) were dissolved in 60 mL of anhydrous ethanol and sonicated until completely dissolved. Then, the mixture was transferred into a 100 mL Teflon lined reaction kettle and kept at 200 °C for 10 h, and then cooled naturally to room temperature. The reaction solution was centrifuged at 10![[thin space (1/6-em)]](https://www.rsc.org/images/entities/char_2009.gif) 000 rpm for 15 min. The supernatant was retained and further filtered through a 0.22 μm filter membrane. The resulting solution was concentrated by rotary evaporation, and then dried in an oven at 70 °C to obtain the brownish black solid (M-CDs). The M-CDs1 and M-CDs2 with different molar ratio of o-PD and FA were synthesized follow the same steps.
000 rpm for 15 min. The supernatant was retained and further filtered through a 0.22 μm filter membrane. The resulting solution was concentrated by rotary evaporation, and then dried in an oven at 70 °C to obtain the brownish black solid (M-CDs). The M-CDs1 and M-CDs2 with different molar ratio of o-PD and FA were synthesized follow the same steps.
Cytotoxicity assay
The cytotoxicity of M-CD and o-CD in HepG2 cells was assessed using the MTT assay. Briefly, cells (5 × 10³ cells per well) were seeded in 96-well plates. The plates were maintained at 37 °C in a 5% CO2/95% air incubator for 24 h, followed by exposure to 200 μL of medium containing various concentrations of M-CDs or o-CDs (0, 10, 15, 20, 25, 30, 40, 60 and 80 μg mL−1). After 24 h, the culture media were removed, and MTT solution (20 μL, 5 mg mL−1) with 180 μL of fresh medium were added to each well. After 4 h, the medium was removed, and 150 μL DMSO was added to dissolve the formazan crystals (10 min incubation in the dark). The absorbance at 570 nm for each well was measured on a microplate reader, and the cell viability was calculated.Cell cultures and confocal imaging
Hep G2, KB, MCF 10A and QSG-7701 cells were cultured in 1640 medium with 10% FBS and 1% penicillin–streptomycin. HeLa, A549 cells were cultured in Dulbecco's Modified Eagle's medium (DMEM, Gibco) supplemented with 10% fetal bovine serum (FBS, Gibco) and 1% penicillin–streptomycin. It should be noted that the KB cells which originally derived from an epidermoid carcinoma of the nasopharynx, have been identified to be contaminated by HeLa cells.33 All cell lines were seeded onto glass-bottomed confocal dishes and cultured for 24 h at 37 °C in a humidified atmosphere. M-CDs solution was added to a final concentration of 20 μg mL−1 and incubated for 1 h. The fluorescence was recorded under excitation at 405 nm with a collection emission range of 500–650 nm, and the pseudo-color of the fluorescent images was set to green. All the cells were washed with buffer three times before imaging to avoid non-specific adsorption.Results and discussion
Synthesis and characterization of the M-CDs
Currently used cell membrane imaging probes are mainly amphiphilic small molecules. On one hand, the lipophilic moiety can insert into the plasma membrane, while on the other hand, the hydrophilic moiety inhibits cellular internalization of the probe.32 For carbon dots, the size of the π-conjugated domains in the carbon core and the surface groups can effectively regulate aqueous solubility, fluorescence emission wavelength, and organelle targeting ability. To investigate the effects of FA and oPD on cell membrane-targeting capability and fluorescence emission wavelength in the synthesis of carbon dots (CDs), three M-CDs with FA to oPD molar ratios of 1![[thin space (1/6-em)]](https://www.rsc.org/images/entities/char_2009.gif) :
:![[thin space (1/6-em)]](https://www.rsc.org/images/entities/char_2009.gif) 2, 1
2, 1![[thin space (1/6-em)]](https://www.rsc.org/images/entities/char_2009.gif) :
:![[thin space (1/6-em)]](https://www.rsc.org/images/entities/char_2009.gif) 10, and 1
10, and 1![[thin space (1/6-em)]](https://www.rsc.org/images/entities/char_2009.gif) :
:![[thin space (1/6-em)]](https://www.rsc.org/images/entities/char_2009.gif) 20 were synthesized under the same solvothermal conditions, designated as M-CD1, M-CD, and M-CD2, respectively.
20 were synthesized under the same solvothermal conditions, designated as M-CD1, M-CD, and M-CD2, respectively.
The TEM images revealed that the three synthesized CDs had a monodisperse, quasi-spherical morphology with a particle size distribution of 2–4 nm (Fig. 1a). The high-resolution TEM images (insets of Fig. 1a) showed that M-CD and M-CD2 exhibited ordered crystal structures with lattice spacings of 0.21 nm and 0.32 nm, corresponding to the (100) and (002) planes of graphitic carbon, respectively. In contrast, M-CD1 did not exhibit a discernible crystal structure. These results indicate that as the molar ratio of oPD increases, the ordered π-conjugated domains within the carbon core are formed. Additionally, Fourier transform infrared (FT-IR) spectroscopy was conducted to detect the functional groups in the as-prepared CDs. According to the FT-IR spectra depicted in Fig. 1b, the broad peak centre around ∼3300 cm−1 is assigned to the stretching vibration of N–H groups. The pronounced absorption peak at 1600 cm−1 is attributed to the stretching vibration of the amide C![[double bond, length as m-dash]](https://www.rsc.org/images/entities/char_e001.gif) O bond, suggesting that FA is covalently attached to the surface of M-CDs through the amidation reaction between carboxyl and amino groups. Additionally, the absorption signals at 1275 cm−1 and 750 cm−1 correspond to the stretching vibrations of Ar–N and Ar–H, respectively. The intensity of these two absorption peaks increases gradually as the oPD molar ratio is increased from 1
O bond, suggesting that FA is covalently attached to the surface of M-CDs through the amidation reaction between carboxyl and amino groups. Additionally, the absorption signals at 1275 cm−1 and 750 cm−1 correspond to the stretching vibrations of Ar–N and Ar–H, respectively. The intensity of these two absorption peaks increases gradually as the oPD molar ratio is increased from 1![[thin space (1/6-em)]](https://www.rsc.org/images/entities/char_2009.gif) :
:![[thin space (1/6-em)]](https://www.rsc.org/images/entities/char_2009.gif) 2 to 1
2 to 1![[thin space (1/6-em)]](https://www.rsc.org/images/entities/char_2009.gif) :
:![[thin space (1/6-em)]](https://www.rsc.org/images/entities/char_2009.gif) 20 in the M-CDs. The above data indicate that changes in the precursor ratio have indeed exerted a corresponding impact on the carbon core structure and surface groups of the CDs.
20 in the M-CDs. The above data indicate that changes in the precursor ratio have indeed exerted a corresponding impact on the carbon core structure and surface groups of the CDs.
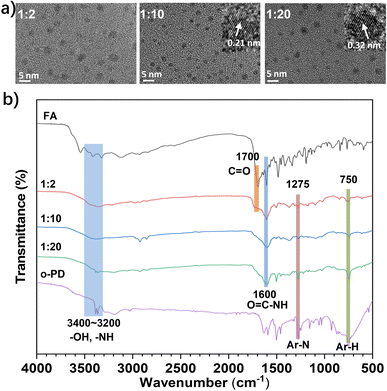 | ||
Fig. 1 (a) TEM and HR-TEM images of three M-CDs synthesized with different molar ratio of FA and oPD (1![[thin space (1/6-em)]](https://www.rsc.org/images/entities/char_2009.gif) : :![[thin space (1/6-em)]](https://www.rsc.org/images/entities/char_2009.gif) 2, 1 2, 1![[thin space (1/6-em)]](https://www.rsc.org/images/entities/char_2009.gif) : :![[thin space (1/6-em)]](https://www.rsc.org/images/entities/char_2009.gif) 10 and 1 10 and 1![[thin space (1/6-em)]](https://www.rsc.org/images/entities/char_2009.gif) : :![[thin space (1/6-em)]](https://www.rsc.org/images/entities/char_2009.gif) 20). (b) FT-IR spectra of FA, M-CD1, M-CD, M-CD2 and oPD. 20). (b) FT-IR spectra of FA, M-CD1, M-CD, M-CD2 and oPD. | ||
The solubility and intracellular behaviour of the M-CDs
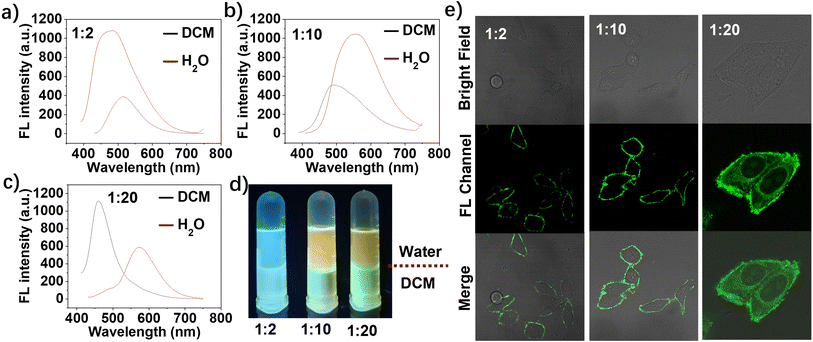
Then, the fluorescence spectra of the three M-CDs were measured in both aqueous solution and dichloromethane (DCM), using the water-DCM interface to simulate an amphiphilic environment similar to a cell membrane. As shown in Fig. 2a–c, the fluorescence intensity of M-CD1 and M-CD2 in aqueous solution is stronger than that in DCM. However, when the molar ratio of FA to oPD was increased to 1![[thin space (1/6-em)]](https://www.rsc.org/images/entities/char_2009.gif) :
:![[thin space (1/6-em)]](https://www.rsc.org/images/entities/char_2009.gif) 20, the fluorescence intensity in DCM was significantly higher than that in aqueous solution. Moreover, the maximum emission peak of M-CDs in aqueous solution gradually redshifted from 450 to 580 nm with increasing molar ratios of oPD (indicated by the red spectra), demonstrating that oPD plays a crucial role in regulating the luminescence centre of the CDs. The fluorescence images of the three M-CDs under irradiation with a 365 nm UV lamp (Fig. 2d) clearly show differences in solubility and fluorescence emission in aqueous solution and DCM, demonstrating the three M-CDs have different amphiphilic properties. Additionally, the dispersion and stability of three M-CDs were determined by dynamic light scattering (DLS). As shown in Fig. S1,† the hydrodynamic sizes of M-CD1, M-CD, and M-CD in aqueous solution were 10 ± 1.2 nm, 26 ± 2.0 nm, and 22 ± 2.3 nm, respectively, which are larger than those obtained by TEM due to the hydration effect. The hydrodynamic sizes of M-CD1 and M-CD remained relatively unchanged after left for 30 days, while the hydrodynamic size of M-CD2 increased to 45 ± 1.8 nm, maybe due to its self-assembly behaviours. However, no visible aggregated precipitation particles were found in the solution, indicating that the synthesized three M-CDs exhibit good stability.
20, the fluorescence intensity in DCM was significantly higher than that in aqueous solution. Moreover, the maximum emission peak of M-CDs in aqueous solution gradually redshifted from 450 to 580 nm with increasing molar ratios of oPD (indicated by the red spectra), demonstrating that oPD plays a crucial role in regulating the luminescence centre of the CDs. The fluorescence images of the three M-CDs under irradiation with a 365 nm UV lamp (Fig. 2d) clearly show differences in solubility and fluorescence emission in aqueous solution and DCM, demonstrating the three M-CDs have different amphiphilic properties. Additionally, the dispersion and stability of three M-CDs were determined by dynamic light scattering (DLS). As shown in Fig. S1,† the hydrodynamic sizes of M-CD1, M-CD, and M-CD in aqueous solution were 10 ± 1.2 nm, 26 ± 2.0 nm, and 22 ± 2.3 nm, respectively, which are larger than those obtained by TEM due to the hydration effect. The hydrodynamic sizes of M-CD1 and M-CD remained relatively unchanged after left for 30 days, while the hydrodynamic size of M-CD2 increased to 45 ± 1.8 nm, maybe due to its self-assembly behaviours. However, no visible aggregated precipitation particles were found in the solution, indicating that the synthesized three M-CDs exhibit good stability.
We next examined the distribution of the three M-CDs in living HepG2 cells (a FR-positive cell line). As shown in Fig. 2e, the three M-CDs showed different cell distribution after incubated with cells for 1 hour. The M-CD stain the intact cell membrane and have the strongest fluorescence intensity (fluorescence collection window 500–650 nm), and M-CD1 exhibit weak fluorescence intensity (the actual collection range is blue region of 430–550 nm, here the pseudo-color of the fluorescent confocal image is set to green for comparison). As the molar ratio of FA to oPD increased to 1![[thin space (1/6-em)]](https://www.rsc.org/images/entities/char_2009.gif) :
:![[thin space (1/6-em)]](https://www.rsc.org/images/entities/char_2009.gif) 20, the M-CD2 were internalized into the cytoplasm. This behaviour is consistent with that of most FA-modified nanoprobes reported currently, which have significant applications in targeted drug delivery to cancer cells. Similar to plasma membrane-targeted molecular probes combining lipophilicity and hydrophilicity, we proposed that the excellent membrane targeting properties of M-CD (1
20, the M-CD2 were internalized into the cytoplasm. This behaviour is consistent with that of most FA-modified nanoprobes reported currently, which have significant applications in targeted drug delivery to cancer cells. Similar to plasma membrane-targeted molecular probes combining lipophilicity and hydrophilicity, we proposed that the excellent membrane targeting properties of M-CD (1![[thin space (1/6-em)]](https://www.rsc.org/images/entities/char_2009.gif) :
:![[thin space (1/6-em)]](https://www.rsc.org/images/entities/char_2009.gif) 10) are probably attributed to the combination of suitable water-solubility and FA–FR affinity, which allows it to stably anchor on the cell membrane for extended periods. These results indicate that dual-function regulation of both fluorescence emission wavelength and intracellular behaviour were achieved through the rational regulation of the molar ratio of precursors (FA and oPD) in a one-step solvothermal synthesis.
10) are probably attributed to the combination of suitable water-solubility and FA–FR affinity, which allows it to stably anchor on the cell membrane for extended periods. These results indicate that dual-function regulation of both fluorescence emission wavelength and intracellular behaviour were achieved through the rational regulation of the molar ratio of precursors (FA and oPD) in a one-step solvothermal synthesis.
The optical properties of the M-CDs
Given the extensive research on FA-based CDs for intracellular targeting, we focus here on the optical properties and applications of membrane-targeted M-CDs (1![[thin space (1/6-em)]](https://www.rsc.org/images/entities/char_2009.gif) :
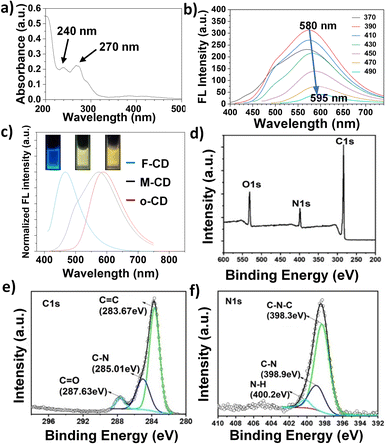
:![[thin space (1/6-em)]](https://www.rsc.org/images/entities/char_2009.gif) 10). As shown in Fig. 3a, the main UV absorption peaks are observed at 240 nm and 270 nm, which can be attributed to the C
10). As shown in Fig. 3a, the main UV absorption peaks are observed at 240 nm and 270 nm, which can be attributed to the C![[double bond, length as m-dash]](https://www.rsc.org/images/entities/char_e001.gif) C bonds in the carbon core and the C
C bonds in the carbon core and the C![[double bond, length as m-dash]](https://www.rsc.org/images/entities/char_e001.gif) O/C
O/C![[double bond, length as m-dash]](https://www.rsc.org/images/entities/char_e001.gif) N bonds on the surface, respectively. Notably, M-CDs exhibit a relatively broad fluorescence emission centered at 580 nm, emitting a bright yellow-green fluorescence. The maximum fluorescence emission peak undergoes a redshift of approximately 15 nm within the excitation range of 370 to 490 nm (Fig. 3b), which is consistent with the narrow particle size distribution observed in transmission electron microscopy (TEM) (Fig. S2†). In contrast, carbon dots synthesized from FA (F-CDs) and oPD (o-CDs) under the same conditions exhibit blue and yellow fluorescence, respectively (Fig. 3c). These results indicate that the incorporation of oPD, which is prone to self-polymerization, effectively modulates the fluorescence of M-CDs while maintaining the targeting capability of F-CDs. As shown in Fig. 3d, the full X-ray photoelectron spectroscopy (XPS) spectrum reveals three peaks at 284.9, 400.4, and 531.3 eV, corresponding to C 1s, N 1s, and O 1s, respectively. High-resolution XPS spectra were then used to analyze the chemical bonding environments of C 1s and N 1s. As illustrated in Fig. 3e and f, C 1s is mainly present in the forms of C
N bonds on the surface, respectively. Notably, M-CDs exhibit a relatively broad fluorescence emission centered at 580 nm, emitting a bright yellow-green fluorescence. The maximum fluorescence emission peak undergoes a redshift of approximately 15 nm within the excitation range of 370 to 490 nm (Fig. 3b), which is consistent with the narrow particle size distribution observed in transmission electron microscopy (TEM) (Fig. S2†). In contrast, carbon dots synthesized from FA (F-CDs) and oPD (o-CDs) under the same conditions exhibit blue and yellow fluorescence, respectively (Fig. 3c). These results indicate that the incorporation of oPD, which is prone to self-polymerization, effectively modulates the fluorescence of M-CDs while maintaining the targeting capability of F-CDs. As shown in Fig. 3d, the full X-ray photoelectron spectroscopy (XPS) spectrum reveals three peaks at 284.9, 400.4, and 531.3 eV, corresponding to C 1s, N 1s, and O 1s, respectively. High-resolution XPS spectra were then used to analyze the chemical bonding environments of C 1s and N 1s. As illustrated in Fig. 3e and f, C 1s is mainly present in the forms of C![[double bond, length as m-dash]](https://www.rsc.org/images/entities/char_e001.gif) C (283.67 eV), C–N (285.01 eV), and C
C (283.67 eV), C–N (285.01 eV), and C![[double bond, length as m-dash]](https://www.rsc.org/images/entities/char_e001.gif) O (287.63 eV), while N 1s is primarily in the forms of C–N (389.9 eV) and N–H (400.2 eV), which mainly arise from the precursors and their chemical reactions. According to the literatures,31,34 the fluorescence quantum yield of M-CD was measured to be 15.8% using quinine sulfate as a reference. The fluorescence decay profiles showed M-CD has a fluorescence lifetime of 0.95 ns (Fig. S3†).
O (287.63 eV), while N 1s is primarily in the forms of C–N (389.9 eV) and N–H (400.2 eV), which mainly arise from the precursors and their chemical reactions. According to the literatures,31,34 the fluorescence quantum yield of M-CD was measured to be 15.8% using quinine sulfate as a reference. The fluorescence decay profiles showed M-CD has a fluorescence lifetime of 0.95 ns (Fig. S3†).
The plasma membrane targeting capability of the M-CD
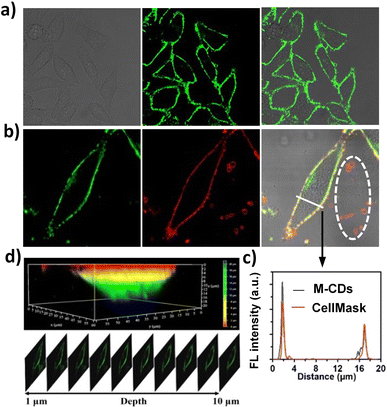
Besides the suitable fluorescence emission and small size of CDs, low cytotoxicity is another key prerequisite for their application in biological imaging. Therefore, we first confirmed the low cytotoxicity of M-CD by using the classic MTT assay before proceeding with live cell imaging. As shown in Fig. S4,† the cell viability of HepG2 cells remains above 85% even after co-incubation with a concentration of 80 μg per mL M-CDs for 24 hours, which is higher than that of o-CD obtained from oPD alone. This suggests that the introduction of FA not only provides targeting capability but also reduces the toxicity of M-CD. Additionally, considering the effects of probe concentration on fluorescence intensity and cytotoxicity, the optimal incubation concentration and time for M-CD in HepG2 cells were determined to be 20 μg mL−1 for 1 hour (see Fig. S5 and S6†). It is evident that M-CD can rapidly stain the plasma membrane within 1 minute.As shown in Fig. 4a, upon treatment with a 20 μg per mL M-CD solution for 1 hour, the cell membrane of HepG2 cells emitted bright fluorescence, whereas F-CD could stain the cell membrane but emitted blue fluorescence, and o-CD were completely internalized into the cells (Fig. S7†). Meanwhile, the commercial plasma membrane dye CellMask Deep Red (an amphipathic molecule) was also used for comparison. As shown in Fig. 4b, the green fluorescence from M-CD overlapped well with the red fluorescence of CellMask, showing similar fluorescence intensity on the plasma membrane (Fig. 4c). However, it should be noted that some membrane structures outside the cell (e.g., vesicles and membrane fragments, marked with a white circle) were also stained red by the commercial amphiphilic dye, whereas M-CD did not stain these structures. This may be because these structures lack FRs and thus cannot bind with M-CD, whereas the commercial dye can still anchor to these membrane structures due to its amphiphilic properties. Additional control experiments involving FA saturation were conducted. When HepG2 cells were pretreated with FA molecules for 2 hours, a significant reduction in fluorescence on the cell membrane was observed (Fig. S8†). These results indicate that the intrinsic cell membrane targeting of M-CD results from the specific binding of the residual FA on their surfaces to FRs embedded in the cell membrane. Taking advantage of the excellent photostability of M-CD (Fig. S9†), the 3D structure of the cell membrane (Fig. 4d, top) in a single HepG2 cell was reconstructed from twenty z-stack photographs (Fig. 4d, bottom, representative images selected). By contrast, the commercial dye CellMask Deep Red quickly loses fluorescence due to photobleaching, even after taking just five images (Fig. S10†).
Identification of cancer cells and long-term plasma membrane imaging
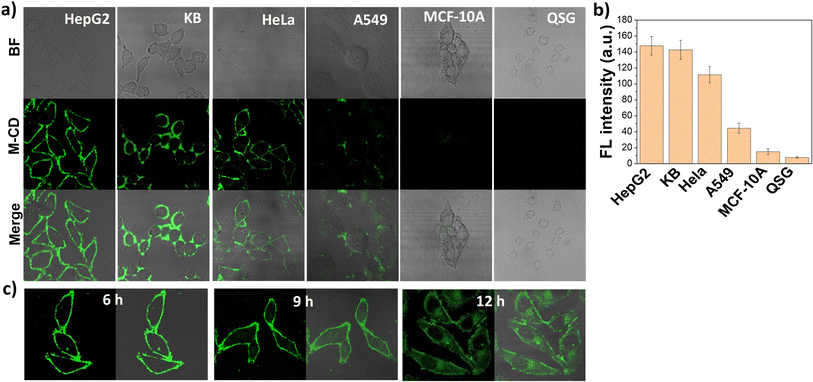
Motivated by the satisfactory performance of M-CDs in HepG2 cells, we further investigated the potential of M-CDs for cancer cell labeling and long-term tracking. According to the literature, we selected two other folate receptor (FR)-overexpressing cell lines (HeLa and KB cells), A549 cells with very low FR levels, and two normal cell lines with almost no FR expression (QSG and MCF-10A). As shown in Fig. 5a, the cell membranes of all the FR-overexpressing cells emitted strong green fluorescence both before and after washing with PBS buffers (Fig. S11†). In contrast, A549 cells with low FR levels showed weak fluorescence, and fluorescence from normal cells was undetectable. The mean fluorescence intensity of the cell lines was directly correlated with their FR expression levels (Fig. 5b), making the fluorescent images distinguishable. Moreover, these phenomena were also confirmed in fixed cells. As shown in Fig. S12,† M-CDs remained staining the cell membrane of fixed HepG2 cells but were internalized into normal cells, further proving that M-CD labelling of cancer cells is achieved through the specific binding between FA and FR. To our surprise, unlike previously reported FR-specific probes that rapidly internalize into the cytoplasm within 2 hours, M-CDs could stably stain the cancer cell membrane over a long co-incubation time ranging from 1 to 9 hours, with only partial internalization observed when the incubation time was extended to 12 hours (Fig. 5c). This provides a long imaging window for in situ visualization of FRs on cell membranes, and compared with the detection of FRs based on intracellular fluorescent signals, this FR-specific in situ cell membrane imaging effectively avoids the influence of non-specific cell uptake.Conclusions
In summary, we have developed a green fluorescent cell membrane-targeted carbon dot (M-CD) by one-step solvothermal treatment of FA and o-PD at appropriate molar ratios. The synthesized M-CD rapidly identified FR-positive cancer cells within 1 min and stably labelled the plasma membrane of cancer cells for more than 9 h without being internalized into the cytoplasm, which effectively avoided the influence of non-specific cellular uptake on cancer detection. Featuring the ease synthesis, intrinsic plasma membrane targeting, rapid staining (<1 min) and sustained plasma membrane labelling, the M-CD is expected to be a powerful tool for the early diagnosis and monitoring of tumour metastasis.Data availability
All relevant date are within the manuscript and its ESI.†Author contributions
Conceptualization: LDZ, RLZ, GMH and ZPZ. Data curation and methodology: TJ, LDZ and YDZ. Formal analysis: JPW, ZJL and GMH. Writing-original draft: TJ, LDZ, GMH. Writing-review & editing: JLG, GMH and ZPZ.Conflicts of interest
The authors declare no competing interests.Acknowledgements
This work was supported by the National Natural Science Foundation of China (22074001, 22134001, 22174001, 22104001 and 22374001).References
- C. Chi, Y. Du, J. Ye, D. Kou, J. Qiu, J. Wang, J. Tian and X. Chen, Theranostics, 2014, 4, 1072–1084 Search PubMed
.
- Pragti, B. K. Kundu and S. Mukhopadhyay, Coord. Chem. Rev., 2021, 448, 214169 Search PubMed
.
- X. Xia, X. Tan, C. Wu, Y. Li, G. Zhao and M. Du, Int. J. Biol. Macromol., 2022, 199, 223–233 Search PubMed
.
- S. Zalba and T. T. Hagen, Cancer Treat. Rev., 2017, 52, 48–57 Search PubMed
.
- M. Ji, P. Li, N. Sheng, L. Liu, H. Pan, C. Wang, L. Cai and Y. Ma, ACS Appl. Mater. Interfaces, 2016, 8, 9565–9576 Search PubMed
.
- Y. Song, W. Shi, W. Chen, X. Li and H. Ma, J. Mater. Chem., 2012, 22, 12568–12573 Search PubMed
.
- Y. Shulpekova, V. Nechaev, S. Kardasheva, A. Sedova, A. Kurbatova, E. Bueverova, A. Kopylov, K. Malsagova, J. C. Dlamini and V. Ivashkin, Molecules, 2021, 26, 3731 Search PubMed
.
- F. Z. Nawaz and E. T. Kipreos, Trends Endocrinol. Metab., 2022, 33, 159–174 Search PubMed
.
- S. K. Sharma, S. K. Lyashchenko, H. A. Park, N. Pillarsetty, Y. Roux, J. Wu, S. Poty, K. M. Tully, J. T. Poirier and J. S. Lewis, Nucl. Med. Biol., 2019, 71, 32–38 Search PubMed
.
- J. Soleymani, M. Hasanzadeh, N. shadjou, M. H. Somi and A. Jouyban, TrAC, Trends Anal. Chem., 2020, 125, 115834 Search PubMed
.
- Q. Lu, Y. Hu, J. Chen and S. Jin, Anal. Chem., 2017, 89, 8238–8243 Search PubMed
.
- L. Zhang and H. Zhang, Adv. Drug Delivery Rev., 2023, 180, 114–133 Search PubMed
.
- Y. Yan, J. Tian, F. Hu, X. Wang and Z. Shen, RSC Adv., 2016, 6, 113991–113996 Search PubMed
.
- Y. Yang, Z. Wang, H. Niu and H. Zhang, Biosens. Bioelectron., 2016, 86, 580–587 Search PubMed
.
- J. Yang, Q. Cheng, C. Zhu, H. Huang, J. Su, W. Ni, B. Ruan, N. Ma and F. Tsai, Mater. Today Chem., 2022, 26, 101202 Search PubMed
.
- R. Xu, L. Huang, W. Wei, X. Chen, X. Zhang and X. Zhang, Biomaterials, 2016, 93, 38–47 Search PubMed
.
- J. Zhang, X. Zhao, M. Xian, C. Dong and S. Shuang, Talanta, 2018, 183, 39–47 Search PubMed
.
- S. Dolai, S. K. Bhunia, S. Rajendran, V. UshaVipinachandran, S. C. Ray and P. Kluson, Crit. Rev. Solid State Mater. Sci., 2021, 46, 349–370 Search PubMed
.
- B. Zhao and Z. Tan, Adv. Sci., 2021, 8, 2001977 Search PubMed
.
- G. Han, J. Zhao, R. Zhang, X. Tian, Z. Liu, A. Wang, R. Liu, B. Liu, M. Y. Han, X. Gao and Z. Zhang, Angew. Chem., 2019, 131, 7161–7165 Search PubMed
.
- L. Jiang, H. Cai, W. Zhou, Z. Li, L. Zhang and H. Bi, Adv. Mater., 2023, 35, 2210776 Search PubMed
.
- B. Zhao, H. Ma, M. Zheng, K. Xu, C. Zou, S. Qu and Z. Tan, Carbon Energy, 2022, 4, 88–114 Search PubMed
.
- I. P.-J. Lai, S. G. Harroun, S.-Y. Chen, B. Unnikrishnan, Y.-J. Li and C.-C. Huang, Sens. Actuators, B, 2016, 228, 465–470 Search PubMed
.
- R. Liu, J. Zhao, G. Han, T. Zhao, R. Zhang, B. Liu, Z. Liu, C. Zhang, L. Yang and Z. Zhang, ACS Appl. Mater. Interfaces, 2017, 9, 38222–38229 Search PubMed
.
- E. Shuang, Q. Mao, X. Yuan, X. Kong, X. Chen and J. Wang, Nanoscale, 2018, 10, 12788–12796 Search PubMed
.
- L. Tong, X. Wang, Z. Chen, Y. Liang, Y. Yang, W. Gao, Z. Liu and B. Tang, Anal. Chem., 2020, 92, 6430–6436 Search PubMed
.
- M. Zhu, L. Guo, Z. He, R. Marzouki, R. Zhang and E. Berdimurodov, J. Colloid Interface Sci., 2022, 608, 2039–2049 Search PubMed
.
- E. Shuang, C. He, J. Wang, Q. Mao and X. Chen, ACS Nano, 2021, 15, 14465–14474 Search PubMed
.
- S. Li, J. Jiang, Y. Yan, P. Wang, G. Huang, N. hoon Kim, J. H. Lee and D. He, Mater. Sci. Eng., C, 2018, 93, 1054–1063 Search PubMed
.
- L. Tong, X. Wang, X. Zhang, C. Xu, M. Qiao, Z. Chen and B. Tang, Talanta, 2024, 273, 125904 Search PubMed
.
- R.-S. Wu, Y.-S. Lin, A. Nain, B. Unnikrishnan, Y.-F. Lin, C.-R. Yang, T.-H. Chen, Y.-F. Huang, C.-C. Huang and H.-T. Chang, Biosens. Bioelectron., 2022, 211, 114362 Search PubMed
.
- K. Li, Y. Lyu, Y. Huang, S. Xu, H.-W. Liu, L. Chen, T.-B. Ren, M. Xiong, S. Huan, L. Yuan, X. Zhang and W. Tan, Proc. Natl. Acad. Sci. U. S. A., 2021, 118, e2018033118 Search PubMed
.
- L. Vaughan, W. Glänzel, C. Korch and A. Capes-Davis, Cancer Res., 2017, 77, 2784–2788 Search PubMed
.
- Z. Fan, Z. Liu, R. Zhang, G. Han and z. Zhang, Chin. J. Anal. Chem., 2021, 49, 1208–1217 Search PubMed
.
Footnotes |
| † Electronic supplementary information (ESI) available: Detailed experimental procedures, characterization and supporting data. See DOI: https://doi.org/10.1039/d4ra03337j |
| ‡ TJ and LDZ contributed equally to this work. |
| This journal is © The Royal Society of Chemistry 2024 |

