 Open Access Article
Strong metal-support interactions of TiO2 interface-loaded Pt constructed under different atmospheres for adjusting the hydrogen storage reaction performance of N-ethylcarbazole†
Zhengjian Hou a,
Ke Wub,
Huijie Weia,
Hua Chia,
Yanyan Xiac,
Lishuang Ma
 ad and
Xufeng Lin
 *ad
*ad
aCollege of Chemistry and Chemical Engineering, China University of Petroleum (East China), Qingdao, 266580, P. R. China. E-mail: hatrick2009@upc.edu.cn; Tel: +86-532-86984695
bChangqing Engineering Design Co. Ltd, PetroChina Changqing Oilfield Company, Xi'an 710000, Shanxi, China
cAdvanced Chemical Engineering and Energy Materials Research Center, China University of Petroleum (East China), Qingdao, 266580, P. R. China
dState Key Laboratory of Heavy Oil Processing, China University of Petroleum (East China), Qingdao, 266580, P. R. China
First published on 28th August 2024
Abstract
In this study, two series of samples (rT-Pt/TiO2 prepared with a hydrogen pretreatment and Tr-Pt/TiO2 prepared with an oxygen pretreatment) were prepared by treating commercial TiO2 supports in different atmospheres to establish different TiO2 interfacial structures, followed by the addition of platinum nanoparticles (NPs) for the catalyzed hydrogenation/dehydrogenation cycle of N-ethylcarbazole (NEC). The kinetic analysis and reaction mechanism were investigated by combining XRD, Raman, CO-DRIFT, HRTEM, XPS, H2-TPD and DFT calculations. It was found that the performance of the samples for the NEC system's cyclic hydrogen storage could be modulated by treating the TiO2 interfacial structure with different atmospheres varying the extent of strong metal-support interaction (SMSI). In addition, a turnover frequency (TOF) of 191.52 min−1 for dehydrogenation was achieved at 170 °C, which is better than the previously reported catalysts. Experimental studies (characterization and kinetic studies) and DFT calculations confirmed that the SMSI of the Tr-Pt/TiO2 series samples promoted the escape of H2 and enhanced the catalytic activity for 4H-NEC in the 12H-NEC dehydrogenation reaction. In the NEC hydrogenation reaction, the rT-Pt/TiO2 series samples were pretreated with H2 before loading platinum metal, which led to the early activation of Ti4+ in their carriers, and thus suppressed the SMSI effect of the reduction process after loading platinum. This process caused the interface formed by rT-Pt/TiO2 to have a higher energy barrier to 6H-NEC, which is an intermediate product of the NEC hydrogenation process, and this interrupted the hydrogenation process of 6H-NEC.
1. Introduction
With the massive consumption of fossil fuels, global environmental and climate issues, and the imperative of carbon neutrality, hydrogen has garnered significant attention in the field of new energy sources due to its high calorific value as a fuel and its environmentally friendly characteristics.1–3 The efficient utilization of hydrogen energy primarily involves production, storage, transportation, and utilization. Among these, hydrogen storage technology is a crucial step limiting the large-scale application of hydrogen energy in industry.4 Over the years, various hydrogen storage technologies have been developed, including metal hydride hydrogen storage, liquid ammonia hydrogen storage, and liquid organic hydrogen carrier (LOHC) hydrogen storage.5–8 The LOHC approach, which relies on the reversible hydrogenation and dehydrogenation of aromatic compounds, offers several advantages such as suitable hydrogen capacity, high safety, low cost, and good compatibility with existing fuel delivery infrastructure. However, many LOHC candidates, such as cyclohexane, dibenzyltoluene, and methylcyclohexane, suffer from slow hydrogen uptake/release kinetics and require relatively high storage and release temperatures.9–11 Recent studies have shown that the introduction of nitrogen atoms can enhance the hydrogen storage performance of LOHCs at lower temperatures. In particular, N-ethylcarbazole (NEC) has emerged as a very promising candidate due to its desirable hydrogen storage capacity of 5.79 wt%, moderate operating temperatures (below 473 K), low volatility, and low toxicity.12–14The schematic hydrogen storage steps of 12H-NEC are illustrated in Fig. 1. Cheng and Yang et al. investigated the kinetic performance of 12H-NEC dehydrogenation over Pd/Al2O3 catalysts.15,16 The dehydrogenation of 12H-NEC proceeds through three primary sequential steps: 12H-NEC to 8H-NEC, 8H-NEC to 4H-NEC, and 4H-NEC to NEC, with the conversion from 4H-NEC to 0H-NEC identified as the rate-determining step. Beyond the structural and property considerations of organic substrates, catalyst performance is pivotal for achieving efficient and cost-effective hydrogen generation and storage. To date, transition metal catalysts comprising expensive elements such as Pt, Pd, Ru, and Rh have demonstrated efficacy in the hydrogenation of NEC and dehydrogenation of 12H-NEC.17–21 Additionally, catalysts supported on various materials, including Al2O3, SiO2, activated carbon (AC), and TiO2, have been employed in NEC-based LOHC systems.22–26 Previous studies indicate that Ru-based catalysts exhibit superior hydrogenation performance for noble metal catalysts on inert supports, while Pd-based catalysts excel in dehydrogenation reactions.27,28 In the context of oxide supports, Fang's group investigated the dehydrogenation activities of M/TiO2 (M = Pt, Pd, Ru, Rh, Au) and found that Pt/TiO2 demonstrated superior dehydrogenation properties compared to Pd.29 Subsequent optimization of Pt content on TiO2 revealed that 1 wt% Pt/TiO2 exhibited optimal dehydrogenation performance, attributed to its strong metal-support interaction (SMSI) effect.30 Furthermore, researchers successfully synthesized TiO2 nanosheet-loaded Pt catalysts with high oxygen vacancy concentrations using solvothermal and annealing–quenching processes. These catalysts showcased excellent 12H-NEC dehydrogenation performance due to the SMSI effect.31,32 While the outstanding dehydrogenation performance of Pt/TiO2 due to SMSI has been established, the catalytic efficiency for NEC cyclic hydrogenation and dehydrogenation reactions remains underreported. Additionally, developing cost-effective Pt/TiO2 catalysts for LOHC applications is crucial.
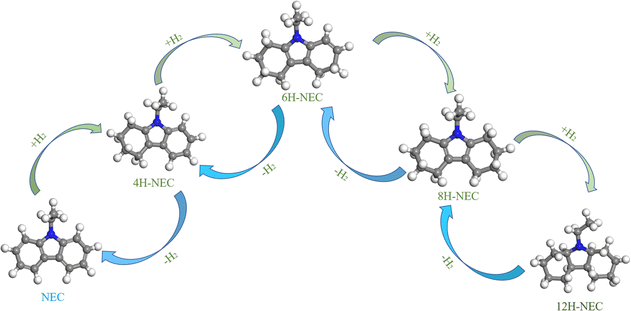 | ||
| Fig. 1 Schematic diagram of the dehydrogenation/hydrogenation processes involving 12H-NEC.12–14 | ||
In order to address these issues, in this study, two series of samples (rT-Pt/TiO2 and Tr-Pt/TiO2, used for hydrogen uptake of NEC and release of 12H-NEC, respectively) were prepared by treating commercial TiO2 supports in different atmospheres to build up different TiO2 interfacial structures, and then loading platinum nanoparticles (NPS). Kinetic analysis and reaction mechanism were investigated by combining XRD, RAMAN, CO-DRIFT, HRTEM, XPS, H2-TPD and DFT. It was found that the performance of the samples in the NEC cyclic dehydrogenation reaction can be tuned by treating the TiO2 interface structure with different atmospheres and utilizing temperature-controlled SMSI. In addition, the turnover frequency (TOF) at 170 °C reached 191.52 min−1, which was superior to previously reported catalysts.30 Both the experimental studies (characterization and kinetic studies) and the DFT calculations confirmed that for the 12H-NEC dehydrogenation reaction, SMSI of the Tr-Pt/TiO2 series samples promotes H2 escape and improves the catalytic activity towards 4H-NEC. In the reaction of NEC hydrogenation, the rT-Pt/TiO2 series samples were pretreated with H2 before loading platinum metal, which led to the initial activation of Ti4+ in their carriers, thus inhibiting the SMSI effect of the reduction process after loading platinum. This process gives the interface formed by rT-Pt/TiO2 a higher energy barrier to 6H-NEC, an intermediate product of the NEC hydrogenation process, which interrupts the excessive competition for adsorption during the hydrogenation process and makes it easier to adsorb and dissociate H2 due to the lower dissociation energy barrier of H2 at the time of the hydrogenation reaction.
2. Experimental section
2.1. Chemicals
N-Ethylcarbazole (97%) was purchased from Aladdin and used as a hydrogenation reactant. H2PtCl6·6H2O and isopropyl alcohol (A.R. >99.7%) were purchased from the Sinopharm Chemical reagent Co., Ltd. P25 was purchased from Degussa Co., Ltd. All atmospheres used are of ultra-pure grade (>99.99).2.2. Catalyst preparation
P25 was used as a support and treated with air or hydrogen at 350 °C and labeled as O–TiO2 and H–TiO2, respectively. Metal component loading via a wetness vacuum impregnation method. In detail, a platinum precursor solution was formed by dissolving 0.162 g of H2PtCl6 in 2.4 g of water (the amount of water was determined based on an equal volume impregnation of 3.0 g of support). The Pt precursor solution was then vacuum impregnated with 3.0 g of O–TiO2 and H–TiO2 powders, respectively, overnight. The impregnated samples were vacuum dried at 120 °C for 4 hours. All the above samples were calcined in H2 at 300 °C, 400 °C, and 500 °C for 4 h with a heating rate of 5 °C min−1 from room temperature. The samples obtained using O–TiO2 support and H–TiO2 support are referred to as Tr-TiO2 and rT-TiO2, respectively (T = 300, 400, 500).For easier reading, the parts of Catalyst characterization, NEC hydrogenation and 12H-NEC dehydrogenation reaction testing, and theoretical calculations are described in the ESI.†
3. Results and discussion
3.1. Characterization of catalysts
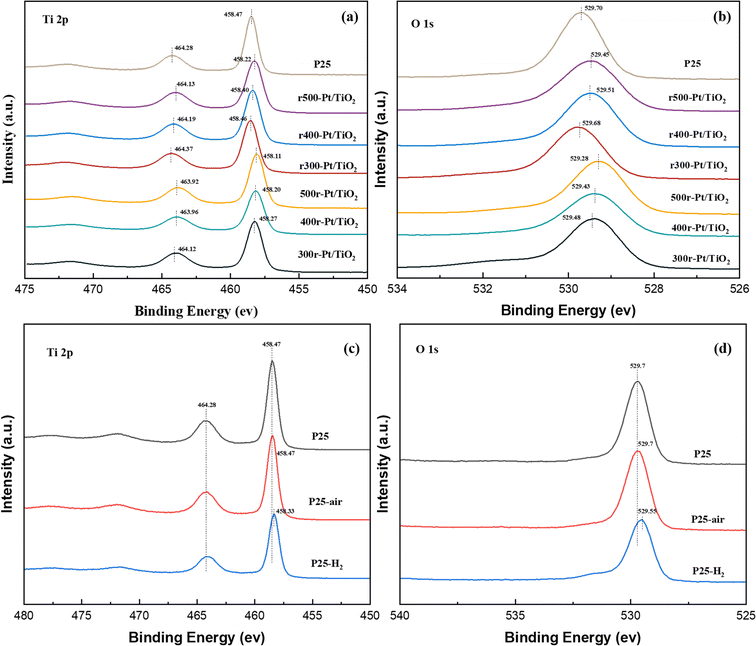
To gain deeper insights into the evolution of the TiO2 chemical state under various atmosphere treatments, X-ray photoelectron spectroscopy (XPS) was employed to meticulously analyze the surface chemistry of the samples, as depicted in Fig. 2. Notably, characteristic peaks centered around 458 eV and 464 eV, attributed to the Ti 2p3/2 and Ti 2p1/2 orbitals, respectively, were consistently observed across all prepared samples. Comparative analysis revealed a slight decrease (∼0.1–0.4 eV) in the binding energies of Ti 2p3/2 and Ti 2p1/2 compared to those of the P25 support (∼458.47 eV and ∼464.28 eV), indicative of electron gains in the Ti 2p orbitals and a reduction in some titanium valence states (Fig. 2a). Similarly, the O 1s orbital peaks, located near 529 eV in all samples, also exhibited a marginal decrease (∼0.1–0.4 eV) in binding energy relative to the O 1s peak observed at 529.70 eV in the P25 support, suggesting enhanced electron coordination of surface oxygen atoms (Fig. 2b). Upon closer examination, samples subjected to hydrogen treatment prior to loading displayed relatively smaller reductions in Ti 2p and O 1s binding energies compared to those treated with oxygen. Moreover, as treatment temperatures increased, the reductions in Ti 2p and O 1s binding energies became more pronounced. The Ti 2p3/2 binding energy notably shifted to lower values following high-temperature reduction, attributed to the phase transformation of TiO2 in the SMSI state to Ti4O7, a well-documented phenomenon in catalysis.33,34 In the case of the O 1s XPS spectrum, it is a typical convolution of the lattice O peaks and the surface hydroxyl peaks. The slight redshift of the O 1s peaks is mainly attributed to two reasons, firstly, the reduction of surface hydroxyls in all of the samples treated with high temperature in hydrogen compared to the clean P25.35 The second reason is that the hydrogen treatment causes a portion of the oxygen on the surface to escape and rearrange during the electron gain outside the Ti orbitals during the SMSI process in order to cause the formation of oxygen defects. Compared to the rT-Pt/TiO2-like samples that have been reloaded by hydrogen pre-treatment of P25, the air pre-treated Tr-Pt/TiO2-like form Ti–Pt–O escaping more O, resulting in a larger red-shift.36,37 In order to understand this behavior more clearly, an XPS energy spectrum analysis was performed on samples of P25 treated at 350 °C under different atmospheres, as shown in Fig. 2c and d. It can be seen that the Ti 2p3/2 binding energy of the hydrogen-treated P25 supported is red-shifted, indicating that the Ti4+ on the carrier surface is partly converted to Ti3+(Fig. 2c). For O 1s the binding energy of hydrogen-treated P25 support P25-H2 also undergoes a redshift of ∼0.15 eV (Fig. 2d), which suggests that both surface lattice oxygen and surface oxygen hydroxyl groups escape under hydrogen treatment. In contrast, there was no significant difference between the oxygen-treated P25 and the P25 dried under argon.For SMSI formed on the stable Pt nanoclusters, the amount of oxygen vacancies in the oxide support is an important factor for the generation of anchor localization sites.38,39 Fig. 3a–d shows the Raman Eg peaks of the above prepared samples. The position of the asymmetric peaks tends to correlate with the number of defects in the lattice.40,41 The Eg vibrational mode observed in the Raman spectrum is intrinsically linked to planar oxygen–oxygen (O–O) interactions, rendering it particularly sensitive to the presence of oxygen defects within the TiO2 lattice. By analyzing the correlation between the peak position and the full width at half-maximum (FWHM) of the most intense Eg mode, typically found around 146 cm−1, the concentration of oxygen vacancies can be quantitatively assessed.42,43 This methodological approach enables a detailed evaluation of the structural and electronic modifications in TiO2, thereby providing critical insights into the material's defect dynamics and their implications on its functional properties. The Raman Eg peak position (violet spectrum) for r300-Pt/TiO2 is nearly identical to that of P25, whereas the peaks for r400-Pt/TiO2 and r500-Pt/TiO2 exhibit slight shifts towards higher wavenumbers. In contrast, the Raman Eg peaks of the Tr-Pt/TiO2 series samples demonstrate significant shifts to higher wavenumbers, with a clear pattern: the higher the reduction temperature of the metal, the larger the shift (500r-Pt/TiO2 > 400r-Pt/TiO2 > 300r-Pt/TiO2). This observation suggests that the higher the formation temperature, the greater the number of oxygen vacancies formed on the surface. Furthermore, it indicates that as the temperature increases, more electron migration occurs from TiOx to Pt. To gain a deeper understanding of this phenomenon, the plots of the proppant before different atmosphere treatments at the same temperature were analyzed to investigate changes in surface oxygen defects (Fig. 3c and d). The three curves intuitively show that, compared to the inert gas-dried and oxygen-treated P25 with the peak center at approximately 145 cm−1, the hydrogen-treated P25–H2 exhibits a significant shift to around 152 cm−1. This shift indicates that hydrogen treatment can effectively promote the generation of oxygen defects on the surface of P25.
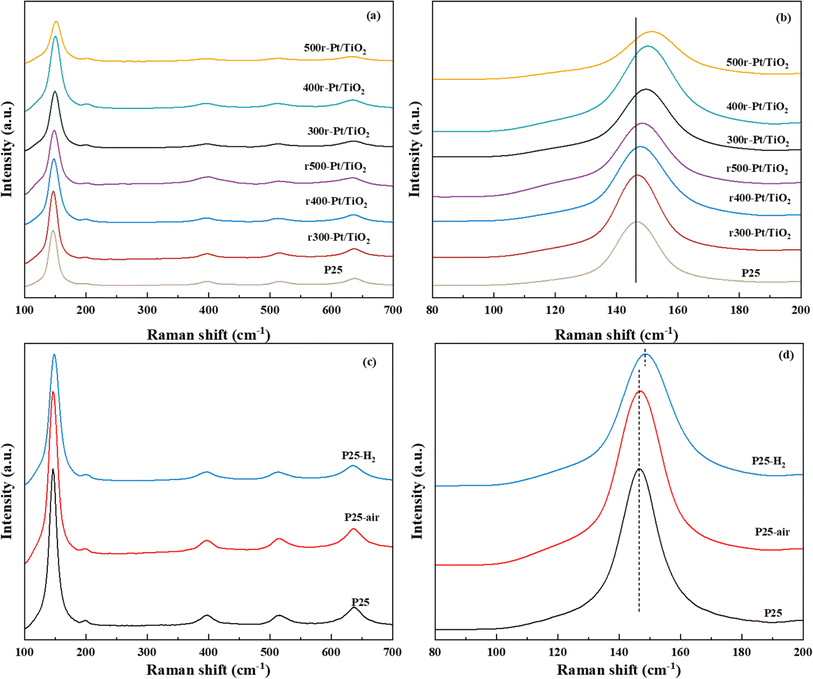 | ||
| Fig. 3 Raman spectra of samples ((a) spectra at 100–700 cm−1, (b) spectra at 80–200 cm−1, (c) spectra at 100–700 cm−1 and (d) 80–200 cm−1, respectively). | ||
The XPS energy spectrum of Pt 4f is shown in Fig. 4a, where Pt exists mainly in the metallic state. For all samples, the orbital energy spectra of the asymmetric peaks located at ∼70.2–70.3 eV and ∼73.5–74.9 eV correspond to Pt 4f7/2 and Pt 4f5/2, respectively. The binding energy of Pt 4f5/2 compared to all samples decreases with the increasing reduction temperature, which is a result of electron transfer from TiO2 to Pt as the work function of Pt is higher than that of TiO2.44–46 The difference in the extent of the SMSI effect between Pt and TiO2 and the gradual transformation of TiO2 into TiOx during hydrogen reduction results in a different number of electrons in the Pt 4f orbitals, and the more obvious the SMSI effect is, the lower the binding energy becomes, and the more electrons are gained in the Pt 4f orbitals.47 In this study, as the hydrogen treatment temperature increases, the lower the binding energy, the more serious the SMSI. While comparing the rT-Pt/TiO2 and Tr-Pt/TiO2 series prepared by hydrogen and air treatment pretreatment carriers, it is obvious that the binding energy of the rT-Pt/TiO2 series is higher than that of the Tr-Pt/TiO2 after the temperature reduction treatment, which indicates that the hydrogen pretreatment carriers can effectively prevent the migration of electrons from the Ti outer electrons to the Pt electrons during the reduction of Pt metal by hydrogen and reduce the degree of SMSI.
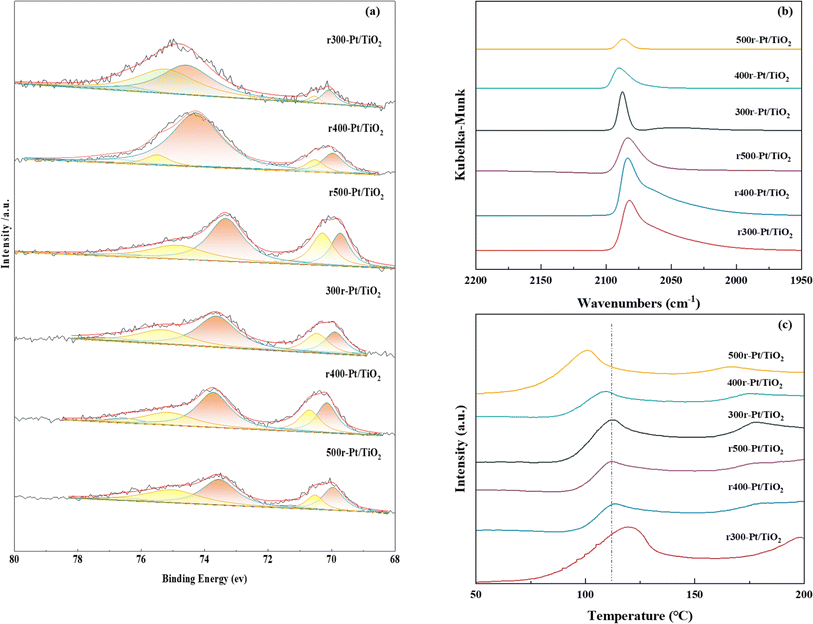 | ||
| Fig. 4 Pt 4f XPS spectra (a), in situ CO-DRIFT spectra (b), H2-TPD profiles (c) of the prepared sample. | ||
In situ CO-DRIFT spectroscopy was performed to explore the adsorption properties and electronic structure of the Pt surface at room temperature, and the results are shown in Fig. 4b. In all the prepared samples, it can be observed a peak centered at ∼2060–2089 cm−1, that corresponds to a CO molecule linearly adsorbed on the Pt (111) platform site with a coordination number of 9.48,49 In contrast to the narrow peak centered at 2085–2089 cm−1 for the Tr-Pt/TiO2 series samples, a bandwidth peak extending to ∼2070 cm−1 appears on the rT-Pt/TiO2 series which is attributed to the linearly adsorption of CO molecules on the low-coordinated edge and corner Pt sites. This behavior also suggests that a portion of the Pt may fall on O vacancies generated by TiO2 escaping oxygen and hydroxyl groups during hydrogen treatment of the P25 supported, as analyzed above. In addition, the CO-DRIFTS analysis provides information on the Pt metal exposure on the sample surface in a semi-quantitative format. Numerous studies have demonstrated that the inhibition of small molecule adsorption (e.g., CO, H2) in the presence of SMSI is a characteristic phenomenon.50–52 Consequently, CO-DRIFTS can be effectively utilized to evaluate the extent of SMSI in various samples. As is apparent from Fig. 4b, the adsorption of CO on Pt in the rT-Pt/TiO2 series of samples increases compared to Tr-Pt/TiO2 using reduced Pt NPs at the same temperature. The relatively low adsorption strength of CO on Tr-Pt/TiO2 is explained by the fact that the metal Pt particles are partially covered by a layer of TiOx, suggesting that the pre-treatment of the P25 support with hydrogen can effectively inhibit the SMSI behavior. As the temperature increases from 300 to 500 °C under the same atmosphere pretreatment, the adsorption of CO on Pt decreased, which indicates that the higher the temperature of the treated reduced Pt NPs, the more severe the partial coverage of TiOx due to the SMSI effect. Among the rT-Pt/TiO2 series samples the same pattern happened, which is a result of the fact that the pretreated support.
A hydrogen overflow state of Pt on the sample surface was investigated by H2-TPD, as shown in Fig. 4c. In the past, chemisorbed hydrogen in samples tended to desorb reversibly at 150–200 °C.53,54 Comparison of the H2 desorption curves shows that the hydrogen overflow capacity of the samples increases (i.e., adsorption of hydrogen decreases) as the temperature of the reduced Pt increases and the temperature of the sample hydrogen overflow decreases. In particular, the r300-Pt/TiO2 sample has the strongest capacity for hydrogen adsorption, while the 500r-Pt/TiO2 sample has the strongest capacity for hydrogen overflow. This behavior also suggests that the SMSI effect promotes the occurrence of hydrogen overflow. The H2 chemisorption analysis is a highly valuable characterization technique for systems exhibiting the SMSI effect. In these systems, an intensified SMSI effect results in reduced H2 chemisorption capability of the metal nanoparticles. Therefore, it is crucial to quantify the H2 uptake of each sample through H2 chemisorption to provide a clear understanding of the SMSI effect's impact on the catalytic properties of the samples. Comparing the hydrogen adsorption peaks of the samples reveals distinct trends: for rT-Pt/TiO2 catalysts treated with hydrogen prior to Pt reduction, the area of the hydrogen adsorption peak diminishes noticeably at equivalent Pt reduction temperatures. Conversely, catalysts subjected to identical carrier treatments exhibit reduced hydrogen adsorption peak areas as the Pt reduction temperature increases. These observations underscore the effectiveness of hydrogen pretreatment in mitigating the SMSI between Pt and TiOx.
For observing the SMSI between Pt clusters and TiO2 supports in the samples, HRTEM was utilized as shown in Fig. 5. In all samples, TiO2 exposed surface is dominated by the (101) surface, while Pt clusters exposed surface is dominated by the (111) surface. Meanwhile, it can be clearly seen that the Pt NPs are directly supported on the TiO2 surface. After the reduction of rT-Pt/TiO2 and Tr-Pt/TiO2, the Pt NPs are wrapped by metal oxides as shown in the HRTEM images, and the wrapping occurring through SMSI can be regarded in the process of Pt NPs being “wetted” by the reduced metal oxides. Such process is mainly driven by the surface tension factor, which is expected to be higher for metals than for metal oxides. This wetting behavior becomes more severe with higher temperatures of reduced Pt (e.g. c > b > a and f > e > d). In addition, it can be clearly seen that the amount of Pt NPs encapsulated by TiOx is reduced in rT-Pt/TiO2 compared to Tr-Pt/TiO2.
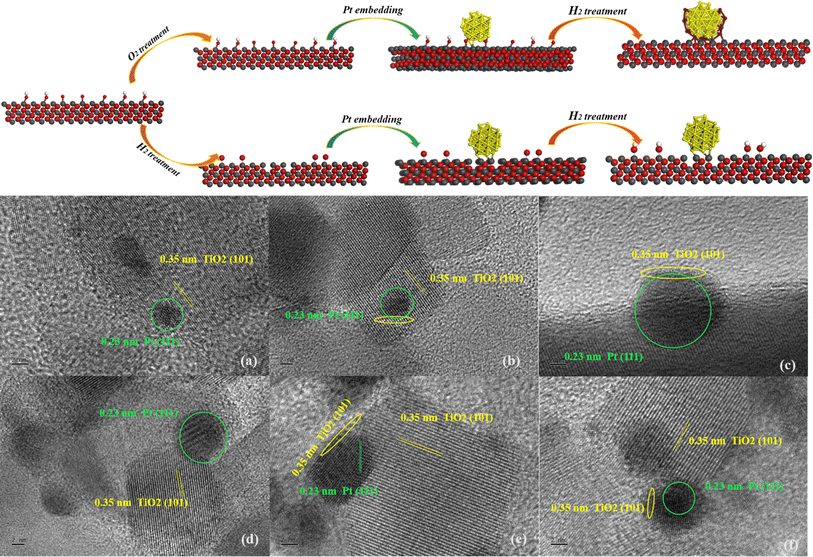 | ||
| Fig. 5 HRTEM images of (a) r300-Pt/TiO2, (b) r400-Pt/TiO2, (c) r500-Pt/TiO2, (d) 300r-Pt/TiO2, (e) 400r-Pt/TiO2, and (f) 500r-Pt/TiO2 (all image scale bars are 2 nm in this figure). | ||
Combined with the above series of sample characterization tests, a certain difference in the surface structure of the samples obtained by loading P25 with Pt NPs in different atmospheres can be clearly analyzed, which is mainly manifested in the distribution of oxygen defect sites and Ti–OH on the surface of the samples. Different from the rT-Pt/TiO2 series samples prepared by hydrogen-treated P25, the Tr-Pt/TiO2 series samples prepared by air-treated P25 have fewer oxygen defects on the surface, which was replaced by more Ti–OH, and this change makes the interfacial structure of the two samples fundamentally different. Specifically, as shown in Fig. 5, the Pt loading process of the air-treated P25-prepared Tr-Pt/TiO2 series samples combined with Ti–O–H at the interface to form a Ti–O–Pt structure. In contrast, the hydrogen-treated support resulted in a Ti–Pt interfacial structure as a result of the generation of oxygen defects and the removal of Ti–OH during hydrogen treatment. On the other hand, the majority of the TI4+ capable of migrating at the interface has been activated in advance by the hydrogen reduction treatment of the P25 support before loading the Pt precursor in the rT-Pt/TiO2 series samples, which leads to only a small amount of TI4+ migrating to the Pt NPS at the interface during the Pt metal reduction process resulting in the reduction of the Pt coverage due to the SMSI effect.
3.2. Hydrogenation and dehydrogenation reaction tests
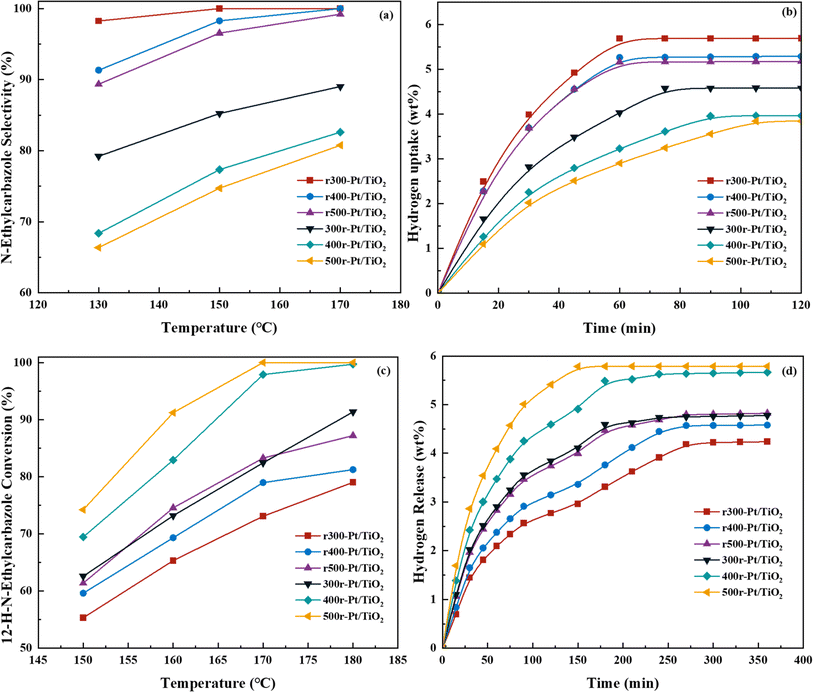
Fig. 6a and b Show the selectivity of six different samples for the complete hydrogenation product (12H-NEC) at different temperatures and the hydrogen consumption for 2 h of hydrogenation at 130 °C. The efficiency of hydrogenation of the samples under NEC at different temperatures is tested, and it can be directly observed that the rT-Pt/TiO2 series samples have higher hydrogenation efficiency than Tr-Pt/TiO2, while hydrogenation efficiency increases with the increase of temperature (Fig. 6a). Desorption of H2 adsorption by Pt is a speedy process. The hydrogen consumption of different samples for catalytic NEC hydrogenation at 130 °C is shown in Fig. 6b. At 130 °C, all six samples display completely different hydrogen consumption curves. In detail, the rT-Pt/TiO2 series of samples consumed more hydrogen at 2 h, and the first inflection point at ∼60 min indicated a stronger adsorption and dissociation of hydrogen. In contrast, the Tr-Pt/TiO2 series samples have lower hydrogen uptake throughout the hydrogenation process, with the saturation inflection point occurring after ∼80 min, with 500r-Pt/TiO2 consuming the lowest amount of hydrogen. It could be related to the deeper SMSI effect of the Tr-Pt/TiO2 series samples after high-temperature reduction as determined by the previous sample characterization above, which has been the adsorption of small molecules of hydrogen.Fig. 6c and d Show the selectivity of six different samples for the total dehydrogenation product (NEC) at different temperatures and the hydrogen release from the dehydrogenation at 170 °C for 6 h. The dehydrogenation efficiencies of the samples under NEC conditions at different temperatures were test, and it can be directly observed that the dehydrogenation efficiency of the Tr-Pt/TiO2 series of samples is higher than that of rT-Pt/TiO2, while the dehydrogenation efficiency increases with the increase of temperature (Fig. 6d). Similarly, the adsorption and desorption of H2 by Pt is a rapid process. The hydrogen release from different samples catalyzing the dehydrogenation of 12H- NEC at 170 °C is shown in Fig. 6d. The hydrogen release profiles of all six samples at 170 °C are completely different. Specifically, the Tr-Pt/TiO2 series of samples released more hydrogen within 6 h. The first inflection point at ∼180 min indicates stronger adsorption and dissociation of hydrogen. In contrast, the rT-Pt/TiO2 series of samples released less hydrogen throughout the hydrogenation process, with the saturation inflection point occurring after ∼210 min, with r300-Pt/TiO2 having the lowest hydrogen consumption. This may be related to the deeper SMSI effect (i.e., inhibition of adsorbed small-molecule hydrogen). After high-temperature reduction of the Tr-Pt/TiO2 series samples, as determined by the sample characterization above. The strongest catalytic dehydrogenation performance of the 500r-Pt/TiO2 samples is related to their strongest SMSI effect as a result of sample characterization.
For a more profound understanding of the changes in all samples during the hydrogenation process, Fig. S5† shows the curves of the concentration of the intermediates during the hydrogenation process. In all of the analyzed intermediates, the concentration of 4H-NEC increased with reaction time when NEC was first hydrogenated to 4H-NEC, with the rT-Pt/TiO2 series peaking faster than the Tr-Pt/TiO2 series (rT-Pt/TiO2 series peaking at ∼20 min and Tr-Pt/TiO2 series at ∼30–40 min). For all samples the lower the metal reduction temperature the faster the 4H-NEC depletion and accumulation (e.g. r300-Pt/TiO2 > r400-Pt/TiO2 > r500-Pt/TiO2 and 300r-Pt/TiO2 > 400r-Pt/TiO2 > 500r-Pt/TiO2). The gradual hydrogenation of 4H-NEC leads to the generation of 8H-NEC, in which the rT-Pt/TiO2 series gradually saturates with 4H-NEC and starts to consume it all at about 45 min, and the concentration of 8H-NEC accumulates to the peak. On the other hand, the concentration of the 8H-NEC in the Tr-Pt/TiO2 series increases slowly until the 4H-NEC is consumed at about 80 min, and the concentration of 8H-NEC accumulates to the peak, and then decreases slowly. Combined with Fig. 6b, it can be analyzed that the accumulation and consumption of 4H-NEC may be mainly influenced by the rate of H2 adsorption and dissociation on the sample. Meanwhile, with the saturated accumulation of 8H-NEC followed by hydrogenation and depletion, the rT-Pt/TiO2 series underwent a rapid depletion at the peak of 8H-NEC concentration (slope of the curve r400-Pt/TiO2 > r500-Pt/TiO2), but obviously the rate of 8H-NEC depletion in Tr-Pt/TiO2 is much lower than that of the rT-Pt/TiO2 series. This behavior suggests that the depletion of hydrogenation and the accumulation of 8H-NEC may be related to the adsorption–dissociation equilibrium of 8H-NEC in the sample itself. Comparing the 12H-NEC, it can be more intuitively found that the generation rate of rT-Pt/TiO2 series is faster (r300-Pt/TiO2 > r400-Pt/TiO2 > r500-Pt/TiO2), with an inflexion point at about 80–100 min, whereas the concentration of 12H-NEC in the samples of the Tr-Pt/TiO2 series continues to increase slowly (300r-Pt/TiO2 > 400r-Pt/TiO2 > 400r-Pt/TiO2) until the end of the reaction at 120 min.
Similarly, in order to gain more insight into the behavior of all samples during the dehydrogenation process, Fig. S6† shows the concentration profiles of the intermediates during the dehydrogenation process. For all analyzed intermediates, when 12H-NEC was first dehydrogenated to 8H-NEC, the concentration of 8H-NEC accumulated with the reaction time, with the Tr-Pt/TiO2 series accumulating to the peak faster than the rT-Pt/TiO2 series (Tr-Pt/TiO2 series peaked at ∼70 min and rapidly consumed at 120–180 min, Tr-Pt/TiO2 series peaked at ∼120 min and rapidly depleted in 120–240 min). For all samples, the higher the metal reduction temperature, the faster the consumption and accumulation of 8H-NEC (e.g., 500r-Pt/TiO2 > 400r-Pt/TiO2 > 300r-Pt/TiO2 and r500-Pt/TiO2 > r400-Pt/TiO2 > r300-Pt/TiO2). The gradual dehydrogenation of 8H-NEC led to the accumulation of 4H-NEC, in which 4H-NEC in the Tr-Pt/TiO2 series was gradually saturated and began to be dissipated at about 80 min. On the other hand, the NEC concentration in the Tr-Pt/TiO2 series increased slowly until 4H-NEC no longer accumulated at about 80 min, and the NEC concentration increased rapidly, with residual 4H-NEC in the 300r-Pt/TiO2. In contrast, in the rT-Pt/TiO2 series, the time to complete large-rate dehydrogenation of 8H-NEC tends to be later (after ∼150 min) and the slope decreases with decreasing metal reduction temperature. In addition, the presence of 8H-NEC was found eventually in both r300-Pt/TiO2 and r300-Pt/TiO2. For all samples, there is a depletion of 8H-NEC and the rate of NEC generation increases substantially. Combine with Fig. 5d, it can be analyzed that the decisive step of the reaction is 8H-NEC to 4H-NEC (rapid adsorption of 8H-NEC is converted to 4H-NEC and then desorbed).
The dehydrogenation reaction was then studied quantitatively. According to the literature, the 12-NEC dehydrogenation reaction can be described as three basic reactions:55,56
where k1, k2 and k3 represent the rate constants for the three basic reactions, respectively, as calculated in the ESI.† The results of the kinetic reaction rate constant calculations are presented in Table 1. Comparing the different samples, it is observed that the order of magnitude of k3 is much smaller than the other two for all samples, which also indicates that the conversion of 4H-NECZ during the reaction limits the dehydrogenation reaction. Meanwhile, TOF values were calculated for comparing the activities of different samples. The size of the TOF values were compared and the Tr-Pt/TiO2 series was more active in the dehydrogenation reaction, with 500r-Pt/TiO2 having the best activity. Combined with the dispersion of different samples and the previous analysis of sample properties, it shows that the reaction temperature affects the sample SMSI effect (the higher the temperature of reduced Pt, the stronger the SMSI effect), and the dehydrogenation activity of the samples in 12H-NEC is further improved with the enhancement of the SMSI effect. Furthermore, when compared to the data reported in the past literature,30 the samples treated directly under hydrogen at 400 °C were more dehydrogenated than the samples reduced with 1.0 wt% Pt/TiO2 and 2.5 wt% Pt/TiO2 sodium citrate (at 170 °C, the 400r-Pt/TiO2 and 500r-Pt/TiO2 samples were more advantageous both in terms of the TOF values and reaction rate).
| Sample | Dispersiona (%) | ICP-MS metalb (wt%) | Rate constant k1 (min−1) | Rate constant k2 (min−1) | Rate constant k3 (min−1) | TOF (min−1) | T (°C) | Ref. | |||||||||||||||||||||||||||||||||||||||||||||||||||||||||||||||||||||||||||||||||||||||||||
|---|---|---|---|---|---|---|---|---|---|---|---|---|---|---|---|---|---|---|---|---|---|---|---|---|---|---|---|---|---|---|---|---|---|---|---|---|---|---|---|---|---|---|---|---|---|---|---|---|---|---|---|---|---|---|---|---|---|---|---|---|---|---|---|---|---|---|---|---|---|---|---|---|---|---|---|---|---|---|---|---|---|---|---|---|---|---|---|---|---|---|---|---|---|---|---|---|---|---|---|
| a Data from CO chemisorption.b Data from ICP-MS. | |||||||||||||||||||||||||||||||||||||||||||||||||||||||||||||||||||||||||||||||||||||||||||||||||||
| 300r-Pt/TiO2 | 16.93 | 1.95 | 0.023 | 0.016 | 0.006 | 93.29 | 170 | — | |||||||||||||||||||||||||||||||||||||||||||||||||||||||||||||||||||||||||||||||||||||||||||
| 400r-Pt/TiO2 | 13.75 | 1.92 | 0.030 | 0.018 | 0.009 | 152.16 | 170 | — | |||||||||||||||||||||||||||||||||||||||||||||||||||||||||||||||||||||||||||||||||||||||||||
| 500r-Pt/TiO2 | 11.23 | 1.93 | 0.031 | 0.019 | 0.011 | 191.52 | 170 | — | |||||||||||||||||||||||||||||||||||||||||||||||||||||||||||||||||||||||||||||||||||||||||||
| r300-Pt/TiO2 | 25.82 | 1.91 | 0.014 | 0.010 | 0.001 | 38.01 | 170 | — | |||||||||||||||||||||||||||||||||||||||||||||||||||||||||||||||||||||||||||||||||||||||||||
| r400-Pt/TiO2 | 21.37 | 1.97 | 0.016 | 0.013 | 0.001 | 50.89 | 170 | — | |||||||||||||||||||||||||||||||||||||||||||||||||||||||||||||||||||||||||||||||||||||||||||
| r500-Pt/TiO2 | 19.11 | 1.97 | 0.022 | 0.014 | 0.004 | 78.25 | 170 | — | |||||||||||||||||||||||||||||||||||||||||||||||||||||||||||||||||||||||||||||||||||||||||||
| 1.0wt%Pt/TiO2 | 24.87 | 0.95 | 0.017 | 0.014 | 0.003 | 95.98 | 170 | 30 | |||||||||||||||||||||||||||||||||||||||||||||||||||||||||||||||||||||||||||||||||||||||||||
| 1.0wt%Pt/TiO2 | 24.87 | 0.95 | 0.046 | 0.029 | 0.012 | 259.73 | 180 | 30 | |||||||||||||||||||||||||||||||||||||||||||||||||||||||||||||||||||||||||||||||||||||||||||
| 2.5wt%Pt/TiO2 | 12.39 | 2.46 | 0.044 | 0.031 | 0.011 | 172.27 | 180 | 30 | |||||||||||||||||||||||||||||||||||||||||||||||||||||||||||||||||||||||||||||||||||||||||||
| Pd/SiO2 | 4.21 | 4.79 | 0.028 | 0.019 | 0.003 | 106.6 | 180 | 22 | |||||||||||||||||||||||||||||||||||||||||||||||||||||||||||||||||||||||||||||||||||||||||||
| Pd3Cu1/SiO2 | 4.03 | 3.72 | 0.052 | 0.023 | 0.005 | 199.9 | 180 | 13 | |||||||||||||||||||||||||||||||||||||||||||||||||||||||||||||||||||||||||||||||||||||||||||
| Ni6@Pd1-R(6)/M41 | — | — | — | — | — | 84.6 | 180 | 24 | |||||||||||||||||||||||||||||||||||||||||||||||||||||||||||||||||||||||||||||||||||||||||||
| Pd-IP/S15 | 70 | — | — | — | — | 13.94 | 170 | 57 | |||||||||||||||||||||||||||||||||||||||||||||||||||||||||||||||||||||||||||||||||||||||||||
| Pd-WP/S15 | 66 | — | — | — | — | 2.63 | 170 | 57 | |||||||||||||||||||||||||||||||||||||||||||||||||||||||||||||||||||||||||||||||||||||||||||
| Pd-WC/S15 | 25 | — | — | — | — | 2.19 | 170 | 57 | |||||||||||||||||||||||||||||||||||||||||||||||||||||||||||||||||||||||||||||||||||||||||||
| Pd/C | 38 | — | — | — | — | 1.36 | 170 | 57 | |||||||||||||||||||||||||||||||||||||||||||||||||||||||||||||||||||||||||||||||||||||||||||
For further understanding of the adsorption mode of 12H-NEC on the samples, DRIFT spectroscopy was used to investigate the surface adsorption behavior of the samples using 12H-NEC as a probe molecule in the present study. The in situ CAL-DRIFT spectra of different samples are shown in Fig. 7. All samples showed four signal peaks in the upper 12H-NEC, in which 2851 cm−1, 2930 cm−1, 2974 cm−1 and 3051 cm−1 were attributed to the C–H2 symmetric stretching mode, the C–H2 asymmetric stretching mode, the C–H3 asymmetric stretching mode, and C–H vibration on the aromatic ring, respectively. In addition, in the lower frequency bands 1480 cm−1,1453 cm−1and 1325 cm−1 were also found to arise on the samples, attributed to C–C symmetry vibrations on the benzene ring, C–C symmetry vibrations on the five-membered ring, and C![[double bond, length as m-dash]](https://www.rsc.org/images/entities/char_e001.gif) C symmetry stretching vibrations on the five-membered ring, respectively. Specifically, it is illustrated that there are no C–H vibrational markers caused by dehydrogenation of the five-membered ring near ∼1550 cm−1 throughout the spectrum, indicating that no dehydrogenation reaction occurred throughout the sample treatment.58 These characteristic peaks indicate that 12H-NEC adsorbs on the prepared samples in a manner consistent with past reports of adsorption on Pt, which are all lying flat on the sample interface.59,60
C symmetry stretching vibrations on the five-membered ring, respectively. Specifically, it is illustrated that there are no C–H vibrational markers caused by dehydrogenation of the five-membered ring near ∼1550 cm−1 throughout the spectrum, indicating that no dehydrogenation reaction occurred throughout the sample treatment.58 These characteristic peaks indicate that 12H-NEC adsorbs on the prepared samples in a manner consistent with past reports of adsorption on Pt, which are all lying flat on the sample interface.59,60
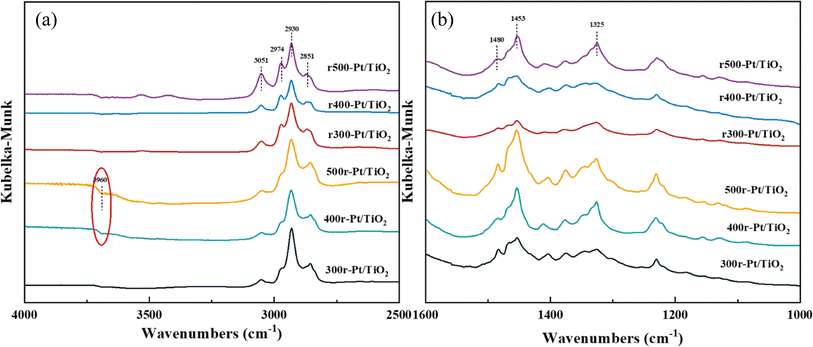 | ||
| Fig. 7 12H-NEC-DRIFT spectra of the samples as indicated in panels ((a) 4000–2500 cm−1, (b) 1200–2000 cm−1). | ||
3.3. Hydrogenation and dehydrogenation reaction tests
In-depth insights into the chemical dynamics of Tr-Pt/TiO2 and rT-Pt/TiO2 models were achieved through detailed DFT calculations, elucidating their respective roles in the reversible hydrogenation–dehydrogenation reactions of 12H-NEC. Fig. S6 and S7† illustrate the structural models used in these calculations, revealing critical reaction pathways and energy profiles during these processes. Central to the performance of these catalytic systems is the adsorption behavior of substrate molecules and the dissociative synthesis of hydrogen, pivotal aspects addressed in Fig. 8. Fig. 8a delineates the adsorption energies of NEC and its derivatives (nH-NEC, where n = 4, 6, 8, 12) on r-Pt/TiO2 and rT-Pt/TiO2 surfaces, alongside the dissociation of hydrogen ions. Notably, nH-NEC exhibits significantly higher adsorption energies on the Tr-Pt/TiO2 surface compared to rT-Pt/TiO2, suggesting stronger interactions that facilitate enhanced 12H-NEC dehydrogenation efficiencies (see Table S3† for comprehensive data). Specifically, the energy profiles across various reaction stages highlight the critical role of the 4H-NEC to NEC transition, where rT-Pt/TiO2 demonstrates a lower energy requirement (−0.37 eV) compared to r-Pt/TiO2 (−0.17 eV), underscoring superior adsorption properties conducive to the dehydrogenation process. Moreover, Fig. 8b details the hydrogen dissociation process on these surfaces. Activation barriers for H–H bond dissociation (TS1) are notably higher on Tr-Pt/TiO2 (0.32 eV) compared to rT-Pt/TiO2, possibly attributed to differences in Ti–Pt versus O–Pt interfacial electron arrangements. Subsequent steps involving Pt–H bond formation and hydrogen transfer exhibit higher energy barriers on Tr-Pt/TiO2 (TS2 at 1.19 eV) relative to rT-Pt/TiO2, indicating greater kinetic challenges in these processes. Conversely, the energy required for the dissociative adsorption of hydrogen onto Pt is lower for rT-Pt/TiO2 (∼0.56 eV), aligning with findings from H2-TPD analyses and suggesting enhanced hydrogen dissociation capabilities crucial for promoting NEC hydrogenation. Integration of experimental data and DFT calculations underscores the advantageous adsorption properties of air-roasted Tr-Pt/TiO2 samples for n-NEC species, owing to their SMSI-induced interfacial structures. Conversely, rT-Pt/TiO2, activated by H2 pretreatment prior to Pt loading, exhibits reduced adsorption capacity for the 6H-NEC intermediate, leading to competitive adsorption with 8H-NEC and higher energy barriers in the dehydrogenation pathway. For the reverse reaction of NEC hydrogenation, rT-Pt/TiO2 demonstrates early Ti4+ activation, mitigating SMSI effects post-Pt loading and facilitating easier H2 adsorption and dissociation. This unique interface configuration lowers energy barriers to H2 dissociation, thereby promoting efficient hydrogenation processes. Integration of experimental data and DFT calculations underscores the advantageous adsorption properties of air-roasted Tr-Pt/TiO2 samples for n-NEC species, owing to their SMSI-induced interfacial structures. Conversely, rT-Pt/TiO2, activated by H2 pretreatment prior to Pt loading, exhibits reduced adsorption capacity for the 6H-NEC intermediate, leading to competitive adsorption with 8H-NEC and higher energy barriers in the dehydrogenation pathway. For the reverse reaction of NEC hydrogenation, rT-Pt/TiO2 demonstrates early Ti4+ activation, mitigating SMSI effects post-Pt loading and facilitating easier H2 adsorption and dissociation. This unique interface configuration lowers energy barriers to H2 dissociation, thereby promoting efficient hydrogenation processes.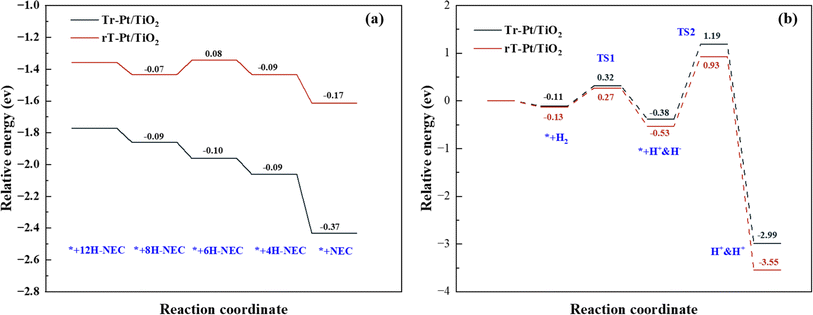 | ||
| Fig. 8 (a) Adsorption energy for related intermediates on the samples and (b) dissociation and synthesis of hydrogen on sample models. | ||
4. Conclusion
In this study, two distinct series of catalyst samples, rT-Pt/TiO2 and Tr-Pt/TiO2, were synthesized through treatments of P25 with contrasting atmospheres (H2 and air), and subsequently applied to cyclic hydrogen storage reactions involving 12H-NEC dehydrogenation and NEC hydrogenation. The investigation focused on understanding the SMSI effects on these catalysts using a combination of experimental techniques and DFT calculations. The results revealed that the SMSI effect was weaker on the rT-Pt/TiO2 surfaces compared to the Tr-Pt/TiO2 series. Specifically, in the rT-Pt/TiO2 samples, Pt NPs were less encapsulated by TiOx during hydrogen reduction. This phenomenon was attributed to the early activation of Ti4+ species on the TiO2 surface following H2 reduction of P25, which induced premature oxygen vacancy formation. Consequently, further reduction and encapsulation of Pt NPs became challenging, and Pt tended to deposit onto defective oxygen sites created by hydrogen treatment. In contrast, the air-treated P25 surfaces maintained stable hydroxyl (OH) and Ti–O structures without defects, facilitating the formation of a robust Ti–O–Pt structure upon Pt loading. This led to a stronger SMSI in the Tr-Pt/TiO2 samples, particularly evident at higher Pt reduction temperatures. Both series of catalysts, rT-Pt/TiO2 and Tr-Pt/TiO2, were evaluated in the NEC hydrogen storage reactions. The Tr-Pt/TiO2 series exhibited superior performance in the 12H-NEC dehydrogenation reaction, highlighting its enhanced catalytic activity for releasing hydrogen. Conversely, the rT-Pt/TiO2 series demonstrated better activity in the NEC hydrogenation reaction, indicating its proficiency in hydrogen uptake and storage. Experimental findings and DFT calculations concurred that the stronger SMSI in the Tr-Pt/TiO2 series facilitated an interfacial structure conducive to H2 spillover and favorable adsorption of dehydrogenation intermediates. Conversely, the weaker SMSI in the rT-Pt/TiO2 series promoted H2 dissociation and uptake, thereby favoring the adsorption of hydrogenation intermediates. In conclusion, this study introduces a straightforward strategy to manipulate the SMSI between Pt and TiO2 by pre-treating TiO2 with different atmospheres prior to Pt loading. This approach not only provides insights into optimizing catalyst design for enhanced hydrogen storage applications using NEC but also opens new avenues for advancing catalytic strategies in renewable energy technologies.Data availability
The data supporting this article have been included as part of the ESI.†Conflicts of interest
The authors declare no competing financial interest.Acknowledgements
Support from the National Natural Science Foundation of China (21576291) and from the Fundamental Research Funds for the Central Universities (23CX03007A) is gratefully acknowledged.References
- Z. Abdin, A. Zafaranloo, A. Rafiee, W. Mérida, W. Lipiński and K. R. Khalilpour, Renewable Sustainable Energy Rev., 2020, 120, 109620 CrossRef CAS.
- J. Yan, Nat. Clim. Change, 2018, 8, 560–561 CrossRef.
- J. O. Abe, A. P. I. Popoola, E. Ajenifuja and O. M. Popoola, Int. J. Hydrogen Energy, 2019, 44, 15072–15086 CrossRef CAS.
- E. L. González, F. I. Llerena, M. S. Pérez, F. R. Iglesias and J. G. Macho, Int. J. Hydrogen Energy, 2015, 40, 5518–5525 CrossRef.
- A. F. Dalebrook, W. Gan, M. Grasemann, S. Moret and G. Laurenczy, Chem. Commun., 2013, 49, 8735–8751 RSC.
- G. Sdanghi, G. Maranzana, A. Celzard and V. Fierro, Renewable Sustainable Energy Rev., 2019, 102, 150–170 CrossRef CAS.
- T. Zhang, J. Uratani, Y. Huang, L. Xu, S. Griffiths and Y. Ding, Renewable Sustainable Energy Rev., 2023, 176, 113204 CrossRef CAS.
- P. T. Aakko-Saksa, C. Cook, J. Kiviaho and T. Repo, J. Power Sources, 2018, 396, 803–823 CrossRef CAS.
- S. Lim, Y. Song, K. Jeong, J. H. Park and K. Na, ACS Sustainable Chem. Eng., 2022, 10, 3584–3594 CrossRef CAS.
- L. K. Macreadie, R. Babarao, C. J. Setter, S. J. Lee, O. T. Qazvini, A. J. Seeber, J. Tsanaktsidis, S. G. Telfer, S. R. Batten and M. R. Hill, Angew. Chem., Int. Ed., 2020, 59, 6090–6098 CrossRef CAS PubMed.
- H. Jorschick, M. Geißelbrecht, M. Eßl, P. Preuster, A. Bösmann and P. Wasserscheid, Int. J. Hydrogen Energy, 2020, 45, 14897–14906 CrossRef CAS.
- B. Wang, T. yan Chang, Z. Jiang, J. jia Wei, Y. hai Zhang, S. Yang and T. Fang, Int. J. Hydrogen Energy, 2018, 43, 7317–7325 CrossRef CAS.
- Z. Jiang, X. Gong, S. Guo, Y. Bai and T. Fang, Int. J. Hydrogen Energy, 2021, 46, 2376–2389 CrossRef CAS.
- X. Yang, Y. Wu, H. Yu, M. Sun, J. Zheng, X. Li, W. Lin and Y. Wu, Int. J. Hydrogen Energy, 2020, 45, 33657–33662 CrossRef CAS.
- M. Yang, C. Han, G. Ni, J. Wu and H. Cheng, Int. J. Hydrogen Energy, 2012, 37, 12839–12845 CrossRef CAS.
- Y. Dong, M. Yang, P. Mei, C. Li and L. Li, Int. J. Hydrogen Energy, 2016, 41, 8498–8505 CrossRef CAS.
- W. Xue, H. Liu, B. Mao, H. Liu, M. Qiu, C. Yang, X. Chen and Y. Sun, Chem. Eng. J., 2021, 421, 127781 CrossRef CAS.
- H. Liu, C. Zhou, W. Li, W. Li, M. Qiu, X. Chen, H. Wang and Y. Sun, ACS Sustainable Chem. Eng., 2021, 9, 5260–5267 CrossRef CAS.
- M. Amende, C. Gleichweit, S. Schernich, O. Höfert, M. P. A. Lorenz, W. Zhao, M. Koch, K. Obesser, C. Papp, P. Wasserscheid, H. P. Steinrück and J. Libuda, J. Phys. Chem. Lett., 2014, 5, 1498–1504 CrossRef CAS PubMed.
- M. Yang, Y. Dong, S. Fei, H. Ke and H. Cheng, Int. J. Hydrogen Energy, 2014, 39, 18976–18983 CrossRef CAS.
- C. Wan, Y. An, F. Chen, D. Cheng, F. Wu and G. Xu, Int. J. Hydrogen Energy, 2013, 38, 7065–7069 CrossRef CAS.
- Z. Jiang, S. Guo and T. Fang, ACS Appl. Energy Mater., 2019, 2, 7233–7243 CrossRef CAS.
- M. Zhu, L. Xu, L. Du, Y. An and C. Wan, Catalysts, 2018, 8, 638 CrossRef.
- Z. Liu, Z. Feng and X. Bai, Colloids Surf., A, 2023, 676, 132277 CrossRef CAS.
- B. Wang, S. yuan Wang, S. han Lu, P. ya Li and T. Fang, Fuel, 2023, 339, 127338 CrossRef CAS.
- C. Dong, Z. Gao, Y. Li, M. Peng, M. Wang, Y. Xu, C. Li, M. Xu, Y. Deng, X. Qin, F. Huang, X. Wei, Y. G. Wang, H. Liu, W. Zhou and D. Ma, Nat. Catal., 2022, 5, 485–493 CrossRef CAS.
- B. Wang, Y. T. Chen, T. Y. Chang, Z. Jiang, Z. Q. Huang, S. Y. Wang, C. R. Chang, Y. S. Chen, J. J. Wei, S. Yang and T. Fang, Appl. Catal., B, 2020, 266, 118658 CrossRef CAS.
- H. Meng, Y. Yang, T. Shen, Z. Yin, J. Zhang, H. Yan and M. Wei, ACS Catal., 2023, 13, 9234–9244 CrossRef CAS.
- Z. Jiang, X. Gong, B. Wang, Z. Wu and T. Fang, Int. J. Hydrogen Energy, 2019, 44, 2951–2959 CrossRef CAS.
- X. Gong, Z. Jiang and T. Fang, Int. J. Hydrogen Energy, 2020, 45, 6838–6847 CrossRef CAS.
- B. Wang, S. han Lu, S. yuan Wang, P. ya Li and T. Fang, Appl. Surf. Sci., 2023, 618, 156558 CrossRef CAS.
- Z. Yang, L. Li, X. Liu, X. Yang, H. Xiong, R. Zhang, Z. Jiang and T. Fang, Chem. Eng. J., 2023, 474, 145896 CrossRef CAS.
- M. S. Kim, S. H. Chung, C. J. Yoo, M. S. Lee, I. H. Cho, D. W. Lee and K. Y. Lee, Appl. Catal., B, 2013, 142–143, 354–361 CrossRef CAS.
- J. Lin, T. Sun, M. Li, J. Yang, J. Shen, Z. Zhang, Y. Wang, X. Zhang and X. Wang, J. Catal., 2019, 372, 8–18 CrossRef CAS.
- R. Wang, N. Sakai, A. Fujishima, T. Watanabe and K. Hashimoto, J. Phys. Chem. B, 1999, 103, 2188–2194 CrossRef CAS.
- N. L. Wu, M. S. Lee, Z. J. Pon and J. Z. Hsu, J. Photochem. Photobiol., A, 2004, 163, 277–280 CrossRef CAS.
- E. Serwicka, Colloids Surf., 1985, 13, 287–293 CrossRef CAS.
- T. W. van Deelen, C. Hernández Mejía and K. P. de Jong, Nat. Catal., 2019, 2, 955–970 CrossRef CAS.
- Z. Luo, G. Zhao, H. Pan and W. Sun, Adv. Energy Mater., 2022, 12, 1–15 Search PubMed.
- K. Fujiwara, U. Müller and S. E. Pratsinis, ACS Catal., 2016, 6, 1887–1893 CrossRef CAS.
- S. Sun, X. Wu, Z. Huang, H. Shen, H. Zhao and G. Jing, Chem. Eng. J., 2022, 435, 135035 CrossRef CAS.
- J. C. Parker and R. W. Siegel, Appl. Phys. Lett., 1990, 945, 943–945 CrossRef.
- J. Zheng, L. Liu, G. Ji, Q. Yang, L. Zheng and J. Zhang, ACS Appl. Mater. Interfaces, 2016, 8, 2–9 Search PubMed.
- H. Huang and D. Y. C. Leung, J. Catal., 2011, 280, 60–67 CrossRef CAS.
- O. S. Alexeev, S. Y. Chin, M. H. Engelhard, L. Ortiz-Soto and M. D. Amiridis, J. Phys. Chem. B, 2005, 109, 23430–23443 CrossRef CAS PubMed.
- M. A. Aramendía, J. C. Colmenares, A. Marinas, J. M. Marinas, J. M. Moreno, J. A. Navío and F. J. Urbano, Catal. Today, 2007, 128, 235–244 CrossRef.
- M. Y. Byun, Y. E. Kim, J. H. Baek, J. Jae and M. S. Lee, RSC Adv., 2022, 12, 860–868 RSC.
- H. Gao, W. Xu, H. He, X. Shi, X. Zhang and K. ichi Tanaka, Spectrochim. Acta, Part A, 2008, 71, 1193–1198 CrossRef PubMed.
- G. J. Kim, D. W. Kwon and S. C. Hong, J. Phys. Chem. C, 2016, 120, 17996–18004 CrossRef CAS.
- Z. Hou, Y. Zhu, H. Chi, L. Zhao, H. Wei, Y. Xi, L. Ma, X. Feng and X. Lin, Chin. J. Chem. Eng., 2024, 70, 189–198 CrossRef CAS.
- J. Zhang, H. Wang, L. Wang, S. Ali, C. Wang, L. Wang, X. Meng, B. Li, D. S. Su and F. S. Xiao, J. Am. Chem. Soc., 2019, 141, 2975–2983 CrossRef CAS PubMed.
- B. Han, Y. Guo, Y. Huang, W. Xi, J. Xu, J. Luo, H. Qi, Y. Ren, X. Liu, B. Qiao and T. Zhang, Angew. Chem., Int. Ed., 2020, 59, 11824–11829 CrossRef CAS PubMed.
- A. Pozio, Z. Jovanovic and S. Tosti, Materials, 2019, 12, 3160 CrossRef CAS PubMed.
- N. Schreiter, J. Kirchner and S. Kureti, Catal. Commun., 2020, 140, 105988 CrossRef CAS.
- M. Yang, Y. Dong, S. Fei and H. Ke, Int. J. Hydrogen Energy, 2014, 39, 18976–18983 CrossRef CAS.
- X. Gong, Z. Jiang and T. Fang, Int. J. Hydrogen Energy, 2020, 45, 6838–6847 CrossRef CAS.
- Z. Feng, Y. Wang and X. Bai, Environ. Sci. Pollut. Res., 2022, 29, 39266–39280 CrossRef CAS PubMed.
- M. Amende, S. Schernich, M. Sobota, I. Nikiforidis, W. Hieringer, D. Assenbaum, C. Gleichweit, H. J. Drescher, C. Papp, H. P. Steinrück, A. Görling, P. Wasserscheid, M. Laurin and J. Libuda, Chem.—Eur. J., 2013, 19, 10854–10865 CrossRef CAS PubMed.
- M. Amende, C. Gleichweit, K. Werner, S. Schernich, W. Zhao, M. P. A. Lorenz, O. Höfert, C. Papp, M. Koch, P. Wasserscheid, M. Laurin, H. P. Steinrück and J. Libuda, ACS Catal., 2014, 4, 657–665 CrossRef CAS PubMed.
- M. Sobota, I. Nikiforidis, M. Amende, B. S. Zanón, T. Staudt, O. Höfert, Y. Lykhach, C. Papp, W. Hieringer, M. Laurin, D. Assenbaum, P. Wasserscheid, H. P. Steinrück, A. Görling and J. Libuda, Chem.—Eur. J., 2011, 17, 11542–11552 CrossRef CAS PubMed.
Footnote |
| † Electronic supplementary information (ESI) available. See DOI: https://doi.org/10.1039/d4ra03386h |
| This journal is © The Royal Society of Chemistry 2024 |

