DOI:
10.1039/D4RA03401E
(Paper)
RSC Adv., 2024,
14, 27092-27109
Catalytic system having an organotellurium ligand on graphene oxide: immobilization of Pd(0) nanoparticles and application in heterogeneous catalysis of cross-coupling reactions†
Received
8th May 2024
, Accepted 20th August 2024
First published on 27th August 2024
Abstract
First heterogeneous catalytic system, having a covalently linked hybrid bidentate organotellurium ligand [i.e., PhTe–CH2–CH2–NH2] on the surface of graphene oxide, has been synthesized with immobilized and stabilized Pd(0) nanoparticles. To the best of our knowledge, it is the first such catalytic system in which a heterogenized organotellurium ligand has been used. It has been well-characterized using different physicochemical characterization techniques viz. P-XRD, XPS, HR-TEM, EELS, FE-SEM, EDX, TGA, BET surface area analysis, FT-IR spectroscopy, and Raman spectroscopy. The Pd content of the final system has been quantified using ICP-OES. Its applications have been explored in Suzuki–Miyaura C–C cross coupling and C–O cross coupling reactions. Hot filtration experiments corroborate the heterogeneous nature of the catalysis. It is recyclable for up to five reaction cycles in Suzuki–Miyaura and C–O cross coupling with marginal loss in performance. It also catalyzes the reactions of chloroarenes such as chlorobenzene, 4-chloroaniline, 1-chloro-4-nitrobenzene, 4-chloroacetophenone, 4-chlorobenzophenone for Suzuki coupling, and 1-chloro-4-nitrobenzene, 4-chlorobenzonitrile, chlorobenzene, and 4-chlorotoluene for C–O coupling. P-XRD, FE-SEM, and EDX study reveals that the catalytic system retains its structural originality and functionality after recycling.
Introduction
In catalysis, chemists use ligands as tools because minute changes in their steric and electronic properties have a significant impact on the performance, properties and functioning of the catalyst. Such changes can also be used to influence the catalytic reactions. The impact of ligand's structure on catalytic processes has been investigated both experimentally1–9 and theoretically.10–12 In the case of coupling reactions, which are heavily applied tools in chemical transformations, bond-making and bond-breaking processes are very important. A variety of ligands, including Schiff bases, pincer ligands, and heterocyclic compounds such as triazoles and pyridines, have become well-known for synthesizing transition metal catalytic systems for such reactions.13–16 Additionally, over the last decade, a variety of organosulphur and organoselenium ligands have also been explored for designing homogeneous, heterogeneous, and nanocatalytic systems for such reactions.17–25 However, the use of organotellurium ligands is very much limited, and that too only to the designing of homogeneous complexes.26–33 Unlike organosulphur and organoselenium ligands, they have been rarely used in designing heterogeneous or nanocatalytic systems.
In heterogeneous catalytic systems, an appropriate inert support (oxide of metals,32,33 silica,34 double hydroxides of layered structure35 and graphene/graphene oxide36,37) is used to immobilize the metal nanoparticles38 or coordination complex of the metal.39 Such catalytic systems are known for their specific advantages including efficiency, selectivity, high conversion rate, surface area, and reusability under mild conditions.40–47 Stabilizing the noble metal nanoparticles with organic capping agents (i.e. stabilizers) is common, but these stabilizers can impact catalytic activity due to their binding to the metal surface.48 However, if small nanoparticles of uniform size are immobilized over the surface of a solid support to obtain a stable catalytic system, high activity may be achieved due to the high surface area to volume ratio and high population of catalytically active surface Pd atoms. Such modification and functionalization of the surface of the solid support with nanoparticles are very advantageous from the point of view of desired catalytic properties for specific applications.49 Among various solid supports used for this purpose, graphene oxide is very attractive because of its unique electronic structure, mechanical strength, and chemical stability.50 It has epoxy and hydroxyl groups at the basal planes and carboxylic groups at the edges of the sheets.51 Materials of tremendous potential have been synthesized by grafting nanomaterials on graphene oxide (GO).52 Graphene/GO embedded with palladium nanoparticles are known as potent species for catalyzing multiple reactions e.g., C–C cross coupling, and C–O coupling reactions.52–59
Tellurium, a metalloid, is distinct from other elements in its group, and its chemistry has been relatively understudied despite its unique properties. Organotellurium compounds have distinct characteristics compared to similar sulphur and selenium derivatives. Due to the presence of Te, such compounds are known to possess antioxidant,60 anti-inflammatory,61 neuroprotective,62 chemopreventive,63 and glutathione peroxidase64 like activities. In some cases, they also possess toxic effects to the central nervous systems of various rodents and mammals, which can lead to mutagenicity and carcinogenicity.65 They may also have a dual biological functioning. Depending on the biological redox environment, they may have both harmful and helpful effects.60–66 When Te is present in the framework of the organic compounds, they may behave as ligands. Hence, they can also be used as potentially valuable candidates in catalyst development.27,28,67,68 The combination of tellurium and palladium demonstrates synergistic effects and potential for enhanced catalytic performance.69,70 It has, therefore, been thought worthwhile to modify the surface of GO with immobilization of hybrid organotellurium ligand, i.e., Ph–Te–CH2–CH2–NH2, through covalent interactions so that a novel system may be obtained having a combination of chelating donor (Te and N) groups on the surface of GO. Presence of such donor groups allows the system to offer strong binding sites to the Pd NPs and hold them efficiently without any significant agglomeration and leaching problems. It may also lead to the development of Pd NPs based stable and recyclable catalytic system. A pair of Te and N donor groups, i.e., a combination of soft and hard donor sites capable of chelating, is also worth exploring in the context of heterogenized form. Thus, the GO surface modified with covalently linked Te donor site containing primary amine is reported herein for the development of heterogeneous catalytic system having Pd NPs. It has the potential to efficiently catalyze Suzuki coupling and C–O coupling reactions at low catalyst loading. Pd NPs immobilized on heterogenized organotellurium compound (i.e., tellurated ethyl amine) on the surface of GO and their application in the catalysis of the coupling reactions is reported for the first time to the best of our knowledge. The catalytic system [i.e., nanosized GO–TeN–Pd(0)] is highly stable, efficient, heterogeneous and reusable. These reactions, catalyzed with it, could be beneficial, as these reactions are considered as important tools in the synthesis of agrochemical, pharmaceutical, and perfume industry.71–74
Results and discussion
Synthesis of GO–TeN–Pd(0) nanocatalyst
Hummers' method75 has been adopted to produce graphene oxide (Scheme 1) which is required for the development of the heterogeneous catalytic system. It is subjected to wet chemical treatment in the next step to functionalize it with hydroxyl, epoxide, and carboxyl groups. 2-(Phenyltelluro)ethylamine has been synthesized using reported procedure.76 The GO structure has COOH groups which have the ability to form chemical bonds with 2-(phenyltellanyl)ethanamine (Ph–Te–CH2–CH2–NH2) through an amide linkage. However, it is preferred to increase the abundance of carboxyl groups on GO before immobilization of the ligand. Hence, the reaction of GO has been carried out with chloroacetic acid. It constituted a part of the wet chemical treatment process. During this reaction, the epoxy and hydroxyl groups of GO are targeted and converted into COOH groups. In the next step, the treatment of the 2 was done with thionyl chloride to convert COOH groups into –COCl groups (i.e., the species 3). In the next step, Ph–Te–CH2–CH2–NH2 was immobilized covalently over the 3 (i.e., functionalized GO) using a reaction in which it has been treated (Scheme 1) with the 3 (GO–COCl) in DMF. This system includes Te and N bidentate donor sites. In the last step, the GO–TeN is treated with Na2PdCl4 and NaOH solution to achieve the catalytic system [i.e., GO–TeN–Pd(0)].
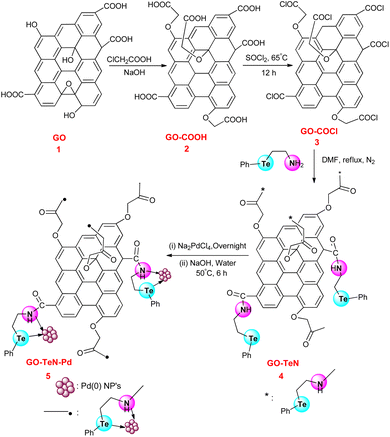 |
| | Scheme 1 Protocol for surface modification of graphene oxide with organotellurium ligand and immobilization of Pd(0) nanoparticles onto Te, N ligand-functionalized graphene oxide. | |
Stepwise characterization of GO, GO–COOH, GO–TeN and GO–TeN–Pd(0)
Various spectroscopic and microscopic characterization techniques, including powder-XRD (Fig. 1), XPS (Fig. 2), Raman (Fig. 3), HR-TEM (Fig. 4), HAADF-STEM (Fig. 6), FE-SEM (Fig. 7), EELS (Fig. 8–13 and ESI: Fig. S9–S11†), TGA (Fig. 14), BET surface area studies (Fig. 15), EDS (ESI: Fig. S1–S4†), FT-IR (ESI: Fig. S5–S8†), and ICP-OES have been used to study the structural and morphological properties of graphene oxide and its functionalized surface at every step. All these studies corroborate the formation of the nanocatalytic system [i.e., GO–TeN–Pd(0)].
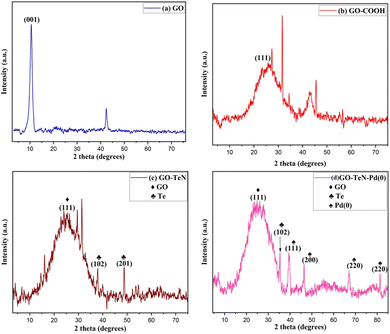 |
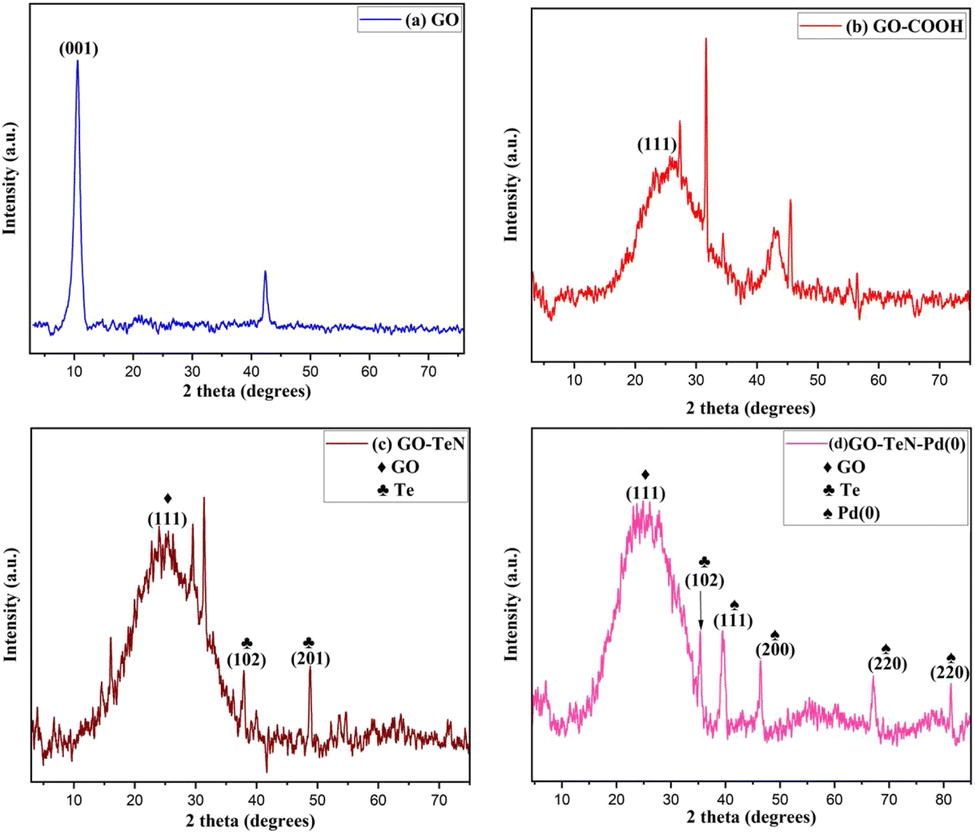
| | Fig. 1 P-XRD patterns of (a) GO, (b) GO–COOH, (c) GO–TeN and (d) GO–TeN–Pd(0). | |
Powder X-ray diffraction (P-XRD)
The study of the powder X-ray diffraction (P-XRD) patterns (Fig. 1) provide substantial evidence of the formation of a heterogeneous catalyst. In the initial state, graphene oxide (GO) exhibits a well-defined peak [Fig. 1(a)] at 2θ = 10.5°, corresponding to the (001) plane, affirming the presence of GO. Upon carboxylation of GO, this peak at 2θ = 10.5° vanishes, giving way to a new broad peak [Fig. 1(b)] at 2θ = 24.4° (111). The emergence of this (111) peak signifies the conversion of hydroxyl (–OH) and epoxy groups in GO into carboxylic groups. This transformation is consistent with literature reports.53 The alterations in the intensities of P-XRD patterns of GO–TeN in comparison to GO–COOH [Fig. 1(c)] suggest the formation of amide linkages with the ligand (Ph–Te–CH2–CH2–NH2). Additionally, peaks at 2θ = 37.9° (102) and 48.8° (201) are attributed to the presence of Te. Finally, the P-XRD pattern of GO–TeN–Pd(0) [Fig. 1(d)] gives strong indication of the presence of a cubic crystalline Pd(0) phase. Peaks at (hkl) 111, 200, 220, and 311, corresponding to Pd(0) nanoparticles, appear at 2θ = 39.9°, 46.2°, 67.1°, and 81.5°, unequivocally confirming the existence of the Pd(0) phase.
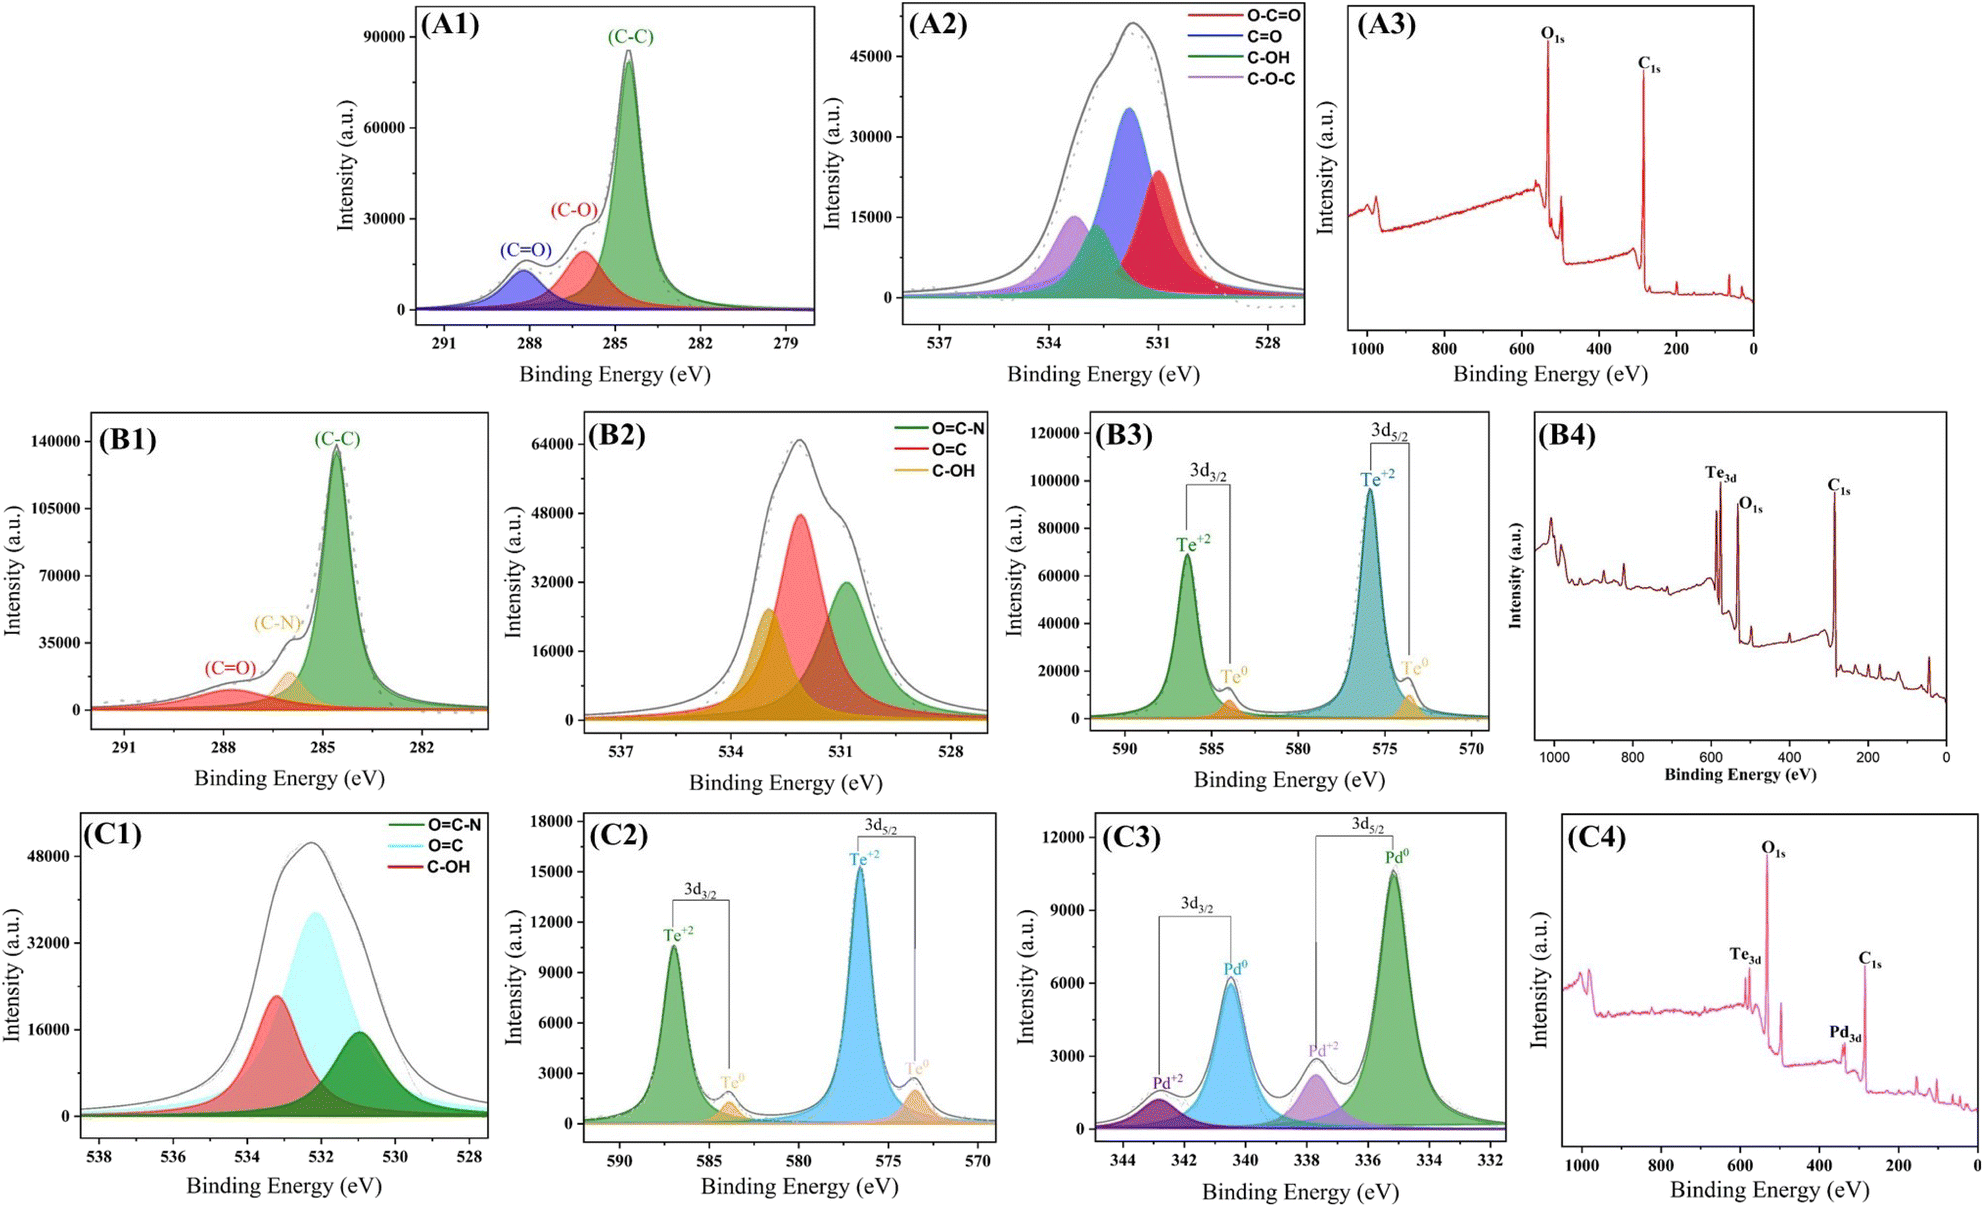
X-ray photoelectron spectroscopy (XPS)
X-ray photoelectron spectroscopic (XPS) studies (Fig. 2) have been conducted for GO–COOH, GO–TeN, and GO–TeN–Pd(0) to gain insights into the chemical entities incorporated during the functionalization procedure. Gaussian functions were employed to fit the XPS spectra (Fig. 2). In the XPS data for GO–COOH, three distinct C 1s peaks [Fig. 2(A1)] were observed at binding energies of 284.7, 286.7, and 288.9 eV. These peaks attributed to sp2 carbon bonds within the graphene sheet, carbon atoms attached to oxygen atoms via single bonds, and the presence of carboxylic acid groups (–COOH) on the sheet's surface. Subsequently, the XPS survey exhibits 2 discernible O 1s peaks [Fig. 2(A2)], representing C–O and C(![[double bond, length as m-dash]](https://www.rsc.org/images/entities/char_e001.gif) O)OH groups.77
O)OH groups.77
 |
| | Fig. 2 XPS spectra of (i) GO–COOH; (A1): C 1s (A2): O 1s (A3): full, (ii) GO–TeN; (B1): C 1s (B2): O 1s (B3): Te 3d (B4): full, (iii) GO–TeN–Pd(0); (C1): O 1s (C2): Te 3d (C3): Pd 3d (C4): full. | |
Species 4 (i.e., GO–TeN) contains organotellurium compound, covalently linked on the surface of GO. Its XPS spectrum has a single peak for N 1s [Fig. 2(B1)] and Te 3d [Fig. 2(B3)], along with 2 prominent C 1s peaks [Fig. 2(B4)]. These C 1s peaks are attributed to the formation and existence of the C–N bond between the ligand and sp2 carbons of the carbonyl group of GO (i.e., the graphene sheet).
Subsequently, GO–TeN is transformed (Scheme 1) into the final nanocatalytic system, i.e., species 5 [GO–TeN–Pd(0)]. The XPS data [Fig. 2] validates the existence of all anticipated elements (i.e., C, N, O, Te, and Pd) in this system. The peaks, corresponding to Pd 3d5/2 & Pd 3d3/2 [Fig. 2(C4)], corroborate the presence of Pd NPs.78–81 These 3d peaks of Pd correspond to spin–orbit splitting, resulting in 3d5/2 and 3d3/2 states. The binding energies of the 3d5/2 & 3d3/2 states of Pd have been determined and found to be 335.1 eV and 340.4 eV, respectively. The values indicate the presence of Pd in zero oxidation state.78 They are in line with reported values for Pd(0),79–81 in which the order of 3d5/2 and 3d3/2 states follows the trend i.e., 3d5/2 < 3d3/2.
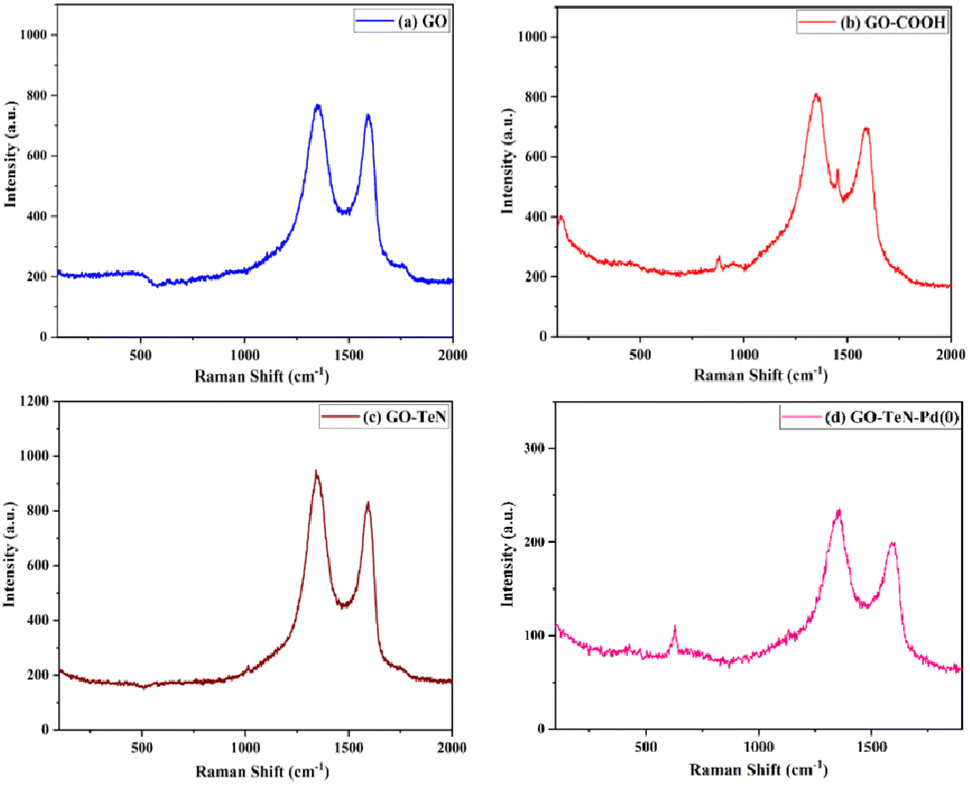
Raman spectroscopy
Raman spectroscopy is a non-invasive tool, used for unveiling the intricate structural and compositional traits inherent in carbon-based materials. Raman spectroscopic studies (Fig. 3) have been conducted systematically on graphene oxide (GO), GO–COOH, GO–TeN, and GO–TeN–Pd(0) to understand the changes experienced by GO during its transformation (Scheme 1) from 1 to 5 [i.e., GO–TeN–Pd(0)]. The Raman spectrum of GO [Fig. 3(a)] has the characteristic D and G bands, located at 1358 and 1599 cm−1, respectively. However, the D band in GO–COOH (i.e., 2), GO–TeN (i.e., 4), and 5 [i.e., GO–TeN–Pd(0)] is seen [Fig. 3(b)–(d)] at 1352, 1347, and 1341 cm−1, respectively. On the other hand, the G band resonates at 1591, 1584, and 1578 cm−1 in these species (i.e., 2, 4 and 5). These changes in the spectrum suggest that the wet chemical treatment damages the carbon–carbon conjugation in the graphene sheets.
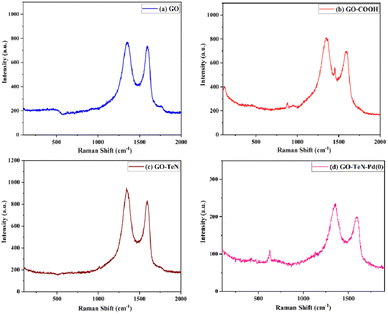 |
| | Fig. 3 Raman spectra: (a) GO, (b) GO–COOH, (c) GO–TeN and (d) GO–TeN–Pd(0). | |
The quantified intensity ratio of the D- and G-bands, represented as ID/IG, is considered as an indicator of the quality of the graphitic structure. The reliability of this indicator is known to be high. When pyrolyzed graphite is highly ordered, its value asymptotically approaches zero.82 The values of ID/IG ratios for GO, GO–COOH, GO–TeN, and GO–TeN–Pd(0) have been unequivocally determined and found to be 1.18, 1.43, 1.75, and 1.82 respectively. This increase (i.e., the progressive change) in the values of the ratio from GO to GO–TeN–Pd(0) signifies a concurrent diminishment in the dimensions of the sp2 domains and an amplification in the degree of structural disorder and surface irregularities. This increase during the conversion of the 4 into the 5 may be used to infer the presence of Pd(0) nanoparticles in the 5.
High resolution-transmission electron microscopy (HR-TEM)
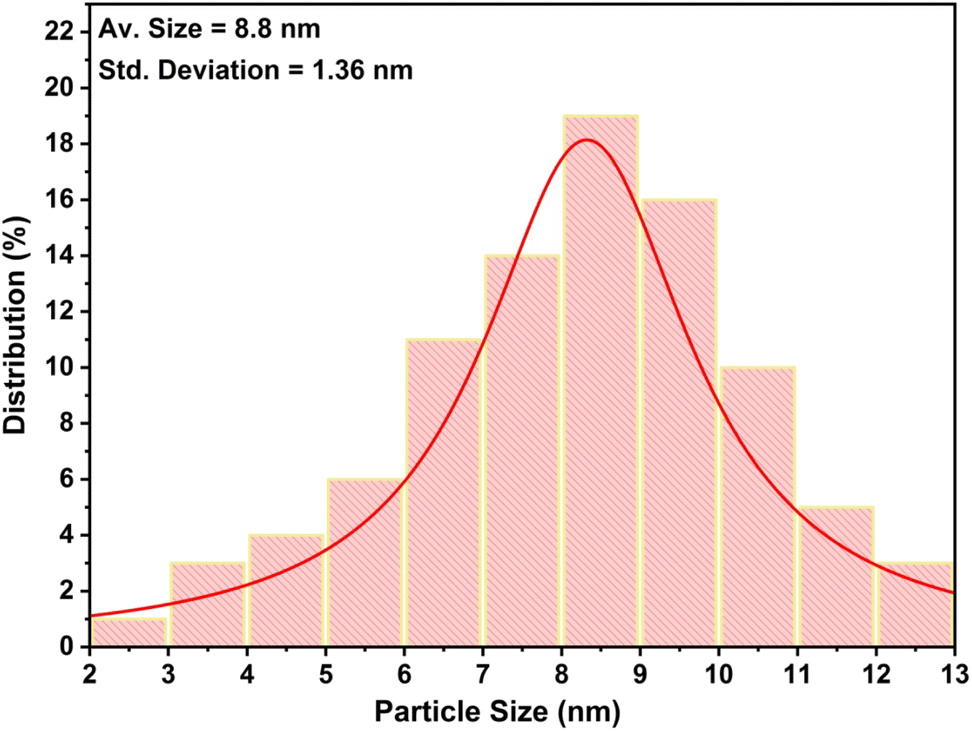
High resolution-transmission electron microscopic (HR-TEM) studies (Fig. 4) provide interesting information about the surface morphology, structure, and configuration of both GO and the nanocatalytic system 5 [i.e., GO–TeN–Pd(0)]. The HR-TEM images reveal that GO [Fig. 4(a)] is made up of translucent sheets exhibiting wrinkles and folds. These features are indications of the successful exfoliation of graphene-stacked layers during the oxidation process. Such a process is a prerequisite for chemical functionalization of the sheets. Spherical Pd(0) NPs have size distribution with a mean particle size of ∼9 nm (Fig. 5) are uniformly dispersed [Fig. 4(b)–(d)] over the surface of Te and N functionalized GO sheets. HR-TEM image Fig. 4(d) showing the lattice fringes have a distance of 0.233 nm, assigned to the Pd(0) (111) crystal plane.
 |
| | Fig. 4 TEM images: (a) GO at 100 nm, (b)–(d) GO–Te–Pd(0) at 100 nm, 10 nm and 5 nm respectively. | |
 |
| | Fig. 5 Size distribution graph of Pd(0) nanoparticles present in the catalytic system. | |
High angle annular dark field scanning TEM (HAADF-STEM) images [Fig. 6(a) and (b)] of GO–TeN–Pd(0) also reveal the dispersion of palladium nanoparticles over the functionalized graphene oxide sheet. The intensity of the HAADF-STEM images depends on the thickness when the objects have homogeneous composition. This image shows constant intensity, indicating the presence of palladium nanoparticles.
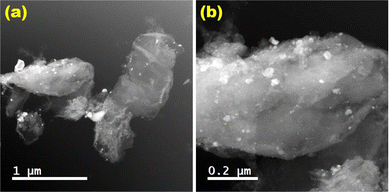 |
| | Fig. 6 HAADF-STEM image of GO–TeN–Pd(0) at (a) 1 μm; (b) 0.2 μm. | |
Field emission-scanning electron microscopy (FE-SEM)
The FE-SEM images [Fig. 7(a) and (b)] of GO and GO–TeN–Pd(0) give intriguing insights. In the case of GO, a typical layer structure characteristic of graphene is observed [Fig. 7(a)]. Fig. 7(b) showcases the surface of telluroamine-functionalized GO immobilized with Pd(0) nanoparticles. The SEM-EDX spectrum (ESI: Fig. S1–S4†), unequivocally confirms the presence of palladium, tellurium, nitrogen, carbon and oxygen in the nanocatalyst [i.e., GO–TeN–Pd(0)]. The atomic composition of the nanocatalyst, as quantified by EDX analysis, includes carbon (57.84 wt%), nitrogen (5.23 wt%), oxygen (22.47 wt%), palladium (9.86 wt%), and tellurium (4.61 wt%).
 |
| | Fig. 7 FE-SEM images: (a) GO and (b) GO–Te–Pd(0). | |
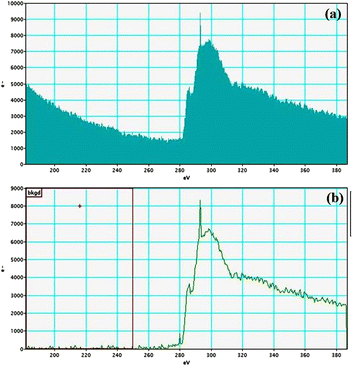
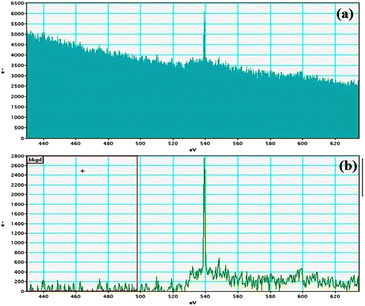
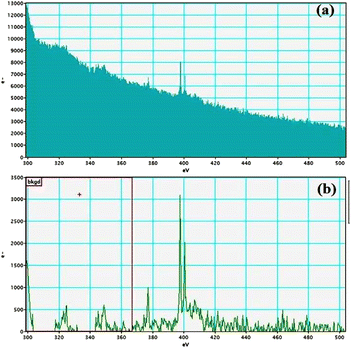
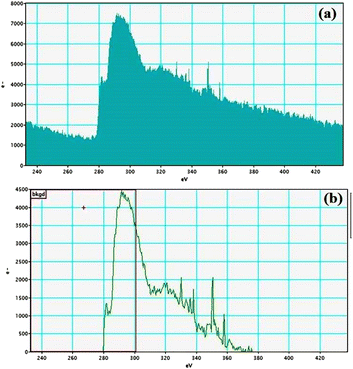
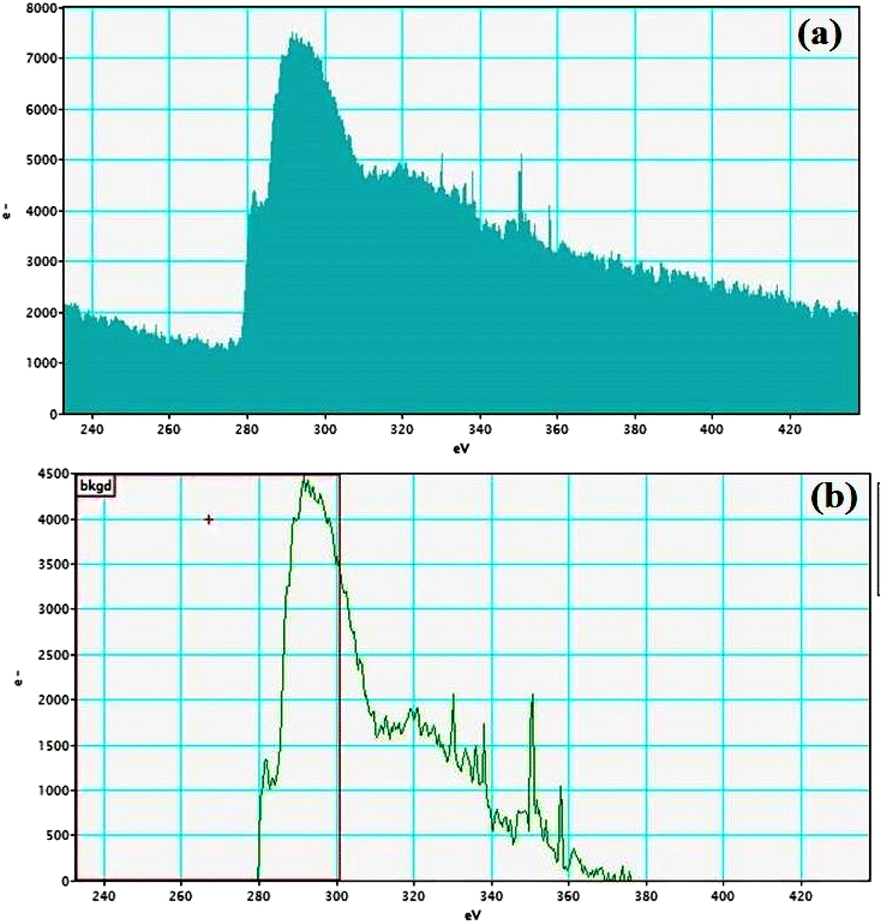
Electron energy loss spectroscopy (EELS)
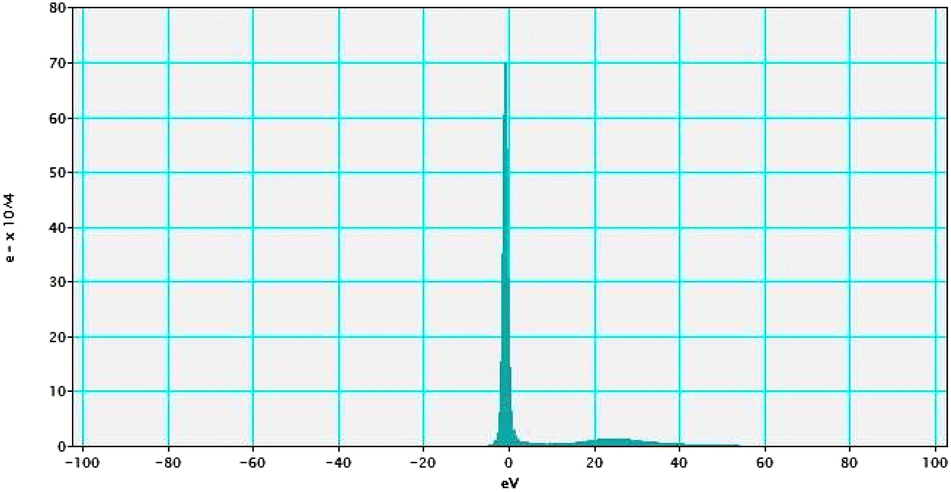
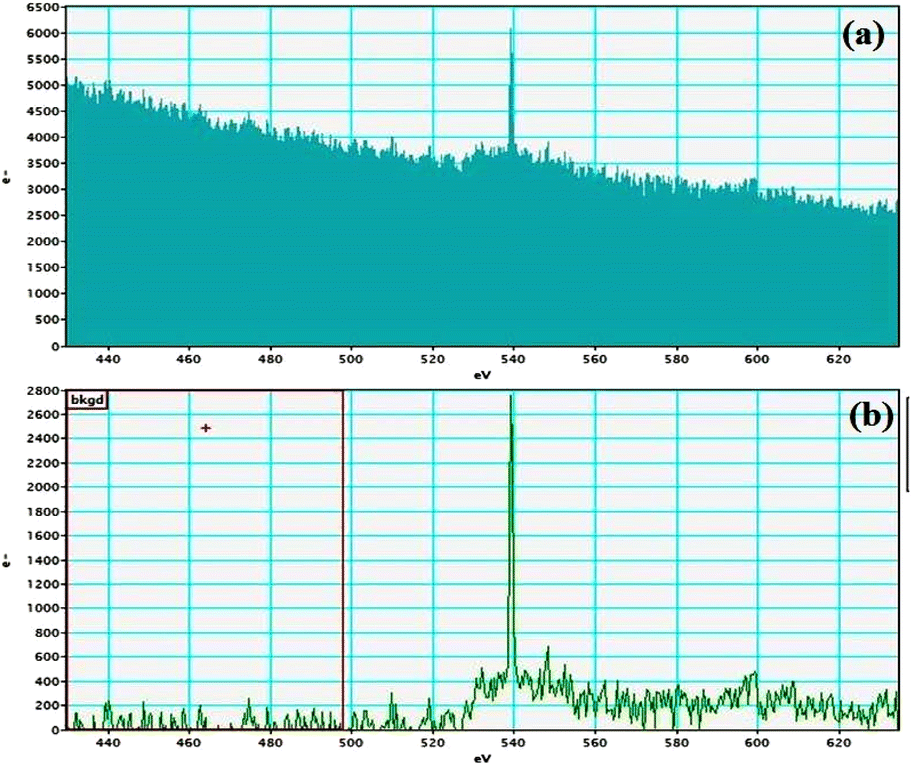
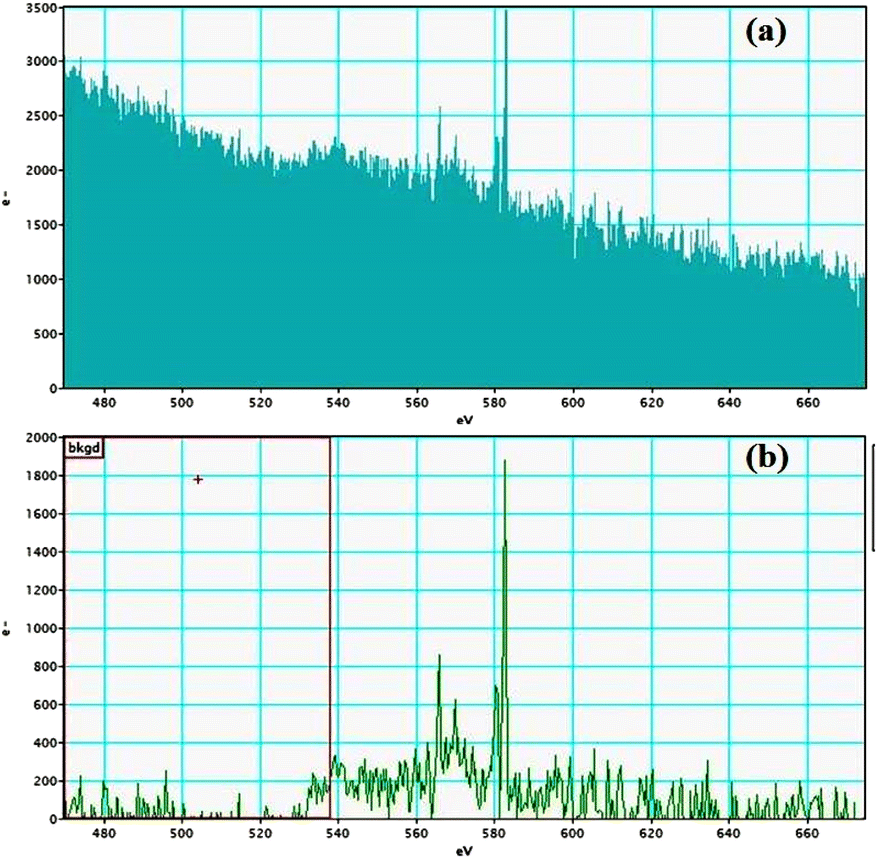
Electron energy loss spectroscopic studies have been carried out (Fig. 8–13 and ESI: Fig. S9–S11†) to study the elemental composition of graphene oxide (GO) and the nanocatalytic system [i.e., GO–TeN–Pd(0)]. For GO, major peaks at 284 eV and 532 eV, due to the presence of carbon and oxygen in the structure, are prominent. In GO–TeN–Pd(0), additional peaks at 401 eV for nitrogen and 572 eV for tellurium are also observed. Peak at 335 eV corresponding to the palladium is also visible in the EELS analysis of GO–TeN–Pd(0). These results support the formation of the solid support (GO) and the heterogeneous catalytic system [i.e., GO–TeN–Pd(0)].
 |
| | Fig. 8 Low-loss EELS spectra of GO–TeN–Pd(0). | |
 |
| | Fig. 9 Carbon K-edge (a and b) EELS spectra of GO–TeN–Pd(0). | |
 |
| | Fig. 10 Oxygen K-edge (a and b) EELS spectra of GO–TeN–Pd(0). | |
 |
| | Fig. 11 Nitrogen K-edge (a and b) EELS spectra of GO–TeN–Pd(0). | |
 |
| | Fig. 12 Tellurium M-edge (a and b) EELS spectra of GO–TeN–Pd(0). | |
 |
| | Fig. 13 Palladium M-edge (a and b) EELS spectra of GO–TeN–Pd(0). | |
Fourier transform-infrared (FT-IR) spectroscopy
FT-IR spectroscopic investigations have been carried out. The results are helpful in the validation of the functionalization and chemical modification of GO and immobilization of Pd(0) nanoparticles onto the surface of graphene oxide (GO). The FT-IR spectrum of GO (ESI: Fig. S5†) exhibits distinct bands at 3430, 1724, 1619, and 1225 cm−1. These bands correspond to the stretching vibrations of O–H, CO, CC, and C–O (epoxy) bonds, respectively. The values of these bands are in agreement with literature reports,83 and hence corroborate the formation of graphene oxide. FT-IR spectrum of GO–COOH (ESI: Fig. S6†) shows the decrease in the intensity of the band for C–O bond of epoxy groups, and increase in the intensity of the band for CO bond. It confirms the carboxylation and functionalization on the GO surface. When organotellurium ligand gets immobilized and the 4 is formed (Scheme 1), novel peaks emerge at 3400, 1695 and ∼1125 cm−1 in IR spectrum (ESI: Fig. S7†). They may be due to N–H, CO and C–N stretching vibrations in the amide linkage. When GO–TeN–Pd(0) is formed (Scheme 1), clear reduction in the intensity of the band at 3430 cm−1 (for O–H stretching) can be noticed in the IR spectrum (ESI: Fig. S5–S8†).81 The successful development of the GO–Te–Pd(0) nanocatalyst is validated through the emergence of novel bands at 3430, 1724, 1619, and 1225 cm−1 and 3400, 1695 and ∼1125 cm−1 for carboxyl group, and amide group linkage. These bands have significant differences with respect to those observed in the IR spectrum of GO (ESI: Fig. S5 and S8†). Such differences are easily noticeable on matching spectrum of GO with that of GO–TeN–Pd(0).
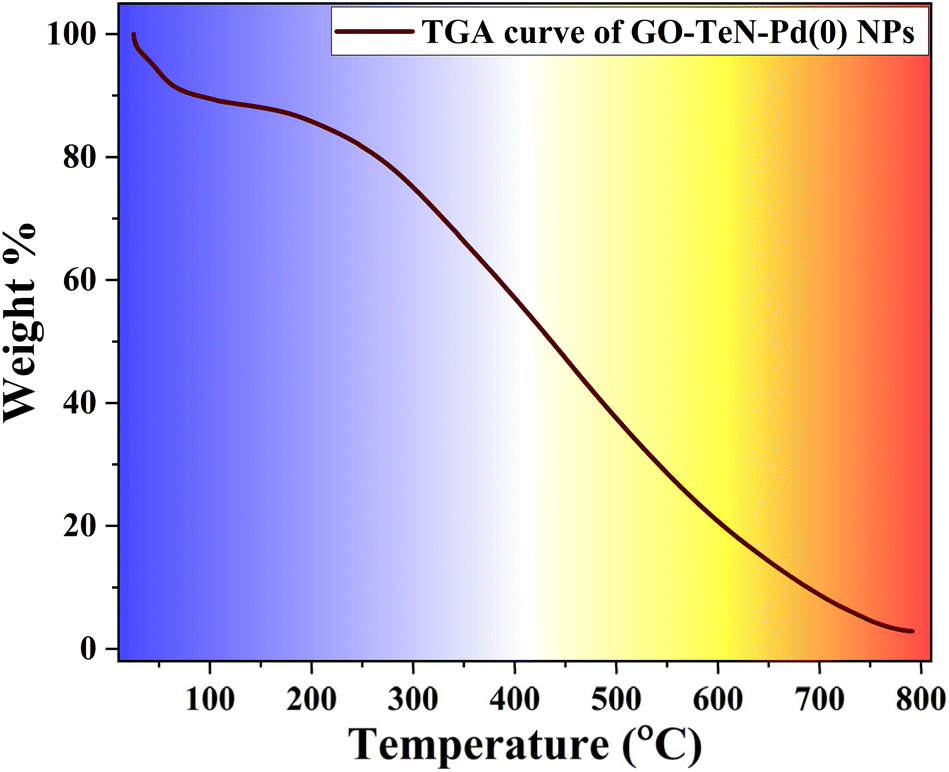
Thermogravimetric analysis (TGA)
The TGA curve (Fig. 14) of GO–TeN–Pd(0) NPs exhibits a minor weight loss (approximately 9%) up to 100 °C. This loss may be attributed to the removal of the absorbed/adsorbed molecules of water/moisture. With the increase in the temperature beyond 250 °C, gradual weight loss occurs until complete degradation at 800 °C. Notably, GO–TeN–Pd(0) experiences a loss of 15% in weight up to 350 °C. The magnitude of this loss is significantly lesser than that observed in bare GO.84 This comparative analysis indicates that GO attains higher stability after immobilization of organotellurium (Te, N ligand), and Pd(0) nanoparticles on its surface. A sharp decline in catalyst weight at around 400 °C indicates carbon skeleton pyrolysis. These findings imply that GO–TeN–Pd(0) is more thermally-stable than GO. This stability is suitable in context of its catalytic applications for C–C and C–O coupling reactions at 100 °C and 110 °C respectively.
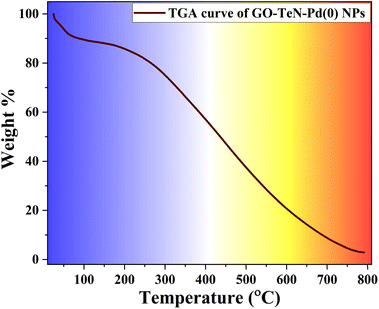 |
| | Fig. 14 TGA curve of GO–TeN–Pd(0) NPs. | |
Brunauer–Emmett–Teller (BET) studies
BET (Brunauer–Emmett–Teller) analysis has been done using N2 gas within a range of 0.05 to 1.0 P/Po at a very low temperature (i.e., 77 K) achieved with the help of liquid N2. The N2 adsorption isotherms (Fig. 15) obtained at 150 °C provide indications about the existence of the structural differences between GO and GO–TeN–Pd(0). The N2 adsorption/desorption isotherms [Fig. 15(a) and (b)] of GO and GO–TeN–Pd(0) exhibit characteristics aligning with type II and IV adsorption isotherms according to the International Union of Pure and Applied Chemistry (IUPAC) classification, along with a H3 hysteresis loop spanning from P/Po = 0.25 to P/Po = 1.0. The presence of this H3 hysteresis loop is attributed to the presence of plate-like particle aggregates, contributing to the formation of slit-shaped pores.85 This phenomenon arises due to the coexistence of macroporous and mesoporous structures within the materials. Such structures have relatively fewer micropores in the functionalized graphene material. Presence of microporous structures, which show type I adsorption isotherm, can be ruled out easily.
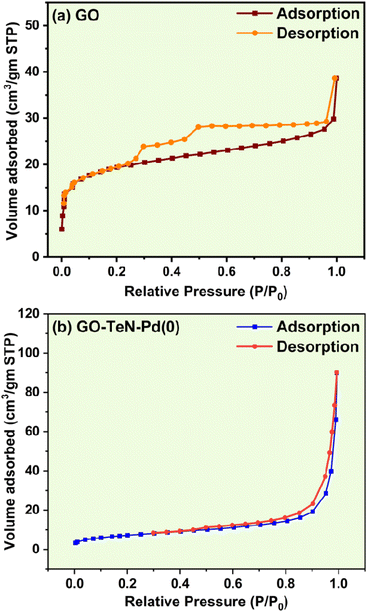 |
| | Fig. 15 N2 adsorption–desorption isotherm of (a) GO and (b) GO–TeN–Pd(0). | |
Specific BET surface area of GO and GO–TeN–Pd(0) have been determined experimentally. The value of such an area of the GO is 72.399 m2 g−1. It matches with the earlier reports.86 Interestingly, this value for GO–TeN–Pd(0) is very low i.e., 27.024 m2 g−1 in comparison to that of GO. It can be attributed solely to the alteration of the textural surface due to ligand immobilization. Experimentally determined value (0.0476 cm3 g−1) of the pore volume of GO is smaller than that (0.1089 cm3 g−1) of GO–TeN–Pd(0). It may be the consequence of wet-chemical treatment and functional group modification on the graphene oxide surface.
Applications of GO–TeN–Pd(0) as heterogeneous catalyst in C–C coupling reaction
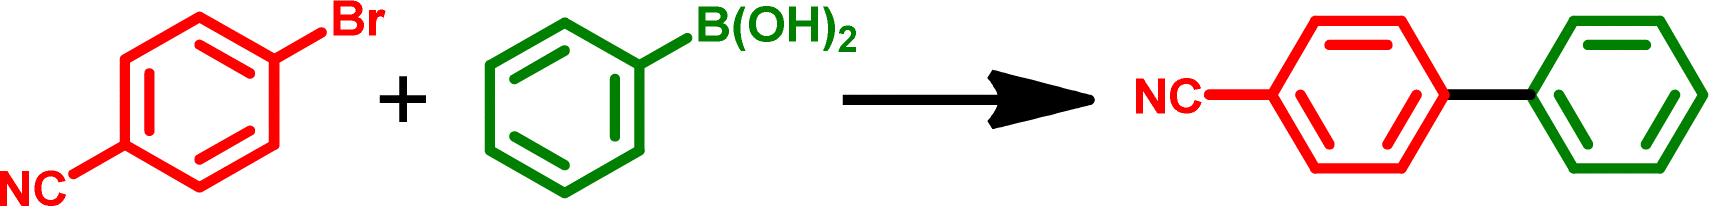
Suzuki–Miyaura cross coupling reaction is the most powerful synthetic methods for the synthesis of carbon–carbon bond formation of high value chemicals such as natural products, agrochemical derivatives, pharmaceutical drugs, polymers, and biologically active compounds.71–74 The catalytic potential of GO–TeN–Pd(0) has been explored for the first time for the catalysis of Suzuki–Miyaura cross coupling reaction.
Reaction conditions, which include solvent, base, reaction temperature, time and catalyst quantity, have been optimized for the reaction of 4-bromobenzonitrile with phenylboronic acid. It has been considered as a model reaction for conducting the study of catalysis.
The results indicated that the best reaction conditions leading to high % conversions were use of potassium carbonate (K2CO3) as a base, aqueous DMF as solvent, 20 mg as the quantity of the catalyst (i.e., 0.108 mol% Pd), 12 hours as the reaction time and 100 °C temperature (Table 1: entry 1). Maximum % conversion i.e., 94% was achieved under these reaction conditions (Table 1: entry 1). However, when GO or GO–TeN (without Pd loading) was used as a catalyst, only trace quantities of the coupled products have been obtained (Table 1: entries 3 and 4). When this model reaction was evaluated using Na2PdCl4 and PdCl2 as a catalyst (without stabilizing ligand and solid support), the % conversion of products was relatively low i.e., 61% and 38% respectively (Table 1: entries 5 and 6). When NaOH was used as the base, only 47% conversion has been observed (Table 1: entry 8). When pure DMF was used as a solvent without mixing it with water, suppression in catalytic performance has been observed (Table 1: entry 7). Use of combination of water (i.e., the solvent) and K2CO3 (i.e., base) did not work well (Table 1: entry 9) as it did not allow the reaction to occur to give any significant conversion. When the reaction was analyzed after 5 hours, low (57%) conversion has been observed (Table 1: entry 2). The reaction did not work well at room temperature. At this temperature, only 42% conversion has been obtained (Table 1: entry 10). Smaller quantity (10 mg) of the catalyst also led to low (i.e., 85%) conversion (Table 1: entry 11).
Table 1 Results of the optimization of the reaction conditions for C–C coupling reaction between phenylboronic acid and 4-bromobenzonitrilea
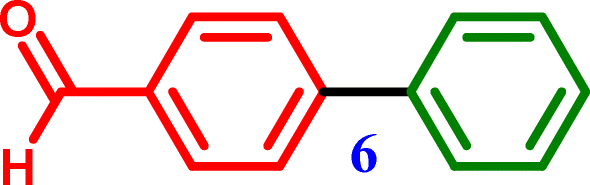
Under the optimized reaction conditions, a variety of structurally divergent bromoarenes and chloroarenes can be converted (Table 2) into their biphenyl products. Such products have been authenticated by matching their proton NMR spectra with those reported for the known compound.87,88 The efficiency of catalytic processes varies with the nature of haloarenes for the coupling reactions. Easy removal of halide group is usually facilitated by the presence of electron-withdrawing group on phenyl ring. This enhances the positive character at para position and hence favours the nucleophilic attack in the coupling reaction. The outcomes for the C–C coupling reactions also demonstrate the same. Excellent % conversions (i.e., >94%) are achieved (Table 2: entries 1, 2, 3 and 6) for the substrates (aryl bromides) having electron withdrawing substituents (–CHO, –COMe, –CN and –NO2) at para-position. Unlike these substrates, when 4-bromotoluene and 4-bromoanisole (bromoarenes with electron donating substituents) are used as substrates, the % conversions are significantly low (Table 2: entries 4 and 8), i.e., 73% and 61% respectively. The catalyst also performs well when aryl chlorides, the least reactive substrates, are used (Table 1: entries 9–13).
Table 2 Results of C–C coupling reaction of different aryl halides with phenylboronic acid under optimized reaction conditionsa

|
| S. no. |
Aryl halide |
Product |
% conversion |
| Reaction conditions: aryl halide (1.0 mmol); phenylboronic acid (1.2 mmol); K2CO3 (2.0 mmol); DMF + water (5.0 mL); catalyst (20 mg, 0.108 mol% Pd); time, 12 h; bath temperature, 100 °C. |
| 1 |
4-Bromobenzaldehyde |
 [1,1′-Biphenyl]-4-carbaldehyde [1,1′-Biphenyl]-4-carbaldehyde |
∼99% |
| 2 |
4-Bromoacetophenone |
 1-([1,1′-Biphenyl]-4-yl)ethanone 1-([1,1′-Biphenyl]-4-yl)ethanone |
∼97% |
| 3 |
4-Bromobenzonitrile |
 [1,1′-Biphenyl]-4-carbonitrile [1,1′-Biphenyl]-4-carbonitrile |
∼94% |
| 4 |
4-Bromotoluene |
 4-Methyl-1,1′-biphenyl 4-Methyl-1,1′-biphenyl |
∼73% |
| 5 |
4-Bromobenzoic acid |
 [1,1′-Biphenyl]-4-carboxylic acid [1,1′-Biphenyl]-4-carboxylic acid |
∼85% |
| 6 |
1-Bromo-4-nitrobenzene |
 4-Nitro-1,1′-biphenyl 4-Nitro-1,1′-biphenyl |
∼99% |
| 7 |
Bromobenzene |
 Biphenyl Biphenyl |
∼83% |
| 8 |
4-Bromoanisole |
 4-Methoxy-1,1′-biphenyl 4-Methoxy-1,1′-biphenyl |
∼61% |
| 9 |
Chlorobenzene |
 Biphenyl Biphenyl |
∼78% |
| 10 |
4-Chloroaniline |
 [1,1′-Biphenyl]-4-amine [1,1′-Biphenyl]-4-amine |
∼76% |
| 11 |
1-Chloro-4-nitrobenzene |
 4-Nitro-1,1′-biphenyl 4-Nitro-1,1′-biphenyl |
∼87% |
| 12 |
4-Chloroacetophenone |
 1-([1,1′-Biphenyl]-4-yl)ethanone 1-([1,1′-Biphenyl]-4-yl)ethanone |
∼83% |
| 13 |
4-Chlorobenzophenone |
 [1,1′-Biphenyl]-4-yl(phenyl)methanone [1,1′-Biphenyl]-4-yl(phenyl)methanone |
∼75% |
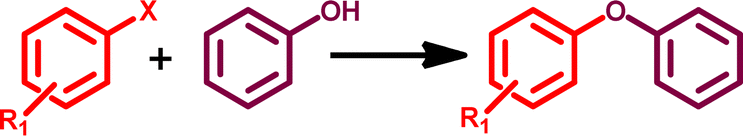
Applications of GO–TeN–Pd(0) as heterogeneous catalyst for C–O coupling
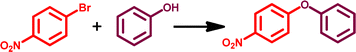
The O-arylation reaction of phenol plays a crucial role in synthetic organic chemistry and finds application in the synthesis of numerous industrially significant products.89–91 The GO–TeN–Pd(0) nanocatalyst also has the potential to catalyze C–O coupling reaction between phenol and a diverse range of substituted chloroarenes and bromoarenes. Preliminary investigations were conducted on the reaction between 1-bromo-4-nitrobenzene and phenol to optimize the reaction conditions (Table 3). The results (Table 3: entry 1) indicate that the best reaction conditions include the use of dimethyl sulfoxide (the solvent), presence of K2CO3 (the base), 110 °C temperature, 20 mg quantity of GO–TeN–Pd(0) nanocatalyst and reaction time of 16 hours.
Table 3 Results of optimization of the O-arylation reaction between phenol and 1-bromo-4-nitrobenzenea
|
| S. no |
Catalyst |
Base |
Time |
Temp. |
Solvent |
% conversion |
| Reaction conditions: 1-bromo-4-nitrobenzene (1 mmol); phenol (1.1 mmol), solvent (5.0 mL); catalyst 20 mg (0.108 mol% Pd). |
| 1 |
GO–TeN–Pd(0) |
K2CO3 |
16 h |
110 °C |
DMSO |
∼99% |
| 2 |
GO |
K2CO3 |
16 h |
110 °C |
DMSO |
∼13% |
| 3 |
GO–TeN |
K2CO3 |
16 h |
110 °C |
DMSO |
∼10% |
| 4 |
Na2PdCl4 |
K2CO3 |
16 h |
110 °C |
DMSO |
∼58% |
| 5 |
GO–TeN–Pd(0) |
NaOH |
16 h |
110 °C |
DMSO |
∼77% |
| 6 |
GO–TeN–Pd(0) |
K2CO3 |
16 h |
110 °C |
EtOH |
∼48% |
| 7 |
GO–TeN–Pd(0) |
K2CO3 |
16 h |
110 °C |
H2O |
Trace |
| 8 |
GO–TeN–Pd(0) |
K2CO3 |
16 h |
Room temp. |
DMSO |
∼51% |
| 9 |
GO–TeN–Pd(0) |
K2CO3 |
6 h |
110 °C |
DMSO |
∼57% |
The results of catalysis of C–O coupling reactions (Table 4) of different aryl halides (substrates) are highly interesting. The conversions achieved are remarkably high. Under the optimized reaction conditions, a variety of structurally divergent bromoarenes and chloroarenes can be converted (Table 4) into their diphenyl ether products. Such products have been authenticated by matching their proton NMR spectra with those reported for the known compounds.87 The efficiency of the catalytic processes varies depending on the nature of the bromoarenes and chloroarenes.
Table 4 O-Arylation reaction of different aryl halides with phenol under optimized reaction conditionsa
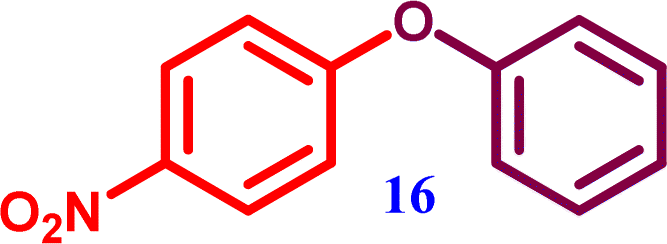
The nanocatalytic system [i.e., GO–TeN–Pd(0)] shows the ability to arylate the phenol even with some chloroarenes (e.g., 1-chloro-4-nitrobenzene, 4-chlorobenzonitrile, chlorobenzene, and chlorotoluene) with significant conversions ranging from 49 to 97% (Table 4: entries 2, 4, 6 and 8). It is worth noting that only a few heterogeneous nanocatalytic systems have been reported to exhibit such ability.41,42,45,87,92–95 The coupling reactions involving 1-bromo-4-nitrobenzene with phenol exhibited the highest conversion of approximately 99% (Table 4: entry 1). Good conversion rates (57–99%) of the desired products were achieved in the coupling reactions of 1-bromo-4-nitrobenzene, 4-bromobenzonitrile, bromobenzene, and bromotoluene with phenol (Table 4: entries 1, 3, 5 and 7). The presence of electron-withdrawing substituents on the aromatic ring of the aryl halides led to higher reactivity (Table 4: entries 1–4). However, the presence of an electron-donating group (i.e., CH3) on the aryl halide (Table 4: entries 7 and 8) has a deactivating effect, resulting in lower product yields in the reaction.
To conclude the nature of catalysis, hot filtration tests were carried out for both Suzuki coupling and C–O coupling reactions. 4-Bromobenzonitrile was used as the substrate for Suzuki coupling and 1-chloro-4-nitrobenzene was used to arylate phenol in C–O coupling reaction. After 4 hours of reaction, the catalyst was extracted from the reaction mixtures via centrifugation. At this stage, the conversion of the reaction mixture, as assessed through 1H-NMR spectroscopy, was 72% for Suzuki coupling and 84% for C–O coupling. Subsequently, the reaction mixtures were divided into two equal portions. In one portion, the catalyst [GO–TeN–Pd(0)] was reintroduced, and the reaction was allowed to continue for additional 8 hours. The other portion was subjected to heating and stirring without adding any catalyst. Interestingly, the conversion of the reactant into the product remained almost unchanged in the reaction mixtures (for both Suzuki coupling and C–O coupling) of the portion which did not contain the catalyst. On the other hand, % conversions in other sets of experiments (in which the catalyst was reintroduced in the reaction mixture) increased from 72% to 94% (for Suzuki coupling) and from 84% to 97% (for C–O coupling reaction). These observations and results provide compelling and unequivocal evidence for the heterogeneous nature of the catalysis and rule out any ambiguity regarding the leaching of Pd(0) NPs or other Pd(0) species from the heterogeneous catalyst, i.e., GO–TeN–Pd(0), into the reaction mixture.
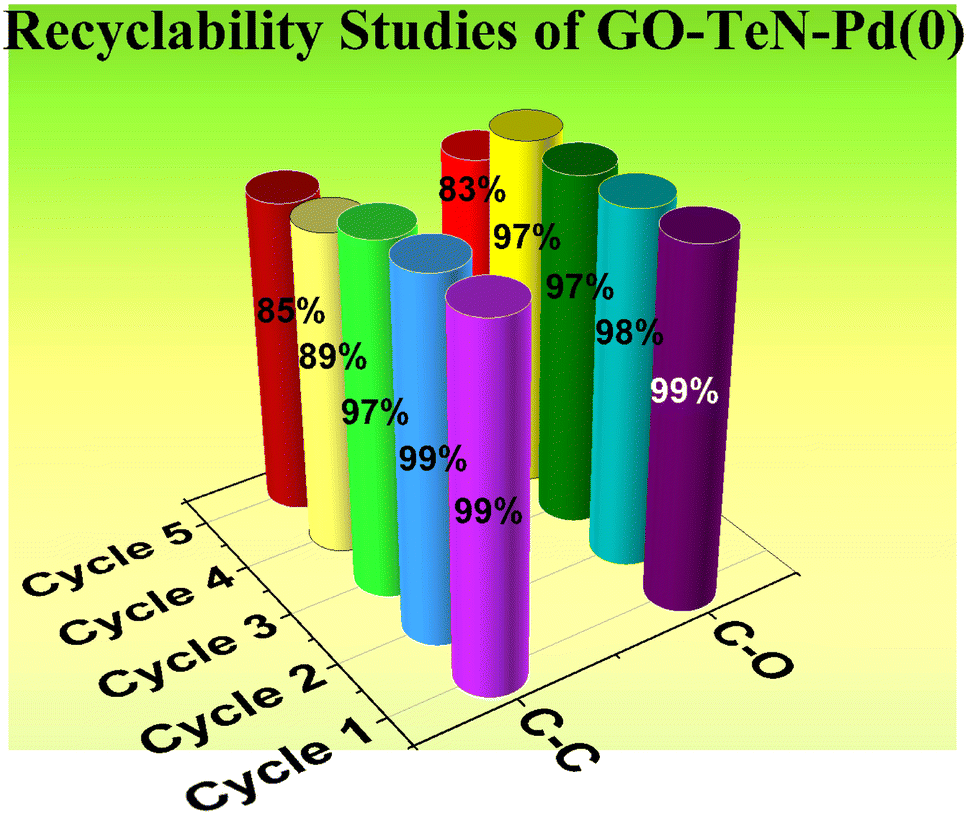
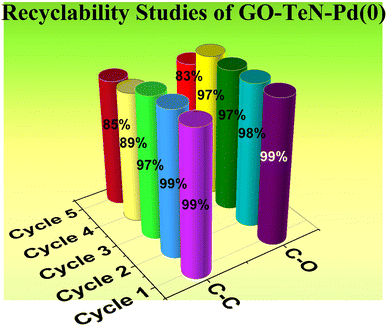
Recyclability of GO–TeN–Pd(0) heterogeneous catalyst
From both environmental and economic perspectives, the ability to recover and reuse a catalyst offers distinct advantages. This particular aspect of the present catalyst was meticulously examined in the context of the Suzuki coupling as well as C–O coupling reactions. In Suzuki coupling, the recyclability was studied for the reaction between phenylboronic acid and 1-bromo-4-nitrobenzene under optimized conditions. In the case of C–O coupling reaction, the experiments were conducted for the reaction between 1-chloro-4-nitrobenzene and phenol to understand the reuse of the catalyst. The results (Fig. 16) unequivocally demonstrate that the catalyst GO–TeN–Pd(0) shows almost similar catalytic activity up to four reaction cycles. Thereafter, a slight decrease in fifth cycle has been observed.
 |
| | Fig. 16 Recyclability of the GO–TeN–Pd(0) in the C–C and C–O coupling reaction under optimized conditions. | |
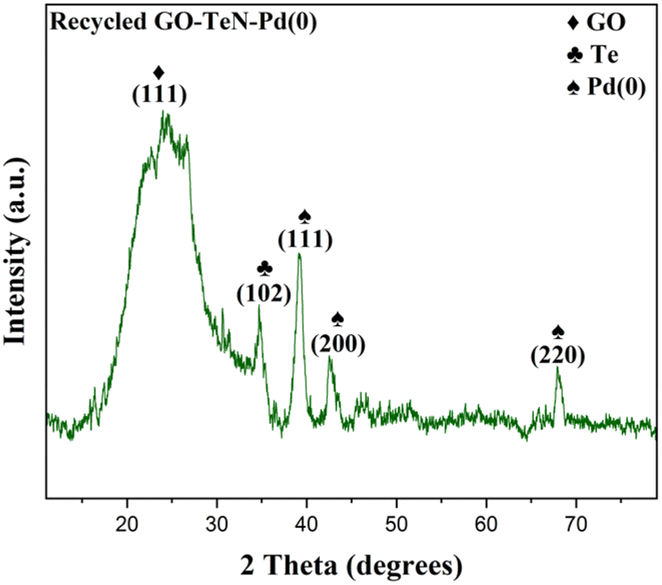
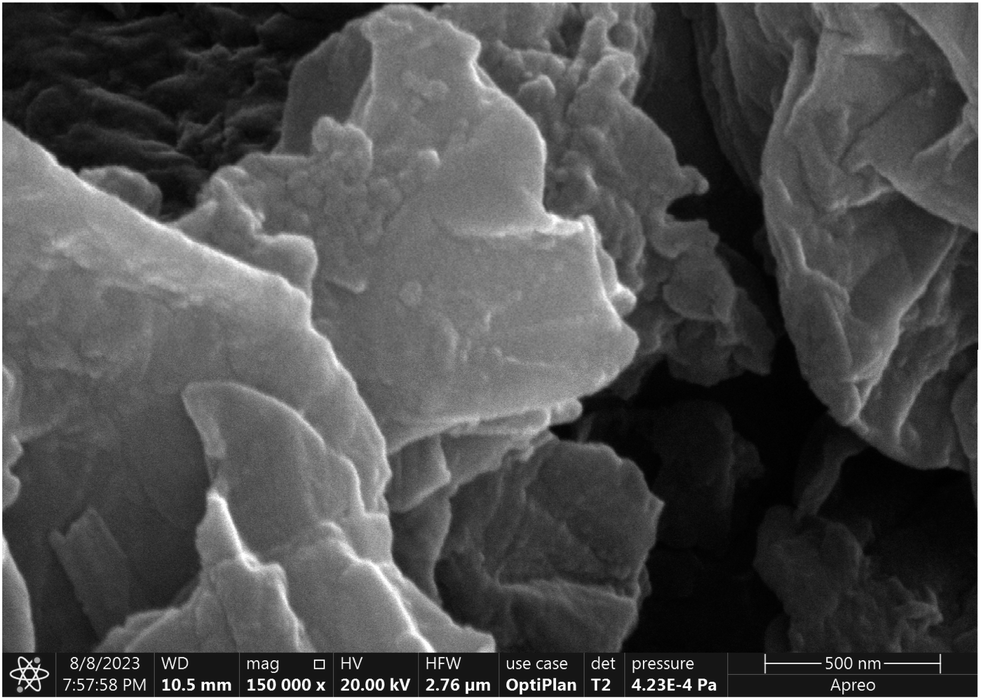
After successfully completing five reaction cycles in the C–O coupling reaction, comprehensive examination and characterization of the catalyst have been done using P-XRD (Fig. 17), FE-SEM (Fig. 18), and EDX (ESI: Fig. S12–S14, Table S3†) techniques. The results of these analyses convincingly demonstrate the presence of active catalytic sites in the catalytic system even after the completion of five reaction cycles. It gives strong indication about the remarkable robustness and stability of the catalyst.
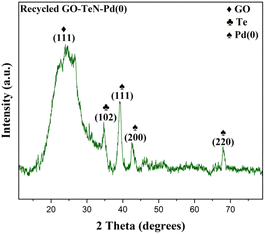 |
| | Fig. 17 P-XRD of recycled GO–TeN–Pd(0) nanocatalyst. | |
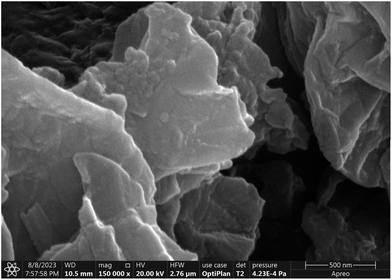 |
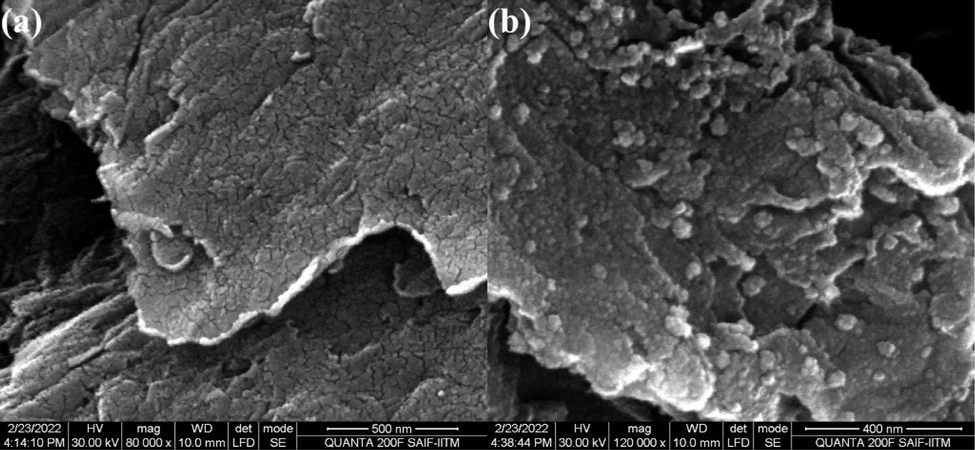
| | Fig. 18 FE-SEM image (at 500 nm) of recycled GO–TeN–Pd(0) nanocatalyst. | |
The 20 mg quantity of the catalytic system, GO–TeN–Pd(0), is applied to catalyze the reactions. Analysis, done using ICP-OES technique, indicates that it is equivalent to catalyst loading of 0.108 mol%. In the reaction of bromobenzene (PhBr) with phenylboronic acid in the solvent mixture of DMF and H2O at 100 °C in the presence of K2CO3 (base) for 12 hours, 83% conversion has been achieved. This system is quite efficient in comparison to some other heterogeneous catalysts reported for the Suzuki–Miyaura cross-coupling reaction.87,96–110 For instance, Pd–Fe3O4 heterodimer nanocrystals (Table 5: entry 1) work to catalyse the reaction [between bromobenzene and phenylboronic acid] in DME/H2O in presence of Na2CO3 and give the product in 70% yield after 24 hours of reaction under reflux conditions when the concentration of such crystals in the reaction mixture is 1.0 mol%.96 Similarly, for the catalysis of the reaction [between 4-bromoaniline and phenylboronic acid] in ethanol in the presence of sodium carbonate (Na2CO3) at 70 °C, 1.0 mol% quantity of the HMMS–NH2–Pd (Table 5: entry 2) is required to give the product in 74% yield after 16 hours.97 Fe3O4@CS–SB@Pd is a very interesting catalyst from the point of view of reaction time, catalyst loading and temperature.103 It allows the formation of the product in the reaction [between bromobenzene and phenylboronic acid] in very high (99%) yield in extremely short (30 minutes) reaction time (Table 5: entry 8). It works at 0.2 mol% concentration at 50 °C in PEG-200 i.e., the solvent in the presence of potassium carbonate (K2CO3).103 In terms of catalyst loading, the present heterogeneous catalyst i.e., GO–TeN–Pd(0) system shows remarkable performance. For the reaction [between bromobenzene and phenylboronic acid], it performs the catalysis at low catalyst loading and gives the product in high yield. Pd@graphene oxide is a known heterogeneous catalyst102 which works at 6.4 mol% concentration (Table 5: entry 7) to lead the formation of the product in 80% yield. The Pd-adenine@boehmite is an attractive catalyst because it allows the catalysis to occur in water.104 It is also better than the present catalyst in terms of other parameters such as reaction time and temperature (Table 5: entry 9). It can give the product in appreciable yield i.e., 90% [for the reaction between bromobenzene and phenylboronic acid] at 80 °C within 1.4 hours As far as the concentration of the catalyst is concerned, its performance is not at par with the present catalyst (Table 5: entry 9).104 It works when it is used in 0.65 mol% concentration in the presence of Na2CO3. Overall, the GO–TeN–Pd(0) catalytic system shows good performance. Its ability to perform at low catalyst loading is worth highlighting. Moreover, it also has the ability to convert aryl chlorides into the coupled products.
Table 5 Comparison with known heterogeneous catalyst for Suzuki–Miyaura cross coupling reaction between bromoarene/derivatives and phenylboronic acid
| Entry |
Catalytic system |
Catalyst loading |
Reaction conditions |
Yield (%) |
Reference |
| 4-Bromoaniline. % conversion. |
| 1 |
Pd–Fe3O4 heterodimer nanocrystals |
1.0 mol% |
Na2CO3, DME/water, reflux 24 h |
70 |
96 |
| 2 |
HMMS–NH2–Pd |
1.0 mol% |
K2CO3, ethanol, 70 °C, 16 h |
74a |
97 |
| 3 |
Pd(II)–NHC complex |
1.0 mol% |
K2CO3, DMA, 100 °C, 24 h |
67 |
98 |
| 4 |
NHC–Pd(II) complex |
1.0 mol% |
Cs2CO3, toluene, 80 °C, 12 h |
54 |
99 |
| 5 |
Pd NPs@CMC/AG |
1.0 mol% |
K2CO3, H2O, 60 °C, 0.5 h |
80a |
100 |
| 6 |
Pd NPs@APC |
1.8 mol% |
K2CO3, MW, 5 min |
88a |
101 |
| 7 |
Pd@graphene oxide framework |
6.4 mol% |
K2CO3, DMF, 80 °C, 8 h |
80 |
102 |
| 8 |
Fe3O4@CS–SB@Pd |
0.2 mol% |
K2CO3, PEG-200, 50 °C, 30 min |
99 |
103 |
| 9 |
Pd-adenine@boehmite |
0.65 mol% |
Na2CO3, H2O, 80 °C, 1.4 h |
90 |
104 |
| 10 |
OCMCS–SB–Pd(II) |
0.4 mol% |
K2CO3, EtOH/H2O, 50 °C, 2 h |
96 |
105 |
| 11 |
NHC–Pd(II) complex |
1.0 mol% |
K2CO3, DMA, 100 °C, 24 h |
67 |
106 |
| 12 |
OCMCS-3a–Pd |
0.04 mol% |
K2CO3, toluene, 100 °C, 48 h |
70a |
107 |
| 13 |
Pd–graphene hybrids (∼4 nm Pd NPs) |
1.1 mol% |
K3PO4, H2O, SDS, 100 °C, 5 min |
29 |
108 |
| 14 |
GO–Pd4S |
0.5 mol% |
K2CO3, ethanol/water, 80 °C, 6 h |
78 |
109 |
| 15 |
GO–Pd4S nanospheres |
0.2 mol% |
K2CO3, ethanol/water, TBAB, 80 °C, 5 h |
19 |
110 |
| 16 |
GO–TeN–Pd(0) |
0.108 mol% |
DMF/H2O, K2CO3, 100 °C, 12 h |
83b |
Present system |
Ability to function at low concentration (i.e., loading) is an attractive feature of the present catalyst i.e., GO–TeN–Pd(0) for O-arylation of phenol (i.e., C–O coupling reaction) too. Its ability to perform the catalysis of the arylation reaction of phenol even with chloroarene makes it an attractive system. Such ability is found only with a few heterogeneous nanocatalytic systems (Table 6: entries 1–8). When it is used in 0.108 mol% concentration, 76% conversion has been achieved for the reaction [between chlorobenzene and phenol] in DMSO in the presence of potassium carbonate (i.e., K2CO3) at 110 °C in 16 hours. Its comparison with other known catalysts is quite interesting.41,42,45,87,92–96 For instance, Fe3O4@SiO2@SePh@Pd(0) works at 1.0 mol% concentration and gives the product in 70% yield (Table 6: entry 1) in aqueous medium in the presence of NaOH at 80 °C.87 Fe3O4@SiO2–BT–Cu is attractive because it has an inexpensive metal i.e., copper. However, it works at nearly 18 times higher concentration (i.e., equal to 2.0 mol%) in comparison to the present catalyst to produce the desired compound in 71% yield (Table 6: entry 2) for the reaction [between chlorobenzene and phenol] in eutectic solvent (i.e., PhCl/urea) in presence of K2CO3 at 100 °C in 24 hours.92 The GO–Pd17Se15 system is one of those rare and interesting catalytic system which have the ability to perform the reaction at room temperature.41 It works at 1.0 mol% loading, and gives the product in slightly higher (i.e., 73%) yield in a short reaction of 3 hours in DMSO/K2CO3 (Table 6: entry 3).41 Cu NPs-reduced graphene oxide is another catalyst which has low-cost metal i.e., copper. Its low quantity (50 mg) is sufficient to catalyse the reaction [between 1-chloro-4-nitrobenzene and phenol] and give the product in 66% yield (Table 6: entry 5) at 120 °C in DMSO in 12 hours in the presence of Cs2CO3 i.e., the base which is more expensive than K2CO3.45 There are some other catalytic systems (Table 6: entries 6–9) which are known for this reaction. They work at higher catalyst loading in comparison to the present system.93–95,111
Table 6 Comparison table with heterogeneous catalysts reported in literature for C–O coupling reaction between phenol and chloroarenes
| Entry |
Catalytic system |
Catalyst loading |
Reaction conditions |
Yield (%) |
Reference |
| 1-Chloro-4-nitrobenezene. Bromobenzene. % conversion. |
| 1 |
Fe3O4@SiO2@SePh@Pd(0) |
1.0 mol% |
H2O, NaOH, 80 °C, 6 h |
70 |
87 |
| 2 |
Fe3O4@SiO2–BT–Cu |
2.0 mol% |
PhCl/urea, K2CO3, 100 °C, 24 h |
71 |
92 |
| 3 |
GO–Pd17Se15 |
1.0 mol% |
DMSO, K2CO3, r.t., 3 h |
73 |
41 |
| 4 |
GO–Cu1.8S |
1.25 mol% |
DMSO, K2CO3, 120 °C, 8 h |
58 |
42 |
| 5 |
Cu NPs–reduced graphene oxide |
50 mg |
DMSO, Cs2CO3, 120 °C, 12 h |
66a |
45 |
| 6 |
CuI–zeolite (USY) |
10.0 mol% |
DMF, Cs2CO3, 120–140 °C, 24 h |
65 |
93 |
| 7 |
CuO–UiO-66–NH2–MLm |
50 mg |
DMSO, KOH, 150 °C, 24 h |
30 |
94 |
| 8 |
Fe3O4@SiO2@PPh2@Pd(0) |
1.5 mol% |
H2O, NaOH, 80 °C, 3.5 h |
83 |
95 |
| 9 |
Pd16S7 NPs |
0.5 mol% |
DMSO, K2CO3, 100 °C, 3 h |
64b |
111 |
| 10 |
GO–TeN–Pd(0) |
0.108 mol% |
DMSO, K2CO3, 110 °C, 16 h |
76c |
Present system |
Experimental section
Materials and chemicals
Graphite fine powder, bromobenzene and its derivatives was supplied by M/S Alfa Aesar. Phenylboronic acid, ethyl alcohol, N,N-dimethylformamide (DMF), chloroacetic acid, potassium carbonate, sodium borohydride, 2-chloroethylamine hydrochloride, diphenylditelluride, sodium tetrachloropalladate, potassium permanganate, sodium nitrate, hydrogen peroxide, and thionyl chloride were procure from Merck Life Science Private Limited (India). Other chemicals and solvents were purchased from local suppliers and utilized in the same form as received without any purification or drying. To assess the conversions attained in the Suzuki–Miyaura and C–O cross coupling processes, 1H-NMR spectroscopic technique was used.
Instrumentation and analysis
The 1H-NMR spectra were acquired using a JNM ECX-500 NMR spectrophotometer operating at 500 MHz. The JEM 3200FS electron microscope, which runs at 300 kV, was used to perform TEM investigations at the Department of Metallurgical and Materials Engineering in Indian Institute of Technology, Roorkee. In order to prepare the sample for analysis using transmission electron microscopy (TEM), the powder was dispersed properly and uniformly in methanol utilizing a probe sonicator. The slurry was deposited onto a copper grid with a porous carbon film and allowed to dry in the air. In addition, electron energy loss spectroscopy (EELS) was performed using a JEM 3200FS electron microscope. The analysis of surface morphology and elemental composition was performed using FEI-Quanta FEG 200F model of scanning electron microscope with energy-dispersive X-ray spectroscopic (SEM-EDX) equipment. Powder X-ray diffraction (P-XRD) experiments were conducted using a SmartLab 9 kW rotating anode X-ray diffractometer. X-ray photoelectron spectroscopic (XPS) studies were conducted using the Nexsa base (Thermo Fisher) spectrometer. The Raman spectra were acquired using a Horiba LAB RAM HR evolution confocal microdispersive Raman spectrometer, with a 532 nm solid-state laser operating in the standard mode. BET studies were performed using the BELSORP Mini X instrument. TGA analysis was carried out using Shimadzu DTG-60 instrument to understand the thermal stability of the catalyst. FT-IR spectra were recorded on Shimadzu IRSpirit to study the change in the functional groups during the process of the formation of the catalytic system. Palladium content of the GO–TeN–Pd(0) catalyst was determined by ICP-OES analysis using Thermo Fisher Scientific iCAP PRO instrument. When it was required, an inert atmosphere using nitrogen gas was created and maintained using Schlenk techniques. Most of the reactions were conducted under ambient conditions, utilizing oven-dried glassware.
Synthesis of graphene oxide (GO)
Hummers' method was utilized to convert graphite powder into graphene oxide.75 In this method, 1.0 g of graphite powder was mixed with 0.75 g of sodium nitrate (NaNO3) in 34 mL of concentrated H2SO4, and allowed to stir for one hour at 5 °C. Thereafter, 4.5 grams of potassium permanganate (KMnO4) were introduced slowly into the reaction mixture. During this, the temperature was maintained at around 5 °C. This reaction mixture was agitated for five days at 25 °C. Thereafter, it was heated at 90 °C for 2 hours and mixed gently with 50 mL of diluted H2SO4 (5 wt%) along with continuous stirring. Thereafter, 2.7 mL of hydrogen peroxide (30 wt%) was added to the mixture and stirring was allowed to continue for another 3 hours. The bright yellow precipitate of graphene oxide (GO) appeared. It was filtered, and subjected to washing. It was initially rinsed with 30 mL of H2SO4, followed by 10 mL of H2O2, and ultimately with 300 mL of HCl (3 wt%). This procedure was repeated until the pH of the filtrate reached a neutral state. In the final step, it was subjected to vacuum drying before its subsequent utilization.
Functionalization of graphene oxide i.e. carboxylation of graphene oxide (GO–COOH)
The wet chemical treatment process was employed to functionalize graphene oxide (GO) sheets (i.e., 1) with hydroxyl, epoxide, and carboxyl groups. The process begins with mixing graphene oxide (i.e., 1) (200 mg) in distilled water (100 mL) followed by ultrasonication for an hour to obtain exfoliated graphene oxide nanosheets. Subsequently, a slurry of graphene oxide is prepared by adding chloroacetic acid (1.0 g) and NaOH (1.2 g). It is subjected to sonication for 2 hours, for obtaining the 2. The pH of the resulting suspension of GO–COOH (i.e., 2) is adjusted to neutral using dilute HCl. Thereafter, distilled water is used for washing to remove any traces of HCl. The wet material is dried under vacuum conditions.
Preparation of GO–TeN: immobilization of (Te, N) bidentate ligand (Ph–Te–CH2–CH2–NH2) on graphene oxide sheets
In order to obtain the acyl chloride derivative of the 2 (i.e., GO–COOH), a suspension of its 200 mg quantity was subjected to sonication in 2.0 mL of N,N-dimethylformamide (DMF) for an hour. Thereafter, the suspension was stirred with an excess amount of thionyl chloride at moderate temperature (i.e., 65 °C) for a duration of 12 hours. It resulted in the formation of GO–COCl (i.e., 3). The excess of thionyl chloride was eliminated using a vacuum distillation method. The GO–COCl was subjected to centrifugation, followed by washing with tetrahydrofuran (THF). Subsequently, it was dried under vacuum conditions. Thereafter, 100 mg of GO–COCl was mixed with N,N-dimethylformamide (DMF) and 108 mg of 2-(phenyltellanyl)ethanamine. The mixture was refluxed under inert atmosphere of nitrogen. In the final step, the material (i.e., 4) was separated with the help of centrifugation using ethanol, and ultimately dried under vacuum conditions.
Synthesis of the heterogeneous nanocatalytic system [GO–TeN–Pd(0)]
In the first step, a suspension was made by sonicating the mixture of 50 mg of GO–TeN (i.e., the 4) with distilled water for one hour. In the next step, a solution of 30 mg of Na2PdCl4 in water (10 mL) was poured into the suspension along with constant stirring. The resulting mixture was left as such for 12 hours. The pH of the mixture was raised to approximately 13 by introducing a solution of NaOH (1.0 M) in distilled water. The alkaline mixture was agitated for 6 hours at moderate temperature (i.e., 50 °C). In the final step, the 5 [i.e., GO–TeN–Pd(0)] was washed many times with distilled water to eliminate any residual alkali. Similar washing was also done with ethanol. The material was dried under vacuum conditions.
Procedure for C–C coupling reaction
An oven-dried round bottom flask was employed to combine haloarene (1.0 mmol), phenylboronic acid (1.2 mmol), K2CO3 (2.0 mmol), and 20 mg (0.108 mol% Pd) of the 5 [i.e., GO–TeN–Pd(0)] in a solvent mixture (5.0 mL) prepared by mixing N,N-dimethylformamide (DMF) and water in 4![[thin space (1/6-em)]](https://www.rsc.org/images/entities/char_2009.gif) :1 ratio. The mixture was allowed to reflux for a duration of twelve (12) hours. Thereafter, the mixture was filtered to extract the nanocatalytic species. The filtrate was cooled to room temperature and subjected to extraction with diethyl ether. Diethyl ether component was washed twice with distilled water. It was dried using anhydrous Na2SO4. The dried solution was subjected to evaporation under vacuum to remove the solvent and obtain the residue. The residue was analyzed using 1H-NMR spectroscopy to ascertain the percentage conversion.
:1 ratio. The mixture was allowed to reflux for a duration of twelve (12) hours. Thereafter, the mixture was filtered to extract the nanocatalytic species. The filtrate was cooled to room temperature and subjected to extraction with diethyl ether. Diethyl ether component was washed twice with distilled water. It was dried using anhydrous Na2SO4. The dried solution was subjected to evaporation under vacuum to remove the solvent and obtain the residue. The residue was analyzed using 1H-NMR spectroscopy to ascertain the percentage conversion.
Procedure for C–O coupling reaction
For the C–O coupling reaction, a properly dried round-bottom flask was employed to combine 1.0 mmol of haloarene, 1.2 mmol of phenol, 2.0 mmol of K2CO3, and 20 mg (0.108 mol% Pd) of the 5 [i.e., GO–TeN–Pd(0) catalyst]. The mixture was refluxed in 5.0 mL of dimethyl sulfoxide (DMSO) for 16 hours. Thereafter, the nanocatalyst was filtered out and separated. The filtrate was allowed to cool to room temperature. It was mixed and shaken with ethyl acetate to extract the organic compounds. This solution of ethyl acetate was washed twice with distilled water. It was dried using anhydrous Na2SO4. In order to obtain the residue, the solvent was removed under vacuum. 1H-NMR spectroscopic technique was used to analyze the residue and ascertain the percentage conversion.
Hot filtration test for Suzuki coupling
Hot filtration tests were conducted for both C–O coupling and Suzuki reactions. In the C–C coupling reaction setup, the GO–TeN–Pd(0) nanocatalyst was mixed with 4-bromobenzonitrile (1.0 mmol), phenylboronic acid (1.1 mmol), and K2CO3 (2.0 mmol) in 5.0 mL of the solvent mixture, prepared using DMF and water in 4:1 ratio in a round bottom flask. The reaction mixture was stirred at 100 °C for 4 hours. Thereafter, the catalyst was removed using centrifugation. The percentage of conversion was determined in the mixture at this juncture. The centrifugate was split into two portions. In one part, the catalyst was reintroduced in the same concentration. The second part did not contain the catalyst. Both portions were subjected to heating and stirring further for 8 hours. Thereafter, the reactions were quenched, and the conversions were estimated using 1H-NMR analysis.
Hot filtration test for C–O coupling reaction
The GO–TeN–Pd(0) nanocatalyst was mixed with 1-chloro-4-nitrobenzene (1.0 mmol), phenol (1.1 mmol), and K2CO3 (2.0 mmol) in a properly dried round bottom flask in 5.0 mL of the solvent i.e., DMSO. The reaction mixture was stirred at 110 °C for 2.5 hours. Thereafter, the catalyst was separated through centrifugation, and the conversion percentage was determined. The centrifugate was evenly divided into two portions. In one portion, the catalyst was reintroduced in the same concentration. The second part remained devoid of the catalyst. Both portions were heated along with stirring for 8 hours. The reactions were worked-up. The conversions were evaluated through 1H-NMR analysis.
Procedure for testing the recyclability for Suzuki coupling
1-Bromo-4-nitrobenzene (1.0 mmol), phenylboronic acid (1.2 mmol), K2CO3 (2.0 mmol) were mixed with the GO–TeN–Pd(0) nanocatalyst (50 mg) in a properly dried round bottom flask in 5.0 mL of solvent mixture prepared using DMF and water in 4:1 ratio. This mixture was stirred at 100 °C. Thereafter, the cross-coupled product was extracted using diethyl ether, and the 5 [i.e., the nanocatalyst GO–TeN–Pd(0)] was isolated from the solution via centrifugation. It was subjected to drying for subsequent utilization in a fresh C–C cross-coupling reaction. Such reactions were repeated five times.
Procedure for testing the recyclability for C–O coupling
1-Chloro-4-nitrobenzene (1.0 mmol), phenol (1.1 mmol), K2CO3 (2.0 mmol), and 50 mg of the 5 [i.e., GO–TeN–Pd(0)] were mixed in 5.0 mL of the solvent i.e., DMSO. The mixture was stirred at 110 °C for 16 hours. Thereafter, the cross-coupled product was extracted using ethyl acetate. The 5 [i.e., GO–TeN–Pd(0) nanocatalyst] was separated via centrifugation and subjected to drying. The catalyst was used for a fresh C–O cross-coupling reaction. This process was repeated five times, and the percentage of the conversions were estimated in every cycle using proton NMR spectroscopy.
Conclusion
In conclusion, an organotellurium ligand has been used for the first time to the best of our knowledge for the development of a heterogeneous catalyst. Ph–Te–CH2–CH2–NH2 has been used for the functionalization of the solid support i.e., graphene oxide. The immobilization of the bidentate organotellurium ligand [i.e. (2-phenyltelluro)ethylamine] having Te (i.e., metalloid), and N donor sites was achieved through formation of covalent linkages. Due to the presence of such donor sites, the organotellurium ligand not only holds the nanoparticles of palladium(0) but also stabilizes them in a narrow size range. The use of such ligands as a stabilizer in heterogenized form will open a new field of research for developing applied nanomaterials. The novel and robust heterogeneous catalyst [GO–TeN–Pd(0)], obtained by covalently grafting hybrid (Te, N) ligand over graphene oxide sheets, holds and stabilizes the catalytically active Pd(0) nanoparticles. The role of the Te and N donor sites is likely to stabilize Pd(0) and facilitate the homogeneous distribution of Pd(0) across the graphene oxide sheets. The sites hold the nanoparticles strongly and prevent leaching of catalytically active sites. This system shows remarkable properties and potential as a heterogeneous catalyst for Suzuki–Miyaura cross coupling and O-arylation of phenols for a wide range of electronically divergent aryl halides including aryl chlorides. It catalyzes the reactions at 0.108 mol% loading. It is reusable and recyclable. Recyclability studies, carried out up to five reaction cycles, show that some loss in the performance of the catalyst occurs when it is recycled. The recycled catalyst has also been characterized using P-XRD (Fig. 17), FE-SEM (Fig. 18), and EDX (ESI: Fig. S12–S14, Table S3†) techniques, which corroborate the retention of active catalytic sites in its recycled form.
Data availability
Relevant data are within the paper and its ESI files.† Other data and parameters generated or analyzed during the study are available from the corresponding author upon reasonable request.
Conflicts of interest
There are no conflicts to declare.
Acknowledgements
S. P. acknowledge the Department of Science and Technology (DST) for INSPIRE Fellowship [DST/INSPIRE Fellowship/2021/IF210150]. A. T. acknowledge the Department of Science and Technology (DST) for INSPIRE Fellowship [DST/INSPIRE Fellowship/2021/IF210531]. A. K. acknowledge the support of Department of Science and Technology (DST) for funding under the PURSE scheme [File Number: SR/PURSE/2023/199].
References
- K. M. Engle and J.-Q. Yu, J. Org. Chem., 2013, 78, 8927–8955 CrossRef PubMed.
- S. T. Kim, S. Kim and M. H. Baik, Chem. Sci., 2020, 11, 1017–1025 RSC.
- E. Ocansey, J. Darkwa and B. C. E. Makhubela, RSC Adv., 2018, 18, 13826–13834 RSC.
- H. V. Huynh, Chem. Rev., 2018, 118, 9457–9492 CrossRef PubMed.
- G. K. Rao, A. Kumar, M. P. Singh, A. Kumar, A. M. Biradar and A. K. Singh, J. Organomet. Chem., 2014, 753, 42–47 CrossRef CAS.
- K. N. Sharma, H. Joshi, A. K. Sharma, O. Prakash and A. K. Singh, Organometallics, 2013, 32, 2443–2451 CrossRef CAS.
- A. Kumar, G. K. Rao, S. Kumar and A. K. Singh, Organometallics, 2014, 33, 2921–2943 CrossRef CAS.
- D. B. Eremin and V. P. Ananikov, Coord. Chem. Rev., 2017, 346, 2–19 CrossRef CAS.
- R. Martin and S. L. Buchwald, Acc. Chem. Res., 2008, 41, 1461–1473 CrossRef CAS PubMed.
- M. Garcia-Melchor, A. A. Braga, A. Lledós, G. Ujaque and F. Maseras, Acc. Chem. Res., 2013, 46, 2626–2634 CrossRef CAS PubMed.
- D. J. Durand and N. Fey, Chem. Rev., 2019, 119, 6561–6594 CrossRef CAS.
- C. L. McMullin, N. Fey and J. N. Harvey, Dalton Trans., 2014, 43, 13545–13556 RSC.
- P. Oswal, A. Arora, S. Singh, G. K. Rao, S. Kumar, A. K. Singh and A. Kumar, Catal. Commun., 2021, 149, 106242 CrossRef CAS.
- S. Kumar, G. K. Rao, A. Kumar, M. P. Singh, F. Saleem and A. K. Singh, RSC Adv., 2015, 5, 20081–20089 RSC.
- G. K. Rao, A. Kumar, M. Bhunia, M. P. Singh and A. K. Singh, J. Hazard. Mater., 2014, 269, 18–23 CrossRef CAS PubMed.
- P. Oswal, A. Arora, S. Singh, D. Nautiyal, S. Kumar, G. K. Rao and A. Kumar, Dalton Trans., 2020, 49, 12503 RSC.
- A. Arora, P. Oswal, D. Sharma, A. Tyagi, S. Purohit, P. Sharma and A. Kumar, ChemistrySelect, 2022, 7, e202201704 CrossRef CAS.
- A. Arora, P. Oswal, D. Sharma, S. Purohit, A. Tyagi, P. Sharma and A. Kumar, Dalton Trans., 2022, 51, 17114–17144 RSC.
- S. Purohit, R. Rana, A. Tyagi, A. Bahuguna, P. Oswal and A. Kumar, Org. Biomol. Chem., 2024, 22, 6215–6245 RSC.
- P. Sharma, A. Arora, P. Oswal, G. K. Rao, J. Kaushal, S. Kumar and S. Kumar, Polyhedron, 2019, 171, 120–127 CrossRef CAS.
- A. Arora, P. Oswal, G. K. Rao, J. Kaushal, S. Kumar, A. K. Singh and A. Kumar, ChemistrySelect, 2019, 4, 10765–10769 CrossRef CAS.
- P. Oswal, A. Arora, S. Gairola, A. Datta and A. Kumar, New J. Chem., 2021, 45, 21449–21487 RSC.
- A. Arora, P. Oswal, S. Singh, D. Nautiyal, G. K. Rao, S. Kumar, A. K. Singh and A. Kumar, Inorg. Chim. Acta, 2021, 522, 120267 CrossRef CAS.
- J. Kaushal, S. Singh, D. Nautiyal, G. K Rao, A. K. Singh and A. Kumar, New J. Chem., 2022, 46, 14757–14781 RSC.
- A. Tyagi, S. Purohit, P. Oswal, S. Rawat, V. Negi, A. K. Singh and A. Kumar, New J. Chem., 2023, 47, 12511–12535 RSC.
- A. Arora, P. Oswal, G. K. Rao, S. Kumar, A. K. Singh and A. Kumar, Catal. Lett., 2022, 1–13 Search PubMed.
- A. Arora, P. Oswal, A. Datta and A. Kumar, Coord. Chem. Rev., 2022, 459, 214406 CrossRef.
- P. Oswal, A. Arora, S. Purohit, A. Bahuguna, P. Sharma, J. Roy and A. Kumar, New J. Chem., 2023, 47, 4346–4354 RSC.
- P. Singh, D. Das, A. Kumar and A. K. Singh, Inorg. Chem. Commun., 2012, 15, 163–166 CrossRef.
- A. Bahuguna, P. Oswal, S. Purohit, A. Tyagi and A. Kumar, New J. Chem., 2024, 48, 14140–14144 RSC.
- G. K. Rao, A. Kumar, M. P. Singh and A. K. Singh, J. Organomet. Chem., 2014, 749, 1–6 CrossRef CAS.
- A. S. Burange, and M. B. Gawande, Encyclopedia of Inorganic and Bioinorganic Chemistry, 2011, pp. 1–19 Search PubMed.
- J. C. Védrine, ChemSusChem, 2019, 12, 577–588 CrossRef.
- M. Opanasenko, P. Štěpnička and J. Čejka, RSC Adv., 2014, 4, 65137–65162 RSC.
- G. Fan, F. Li, D. G. Evans and X. Duan, Chem. Soc. Rev., 2014, 43, 7040–7066 RSC.
- N. M. Julkapli and S. Bagheri, Int. J. Hydrogen Energy, 2015, 40, 948–979 CrossRef.
- X. Fan, G. Zhang and F. Zhang, Chem. Soc. Rev., 2015, 44, 3023–3035 RSC.
- S. Navalon, A. Dhakshinamoorthy, M. Alvaro and H. Garcia, Coord. Chem. Rev., 2016, 312, 99–148 CrossRef.
- F. R. Hartley and P. N. Vezey, Adv. Organomet. Chem., 1977, 15, 189–234 CrossRef.
- K. Nejati, S. Ahmadi, M. Nikpassand, P. D. K. Nezhad and E. Vessally, RSC Adv., 2018, 8, 19125–19143 RSC.
- H. Joshi, K. N Sharma, A. K. Sharma and O. P. A. K. Singh, Chem. Commun., 2013, 49, 7483–7485 RSC.
- V. V. Singh and A. K. Singh, ACS Appl. Nano Mater., 2018, 1, 2164–2174 CrossRef CAS.
- R. Zahedi, Z. Asadi and F. D. Firuzabadi, Colloids Surf., A, 2019, 580, 123728 CrossRef.
- M. Hosseini-Sarvari and Z. Razmi, RSC Adv., 2014, 4, 44105–44116 RSC.
- M. Nasrollahzadeh, M. Maham, A. Rostami-Vartooni, M. Bagherzadeh and S. M. Sajadi, RSC Adv., 2015, 5, 64769–64780 RSC.
- P. Puthiaraj and W. S Ahn, Catal. Sci. Technol., 2016, 6, 1701–1709 RSC.
- A. Heuer-Jungemann, N. Feliu, I. Bakaimi, M. Hamaly, A. Alkilany, I. Chakraborty, A. Masood, M. F. Casula, A. Kostopoulou, E. Oh, K. Susumu, M. H. Stewart, I. L. Medintz, E. Stratakis, W. J. Parak and A. G. Kanaras, Chem. Rev., 2019, 119, 4819–4880 CrossRef PubMed.
- L. M. Rossi, J. L. Fiorio, M. A. Garcia and C. P. Ferraz, Dalton Trans., 2018, 47, 5889–5915 RSC.
- M. Nasrollahzadeh, Z. Issaabadi, M. M. Tohidi and M. S. Sajadi, Chem. Rec., 2018, 18, 165–229 CrossRef.
- S. Eigler and A. Hirsch, Angew. Chem., Int. Ed., 2014, 53, 7720–7738 CrossRef CAS.
- V. Georgakilas, M. Otyepka, A. B. Bourlinos, V. Chandra, N. Kim, K. C. Kemp, P. Hobza, R. Zboril and K. S. Kim, Chem. Rev., 2012, 112, 6156–6214 CrossRef CAS.
- P. Oswal, K. Sood, S. Singh, A. Arora, A. Bahuguna, S. Purohit and A. Kumar, Dalton Trans., 2022, 51, 6537–6542 RSC.
- P. Oswal, A. Arora, S. Singh, D. Nautiyal, S. Kumar and A. Kumar, New J. Chem., 2022, 46, 3578–3587 RSC.
- V. S. Sapner, P. P. Chavan and B. R. Sathe, ACS Sustainable Chem. Eng., 2020, 8, 5524–5533 CrossRef CAS.
- S. Naghdi, M. Sajjadi, M. Nasrollahzadeh, K. Y. Rhee, S. M. Sajadi and B. Jaleh, J. Taiwan Inst. Chem. Eng., 2018, 86, 158–173 CrossRef.
- S. S. Narwade, S. M. Mali, V. S. Sapner and B. R. Sathe, ACS Appl. Nano Mater., 2020, 3, 12288–12296 CrossRef.
- M. Nasrollahzadeh, Z. Nezafat, M. G. Gorab and M. Sajjadi, Mol. Catal., 2020, 484, 110758 CrossRef.
- A. V. Munde, B. B. Mulik, R. P. Dighole and B. R. Sathe, New J. Chem., 2020, 44, 15776–15784 RSC.
- V. S. Sapner, B. B. Mulik, R. V. Digraskar, S. S. Narwade and B. R. Sathe, RSC Adv., 2019, 9, 6444–6451 RSC.
- D. S. Avila, P. Gubert, A. Palma, D. Colle, D. Alves, C. W. Nogueira, J. B. T. Rocha and F. A. A. Soares, Brain Res. Bull., 2008, 76, 114–123 CrossRef CAS.
- D. S. Avila, A. Soares, and W. G. Salgueiro, Toxicology and pharmacology of organotellurium compounds, Tellurium: Properties, Uses and Research, Nova Science Publishers, Uruguaiana, Brazil, 2017, pp. 137–169 Search PubMed.
- D. S. Avila, D. Colle, P. Gubert, A. S. Palma, G. Puntel, F. Manarin, S. Noremberg, P. C. Nascimento, M. Aschner, J. B. T. Rocha and F. A. A. Soares, Toxicol. Sci., 2010, 115, 194–201 CrossRef CAS.
- V. Jamier, L. A. Ba and C. Jacob, Chem.–Eur. J., 2010, 16, 10920–10928 CrossRef CAS PubMed.
- A. L. Braga, E. E. Alberto, L. C. Soares, J. B. T. Rocha, J. H. Sudati and D. H. Roos, Org. Biomol. Chem., 2009, 7, 43–45 RSC.
- T. H. Degrandi, I. M. d'Oliveira, G. S. d'Almeida, C. R. L. Garcia, I. V. Villela, T. N. Guecheva, R. M. Rosa and J. A. P. Henriques, Mutagenesis, 2010, 25, 257–269 CrossRef.
- C. W. Nogueira, G. Zeni and J. B. T. Rocha, Chem. Rev., 2004, 104, 6255–6286 CrossRef.
- A. K. Singh and S. Sharma, Coord. Chem. Rev., 2000, 209, 49–98 CrossRef.
- V. K. Jain and R. S. Chauhan, Coord. Chem. Rev., 2016, 306, 270–301 CrossRef CAS.
- P. Tian, F. Xuan, D. Ding, Y. Sun, X. Xu, W. Li, R. Si, J. Xu and Yi-F. Han, J. Catal., 2020, 385, 21–29 CrossRef CAS.
- A. Arora, P. Oswal, G. K. Rao, S. Kumar, A. K. Singh and A. Kumar, RSC Adv., 2021, 11, 7214–7224 RSC.
- S. Arshadi, A. Banaei, A. Monfared, S. Ebrahimiasl and A. Hosseinian, RSC Adv., 2019, 9, 17101–17118 RSC.
- C. Sambiagio, S. P. Marsden, A. J. Blacker and P. C. McGowan, Chem. Soc. Rev., 2014, 43, 3525–3550 RSC.
- E. Voutyritsa, A. Theodorou, M. G. Kokotou and C. G. Kokotos, Green Chem., 2017, 19, 1291–1298 RSC.
- Y. S. Won, Y. H. Ji, L. E. Mi and L. S. Young, Adv. Synth. Catal., 2018, 360, 278–283 CrossRef.
- W. S. Hummers and R. E. Offeman, J. Am. Chem. Soc., 1958, 80, 1339 CrossRef.
- J. Zakrzewski, B. Huras, A. Kielczewska and M. Krawczyk, RSC Adv., 2016, 6, 98829–98834 RSC.
- S. Guo, J. Raya, D. Ji, Y. Nishina, C. Ménard-Moyon and A. Bianco, Nanoscale Adv., 2020, 2, 4085–4092 RSC.
- N. Hussain, A. Borah, G. Darabdhara, P. Gogoi, V. K. Azhagan, M. V. Shelke and M. R. Das, New J. Chem., 2015, 39, 6631–6641 RSC.
- J. Liu, X. Peng, W. Sun, Y. Zhao and C. Xia, Org. Lett., 2008, 10, 3933–3936 CrossRef CAS.
- Y. H. Ng, M. Wang, H. Han and C. C. L. Chai, Chem. Commun., 2009, 37, 5530–5532 RSC.
- G. Pang, M. Sun, P. Liu, H. Liu, I. Hou and F. Gao, RSC Adv., 2016, 6, 73469–73474 RSC.
- A. Ferrari, Solid State Commun., 2007, 143, 47–57 CrossRef CAS.
- R. Bhaskar, H. Joshi, A. K. Sharma and A. K. Singh, ACS Appl. Mater. Interfaces, 2017, 9, 2223–2231 CrossRef PubMed.
- M. E. Assal, M. R. Shaik, M. Kuniyil, M. Khan, A. Al-Warthan, M. R. H. Siddiqui, S. M. A. Khan, W. Tremel, M. N. Tahir and S. F. Adil, RSC Adv., 2017, 7, 55336–55349 RSC.
- Heterogeneous Photocatalysis: Relationships with Heterogeneous Catalysis and Perspectives, ed. G. Marcì, and L. Palmisano, Elsevier, 2019 Search PubMed.
- A. Ariharan, B. Viswanathan and V. Nandhakumar, Graphene, 2017, 6, 41–60 CrossRef.
- A. K. Sharma, H. Joshi and A. K. Singh, RSC Adv., 2020, 10, 6452–6459 RSC.
- P. Oswal, A. Arora, J. Kaushal, G. K. Rao, S. Kumar, A. K. Singh and A. Kumar, RSC Adv., 2019, 9, 22313–22319 RSC.
- J. Zhang, Z. Zhang, Y. Wang, X. Zheng and Z. Wang, Eur. J. Org Chem., 2008, 2008, 5112 CrossRef.
- E. Sperotto, G. P. M. van Klink, J. G. de Vries and G. van Koten, Tetrahedron, 2010, 66, 9009 CrossRef.
- G. Evano, N. Blanchard and M. Toumi, Chem. Rev., 2008, 108, 3054–3131 CrossRef PubMed.
- M. Niakan, S. Karimi, M. Masteri-Farahani and H. Shekaari, Colloids Surf., A, 2021, 620, 126603 CrossRef.
- V. Magné, T. Garnier, M. Danel, P. Pale and S. Chassaing, Org. Lett., 2015, 17, 4494–4497 CrossRef PubMed.
- S. Sadeghi, M. Jafarzadeh, A. R. Abbasi and K. Daasbjerg, New J. Chem., 2017, 41, 12014–12027 RSC.
- M. A. Zolfigol, V. Khakyzadeh, A. R. Moosavi-Zare, A. Rostami, A. Zare, N. Iranpoor, M. H. Beyzavi and R. Luque, Green Chem., 2013, 15, 2132–2140 RSC.
- Y. Jang, J. Chung, S. Kim, S. W. Jun, B. H. Kim, D. W. Lee, B. M. Kim and T. Hyeon, Phys. Chem. Chem. Phys., 2011, 13, 2512–2516 RSC.
- P. Wang, F. Zhang, Y. Long, M. Xe, R. Li and J. Ma, Catal. Sci. Technol., 2013, 3, 1618–1624 RSC.
- Q. Xu, W. L. Duan, Z. Y. Lei, Z. B. Zhu and M. Shi, Tetrahedron, 2005, 61, 11225 CrossRef CAS.
- T. Chen, J. Gao and M. Shi, Tetrahedron, 2006, 62, 6289 CrossRef CAS.
- T. Baran, Ultrason. Sonochem., 2018, 45, 231 CrossRef CAS PubMed.
- T. Baran, Carbohydr. Polym., 2018, 195, 45 CrossRef CAS PubMed.
- T. P. N. Tran, A. Thakur, D. X. Trinh, A. T. N. Dao and T. Taniike, Appl. Catal., A, 2018, 549, 60–67 CrossRef CAS.
- A. S. Kumari, S. Layek and D. D. Pathak, New J. Chem., 2017, 41, 5595–5604 RSC.
- B. Tahmasbi, A. Ghorbani-Choghamarani and P. Moradi, New J. Chem., 2020, 44, 3717–3727 RSC.
- Y. Dong, J. Bi, S. Ming, S. Zhang, D. Zhu, D. Meng and T. Li, Carbohydr. Polym., 2021, 260, 117815 CrossRef CAS PubMed.
- Q. Xu, W. Duan, Z. Lei, Z. Zhu and M. Shi, Tetrahedron, 2005, 61, 11225–11229 CrossRef CAS.
- T. Baran, E. Açıksöz and A. Menteş, J. Mol. Catal. A: Chem., 2015, 407, 47–52 CrossRef.
- Y. Li, X. Fan, J. Qi, J. Ji, S. Wang, G. Zhang and F. Zhang, Nano Res., 2010, 3, 429–437 CrossRef.
- H. Joshi, K. N. Sharma, A. K. Sharma and A. K. Singh, Nanoscale, 2014, 6, 4588–4597 RSC.
- V. V. Singh, U. Kumar, S. N. Tripathi and A. K. Singh, Dalton Trans., 2014, 43, 12555–12563 RSC.
- P. Singh and A. K. Singh, Dalton Trans., 2017, 46, 10037–10049 RSC.
|
| This journal is © The Royal Society of Chemistry 2024 |
Click here to see how this site uses Cookies. View our privacy policy here. 
 Open Access Article
 This Open Access Article is licensed under a Creative Commons Attribution-Non Commercial 3.0 Unported Licence
 ,
Preeti Oswal,
Anurag Bahuguna,
Anupma Tyagi,
Neeraj Bhatt and
Arun Kumar
,
Preeti Oswal,
Anurag Bahuguna,
Anupma Tyagi,
Neeraj Bhatt and
Arun Kumar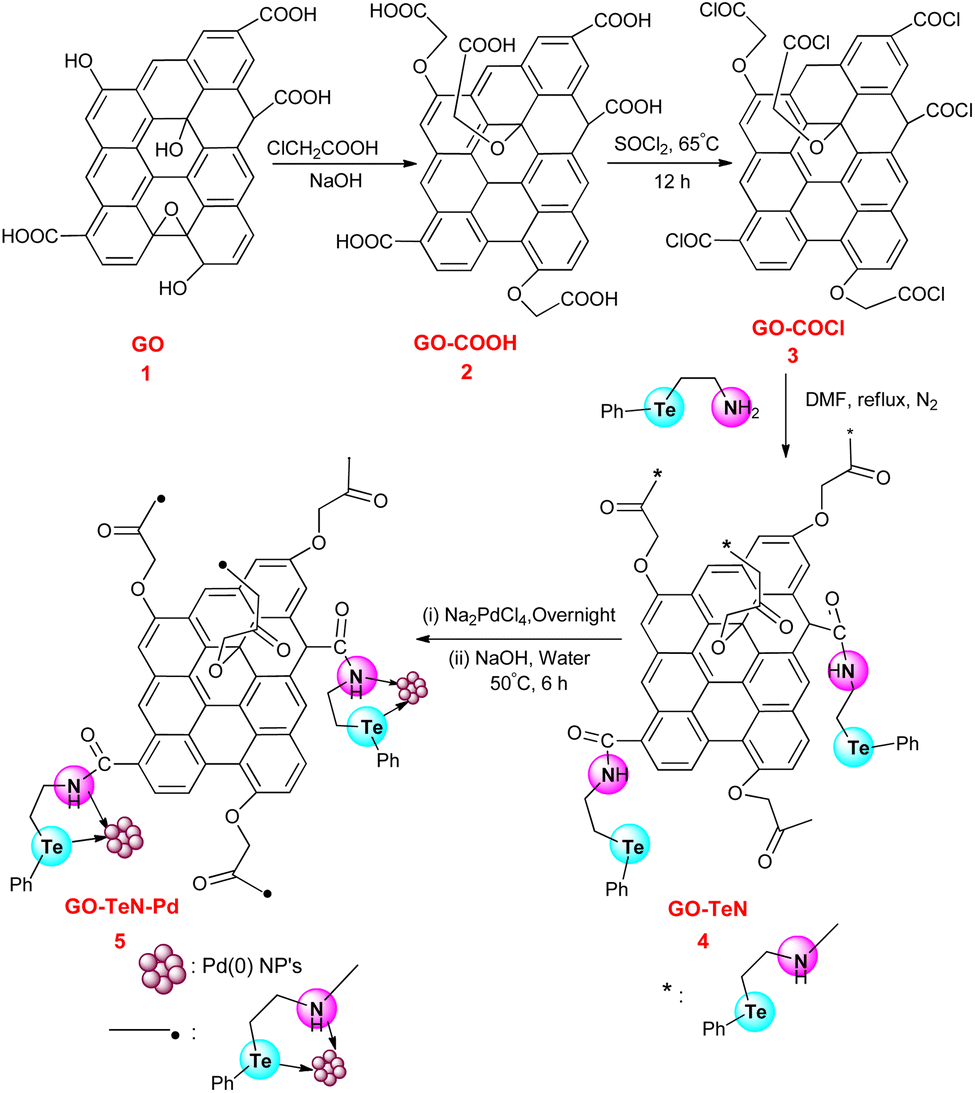


 [1,1′-Biphenyl]-4-carbaldehyde
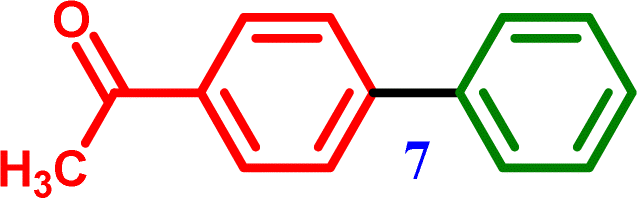 1-([1,1′-Biphenyl]-4-yl)ethanone
 [1,1′-Biphenyl]-4-carbonitrile
 4-Methyl-1,1′-biphenyl
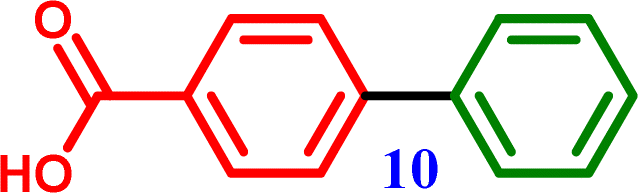 [1,1′-Biphenyl]-4-carboxylic acid
 4-Nitro-1,1′-biphenyl
 Biphenyl
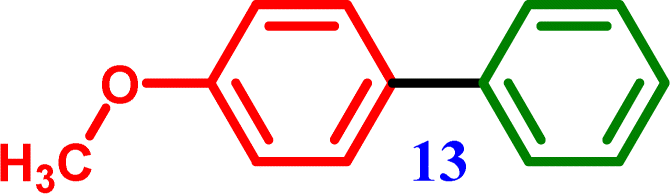 4-Methoxy-1,1′-biphenyl
 Biphenyl
 [1,1′-Biphenyl]-4-amine
 4-Nitro-1,1′-biphenyl
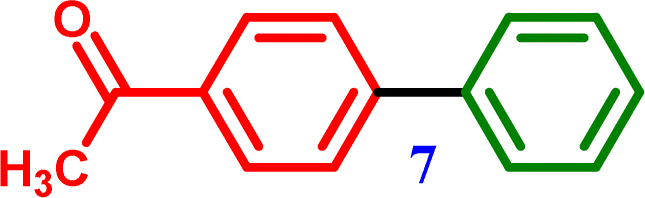 1-([1,1′-Biphenyl]-4-yl)ethanone
 [1,1′-Biphenyl]-4-yl(phenyl)methanone

 1-Nitro-4-phenoxy benzene
 1-Nitro-4-phenoxy benzene
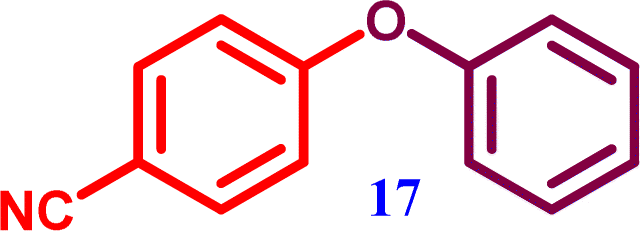 4-Phenoxybenzonitrile
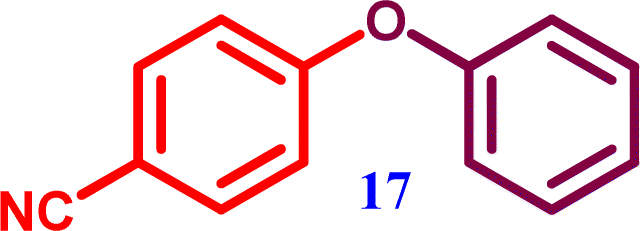 4-Phenoxybenzonitrile
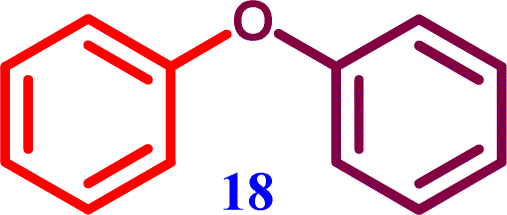 Diphenyl ether
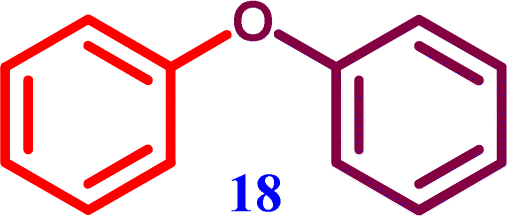 Diphenyl ether
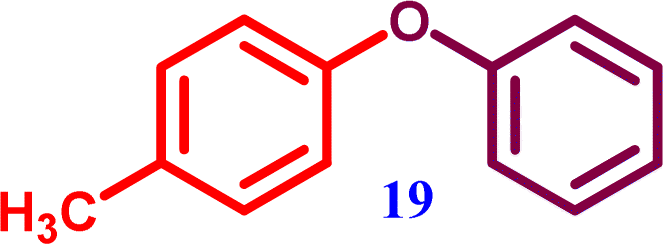 1-Methyl-4-phenoxybenzene
 1-Methyl-4-phenoxybenzene