DOI:
10.1039/D4RA03483J
(Paper)
RSC Adv., 2024,
14, 18406-18416
Quantitative analysis of sweat evaporation loss in epidermal microfluidic patches†
Received
11th May 2024
, Accepted 3rd June 2024
First published on 10th June 2024
Abstract
Sweat analysis is identified as a promising biochemical technique for the non-invasive assessment of human health status. Epidermal microfluidic patches are the predominant sweat sampling and sensing devices. However, the sweat stored inside the patches may suffer from evaporation loss of moisture, which can increase the concentration of biomarkers and cause the biochemical analysis results of sweat to deviate from the actual results. This study focuses on quantitatively analysing the sweat evaporation loss within epidermal microfluidic patches. Analytical models based on the dissolution diffusion mechanism and corresponding partial differential equations for the diffusion process were initially developed. The analytical solution of the equation was derived using the method of separation of variables, and the steady-state concentration distribution of water in the materials of microfluidic patches was calculated when considering the application of epidermal microfluidics. Evaporation losses of sweat through different paths were quantitatively calculated and analysed, including permeation through covers, diffusion along microchannels, and absorption by sidewalls. Then, experiments on the evaporation loss of sweat within microfluidic patches were conducted to validate the theoretical calculations and analytical results. At last, the design of the anti-evaporation structure for microfluidic patches was discussed. This study can provide theoretical and experimental references for the design of water-retention structures in epidermal microfluidic patches, which significantly enhances the overall reliability of sweat biochemical analysis results.
1. Introduction
Sweat secreted onto the skin surface by human eccrine sweat glands consists predominantly of water, accounting for approximately 99% of its composition. In comparison, the remaining 1% encompasses a variety of other biomarkers, including electrolytes, minerals, metabolites, nitrogenous compounds, peptides, proteins, and exogenous substances. The concentrations of these biomarkers in sweat can serve as indicators of an individual's physiological state and health status.1–3 Considering that sweat collection and in situ analysis can be conducted on the skin surface, sweat analysis holds the potential to evolve into a continuous, non-invasive biochemical monitoring approach for the assessment of human health status. Epidermal microfluidic patches are flexible sweat analysis devices that can be conformally attached to the skin and serve as critical platforms for manipulating and analysing trace amounts of sweat.4 However, the sweat stored inside the microfluidic patches is subject to reduction of water content through evaporation, especially in scenarios entailing pre-collection and storage followed by electrochemical analysis,5 or during the slow, prolonged sweat collection.6–8 The prolonged residence of sweat in microfluidic patches offers a considerable time window for evaporation. Given the minimal volume of sweat required for microfluidic sensing, even slight evaporation loss of water in sweat may lead to a substantial increase in the concentrations of biomarkers and subsequently deviate the detection results from the actual concentrations, diminishing the reliability of the sweat analysis results.9–11
Currently, many studies have been reported on the reduction of sweat evaporation.5,12–18 Some studies focused on optimizing the structures of backpressure release channels. The backpressure release channels are utilized to relieve the background pressure in the reservoirs of microfluidic patches, which is essential in the sequential collection of sweat.12 But these channels also provide more pathways for sweat evaporation. Choi designed a clamp to mechanically lock the channels to seal sweat in the reservoirs and reduce evaporation.5 Lin reported a novel structural liquid storage unit in which the backpressure release channel of each reservoir was designed at the inlet of the reservoirs.13 Furthermore, the design incorporated an oil seal to prevent water evaporation along the channels once all the reservoirs were filled with water. Besides, Zhang utilized a synergistic approach that combined hydrophilic valves, hydrophobic valves, and the structural optimization of the microfluidic storage reservoirs to achieve sequential sweat collection while all the reservoirs shared the same pressure release channel, which can significantly reduce the evaporation loss along the channels.14 Reducing evaporation along the main channel is another focus of anti-evaporation designs. For example, Kim reduced sweat evaporation by sealing the collected sweat using super-absorbent polymer valves.15 Koh diminished the terminal dimensions of the microfluidic channels to reduce sweat evaporation.16 Besides, some studies on reducing evaporation through the covers have also been reported. SIS material17 and polyester,18 both exhibiting low water permeability, were employed to fabricate epidermal microfluidic patches to reduce evaporation loss through the capping layer. Heo incorporated collagen into PDMS to diminish the diffusion rate of water within the PDMS material and employed the collagen–PDMS to fabricate microfluidic patches.19 Additionally, glass material could be introduced into the channel of the microfluidic chips to block the pathway of moisture evaporation through the PDMS material, thereby reducing the moisture evaporation rate within the non-flexible microfluidic chip.20
The studies reported above primarily focus on designing anti-evaporation patches from the channel structure or material selection perspective. Regarding the diffusion behaviour of sweat within the patch, Zhang quantitatively calculated the volume of water entering the patch interior from the external environment through diffusion when the epidermal microfluidic patch is exposed to a water environment,18 but systematic calculation and discussion are lacking. Apart from this, no other studies have been reported that quantitatively calculate the evaporation loss of moisture within epidermal microfluidic chips. However, it is crucial to evaluate the amount of loss and guide the design of anti-evaporation structures in prolonged sweat-harvesting epidermal microfluidic devices. This study systematically analyzes the mechanisms of sweat loss within microfluidic patches and quantitatively calculates the sweat loss on each pathway. Then, the evaporation loss under different experimental conditions was measured. At last, the design of the anti-evaporation structure for microfluidic patches was discussed in detail. This study provides a theoretical reference for designing anti-evaporation structures in microfluidic patches, especially aimed at prolonged, slow sweat harvesting and storage, which is significant for reducing the enrichment of biomarkers by evaporation during sweat collection and enhancing the reliability of sweat analysis results.
2. Theoretical calculation
2.1 Mechanism of sweat loss in microfluidic patches
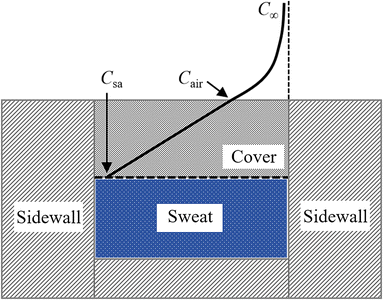
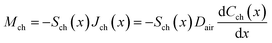
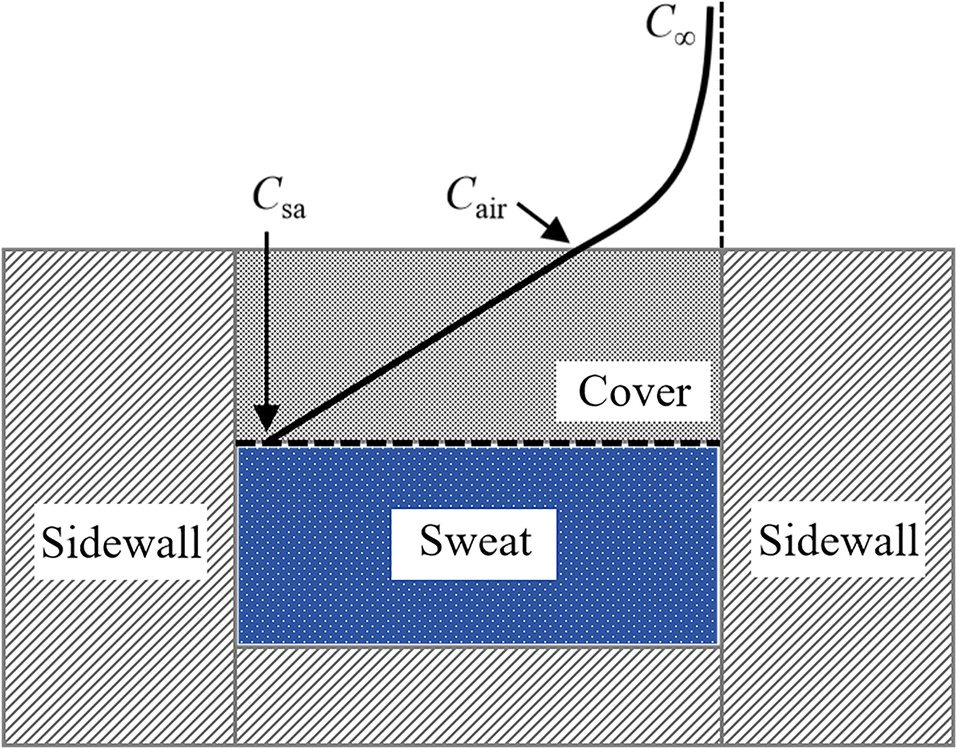
Epidermal microfluidic patches typically comprise channel layers, a top cover layer, a bottom encapsulation layer, and a skin adhesive layer. The channel layers usually consist of functional units such as microchannels, reservoirs, and microfluidic valves. One side of the skin adhesive layer is adhered to the bottom encapsulation layer, while the other side attaches to the skin so that the microfluidic patch is affixed to the skin.21 Due to the constraints of the skin, the bottom encapsulation layer inhibits the escape of moisture from the sweat. As the top cover layer is exposed to the air, the moisture of the sweat in reservoirs is allowed to permeate through the thin cover into the atmosphere. Apart from trans-membrane permeation loss through the cover, evaporation along the channels represents another significant aspect of the loss of moisture in sweat. The evaporation model of the sweat in microfluidic patches can be simplified to a configuration comprising a reservoir filled with sweat and an empty microchannel, as illustrated in Fig. 1a. For actual microfluidic patches, the sweat inside the channels can be converted into that inside the reservoir. Relative to the cover, the thickness of the channel sidewalls is sufficiently substantial. Although it is challenging for moisture to diffuse through the sidewalls into the air, these sidewalls can absorb moisture. Consequently, the moisture loss of the sweat inside the reservoir is composed of three parts: permeation through the cover, diffusion along the channel, and absorption by the sidewalls of the reservoir, denoted respectively as mA, mB, and mC, as illustrated in Fig. 1b.
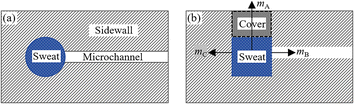 |
| | Fig. 1 (a) The analysis model of sweat evaporation loss in microfluidic patches based on the simplified model of “reservoirs & microchannel” (description from a top-down perspective). (b) Evaporation path of the sweat in the epidermal microfluidic patch (description from a side view perspective). | |
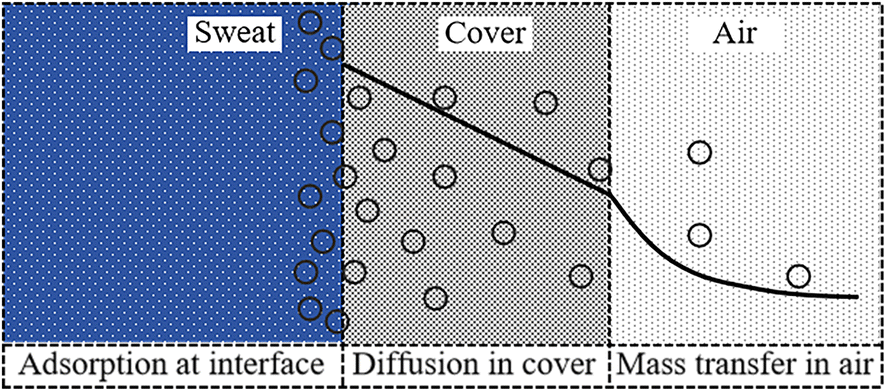
mA and mC correspond to the diffusion of water within the material, while mB pertains to the diffusion of water vapour along the microchannel. Given that the water content in sweat is approximately 99%, the processes of permeative evaporation and sidewall absorption of sweat can be analyzed and solved using the dissolution diffusion model of water, which is the most widely employed for analyzing the permeative evaporation behaviour of the liquids in polymers.22,23 The process of the permeative evaporation through the cover can be divided into the following three steps,22–24 as illustrated in Fig. 2. Step I: adsorption of water molecules at the sweat–cover interface: water molecules are dissolved to the surface of the cover membrane, forming a sufficiently thin layer of polymer that is saturated with water. The mass fraction of water in this layer corresponds to the material's saturation water absorption rate. Step II: diffusion of water molecules within the cover: the dissolved water molecules diffuse from the high-concentration side to the low-concentration side within the cover, a process that adheres to Fick's law of diffusion. Step III: desorption of water molecules at the cover–air interface where water molecules desorb from the cover and escape into the air, a process characterized by a rapid rate of desorption.23,25
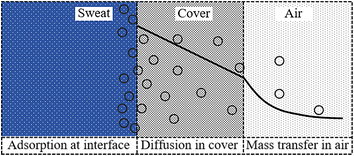 |
| | Fig. 2 Schematic diagram of the dissolution diffusion model. | |
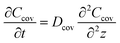
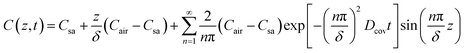
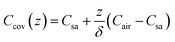
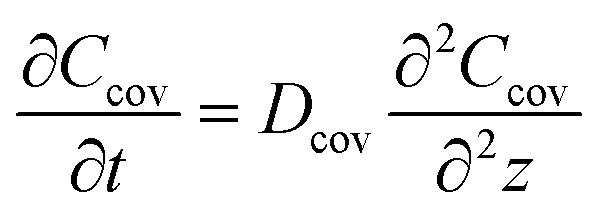
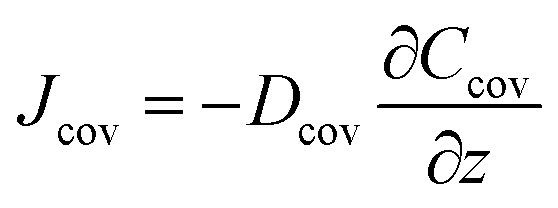
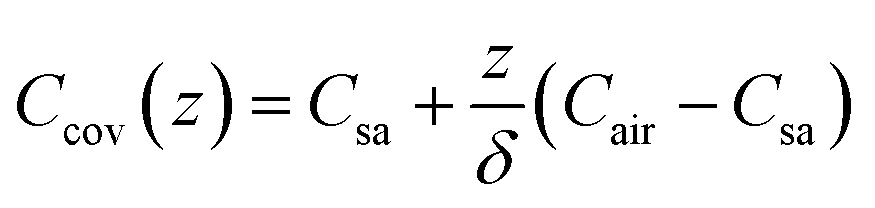
The mass concentration of water at the sweat–cover interface and cover–air interface are denoted as Csa and Cair, respectively. The thickness of the cover is indicated by δ, and the diffusion direction is defined along the z-axis. Within the cover of the reservoir, due to the uniform of diffusion at all points across the plane perpendicular to the z-axis, this diffusion process can be described by the partial differential equation
| |
 | (1) |
where
t is the time,
Ccov is the mass concentration of the water within the cover, and
Dcov is the diffusion coefficient of the water within the cover. The boundary conditions of the partial differential equation above are
| |
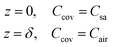 | (2) |
And the initial condition is
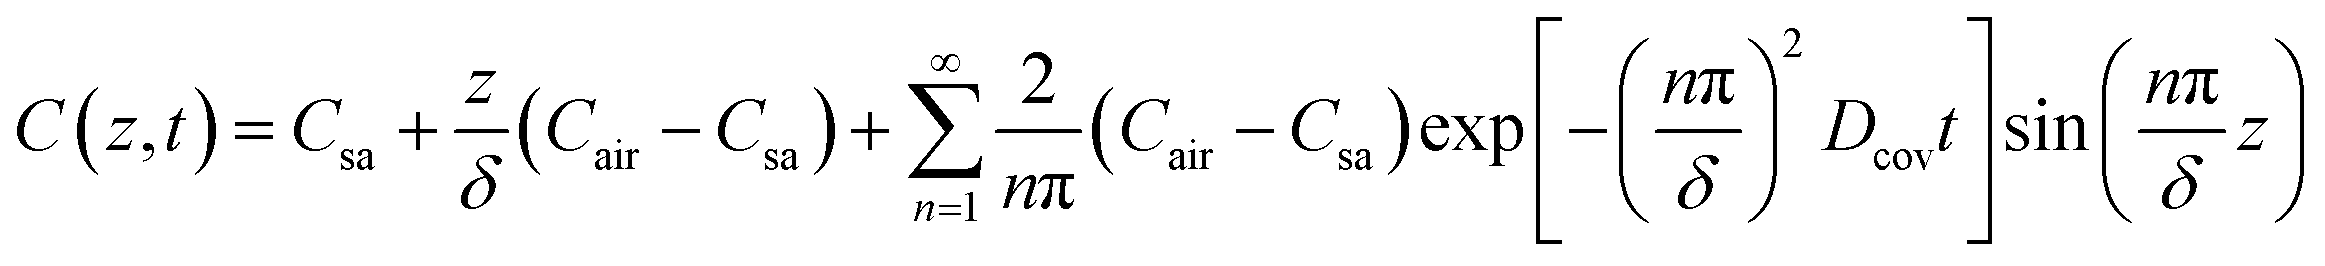
Eqn (1)–(3) constitute a set of homogeneous partial differential equations with nonhomogeneous boundary conditions, for which the solution can be obtained as
| |
 | (4) |
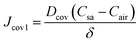
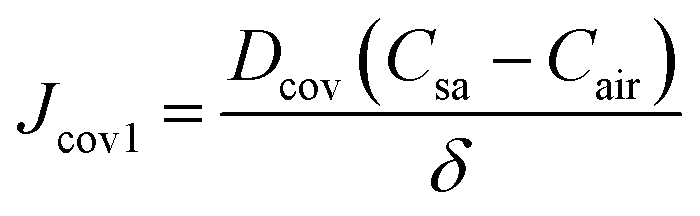
The permeative evaporation flux of the sweat through the cover is given by
| |
 | (5) |
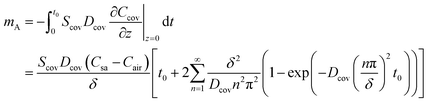
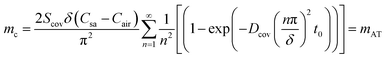
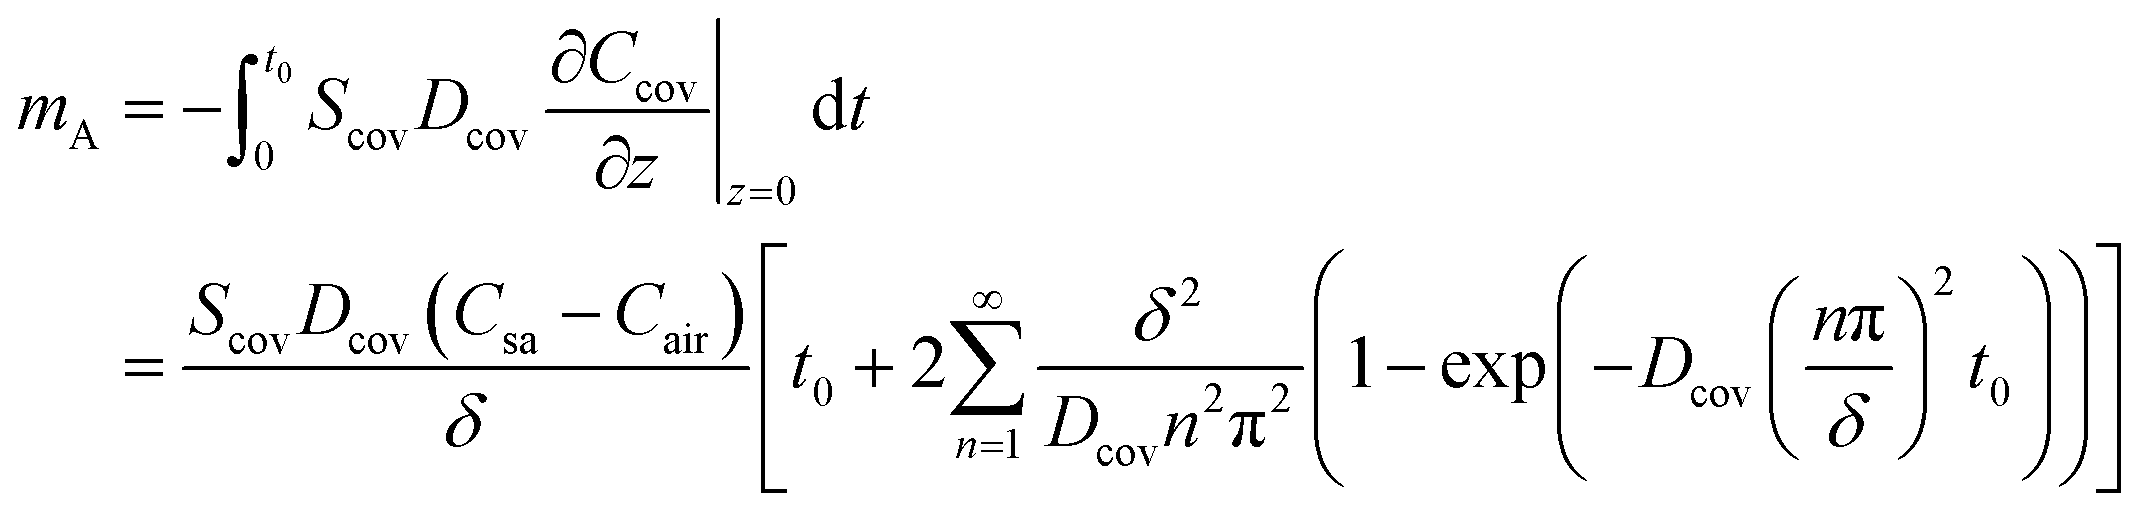
The mass of sweat loss due to permeative evaporation is
| |
 | (6) |
where
Scov is the area of cover,
t0 is the duration of evaporation.
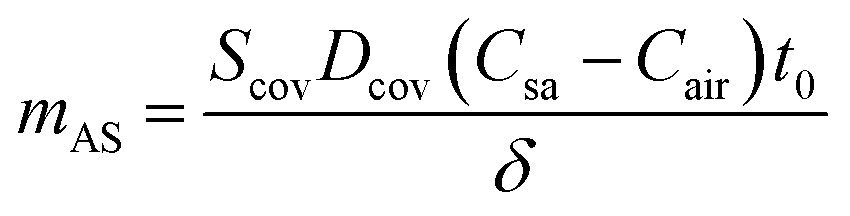
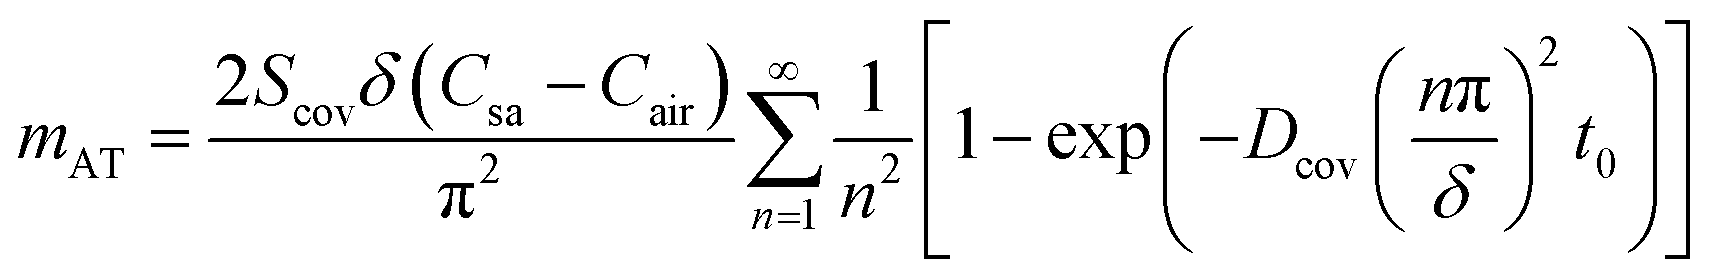
Eqn (6) consists of two parts: the steady-state component (denoted by
mAS) and the transient component (denoted by
mAT), which are given by
| |
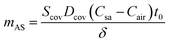 | (7) |
| |
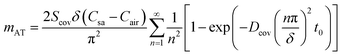 | (8) |
For epidermal microfluidic patches, polydimethylsiloxane (PDMS) is the prevalent material for covers and sidewalls, and the typical thicknesses of the covers and sidewalls are 200 μm and 5 mm, respectively. According to eqn (7) and (8), the changes of mA, mAS and mAT with time in PDMS covers and PDMS sidewalls are depicted in Fig. S1a and S1b,† respectively. It can be observed that the transient component eventually tends to a constant value, and the maximum value of the transient component is directly proportional to the thickness of the membrane. The total loss is approximately equivalent to its steady-state component after a period of time. According to eqn (6), (7) and Fig. S1,† it can be concluded that the concentration distribution of moisture in the cover after equilibrium is the steady-state component of eqn (4).
| |
 | (9) |
Substituting eqn (9) into (5) results in a constant steady-state diffusion flux in the covers
| |
 | (10) |
2.2 Evaporation loss through covers
To ensure that epidermal microfluidic patches conform closely to the skin, the covers must be designed to be very thin. The typical thicknesses of PDMS and PET covers are 200 μm and 10 μm, respectively. Given the thinness of the covers, the evaporation loss of water from the reservoirs through the covers cannot be ignored. This process comprises two series-connection sub-processes: water in sweat permeates through the covers to the cover–air interface, and water molecules diffuse into the ambient environment. Fig. 3 illustrates the physical model of permeative evaporation through a cover. Owing to the desorption effect of moisture at the cover–air interface, the concentration of water vapour at this interface is higher than that in the ambient environment.
 |
| | Fig. 3 Analysis model of water loss through the cover of microfluidic patch. | |
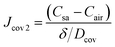
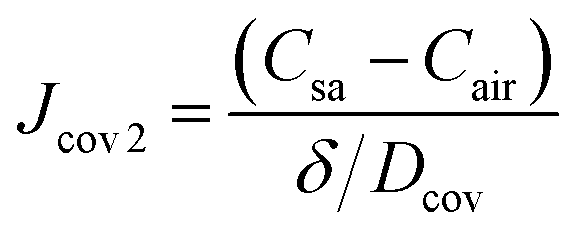
The diffusion flux through the cover can be further expressed as
| |
 | (11) |
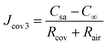
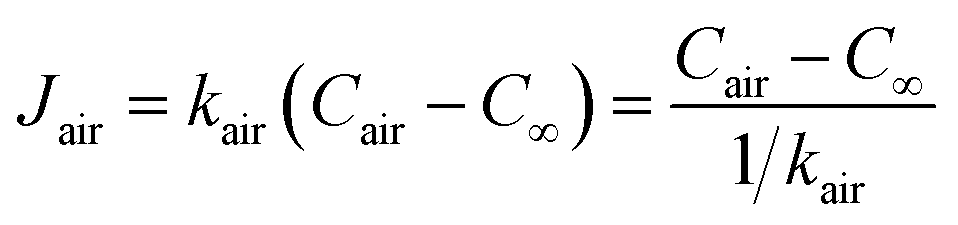
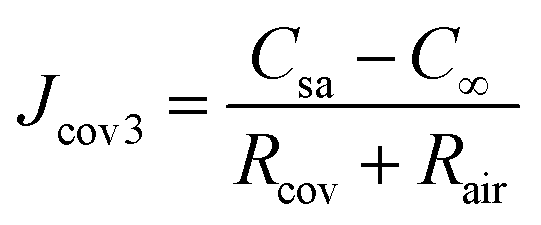
The concentration gradient (Csa − Cair) is the driving force for the diffusion process, and δ/Dcov can be regarded as the diffusion resistance, denoted as Rcov.
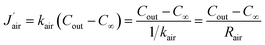
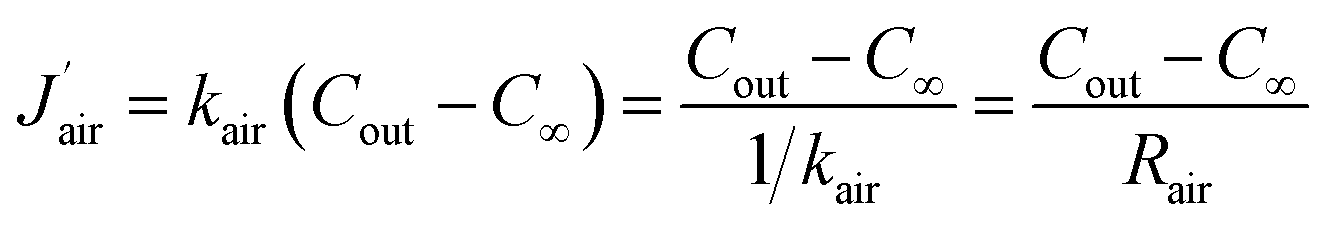
The mass transfer of water vapour from the cover–air interface to the ambient environment is governed by diffusion and convection. The mass transfer flux is directly proportional to the concentration difference.23,26 The concentration of water vapour in the ambient environment is denoted as C∞, and then the mass transfer flux in the air can be described by
| |
 | (12) |
where
kair represents the mass transfer coefficient of the water vapour in the air, and 1/
kair can be considered as the mass transfer resistance of the diffusion process, denoted as
Rair.
In a steady state, there is no accumulation of water vapour at the cover–air interface. Consequently, the flux of the permeative evaporation through the cover equals the flux of the mass transfer in the air, expressed as Jcov = Jair. By combining the expression (Jcov = Jair) with eqn (11) and (12), we can further obtain the flux of permeative evaporation through the cover
| |
 | (13) |
Thus, it can be found that the total mass transfer resistance is the sum of the resistances encountered in each sequential segment of the pathway in a series-connected mass transfer process.
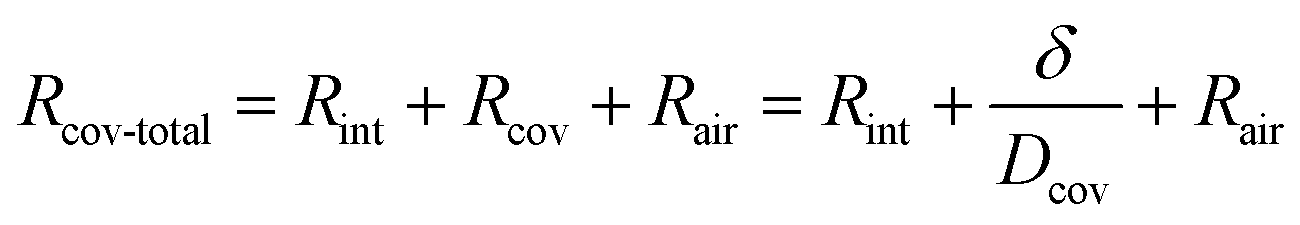
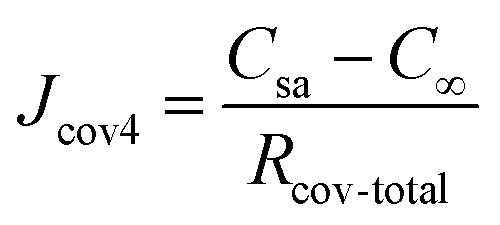
Additionally, water molecules at the sweat–cover interface must overcome the material's interface resistance (denoted as Rint) when they enter the cover through adsorption. Therefore, for the permeative evaporation of the sweat within the cover, the total mass transfer resistance for the entire process—from the adsorption of water molecules at the sweat–cover interface to their desorption at the cover–air interface, followed by diffusion into the ambient environment—can be represented by
| |
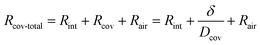 | (14) |
Taking into account the interface resistance, the flux of permeative evaporation is given by
| |
 | (15) |
The mass of permeative evaporation is expressed
2.3 Evaporation loss along microchannels
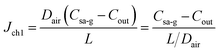
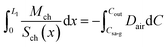
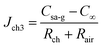
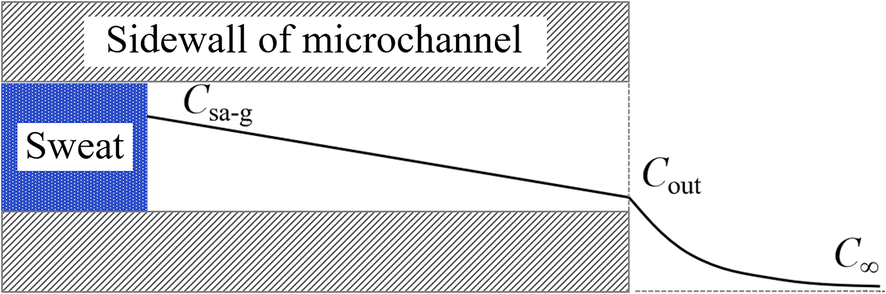
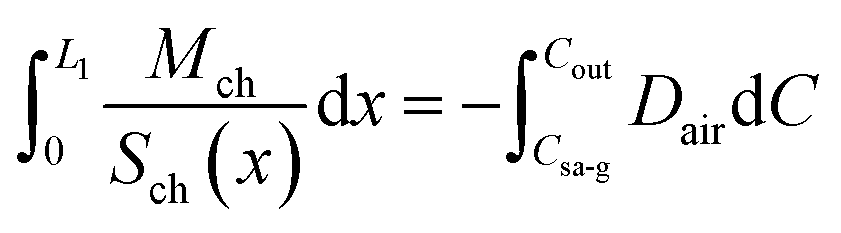
Water in sweat can form saturated water vapour at the sweat–air interface, diffusing along the microfluidic channel to the ambient environment. This process can be divided into two sub-processes: diffusion from the sweat–air interface to the outlet and mass transfer from the outlet to the ambient environment. The model for calculating sweat evaporation along the channel is depicted in Fig. 4. The mass concentration of the water vapour at the sweat–air interface within the channel is denoted as Csa-g. This concentration represents the saturated water vapour concentration at the given temperature. The water vapour concentration at the channel outlet and the ambient environment are denoted as Cout and C∞, respectively. Given the slow nature of the sweat collection process, it can be assumed that there is no air flow within the microfluidic channel, thereby characterizing the mass transfer of water vapour within the channel as a diffusion process. The mass transfer of water vapour from the outlet of the channel to the ambient environment is governed by both diffusion and convection, consistent with the scenario in Fig. 3.
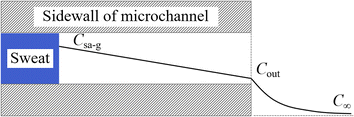 |
| | Fig. 4 Analysis model of water loss along the microchannel. | |
Under steady-state conditions, the concentration gradient within the channel remains constant, with water vapour concentration decreasing linearly from the interior toward the exterior along the channel. The diffusion flux within the channel is
| |
 | (17) |
where
Dair is the diffusion coefficient of water vapour in the air, and
L is the distance between the sweat–air interface and the outlet of the channel.
L/
Dair can be considered as the diffusion resistance of the channel, denoted as
Rch.
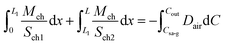
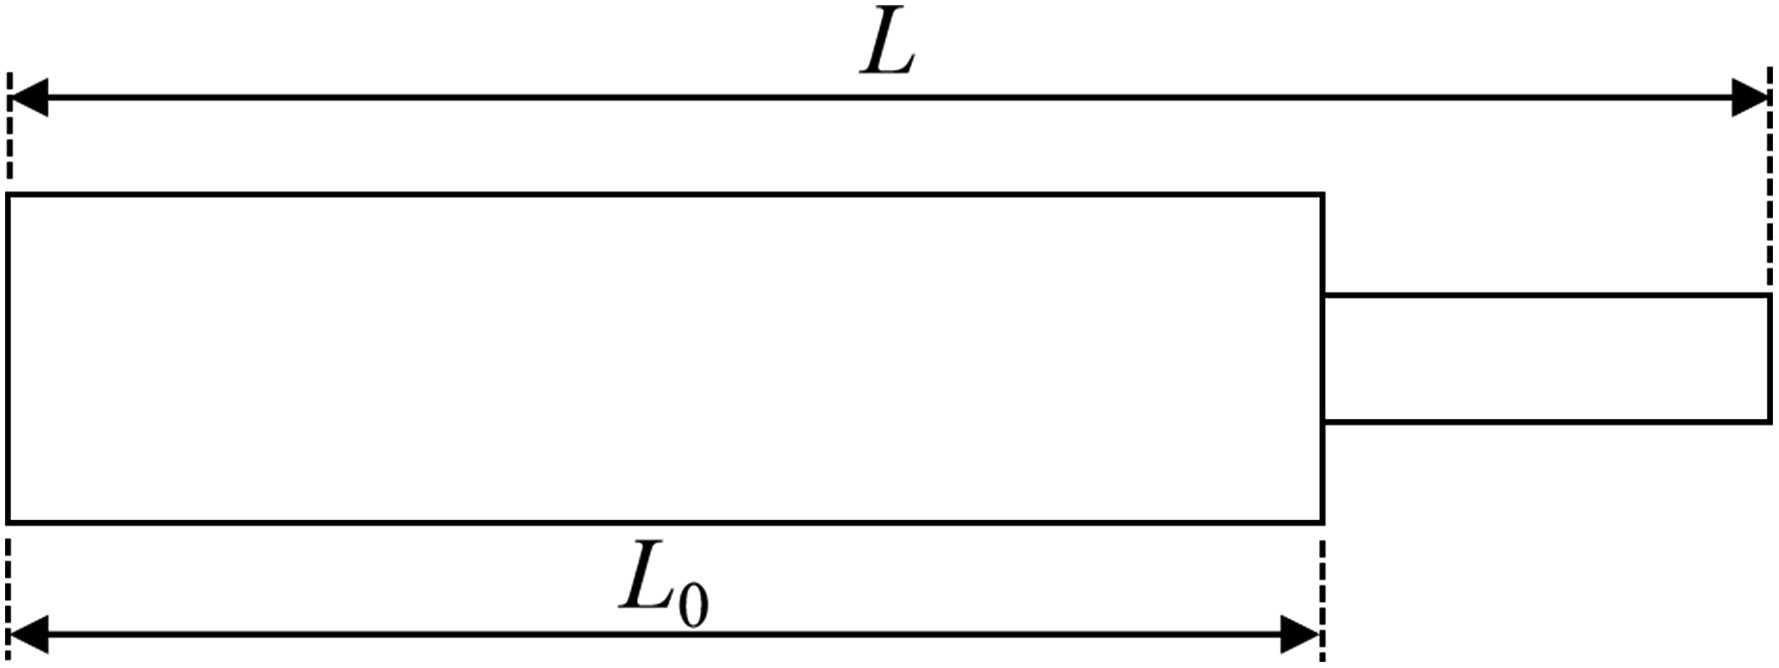
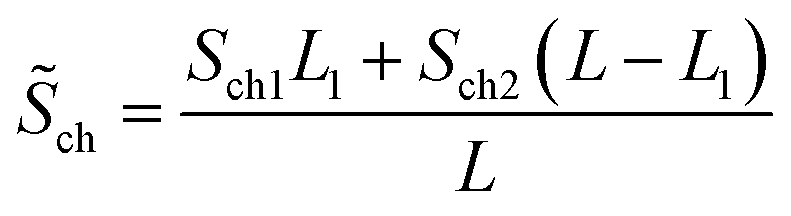
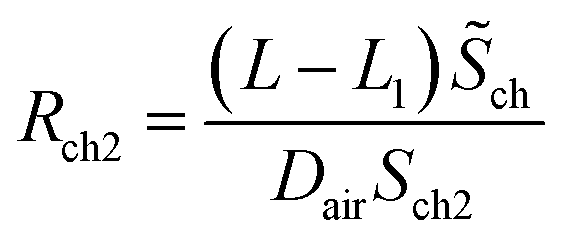
Reducing the dimensions at the end of the channels is an effective measure to reduce the evaporation rate, so it is necessary to further calculate the total resistance of variable cross-section microfluidic channels. The calculation is based on the analytical model in Fig. 5, where the total length of the channel is L, the length of the channel with a cross-sectional area of Sch1 is L1, and the length of the channel with a cross-sectional area of Sch2 is L − L1. The direction along the channel is defined as the x-axis. The mass flow rate in the channel is given by
| |
 | (18) |
where
Sch(
x) is the area of the channel,
Jch(
x) is the diffusive flux, and
Cch(
x) is the water vapour concentration.
Eqn (18) yields
| |
 | (19) |
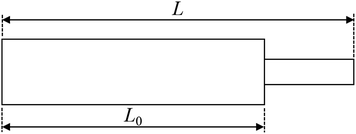 |
| | Fig. 5 Analysis model of the variable cross-section channels. | |
Implementing piecewise integration of the left-hand side of eqn (19), we obtain
| |
 | (20) |
The diffusion flux can be derived by combing eqn (18) and (19)
| |
 | (21) |
where
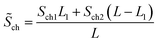
represents the average cross-sectional area of the channel. Let
| |
 | (22-1) |
| |
 | (22-2) |
Rch1 and Rch2 respectively represent the diffusion resistance of the two parts of the channel, then the total diffusion resistance of the channel is
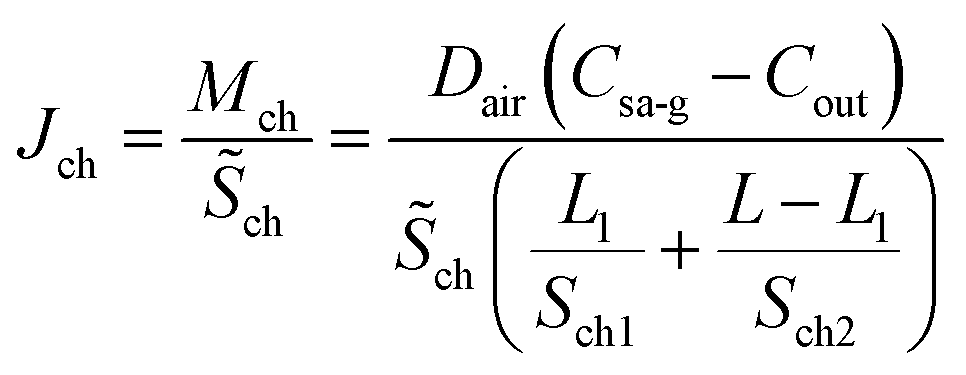
It can be found that the total resistance of two series-connected diffusion processes within the channel is equivalent to the sum of their respective diffusion resistances, which is consistent with the result inferred from eqn (13). The mass transfer flux of water vapour from the outlet of the channel to ambient environment is given by
| |
 | (24) |
As  , after combining eqn (17) and (24) we can obtain the mass transfer flux of water vapour along the microchannel
| |
 | (25) |
The mass of evaporation along the channel is given by
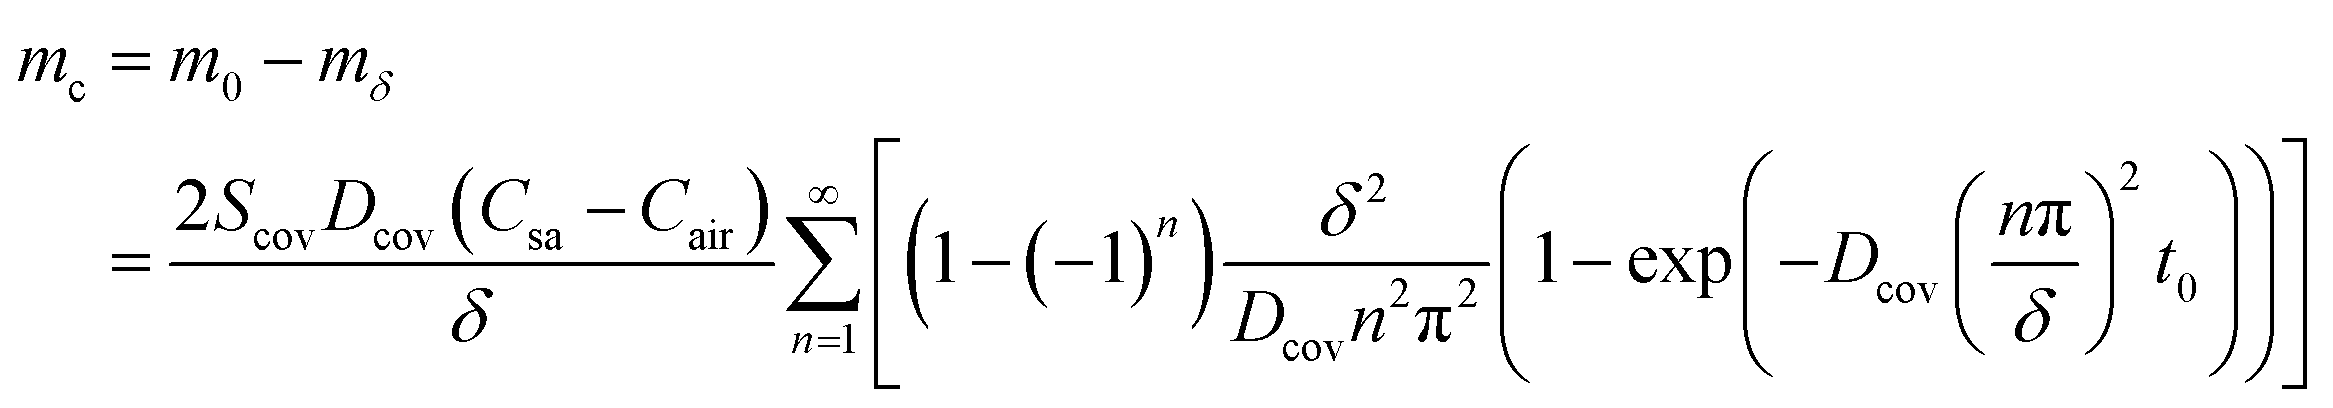
2.4 Absorption loss by sidewalls
PDMS and Polyethylene terephthalate (PET) are commonly utilized materials in fabricating epidermal microfluidic patches and exhibit a certain degree of water absorption properties, which can cause water loss in reservoirs. The thickness of sidewalls is denoted as δ, and the direction of mass transfer is still defined as the z-axis. The coordinates at the sweat-sidewall interface and the sidewall–air interface correspond to z = 0 and z = δ, respectively. The mass of the moisture through the sidewalls at the two interfaces can be given according to eqn (6). At sweat-sidewall interface, the mass of the moisture diffused into the sidewall is denoted as m0 which corresponds to z = 0 in eqn (6), and the mass of the moisture that escapes from the sidewall–air interface is denoted as mδ which corresponds to z = δ in eqn (6). The difference between m0 and mδ reflects the mass of the water absorbed by the sidewalls, denoted as mc.| |
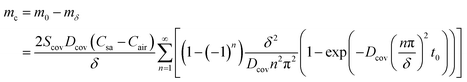 | (27) |
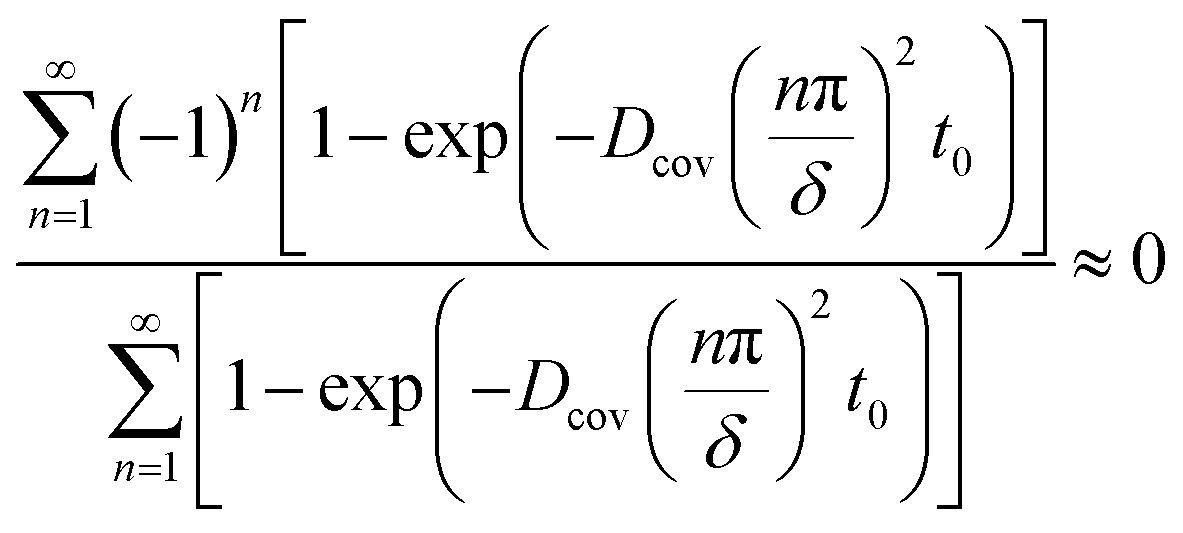
Owing to 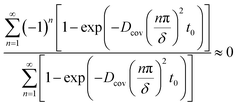 , eqn (27) can be simplified to
| |
 | (28) |
From eqn (28), it can be further inferred that the transient component within eqn (6) pertains to the moisture absorbed by the sidewall, which will remain in the sidewall (or cover) to achieve equilibrium of the internal moisture concentration gradient, and that is to maintain a linear distribution of the moisture concentration along the diffusion path. Absorption ceases once the membrane achieves concentration equilibrium. Besides, the lost moisture corresponding to eqn (7) will diffuse through the cover into the air. From Fig. S1,† it can be found that the side walls and the cover no longer absorb moisture after some time, and moisture loss due to the absorption of the sidewall is far lower than the loss attributed to transmembrane evaporation through the cover. Consequently, moisture loss by the absorption of the sidewalls can be negligible.
3. Materials and methods
PDMS and PET are the most commonly used materials in fabricating microfluidic patches. This section conducted water evaporation experiments in microfluidic patches fabricated with the two materials. From eqn (14), (15), and (25), it can be found that the mass transfer resistance in the air affects both the evaporation process through the covers and the evaporation process along the channels. Consequently, the initial step should involve the experimental determination of the evaporation resistance of water in the air (Rair). Then, the evaporation losses of the moisture through PDMS and PET covers, and along microchannels were measured. In these experiments, to ensure the consistency of Rair, microfluidic patches were placed in a sufficiently large, topless container during each trial. The experiments were conducted with closed doors and windows to maintain uniform air circulation for each trial. The specific experimental protocols are as follows.
3.1 Experiment design on the natural evaporation of water in the air
A dish with water was positioned in a laboratory environment maintained at 25 °C with an ambient humidity of 56%. The evaporation loss of water was assessed using gravimetric measurement.
3.2 Evaporation loss of water through PDMS covers
The design of the microfluidic patch utilized for evaporation experiments through PDMS covers is shown in Fig. S2a.† Eight 1 cm diameter through-holes were fabricated by punching a PDMS plate containing a U-shaped channel. These through-holes served as reservoirs, which were sealed on their bottom and upper sides with PDMS covers. On the bottom side, a 5 mm thick cover was employed, while on the upper side, five thin films with thicknesses of 87, 164, 208, 267, and 340 μm were utilized, respectively. These thicknesses were determined through direct measurements. Water was injected into each reservoir through the U-shaped channel. After filling the microfluidic patch with water, the input and output ports were sealed using two syringe needles, internally coated with cured PDMS, thereby preventing water evaporation along the needles. Due to the thick bottom cover, water within the reservoirs could only permeate and evaporate into the air through the upper PDMS cover. After the microfluidic device was filled with water and sealed, it was placed in a laboratory environment maintained at a temperature of 26 °C and a relative humidity of 47%. The rate of water evaporation loss was determined by weighing the device at intervals. Evaporation tests for varying cover thicknesses were conducted concurrently over the same period.
3.3 Evaporation loss of water through PET covers
The design of the microfluidic patch used for evaporation experiments through PET covers is illustrated in Fig. S2b and S3a.† Sixteen reservoirs with a diameter of 1 cm were fabricated by laser cutting. The bottom side of the reservoirs was sealed with double-sided adhesive tape (approximately 1 mm in thickness), while the upper side was sealed with PET films of varying thicknesses, specifically 12.5, 25, 38, and 50 μm. A U-shaped channel interconnected these reservoirs. The design of the inlet and outlet ports entailed simultaneously sealing both ports with tape after the patch was filled with water, which could prevent evaporation through the channels. Consequently, water loss is solely attributed to the permeative evaporation through the upper PET cover. Once the PET-based patch was filled with water and sealed, it was placed in a laboratory environment at a temperature of 26 °C and a relative humidity of 51%. The rate of water loss was measured using the gravimetric method. To ensure the consistency of the experimental conditions, all the experiments with various thicknesses of the covers were conducted concurrently within the same period.
3.4 Evaporation loss along microchannels
The design of the microfluidic patch used for evaporation experiments along microchannels is illustrated in Fig. S3b and S4.† The patches were fabricated by laser cutting. Each patch is comprised of 14 reservoirs connected to the external environment by an evaporation microchannel, which is 0.51 mm in height and 1.4 mm in width. The fabrication process of the patch involved initially creating a microfluidic device with 14 reservoirs and 14 evaporation channels, in which the channels remained sealed before fluid injection. Subsequently, water was introduced into the reservoirs, then the inlet and outlet were sealed. At last, the evaporation channels were opened by laser cutting. A series of operations above enabled precise control over the distance between the water–air interface and the outlets of the channels. The bottom surfaces of the patches were encapsulated with multilayer double-sided adhesive tapes with a total thickness of 1 mm to prevent the evaporation loss of water molecules through this path. The channels were designed to have lengths of 0.5 mm, 1.0 mm, 1.5 mm, and 2.0 mm, respectively. The patches were placed in a laboratory environment maintained at a temperature of 26 °C and a relative humidity of 41%. The evaporation loss of water was also quantified using the gravimetric method. Evaporation experiments on different channel lengths were also conducted simultaneously.
4. Results and discussion
4.1 Mass transfer resistance of water vapour in the air
Fig. S5† illustrates the experimental results regarding the natural evaporation of water. The mass of the evaporation loss is linearly correlated with time under constant experimental conditions, with an evaporation flux at 2.34 × 10⁻⁶ g cm−2 s−1. It was reported that the temperature at the water–air interface is approximately 6 °C lower than that at ambient temperature during natural evaporation.23,27 Consequently, when the environmental temperature is 25 °C, the temperature at the water surface is about 19 °C. At this temperature, the corresponding saturated water vapour concentration is 17.9 × 10⁻⁶ g cm−3. Under the experimental conditions, the water vapour concentration of the ambient environment is 14.56 × 10⁻⁶ g cm−3. Based on eqn (12), the mass transfer resistance for water vapour in the air under the current experimental conditions is calculated to be 1.42 s cm−1.
4.2 Permeative evaporation through PDMS covers
Fig. 6a depicts the evaporation loss of water within PDMS-based microfluidic patches with covers of varying thicknesses. Taking the cover with a thickness of 87 μm as an example, the evaporation resistance calculation is elucidated as follows.
The total cover area for the eight reservoirs amounts to 6.28 cm2. Over 495 minutes, the cumulative mass loss due to permeative evaporation is 0.083 g. Thus, the evaporation flux of the PDMS cover was calculated to be 0.0836 g ÷ (6.28 cm−2) ÷ (495 × 60 s) = 4.48 × 10⁻⁷ g cm−2 s−1. The evaporation resistance along the permeative evaporation pathway can be derived from eqn (17), in which Csa represents the mass concentration of water at the water–cover interface, determined by the saturation absorption rate of the material. For PDMS material, the saturation absorption rate at the experimental temperature is 2.76 × 10⁻⁴, and the density of the cured PDMS is 1.08 g cm−3. In this case, Csa can be calculated by Csa = 2.76 × 10−4 × 1.08 g cm−3 = 2.98 × 10⁻⁴ g cm−3. Under the above-mentioned experimental conditions, the mass concentration of water vapour in the air is 1.30 × 10⁻⁵ g cm−3. Then, we can obtain the total evaporation resistance is 636.4 s cm−1 according to eqn (15). For the cover with a thickness of 87 μm, the sum of the interface resistance and diffusion resistance (Rint + Rcov) can be calculated by 636.41 – 1.42 s cm−1 = 634.99 s cm−1 according to eqn (14). Using the same methods, the values of (Rint + Rcov) for the cover with the thicknesses of 164, 208, 267, and 340 μm can be figure out as 959.59, 1169.72, 1511.83, 2144.93 s cm−1, respectively.
The interface resistance will remain constant under identical temperature conditions and using the same materials. Therefore, according to eqn (14), a linear relationship exists between (Rint + Rcov) and the thickness, and the fitting results presented in Fig. 6b also confirm this linear relationship. The intercept of the fitted line represents the interface resistance, which is significantly lower than the diffusion resistance, as illustrated in Fig. 6b. According to eqn (14), it is deduced that the slope of the fitting line is equivalent to the reciprocal of the diffusion coefficient of water in the cover. Consequently, the diffusion coefficient of water in PDMS can be calculated by Dcov = 1 ÷ 58![[thin space (1/6-em)]](https://www.rsc.org/images/entities/char_2009.gif) 841 cm2 s−1 = 1.69 × 10⁻⁵ cm2 s−1. This value is consistent with that reported in ref. 28 (namely, 1.53 × 10⁻⁵ cm2 s−1 at 27 °C) and that reported in ref. 29 (namely, 1.48 × 10⁻⁵ cm2 s−1 at 25 °C).
841 cm2 s−1 = 1.69 × 10⁻⁵ cm2 s−1. This value is consistent with that reported in ref. 28 (namely, 1.53 × 10⁻⁵ cm2 s−1 at 27 °C) and that reported in ref. 29 (namely, 1.48 × 10⁻⁵ cm2 s−1 at 25 °C).
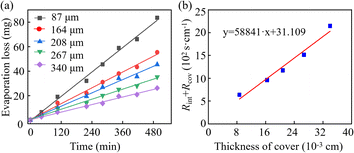 |
| | Fig. 6 (a) Evaporation loss of water through PDMS membrane under different cover thicknesses of microfluidic patches. (b) The relationship between the sum of interface resistance and diffusion resistance and the thickness of the PDMS cover. | |
4.3 Permeative evaporation through PET covers
Fig. 7a depicts the evaporation loss of water within PET-based microfluidic patches with covers of varying thicknesses. The values of (Rint + Rcov) for the covers with the thicknesses of 12.5, 25, 38, and 50 μm can be figured out as 242990, 409548, 630990 and 748457 s cm−1, respectively. In Part II of the ESI,† the evaporation resistance of the PET cover with a thickness of 12.5 μm is taken as an example to illustrate the calculation method.
 |
| | Fig. 7 (a) Evaporation loss of water through PET membrane under different cover thicknesses of microfluidic patches. (b) The relationship between the sum of interface resistance and diffusion resistance and the thickness of the PET cover of microfluidic chips. | |
According to eqn (14), a linear relationship also exists between (Rint + Rcov) and the thickness, confirmed by the fitting results presented in Fig. 7b. The intercept of the fitted line represents the interface resistance, and the slope of the fitting line is equivalent to the reciprocal of the diffusion coefficient of water in the cover. Consequently, the diffusion coefficient of water in PET covers can be calculated by Dcov = 1 ÷ (1.38 × 10⁸) cm2 s−1 = 7.25 × 10⁻⁹ cm2 s−1. This is on the same order of magnitude as the reported results in previous studies. Such as the Dcov of the PET cover in ref. 30 is 5.48 × 10⁻⁹ cm2 s−1, and that in ref. 31 is 9.1 × 10⁻⁹ cm2 s−1. The variation in diffusion coefficients of water in PET is attributed to the different crystallinity of PET polymers. At 26 °C, when the crystallinity ranges from 4% to 25%, the corresponding diffusion coefficients range from 0.52 × 10⁻⁹ to 8.57 × 10⁻⁹ cm2 s−1.32 Evaporation resistance of PET is significantly greater than that of PDMS. Consequently, PET-based microfluidic patches exhibit superior resistance to evaporation.
4.4 Evaporation loss along channels
Fig. 8a illustrates the evaporation loss along the microchannels with varying lengths. It is observed that shorter channels exhibit faster evaporation rates, corresponding to lower evaporation resistance. Taking the channel with a length of 0.5 cm as an example, the calculation method of evaporation resistance is elucidated as illustrated in Part III of the ESI.† Fig. 8b presents a linear fit for channel length versus Rch, where the slope of the fitted line represents the reciprocal of the diffusion coefficient of water vapour in the air according to eqn (17). As the slope of the fitted line is 3.96 s−1 cm−1, Dair is 2.52 × 10⁻¹ cm−1 s−1 which aligns with the diffusion coefficient of water vapour in the air at 26 °C (namely, 2.52 × 10⁻¹ cm−1 s−1).
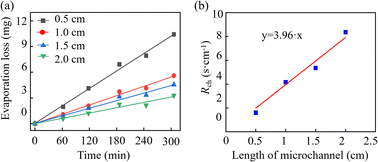 |
| | Fig. 8 (a) Water evaporation loss along microchannel under different channel lengths. (b) The relationship between the diffusion resistance of the microchannel and the channel length. | |
4.5 Summary and discussion of the experimental results
The percentage of water evaporation loss in the epidermal microfluidic patch can more intuitively reflect the rate of water loss caused by evaporation within the patch. Based on the experimental data above, the sweat evaporation loss rate within the microfluidic patch can be assessed as follows. The typical height of the reservoir and the channel in the epidermal microfluidic patch is 200 μm.17,33–37 Given the area of the reservoir (denoted as Scov) used in the experiment, the total mass of water in the reservoir can be calculated as m = hρScov. Therefore, in the pervaporation experiment using the PDMS cover, the total mass of water in the microfluidic patch was 6.28 cm2 × 0.02 cm × 1 g cm−3 = 0.1256 g. Similarly, in the pervaporation experiment using the PET cover, the total mass of water in the microfluidic patch was 12.56 cm2 × 0.02 cm × 1 g cm−3 = 0.2512 g. The evaporation loss rates can be calculated by dividing the mass of pervaporation loss by the total mass, shown in Fig. S6.† The evaporation loss rate through the PDMS cover is significantly higher than that through the PET cover and along the channel. In PDMS-based epidermal microfluidic patches, the primary pathway for sweat loss is through the cover. In contrast, the primary pathway is along the channel in PET-based epidermal microfluidic patches.
The experimental and theoretical values of evaporation resistance in PDMS and PET microfluidic patches are summarized in Table 1. Theoretical evaporation resistances are calculated by eqn (14). Compared to Rcov of PET covers, the deviation between theoretical and experimental values for the Rcov of PDMS covers, as well as the values of the microfluidic channels, is relatively larger. This discrepancy can be attributed to the fact that the PET films used are commercial products which exhibit consistent thickness. In contrast, the homemade PDMS covers may have comparatively lower uniformity in thickness, leading to significant deviations between the measured thickness and the actual thickness. As a result, considerable variation is observed between the theoretical and experimental values for the PDMS cover with a thickness of 87 μm. Similarly, at the 0.5 cm evaporation channel, the smaller channel length may introduce substantial fabrication errors when the channel length is controlled via laser cutting. This could also lead to significant discrepancies between the theoretical and experimental values. Overall, there is a commendable consistency between the theoretical and experimental values. The theoretical calculations and experimental validations above are based on that the sweat within the microfluidic patch is in a stationary state. This includes scenarios where the patch has fully collected sweat and is positioned for subsequent laboratory analysis or in cases of extremely slow sweat sampling. The analysis and calculation of evaporation in the flow state of sweat before the channels are fully filled can refer to Part IV of the ESI.†
Table 1 Experimental and theoretical values of evaporation resistance
| Evaporation pathway |
Thickness (μm) or length (mm) |
Measurement value (s cm−1) |
Theoretical value (s cm−1) |
| PDMS covers |
87 |
603 |
514 |
| 164 |
928 |
970 |
| 208 |
1138 |
1230 |
| 267 |
1480 |
1570 |
| 340 |
2113 |
2010 |
| PET covers |
12.5 |
170190 |
172413 |
| 25 |
336748 |
344927 |
| 38 |
558190 |
524137 |
| 50 |
675657 |
689665 |
| Microchannels |
0.5 |
1.67 |
1.98 |
| 1 |
4.06 |
3.97 |
| 1.5 |
5.36 |
5.95 |
| 2 |
8.1 |
7.9 |
4.6 Discussion on anti-evaporation design of epidermal microfluidic patches
4.6.1 Design of channel structures for anti-evaporation. For PDMS microfluidic patches worn on the skin, the total sweat evaporation loss in the reservoirs can reach approximately 6.3% to 10.7% per hour (referring to the Part V of the ESI†), so it is essential to undertake anti-evaporation designs for sweat management. Minimizing the cross-sectional area of the channel can reduce evaporation rates. However, reducing the area will result in increased flow resistance, which may impact the natural secretion rate of sweat.33,38 Furthermore, smaller cross-sectional dimensions present more significant challenges in fabrication. To reconcile the contradiction between evaporation resistance and flow resistance of the channels, the dimension at the outlet of channels can be reduced and optimized according to eqn (23). It is important to note that decreasing the size of the dimensions of the outlets will result in elevated backpressure within the channel, which may also affect the flow rate of sweat within the channel.16 Besides, increasing the channel length can also reduce the evaporation rate along the channel. Specifically, in the channels designed to eliminate the backpressure of the reservoirs in microfluidic patches, the channel length can be extended through structural design within a confined space. Equipping each reservoir with three backpressure release channels can prevent air stagnation within the reservoir;5,39 however, the three channels increase the sweat evaporation rate. Suppose all the backpressure release channels in an entire microfluidic patch intersect at a single channel and release the backpressure through a single outlet. In that case, the evaporation loss from the backpressure release channels can be effectively reduced.40
4.6.2 Design of cover thicknesses and cover materials for anti-evaporation. Increasing the thicknesses of covers can diminish the evaporation rate. For PDMS microfluidic patches, a thicker cover can prevent the collapse of roof of reservoirs,41,42 but it may impact the flexibility of the patches. Typically, utilizing the cover with 300 μm in thickness can build a balance between maintaining flexibility and significantly reducing the evaporation rate and preventing roof collapse for typical reservoir size. If a thinner cover is used, a thin film with a low diffusion coefficient of water can be applied to a local area on the top side of the cover to block the evaporation pathway of water through the PDMS cover. This may be an effective method to reduce the evaporation of sweat through the cover while maintaining the flexibility of the device. Besides, employing PET material can markedly reduce the evaporation rate due to the significantly lower diffusion coefficient of water in PET compared to that in PDMS, and the PET-based microfluidic patches are suitable for rapid manufacturing through laser processing. However, the fabrication of PET microfluidic patches by laser cutting is challenging to achieve fine channel dimensions, making it unsuitable for applications that require precise size control of the channels, such as sequential sweat collection based on capillary burst valves.
5. Conclusions
The anti-evaporation design of epidermal microfluidic patches is crucial for preventing an increase in biomarker concentration caused by evaporation and ensuring the reliability of biochemical analysis of sweat. This study systematically analyzes the mechanisms of sweat evaporation loss in epidermal microfluidic patches and derives the quantity of sweat loss on three paths. Compared to the sweat loss through the covers or along the channels, the duration of sweat loss absorbed by the sidewalls or covers is limited. The amount of moisture in sweat absorbed by the sidewalls or covers is used to establish a linear concentration gradient within the material for the diffusion process. Once the internal concentration in the material reaches equilibrium, it will stop absorbing moisture. In general, the amount of moisture in sweat absorbed by the materials is much less than the losses through the covers and along the channels so that it can be neglected. Experimental verification of the theoretical calculations was carried out in PET and PDMS-based microfluidic paths. For PDMS epidermal microfluidic patches, sweat evaporation occurs more readily through the cover. In contrast, evaporation loss along the channel accounts for PET-based patches' main component of total sweat loss. Compared to PDMS, Microfluidic patches with PET covers exhibit better water retention properties, yet PDMS epidermal microfluidic patches maintain appropriate flexibility and excellent transparency for in situ sweat biochemical analysis. Additionally, the inherent hydrophobicity of PDMS, coupled with the ability to achieve precise microstructures via the soft-lithography method, grants PDMS microfluidic patches a unique advantage in the chrono-sampling of sweat.
Data availability
The data can be obtained by contacting the corresponding author or first author.
Author contributions
Lei Wei: conceptualization, methodology, investigation, validation, data curation, formal analysis, writing – original draft & review. Jingjing Zhou: software, data curation, formal analysis. Zhen Li: validation, software, visualization. Hui Zhu: formal analysis, visualization. Huaping Wu: conceptualization, supervision. Yong Zhu: supervision, project administration, funding acquisition. Aiping Liu: supervision, project administration, funding acquisition, writing – review & editing. All authors read and approved the final manuscript.
Conflicts of interest
There are no conflicts to declare.
Acknowledgements
This work was supported by the National Natural Science Foundation of China (No. 12272351 and 11972323), Zhejiang Provincial Natural Science Foundation of China (No. Z24A020008 and LR20A020002), Key Natural Science Research Projects in Higher Education Institutions in Anhui Province of China (No. 2023AH050408), Major Natural Science Research Projects in Higher Education Institutions in Anhui Province of China (No. 2022AH040200 and 2023AH040065), Fuyang Normal University Youth Talent Key (No. rcxm202304), Open Project in Anhui Provincial Universities Key Laboratory on Structures and Devices of Information Functional Materials (No. FMDI202301), and Fuyang Normal University Scientific Research Projects Consigned by Enterprises (No. SXHZ202208).
References
- J. Min, J. Tu, C. Xu, H. Lukas, S. Shin, Y. Yang, S. A. Solomon, D. Mukasa and W. Gao, Chem. Rev., 2023, 123, 5049–5138 CrossRef CAS.
- S. Chen, Z. Qiao, Y. Niu, J. C. Yeo, Y. Liu, J. Qi, S. Fan, X. Liu, J. Y. Lee and C. T. Lim, Nat. Rev. Bioeng., 2023, 1, 950–971 CrossRef.
- L. B. Baker, Temperature, 2019, 6, 211–259 CrossRef PubMed.
- L. Wei, Z. Lv, Y. He, L. Cheng, Y. Qiu, X. Huang, C. Ding, H. Wu and A. Liu, Sens. Actuators, B, 2023, 379, 133213 CrossRef CAS.
- J. Choi, D. Kang, S. Han, S. B. Kim and J. A. Rogers, Adv. Healthcare Mater., 2017, 6, 1601355 CrossRef PubMed.
- H. Y. Y. Nyein, M. Bariya, B. Tran, C. H. Ahn, B. J. Brown, B. J. Ji, N. Davis and A. Javey, Nat. Commun., 2021, 12, 1823 CrossRef CAS PubMed.
- H. Zhao, X. L. Zhang, Y. X. Qin, Y. Xia, X. Xu, X. G. Sun, D. H. Yu, S. M. Mugo, D. Wang and Q. Zhang, An Integrated Wearable Sweat Sensing Patch for Passive Continuous Analysis of Stress Biomarkers at Rest, Adv. Funct. Mater., 2023, 33, 2212083 CrossRef CAS.
- H. Zhao, L. Zhang, T. B. Deng and C. Z. Li, ACS Appl. Mater. Interfaces, 2024, 16, 19605–19614 CrossRef CAS PubMed.
- C. Zhang and D. Xing, Microfluid. Nanofluid., 2010, 9, 17–30 CrossRef CAS.
- G. Czilwik, I. Schwarz, M. Keller, S. Wadle, S. Zehnle, F. von Stetten, D. Mark, R. Zengerle and N. Paust, Lab Chip, 2015, 15, 1084–1091 RSC.
- E. Noviana, C. P. McCord, K. M. Clark, I. Jang and C. S. Henry, Lab Chip, 2020, 20, 9–34 RSC.
- L. Wei, L. Li, Z. Dai, L. Ding, H. Wei, J. Li, H. Zhu and Y. Zhu, Adv. Mater. Technol., 2024, 9, 2301812 CrossRef CAS.
- B. Lin, Z. Guo, Z. Geng, S. Jakaratanopas, B. Han and P. Liu, Lab Chip, 2020, 20, 2981–2989 RSC.
- Y. Zhang, Y. Chen, J. Huang, Y. Liu, J. Peng, S. Chen, K. Song, K. Ouyang, H. Cheng and X. Wang, Lab Chip, 2020, 20, 2635–2645 RSC.
- S. B. Kim, S. B. Zhang, M. W. Sang, A. J. Bandodkar and J. A. Rogers, Small, 2018, 14, 1703334 CrossRef.
- A. Koh, D. Kang, Y. Xue, S. Lee, R. M. Pielak, J. Kim, J. Hwang, S. Min, A. Banks, P. Bastien, M. C. Manco, L. Wang, K. R. Ammann, K.-I. Jang, P. Won, S. Han, R. Ghaffari, U. Paik, M. J. Slepian, G. Balooch, Y. Huang and J. A. Rogers, Sci. Transl. Med., 2016, 8, 366ra165 Search PubMed.
- J. T. Reeder, J. Choi, Y. Xue, P. Gutruf, J. Hanson, M. Liu, M. Ray, A. J. Bandodkar, R. Avila, R. Xia, S. Krishnan, S. Xu, K. Barnes, M. Pahnke, R. Ghaffari, Y. Huang and J. A. Rogers, Sci. Adv., 2019, 5, eaau6356 CrossRef.
- Y. Zhang, H. Guo, S. B. Kim, Y. Wu, D. Ostojich, S. H. Park, X. Wang, Z. Weng, R. Li, A. J. Bandodkar, Y. Sekine, J. Choi, S. Xu, S. Quaggin, R. Ghaffari and J. A. Rogers, Lab Chip, 2019, 19, 1545–1555 RSC.
- B. Heo, M. Fiola, J. H. Yang and A. Koh, Colloid Interface Sci., 2020, 38, 100301 CrossRef CAS.
- A. Polini, E. Mele, A. G. Sciancalepore, S. Girardo, A. Biasco, A. Camposeo, R. Cingolani, D. A. Weitz and D. Pisignano, Biomicrofluidics, 2010, 4, 036502 CrossRef.
- L. Wei, G. Fang, Z. Kuang, L. Cheng, H. Wu, D. Guo and A. Liu, Sens. Actuators, B, 2022, 353, 131085 CrossRef CAS.
- C. C. Peng, C. Cerretani, Y. Li, S. Bowers, S. Shahsavarani, M. C. Lin and C. J. Radke, Ind. Eng. Chem. Res., 2014, 53, 18130–18139 CrossRef CAS.
- C. F. Cerretani, N. H. Ho and C. J. Radke, Adv. Colloid Interface Sci., 2013, 197, 33–57 CrossRef.
- A. Mafia, A. Raisi, M. Hatam and A. Aroujalian, J. Membr. Sci., 2012, 423, 175–188 CrossRef.
- J. T. Reeder, J. Choi, Y. Xue, P. Gutruf, P. Hanson, M. Liu, T. Ray, A. J. Bandodkar, R. Avila, W. Xia, S. Krishnan, S. Xu, K. Barnes, M. Pahnke, R. Ghaffari, Y. Huang and J. A. Rogers, Sci. Adv., 2019, 5, eaau6356 CrossRef PubMed.
- A. Gilby and E. Heymann, Aust. J. Chem., 1948, 1, 197–215 CrossRef CAS.
- N. L. Jarvis and R. E. Kagarise, J. Colloid Sci., 1962, 17, 501–511 CrossRef CAS.
- Y. Tamai, H. Tanaka and K. Nakanishi, Macromolecules, 1994, 27, 4498–4508 CrossRef CAS.
- H. J. Lue, T. H. Yang, K. S. Chang and K. S. Tung, J. Membr. Sci., 2012, 415, 635–643 CrossRef.
- M. D. Kempe, Sol. Energy Mater. Sol. Cells, 2006, 90, 2720–2738 CrossRef CAS.
- S. Marais, Q. T. Nguyen, C. Devallencourt, M. Metayer, T. U. Nguyen and P. Schaetzel, J. Polym. Sci., Part B: Polym. Phys., 2000, 38, 1998–2008 CrossRef CAS.
- C. Summon, J. Yarwood and N. Everall, Polymer, 2000, 41, 2521–2534 CrossRef.
- D.-H. Choi, M. Gonzales, G. B. Kitchen, D.-T. Phan and P. C. Searson, ACS Sens., 2020, 5, 3821–3826 CAS.
- Z. Yuan, L. Hou, M. Bariya, H. Y. Y. Nyein, L.-C. Tai, W. Ji, L. Li and A. Javey, Lab Chip, 2019, 1, 3179–3189 RSC.
- Y. Yang, Y. Song, X. Bo, J. Min, O. S. Pak, L. Zhu, M. Wang, J. Tu, A. Kogan, H. Zhang, K. T. Hsiai, Z. Li and W. Gao, Nat. Biotechnol., 2019, 38, 217–229 CrossRef PubMed.
- H. Y. Y. Nyein, M. Bariya, L. Kivimäki, S. Uusitalo, T. S. Liaw, E. Jansson, C. H. Ahn, J. A. Hangasky, J. Zhao, Y. Lin, T. Happonen, M. Chao, C. Liedert, Y. Zhao, L.-C. Tai, J. Hiltunen and A. Javey, Sci. Adv., 2019, 5, eaaw9906 CrossRef CAS.
- J. Choi, S. Chen, Y. Deng, Y. Xue, J. T. Reeder, D. Franklin, Y. S. Oh, J. B. Model, A. J. Aranyosi, S. P. Lee, R. Ghaffari, Y. Huang and J. A. Rogers, Adv. Healthcare Mater., 2020, 10, 2000722 CrossRef.
- L. Wei, Y. He, Z. Lv, D. Guo, L. Cheng, H. Wu and A. Liu, Biosensors, 2023, 13, 67 CrossRef CAS.
- S. B. Kim, J. Koo, J. Yoon, A. Hourlier-Fargette, A. Lee, S. Chen, S. Jo, J. Choi, Y. S. Oh, G. Lee, S. M. Won, A. J. Aranyosi, S. P. Lee, J. B. Model, P. V. Braun, R. Ghaffari, C. Parki and J. A. Rogers, Lab Chip, 2020, 84, 84–92 RSC.
- J. Choi, A. J. Bandodkar, J. T. Reeder, T. R. Ray, A. Turnquist, S. B. Kim, N. Nyberg, N. Hourlier-Fargette, J. B. Model, A. J. Aranyosi, S. Xu, R. Ghaffari and J. A. Rogers, ACS Sens., 2019, 4, 379–388 CrossRef CAS PubMed.
- X. Wang, S. Chen, Y. Zhang, L. Li, Y. Xue, Y. Luan and Y. Ma, Appl. Phys. Lett., 2018, 113, 163702 CrossRef.
- Y. Liu, Y. Sun, J. Huang, Y. Chen, Y. Yang, S. Qu, H. Cheng, J. Song and X. Wang, Int. J. Solids Struct., 2022, 252, 111821 CrossRef.
|
| This journal is © The Royal Society of Chemistry 2024 |
Click here to see how this site uses Cookies. View our privacy policy here. 
 Open Access Article
 This Open Access Article is licensed under a Creative Commons Attribution-Non Commercial 3.0 Unported Licence
 ab,
Jingjing Zhoua,
Zhen Lia,
Hui Zhua,
Huaping Wu
ab,
Jingjing Zhoua,
Zhen Lia,
Hui Zhua,
Huaping Wu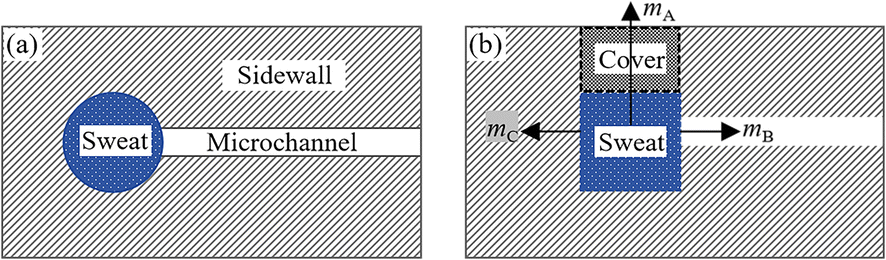


 represents the average cross-sectional area of the channel. Let
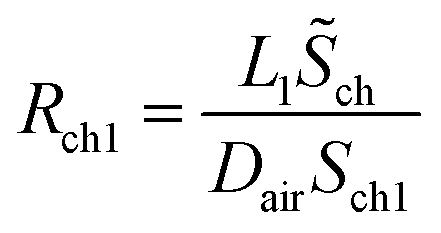
 , after combining eqn (17) and (24) we can obtain the mass transfer flux of water vapour along the microchannel
 , eqn (27) can be simplified to