 Open Access Article
Construction of Zn–Cu bimetallic metal–organic frameworks for carbon dioxide capture
Xinyu Li ,
Shijie Li*,
Jiahao Liu,
Jin Zhang
 ,
Yunpeng Ren and
Jianguo Zhao*
Engineering Research Center of Coal-based Ecological Carbon Sequestration Technology of the Ministry of Education, Shanxi Datong University, Datong 037009, China. E-mail: li841974@sina.com; jianguozhao9150@163.com
First published on 1st July 2024
Abstract
Bimetallic metal–organic frameworks (MOFs) have shown more impressive performance in gas adsorption compared with monometallic MOFs. Herein, a Cu–Zn bimetallic metal–organic framework (Zn/Cu-BTC) was synthesized via a one-pot method, and its structure, thermal stability and CO2 adsorption property were investigated and compared with those of corresponding monometallic Cu-BTC and Zn-BTC. The results showed that Zn/Cu-BTC has a specific ortho-octahedral crystal morphology with a unique X-ray diffraction peak, the atomic ratio of Zn to Cu is about 1![[thin space (1/6-em)]](https://www.rsc.org/images/entities/char_2009.gif) :
:![[thin space (1/6-em)]](https://www.rsc.org/images/entities/char_2009.gif) 5, and it remained stable at a temperature up to 490 K. In Zn/Cu-BTC, Cu2+ played a role in increasing the specific surface area and porosity of the MOF and improving the gas adsorption performance. The CO2 adsorption of Zn/Cu-BTC is lower than that of Cu-BTC but much higher than that of Zn-BTC, and CO2 adsorption heat was 30.52 kJ mol−1, which indicated physical adsorption. In addition, Zn/Cu-BTC had higher CO2/N2 adsorption selectivity compared with Zn-BTC and Cu-BTC, with a maximum value of 17. This study can be a reference for the research on improving the adsorption selectivity of gases by constructing bimetallic MOFs.
5, and it remained stable at a temperature up to 490 K. In Zn/Cu-BTC, Cu2+ played a role in increasing the specific surface area and porosity of the MOF and improving the gas adsorption performance. The CO2 adsorption of Zn/Cu-BTC is lower than that of Cu-BTC but much higher than that of Zn-BTC, and CO2 adsorption heat was 30.52 kJ mol−1, which indicated physical adsorption. In addition, Zn/Cu-BTC had higher CO2/N2 adsorption selectivity compared with Zn-BTC and Cu-BTC, with a maximum value of 17. This study can be a reference for the research on improving the adsorption selectivity of gases by constructing bimetallic MOFs.
1 Introduction
The use of fossil fuels has led to increasing concentrations of greenhouse gases in the atmosphere, including carbon dioxide (CO2), nitrogen oxides (NOx) and methane (CH4), which poses a threat to the stability of ecosystems and human health. In this context, CO2 holds the most significant proportion among greenhouse gases,1 and the development of CO2 capture materials is therefore critical for mitigating the intensification of the greenhouse effect.Metal–organic frameworks (MOFs) are a class of crystalline porous materials with a periodic network structure formed by inorganic metal clusters linked to organic ligands through self-assembly. They are of great interest in the field of gas adsorption, separation2–4 and storage5,6 because of their high porosity, large specific surface area, regular pore channels, adjustable pore size and exposed active sites.7–9 Recently, the application of MOFs in CO2 capture has attracted much attention.10–12 Qasem et al.13 studied the adsorption of CO2 by MOF-5 and MOF-117; the results emphasized that MOF-5 is a good choice for CO2 storage applications at a pressure of less than 5 bar, whereas MOF-177 is a superior storage medium for the same purpose at higher pressures (≥10 bar). Cho et al.14 synthesized Co-MOF-74 crystals through microwave heating with a high CO2 adsorption capacity (288 mg g−1) and excellent selectivity over N2 (>25![[thin space (1/6-em)]](https://www.rsc.org/images/entities/char_2009.gif) :
:![[thin space (1/6-em)]](https://www.rsc.org/images/entities/char_2009.gif) 1) at 298 K. Chen et al.15 successfully synthesized MOF-74 (Ni) by microwave assistance at 313 K within 60 min, and its CO2 adsorption capacity at 298 K was as high as 5.22 mmol g−1, which was nearly 6 times higher than that of commercial activated carbon (0.89 mmol g−1).
1) at 298 K. Chen et al.15 successfully synthesized MOF-74 (Ni) by microwave assistance at 313 K within 60 min, and its CO2 adsorption capacity at 298 K was as high as 5.22 mmol g−1, which was nearly 6 times higher than that of commercial activated carbon (0.89 mmol g−1).
Generally, the CO2 adsorption capacity of MOFs could be further improved through modifications. Previous studies revealed that the CO2 capacity of ZIF-8 could be greatly enhanced via carbonization16 or amino-functionalization modification.17 Moreover, the addition of a second metal to the MOF to construct a bimetallic MOF can improve the stability of the MOF and enhance the interaction with CO2, which can further improve its CO2 adsorption capacity.18 Zhou et al.19 synthesized bimetallic MIL-101(Cr, Mg) by doping Mg in MIL-101(Cr); the CO2 adsorption capacity of MIL-101(Cr, Mg) reached 3.28 mmol g−1 at 298 K and 1 bar, with an increase of 40% in comparison with MIL-101(Cr). Meanwhile, the CO2/N2 adsorption selectivity of MIL-101(Cr, Mg) was significantly enhanced. The study by Kadi et al.20 indicated that the Cu1.5Mg1.5(BTC)2 MOF showed significant enhancement of its CO2 adsorption capacity (23.85 mmol g−1) compared with Cu-BTC MOF (5.95 mmol g−1) and Mg-BTC MOF (4.57 mmol g−1). Ling et al.21 synthesized bimetallic MgCu-MOF-74 by the one-pot method, and the CO2 uptake under visible light was superior to that of the corresponding monometallic MOF-74.
Inspired by the above research, herein, we prepared Zn–Cu bimetallic MOF (named as Zn/Cu-BTC) by the one-pot method and compared its pore structure and CO2 adsorption with that of the corresponding monometallic Zn-BTC and Cu-BTC.
2 Materials and methods
2.1 Materials
Zinc nitrate hexahydrate (Zn(NO3)2·6H2O) was AR grade and purchased from Sinopharm Chemical Reagent Co., Ltd. Copper nitrate trihydrate (Cu(NO3)2·3H2O, 99% purity) and trimesic acid (H3BTC, C9H6O6, 99% purity) were purchased from Shanghai Adamas Reagent Co., Ltd. N,N-dimethylformamide (DMF, C3H7NO) was AR grade and bought from Tianjin Tianli Chemical Reagent Co., Ltd. Triethylamine (TEA, (C2H5)3N, AR grade) was purchased from Shanghai Titan Scientific Co., Ltd.2.2 Synthesis of MOFs
![[thin space (1/6-em)]](https://www.rsc.org/images/entities/char_2009.gif) :
:![[thin space (1/6-em)]](https://www.rsc.org/images/entities/char_2009.gif) CH3OH
CH3OH![[thin space (1/6-em)]](https://www.rsc.org/images/entities/char_2009.gif) :
:![[thin space (1/6-em)]](https://www.rsc.org/images/entities/char_2009.gif) H2O = 2
H2O = 2![[thin space (1/6-em)]](https://www.rsc.org/images/entities/char_2009.gif) :
:![[thin space (1/6-em)]](https://www.rsc.org/images/entities/char_2009.gif) 1
1![[thin space (1/6-em)]](https://www.rsc.org/images/entities/char_2009.gif) :
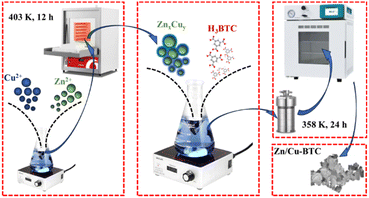
:![[thin space (1/6-em)]](https://www.rsc.org/images/entities/char_2009.gif) 1, v/v) by stirring with a magnetic stirrer (rotation speed: 350 rpm) for 5 h. After that, 1.2 mL triethylamine was slowly added dropwise to the mixed solution with continuous stirring (rotation speed: 400 rpm) for 20 min, after which the mixed solution was poured into a hydrothermal kettle and reacted at 358 K for 24 h, followed by washing with DMF twice and methanol four times and finally dried in an oven at 363 K for 12 h to produce Zn/Cu-BTC.
1, v/v) by stirring with a magnetic stirrer (rotation speed: 350 rpm) for 5 h. After that, 1.2 mL triethylamine was slowly added dropwise to the mixed solution with continuous stirring (rotation speed: 400 rpm) for 20 min, after which the mixed solution was poured into a hydrothermal kettle and reacted at 358 K for 24 h, followed by washing with DMF twice and methanol four times and finally dried in an oven at 363 K for 12 h to produce Zn/Cu-BTC.
2.3 Characterization
The morphologies of synthesized Zn-BTC, Cu-BTC and Zn/Cu-BTC were determined using high-resolution field emission scanning electron microscopy (SEM, TESCAN MAIA 3 LMH, accelerating voltage: 20 kV). Meanwhile, the elemental compositions and distributions of the three samples were determined using an energy dispersive spectrometer (EDS, X-ACT, Oxford Instruments, accelerating voltage 20 kV, objective distance 6 mm).The crystal structures of Zn-BTC, Cu-BTC and Zn/Cu-BTC were determined using an X-ray diffractometer (XRD, SmartLab SE, Rigaku Corporation, 30 kV, 10 mA, scan range: 5–30°, scan rate: 2° min−1).
The thermal stabilities of Zn-BTC, Cu-BTC and Zn/Cu-BTC were determined using a thermogravimetric analyzer (TGA, TG209 F3, NETZSCH Instruments, temperature range: 303–873 K, heating rate: 5 K min−1).
The pore size distributions and gas adsorption properties of Zn-BTC, Cu-BTC and Zn/Cu-BTC were determined by an automated specific surface and porosity analyzer (Quantachrome Nova 4000e, Quantachrome Instruments, 393 K, vacuum (10−3 kPa) degassed for 6 hours before testing); the N2 adsorption/desorption test temperatures were done at 77 K and 298 K, and the CO2 adsorption test temperatures were done at 288 K and 298 K.
3 Results and discussion
3.1 The morphology and pore structure of Zn/Cu-BTC
Fig. 2a–c show the morphologies and X-ray EDS of Zn-BTC, Cu-BTC and Zn/Cu-BTC. Zn-BTC is in the lamellar aggregated state with an average diameter of about 1.0 μm, Cu-BTC is in circular or elliptical lamellae and most of them are in the range of 0.25–0.5 μm in diameter. For Zn/Cu-BTC, its morphology is mainly micrometer-sized ortho-octahedral particles with a particle size of about 1.5 μm. In addition, the element Cu and Zn are synchronously detected by X-ray EDS in Zn/Cu-BTC, and the atomic number ratio of Zn to Cu is approximately 1![[thin space (1/6-em)]](https://www.rsc.org/images/entities/char_2009.gif) :
:![[thin space (1/6-em)]](https://www.rsc.org/images/entities/char_2009.gif) 5 (as shown in Table 1), proving the successful synthesis of bimetallic MOF.
5 (as shown in Table 1), proving the successful synthesis of bimetallic MOF.
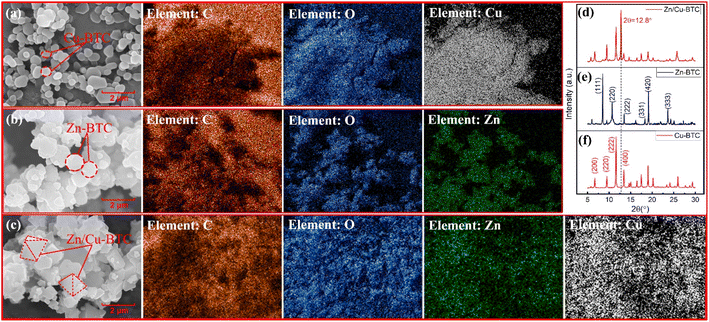 | ||
| Fig. 2 The morphologies and X-ray EDS of Cu-BTC (a), Zn-BTC (b) and Zn/Cu-BTC (c), and X-ray diffraction patterns of Zn/Cu-BTC (d), Zn-BTC (e), and Cu-BTC (f). | ||
| Element | Weight% | Atomic% |
|---|---|---|
| C | 47.03 | 60.77 |
| O | 36.24 | 35.16 |
| Zn | 2.80 | 0.66 |
| Cu | 13.92 | 3.40 |
| Total | 100 |
Fig. 2d–f shows the XRD patterns of Zn-BTC, Cu-BTC and Zn/Cu-BTC. The characteristic peaks at 2θ = 6.7°, 9.5°, 11.7° and 13.4° in Fig. 2f correspond to the (200), (220), (222) and (400) crystal planes of Cu-BTC;22 the characteristic peaks at 2θ = 8.5°, 10.8°, 13.5°, 18.3°, 19.2° and 23.7° in Fig. 2e correspond to the (111), (220), (222), (331), (420) and (333) crystal planes of Zn-BTC.23 Fig. 2d shows that bimetallic Zn/Cu-BTC has the same X-ray diffraction peaks as Cu-BTC (predominantly) and Zn-BTC, which is due to the fact that bimetallic MOF generally maintains the crystal structure of the parent material. Furthermore, the characteristic peak at 2θ = 12.8° in the XRD spectrum of Zn/Cu-BTC is unique, which suggests that a new lattice structure was generated in the bimetallic Zn/Cu-BTC, which could be derived from the heating melting and recrystallization of the mixture of Cu(NO3)2·3H2O and Zn(NO3)2·6H2O.
Fig. 3 shows the N2 adsorption isotherms and BJH (Barrett–Joyner–Halenda) pore size distributions of Zn-BTC, Cu-BTC and Zn/Cu-BTC. As shown in Fig. 3a, N2 adsorption by Zn-BTC is a type V isotherm. Due to the low specific surface area and small pore volume of the Zn-BTC pores, the interaction between MOF and adsorbed gas is relatively weak so that the amount of gas adsorbed is relatively low. In addition, with the increase in relative pressure, the gas adsorption tends to increase due to capillary coalescence and generates a hysteresis loop, which is manifested by the fact that the adsorption amount at desorption is larger than that at adsorption at the same relative pressure. In contrast, Cu-BTC and Zn/Cu-BTC possessed larger specific surface areas and pore volumes, as well as smaller average pore sizes (as indicated in Table 2). Both of them possess good N2 adsorption performance. The adsorption isotherms are Langmuir type, i.e., the adsorption amount of the gas rises rapidly at low pressure and the isotherm plateaus after reaching a certain value. This is due to the fact that the external surface area of the samples is much smaller than the internal surface area of the pores, and the gas adsorption is mainly controlled by the volume of the micropores; thus, the adsorption amount changes very little with the increase in gas pressure. In addition, the larger adsorption capacity of N2 for Cu-BTC compared to Zn/Cu-BTC is related to its relatively larger pore specific surface area and pore volume.
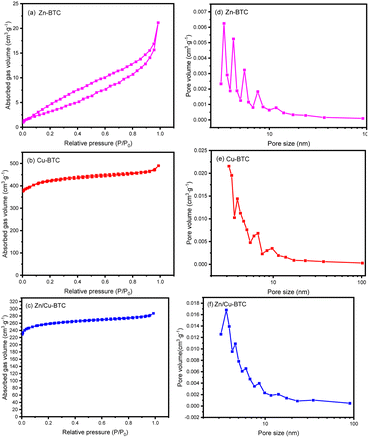 | ||
| Fig. 3 The N2 adsorption–desorption isotherms (a–c) and pore size distribution (d–f) of Zn-BTC, Cu-BTC and Zn/Cu-BTC. | ||
| Materials | BET surface area (m2 g−1) | Pore volume (cm3 g−1) | Average pore size (nm) |
|---|---|---|---|
| Zn-BTC | 14.06 | 0.04 | 9.31 |
| Cu-BTC | 1282.51 | 0.76 | 2.37 |
| Zn/Cu-BTC | 767.24 | 0.34 | 4.44 |
3.2 The thermal stability of Zn/Cu-BTC
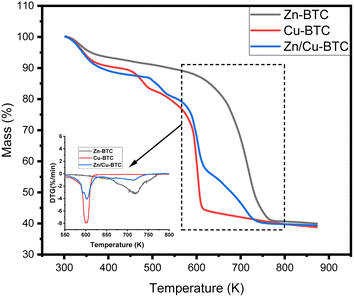
The thermogravimetric analysis (TGA) of Fig. 4 shows that Zn-BTC begins to decompose at temperatures higher than 600 K, where its thermal stability is the best. For Cu-BTC, when the temperature is lower than 450 K, its mass loss mainly originates from the evaporation of crystalline water with the increase in temperature; when the temperature rises to 450–500 K, the rapid decrease of mass mainly originates from the evaporation of solvent in the framework; when the temperature is higher than 550 K, Cu-BTC enters into rapid decomposition and reaches the fastest decomposition rate at 600 K. Finally, its crystalline structure is basically decomposed as the temperature rises to 610 K.In comparison, the solvent in the framework of Zn/Cu-BTC starts to evaporate only when the temperature is higher than 490 K, and it enters into rapid decomposition after the temperature is higher than 570 K. In addition, the decomposition process of Zn/Cu-BTC consists of two stages, one of which is the decomposition of the crystal structure formed by Cu2+ between 570 K and 620 K, and the other is the decomposition of the crystal structure formed by Zn2+ between 620 K and 730 K. Therefore, this indicates that Zn/Cu-BTC is stable at temperatures up to 490 K. This is due to the fact that the bimetallic MOF contains two types of metal active sites that enhance the stability of the backbone structure.24
3.3 CO2 adsorption by Zn/Cu-BTC
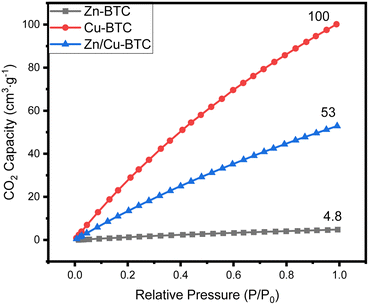
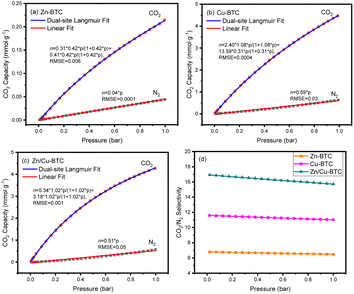
Fig. 3 shows the CO2 adsorption capacity of Zn/Cu-BTC, Cu-BTC and Zn-BTC at 298 K. Among the three MOFs, Zn-BTC has the lowest CO2 adsorption due to its small pore specific surface area and pore volume, while Cu-BTC has the highest CO2 adsorption, which is related to its large pore specific surface area and pore volume and numerous unsaturated metal ions active sites on the pore surface.25 For Zn/Cu-BTC, the CO2 capacity is one-half of that of Cu-BTC, but it is 11 times higher compared with that of Zn-BTC (Fig. 5). Therefore, it is inferred that the increase in CO2 adsorption by Zn/Cu-BTC is mainly attributed to the presence of Cu2+, which is constructed with Zn2+ to possess a bimetallic MOF with larger BET specific surface area and pore volume as well as more unsaturated metal active sites.Using Zn/Cu-BTC for the adsorption of CO2 in atmosphere, it is crucial to explore the adsorption selectivity for CO2/N2. Usually, the adsorption selectivity calculation of the two-component gas mixture in porous materials can be predicted using single-component gas adsorption isotherms based on IAST (Ideal Adsorbed Solution Theory).26,27 Herein, we utilized the pyGAPS (Python General Adsorption Processing Suite) software package28 to fit the adsorption isotherms of CO2 and N2 at 298 K, and the CO2/N2 gas mixture content was set to 1/9 (vol/vol). The N2 adsorption isotherms and the CO2 adsorption isotherms were fitted (Fig. 6a–c) by Henry's law (eqn (1)) and dual-site Langmuir model (eqn (2)), respectively.29
| ni(P) = KHP | (1) |
 | (2) |
The CO2/N2 selectivity curves (Fig. 6d) of Zn-BTC, Cu-BTC and Zn/Cu-BTC were generated directly using pyGAPS. As shown, the weak dependence of selectivity on pressure was observed for all the three MOFs. The maximum value of CO2/N2 selectivity were 6.8 for Zn-BTC and 11.6 for Cu-BTC. In particular, the CO2/N2 adsorption selectivity of Zn/Cu-BTC is higher than that of Zn-BTC and even Cu-BTC, with a maximum value of 17. It is speculated that the high CO2/N2 adsorption selectivity of Zn/Cu-BTC is the result of the combined effect of its specific topological structure and numerous unsaturated metal active sites. On the one hand, the morphology and pore structure of Zn/Cu-BTC are more conducive to CO2 adsorption and penetration into its interior; on the other hand, Zn/Cu-BTC has two metal centers, which have more diversified active sites and adsorption sites than monometallic MOFs, resulting in a higher CO2 adsorption selectivity.
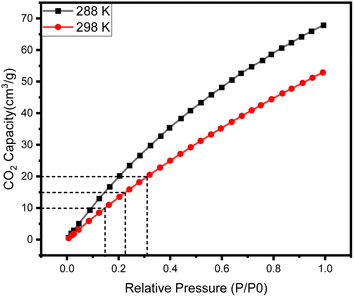
The heat of CO2 adsorption of Zn/Cu-BTC was calculated from CO2 adsorption isotherms measured at close temperatures (ΔT ≤ 10 K) using the finite difference of the thermodynamic Clausius–Clapeyron equation.30
| qst = R[T1T2/(T2 − T1)](ln(P2) − ln(P1))N | (3) |
4 Conclusions
In this study, we first dissolved a certain proportion of Cu(NO3)2·3H2O and Zn(NO3)2·6H2O and heated them to melt and then prepared a bimetallic MOF, Zn/Cu-BTC, by the solvothermal reaction with H3BTC. Finally, the thermal stability, pore structure and CO2 adsorption property were examined. The results showed that compared with the monometallic Zn-BTC and Cu-BTC, the bimetallic Zn/Cu-BTC had specific crystal morphology and crystal structure, the presence of bimetallic centres increased the specific surface area and pore volume of MOF and improved the gas adsorption performance as well as the thermal stability. The CO2 adsorption capacity of Zn/Cu-BTC was lower than that of Cu-BTC but 11 times higher than that of Zn-BTC, and its CO2 adsorption heat was 30.52 kJ mol−1, which was through physical adsorption. In addition, the CO2/N2 adsorption selectivity of Zn/Cu-BTC was higher than that of Zn-BTC and Cu-BTC.Data availability
All relevant data are within the paper.Author contributions
Jin Zhang: methodology, formal analysis. Yifei Yang: validation, resources, investigation. Jianguo Zhao: methodology, funding acquisition. Yunpeng Ren: validation, resources, investigation. Jiahao Liu: validation, resources, investigation, methodology. Shijie Li: writing – review & editing, validation, methodology, investigation, formal analysis, data curation. Xinyu Li: writing – review & editing, writing – original draft, validation, methodology, formal analysis, data curation, conceptualization.Conflicts of interest
The authors have declared that no competing interest exists.Acknowledgements
This work was supported by the Engineering Research Centre of Coal-based Ecological Carbon Sequestration Technology of the Ministry of Education, the Scientific and Technological Innovation Programs of Higher Education Institutions in Shanxi (STIP, 2021L383).References
- D. M. D'Alessandro and T. McDonald, Pure Appl. Chem., 2010, 83, 57–66 Search PubMed.
- R. J. K. Jian-Rong Li and H.-C. Zhou, Chem. Soc. Rev., 2009, 38, 1477–1504 RSC.
- X. Duan, H. Wang, Z. Ji, Y. Cui, Y. Yang and G. Qian, J. Solid State Chem., 2016, 241, 152–156 CAS.
- H. A. Ozen and B. Ozturk, Sep. Purif. Technol., 2019, 211, 514–521 CrossRef.
- G. Orcajo, H. Montes-Andres, J. A. Villajos, C. Martos, J. A. Batas and G. Calleja, Int. J. Hydrogen Energy, 2018, 44, 19285–19293 CrossRef.
- N. L. Rosi, J. Eckert, M. Eddaoudi, D. T. Vodak, J. Kim, M. O'Keeffe and O. M. Yaghi, Science, 2003, 300, 1127–1129 CrossRef CAS PubMed.
- R. V. Morris, S. W. Ruff, R. Gellert, D. W. Ming, R. E. Arvidson, B. C. Clark, D. C. Golden, K. Siebach, G. Klingelhoefer and C. Schroeder, Science, 2010, 329, 424–428 CrossRef PubMed.
- H.-C. J. Zhou and S. Kitagawa, Chem. Soc. Rev., 2014, 43, 5415–5418 RSC.
- H.-C. Zhou, J. R. Long and O. M. Yaghi, Chem. Rev., 2012, 112, 673–674 CrossRef CAS PubMed.
- H. Demir, G. O. Aksu, H. C. Gulbalkan and S. Keskin, Carbon Capture Sci. Technol., 2022, 2, 100026 CrossRef CAS.
- M. Zhao, Y. Yang and X.-S. Gu, Inorg. Chem. Commun., 2023, 152, 110722 CrossRef CAS.
- T. Ghanbari, F. Abnisa and W. M. A. Wan Daud, Sci. Total Environ., 2020, 707, 135090 CrossRef CAS PubMed.
- N. A. A. Qasem, R. Ben-Mansour and M. A. Habib, Appl. Energy, 2018, 210, 317–326 CrossRef CAS.
- H.-Y. Cho, D.-A. Yang, J. Kim, S.-Y. Jeong and W.-S. Ahn, Catal. Today, 2012, 185, 35–40 CrossRef CAS.
- C. Chen, X. Feng, Q. Zhu, R. Dong, R. Yang, Y. Cheng and C. He, Inorg. Chem., 2019, 58, 2717–2728 CrossRef CAS PubMed.
- F. Bai, Y. Xia, B. Chen, H. Su and Y. Zhu, Carbon, 2014, 79, 213–226 CrossRef CAS.
- V. Neubertová, V. Švorčík and Z. Kolská, Microporous Mesoporous Mater., 2024, 366, 112956 CrossRef.
- L. Chen, H. F. Wang, C. Li and Q. Xu, Chem. Sci., 2020, 11, 5369–5403 RSC.
- Z. Zhou, L. Mei, C. Ma, F. Xu, J. Xiao, Q. Xia and Z. Li, Chem. Eng. Sci., 2016, 147, 109–117 CrossRef CAS.
- M. W. Kadi, H. M. A. E. Salam, T. Zaki and R. M. Mohamed, J. Nanopart. Res., 2020, 22, 143–153 CrossRef CAS.
- J. Ling, A. Zhou, W. Wang, X. Jia, M. Ma and Y. Li, ACS Omega, 2022, 7, 19920–19929 CrossRef CAS PubMed.
- K.-S. Lin, A. Adhikari, C.-N. Ku, C. L. Chiang and H. Kuo, Int. J. Hydrogen Energy, 2012, 37, 13865–13871 CrossRef CAS.
- X. Wang, X. Ma, H. Wang, P. Huang, X. Du and X. Lu, Microchim. Acta, 2017, 184, 3681–3687 CrossRef CAS.
- X. Song, M. Oh and M. S. Lah, Inorg. Chem., 2013, 52, 10869–10876 CrossRef CAS PubMed.
- A. Vishnyakov, P. I. Ravikovitch, A. V. Neimark, M. Bulow and Q. M. Wang, Nano Lett., 2003, 3, 713–718 CrossRef CAS.
- L. Rao, R. Ma, S. Liu, L. Wang and X. Hu, Chem. Eng. J., 2019, 362, 794–801 CrossRef CAS.
- A. L. Myers and J. M. Prausnitz, AIChE J., 1965, 11, 121–127 CrossRef CAS.
- C. M. Simon, B. Smit and M. Haranczyk, Comput. Phys. Commun., 2016, 200, 364–380 CrossRef CAS.
- P. Iacomi and P. L. Llewellyn, Adsorption, 2019, 25, 1533–1542 CrossRef CAS.
- R. T. Cimino, P. Kowalczyk, P. I. Ravikovitch and A. V. Neimark, Langmuir, 2017, 33, 1769–1779 CrossRef CAS PubMed.
| This journal is © The Royal Society of Chemistry 2024 |

