 Open Access Article
Breaking graphite through a ball-milling process: the thermal conductivity and mechanical properties of polyethylene composites†
Yuan Liua,
Jimin Zhanga,
Xianhong Wangb,
Yingchun Liuc,
Xiuli Hu a,
Chaochao Cao*a,
Xiongwei Qu
 *a and
Beckry Abdel-Magidd
aHebei Key Laboratory of Functional Polymers, School of Chemical Engineering, Hebei University of Technology, Tianjin 300130, China. E-mail: xwqu@hebut.edu.cn; 2022911@hebut.edu.cn
bTianjin Key Laboratory of New Materials and Systems for HVAC Plumbing, Tianjin 300400, China
cJinghua Plastics Co. Ltd, Langfang 065800, China
dDepartment of Composite Materials Engineering, Winona State University, Winona, MN 55987, USA
First published on 2nd September 2024
Abstract
Exfoliated graphite platelets (EGPs) have attracted extensive attention owing to their exceptional combinations of thermal conductivity and mechanical properties. Mechanical exfoliation is a facile and high-throughput approach to produce single-layer or few-layer graphite platelets. Herein, octadecylamine (ODA)-grafted EGP (ODA@EGP) and subsequent polyethylene/ODA@EGP (PE/ODA@EGP) composites with different contents of ODA@EGPs were successfully prepared via ball-milling and melt-mixing methods, respectively. The thermal conductivity, crystallinity, and mechanical properties of the composites were investigated using tensile tests, the hot-wire method, differential scanning calorimetry (DSC), scanning electron microscopy (SEM), X-ray diffraction (XRD) analysis, and thermogravimetric analysis (TGA). The results demonstrated that the thermal conductivity, mechanical properties, and thermal stability of the composites can be improved by regulating the additive contents of ODA@EGPs. When the content of ODA@EGPs was 10 wt%, the thermal conductivity of the composite reached up to 1.276 W (m−1 K−1), which is 216% higher than that of bare PE, while the tensile strength of the composite was 38.4% higher than that of PE. Additionally, thermal decomposition temperature increased by 16.2 °C. Therefore, the PE/ODA@EGP nanocomposites have great application potential in thermal management.
1. Introduction
Thermally conductive materials have been widely used in national economy and special defense.1 The continuous development of society has put forward more stringent requirements for these materials. Traditional heat conductive materials have limited applications in some fields considering their poor corrosion resistance, tedious forming processes, and high density. Thermally conductive plastics are considered a type of ideal material that can replace traditional heat conductive materials for more severe thermal conditions because of their light weight, excellent chemical resistance, and good processing performance.2 Polyethylene (PE) has many excellent properties, such as being economical, processability and chemical corrosion resistance. It is widely used in cold and hot water pipes, agricultural films, food packaging, and other fields. Nevertheless, PE has low thermal conductivity, which limits its use in thermally conductive materials.To improve the heat conduction performance of PE through certain processes or methods, several strategies have been proposed, such as the incorporation of thermally conductive fillers. Common fillers include carbon materials (such as graphite,3,4 graphene,5 and carbon fibers6), inorganic thermal particles,7,8 and metal particles.9 Graphene is a two-dimensional nano-carbon material with excellent combination properties, such as an exceptional thermal conductivity of 5300 W (m−1 K−1), Young's modulus of 1000 GPa, and breaking strength of 130 GPa.10 However, the large-scale production of graphene at low cost and high quality is still challenging using conventional production technologies.11 Exfoliated graphite platelets (EGPs), formed by some graphene layers aggregated together through van der Waals forces, are a potential substitute for graphene because of their excellent physicochemical properties and low manufacturing cost.12 Adding EGPs as a thermal conducting filler to polymers can effectively improve the thermal and mechanical properties of the polymers. For example, Zhang13 et al. prepared an ionic liquid-functionalized EGP via a one-step ultrasonication process. The thermal conductivity of the composite was 0.18 W (m−1 K−1), which was 50.0% higher than that of pure PI when the amount of EGP was 0.3 wt%. In addition, it could maintain good mechanical properties, and its tensile strength (121.5 MPa) was 6.5% higher than that of pure PI. Lin14 et al. reported an improvement in the thermal conductivity of poly (lactic acid) (PLA)-based nanocomposites by doping tannic acid-functionalized nanographite flakes. When the filler content was increased to 20 wt%, the thermal conductivity of the TA-GNPs/PLA composites was improved by 188% over the PLA polymer matrix. Hazarika et al.15 fabricated a sulfonated polystyrene/EGP composite by a solution blending method. When the EGP mass fraction was 7%, the modulus of the composite was increased by 90%, and the thermodynamic stability of the composite was also improved. Ding et al.16 prepared a polystyrene/EGP composite by a hot-pressing method. When the EGP mass fraction was 10 wt%, the thermal conductivity of the polystyrene increased from 0.147 to 0.224 W (m−1 K−1). However, systematic studies on the mechanical and thermal properties of EGP-filled PE remain scarce.17 Therefore, it is necessary to clarify the effect of EGP on the mechanical and thermal properties of PE composites.
Based on the previous research results, there is no report on using octadecylamine (ODA) as a modifier to modify graphite. Consequently, we developed a method to prepare ODA@EGP by a ball-milling exfoliation of graphite (GP) with ODA as a modifier in a one-step process, and then prepared PE/ODA@EGP composites by a melt blending technique using ODA@EGP as a thermally conductive filler. The results showed that the lateral dimensions of the ODA@EGP decreased, the thickness became thinner, and more importantly, the thermal conductivity, tensile strength, and thermal stability of the PE/ODA@EGP composites increased with the increasing amount of filler. When the amount of filler was 10 wt%, the thermal conductivity could reach up to 1.276 W (m−1 K−1), which was 216% higher than that of pure PE, and the maximum tensile strength was 21.74 MPa, which was 38.4% higher than that of the pure PE matrix. Also, the thermal decomposition temperature increased from 425.6–441.8 °C. The findings demonstrate that the PE/ODA@EGP nanocomposites have great potential for use in thermal management applications.
2. Experimental section
2.1 Materials
Table 1.| Materials | Level | Usage |
|---|---|---|
| Graphite platelet (GP) | AR | Use after drying |
| Octadecylamine (ODA) | CP | Direct use |
| Polyethylene (PE) | Industrial product | Use after drying |
2.2 Fabrication of ODA@EGP by ball-milling
ODA@EGP was produced using a planetary ball mill in the presence of ODA. Here, GP (15.0 g) and ODA (15.0 g) were put into a stainless steel capsule (3 L) with wear-resistant zirconium dioxide balls inside (diameter 3 mm, 5 mm, and 8 mm in a weight ratio of 1![[thin space (1/6-em)]](https://www.rsc.org/images/entities/char_2009.gif) :
:![[thin space (1/6-em)]](https://www.rsc.org/images/entities/char_2009.gif) 2
2![[thin space (1/6-em)]](https://www.rsc.org/images/entities/char_2009.gif) :
:![[thin space (1/6-em)]](https://www.rsc.org/images/entities/char_2009.gif) 1). The ball-milling conditions were: 300 rpm for 5 h, with setting aside for 5 min every 30 min to prevent overheating. The resulting powders were filtered and then washed with ethanol and deionized water five times, respectively, and finally dried in a cryogenic drying oven to obtain the ODA@EGP products.
1). The ball-milling conditions were: 300 rpm for 5 h, with setting aside for 5 min every 30 min to prevent overheating. The resulting powders were filtered and then washed with ethanol and deionized water five times, respectively, and finally dried in a cryogenic drying oven to obtain the ODA@EGP products.
2.3 Preparation of PE/ODA@EGP composites
First, PE and ODA@EGP were dried in a vacuum oven at 60 °C for 12 h. After that, PE/ODA@EGP composites were prepared by mixing PE and ODA@EGP with different weight ratios in a HAAKE rotary rheometer at 170 °C and 80 rpm for 15 min. The ODA@EGP contents were 2%, 4%, 6%, 8%, and 10%, respectively. In order to ensure a consistent product quality, the obtained product was dried in a vacuum oven at 60 °C for 12 h. Note, if the water content in the preparation process is too high, silver filaments and air bubbles may appear on the surface of the composite. Next, the obtained composites were hot-pressed in a flat vulcanizing machine. The pressure of the plate vulcanizer was set at 5 MPa, and the hot-pressing temperature was 180 °C. After preheating for 10 min and hot pressing for 10 min, the composite was taken out and cooled to room temperature. Finally, PE/ODA@EGP composites were obtained. For comparison, samples of PE and PE/GP composites were prepared using the same process.2.4 Characterizations
The micro-morphologies of the ODA@EGP and the PE/ODA@EGP composites were characterized by scanning electron microscopy (Nova Nano SEM450). The MiniFlex-600 X-ray diffractometer (Japan Rigaku Co., Ltd) was used to test the ODA@EGP and PE/ODA@EGP composites with different ODA@EGP contents. The scanning rate was 6° min−1, and the scanning range was 10–60°. An InVia Reflex laser micro Raman spectrometer from Renishaw UK was used to test the ODA@EGP. A He–Ne laser was used as the excitation source with a wavelength (λ) of 532 nm. A Vector-22 Fourier transform infrared spectrometry device (FTIR, Bruker, Germany) was used to characterize the ODA@EGP samples. A Q-600 synchronous thermal analyzer (TGA, TA Instruments) was used to test the ODA@EGP and its composites. The temperature was 10 °C min−1 in a nitrogen atmosphere flow. A TC-3000 hot-wire solid thermal analysis tester from Xiaxi Electronic Technology Co., Ltd was used to measure the thermal conductivity of the composites filled with different ODA@EGP contents. The samples were tested 5 times at 25 °C and then the results were averaged. The tensile strength of the composites was tested according to the GB/T1040.2-2006 standard on a CMT-6104 universal testing machine from Shenzhen Xinsan Metrology Co., Ltd. The tensile rate was 20 mm min−1. The samples were placed at 23 ± 1 °C and 50 ± 5% relative humidity for 24 h. Five replicates were used in each tensile test. The melt crystallization properties of the PE/ODA@EGP composites were measured using a Q-20 differential crystallization calorimetry system (DSC). Measurements were carried out with 5–10 mg samples in a N2 flow. First, the samples were rapidly heated to 200 °C at a heating rate of 50 °C min−1, and held there for 3 min to eliminate the thermal history. Then, the samples were cooled at a rate of 10 °C min−1 to 40 °C and kept there for 3 min. Finally, the samples were scanned from 40–200 °C at a heating rate of 10 °C min−1. The crystallization parameters for each sample were obtained from the cooling and reheating DSC curves, respectively. The crystallinity (χc) of the sample was calculated according to the following formula:
 | (1) |
3. Results and discussion
3.1 Structural characterization of the ODA@EGP and its composites
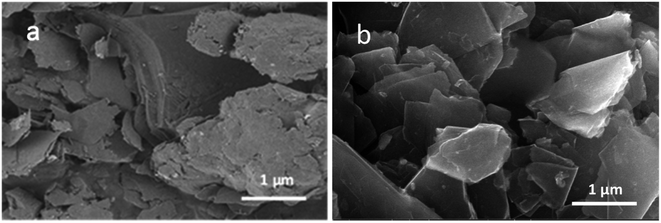
ODA@EGP was prepared by a ball-milling approach (Fig. S1†). First, the mechanical force of the planetary ball mill was utilized to synchronize the exfoliating and surface modification of GP, aiming to reduce the number of graphite flakes using ODA as the exfoliating additive. The surface graft-modified ODA@EGP increased the interfacial bonding between the ODA and PE matrix through the interaction of ODA and PE, and improved its compatibility with the PE matrix. The thermal conductivity and mechanical properties of the resulting composites were significantly improved by melt blending ODA@EGP with PE in the HAAKE system followed by hot pressing.Experimentally, zirconia ball beads with different ball diameters were selected. The tangential friction and lateral self-lubrication of graphite were developed when the ball beads with different particle diameters were rotated at high speed. In the presence of ODA, the scaled GP was mechanically exfoliated by planetary ball-milling. In the process of GP flake peeling, the layers of GP and the transverse size were decreased. The chemical bonds between the carbon atoms on the cross-section of the newly formed GP were interrupted by the interaction between the ball-milled beads and GP to form active carbon atoms. The active carbon atoms interacted with ODA molecules in the system. The surface modification of the graphite flakes could prevent the newly peeled GP from repacking and could improve the interface interactions with the polymer matrix. The SEM micrographs of ODA@EGP and GP are presented in Fig. 1, showing the original GP had a large longitudinal size and staggered stacking of graphite particles with different particle sizes owing to their high surface energy.19 Moreover, it can be seen that the original GP had a compact lamellar structure and was an opaque and scaly solid. As shown in Fig. 1(b), a clear and transparent GP structure appeared after ball-milling the ODA@EGP samples, which was caused by the shear peeling effect on GP during collision with the high-speed ball-milling beads. The thinner GP showed a higher electronic transparency in the SEM image. In the presence of ODA, the ball-milling process leads to peeling of the GP, resulting in thinner and stable few-layer GP flakes.
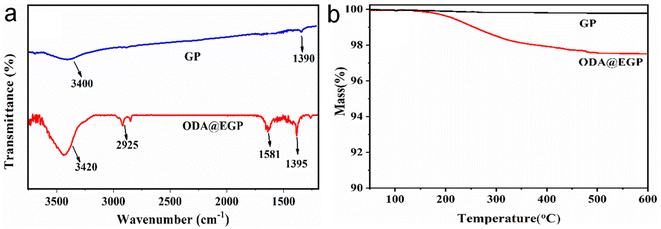
To analyze the changes in the chemical compositions of GP caused by ball-milling, FTIR spectroscopy and synchronous thermal analysis were carried out. Fig. 2(a) shows the FTIR spectra of GP and ODA@EGP. From the FTIR spectrum of GP, a characteristic peak at 3400 cm−1 could be observed, attributed to O–H coupling stretching vibration; also, there was a peak at 1390 cm−1, ascribed to the bending vibrations of O–H bonds, and a peak at 3420 cm−1, attributed to the characteristic absorption of –NH2 groups on the edge or surfaces of ODA@EGP. Further, peaks could be observed at 1395 and 1581 cm−1, attributed to C–N stretching, and N–H vibrations assigned to the –NH2 groups of ODA,16 and a peak at approximately 2925 cm−1, which was due to alkyl (C–H) stretch vibrations. These results confirmed that the surface of ODA@EGP was grafted by ODA. Thermogravimetric analysis was next carried out to assess the content of ODA grafted on ODA@EGP. Fig. 2(b) shows the TGA curves of ODA@EGP in a N2 flow. It could be seen that the weight loss curve of GP remained unchanged with the increase in temperature, suggesting that the GP had high thermal stability and no obvious thermal decomposition occurred, even at 600 °C. However, the ODA@EGP sample showed a mass loss of about 2.7 wt% when the temperature reached 600 °C. This mass loss of ODA grafted on the GP was due to the decomposition of amino groups on the surface of the exfoliated GP. The results confirmed that ODA was chemically grafted onto the surface of GP.
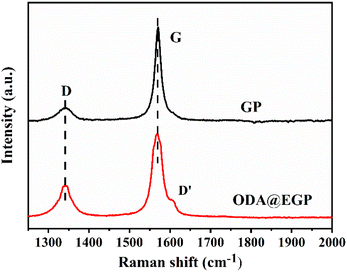
Besides, Raman spectra were also recorded and analyzed. Fig. 3 presents the Raman spectra of GP and ODA@EGP under 532 nm laser excitation. The G band of the ODA@EGP at 1585 cm−1 corresponded to a symmetric vibration E2g phonon in the Brillouin zone center, while the D band at 1355 cm−1 was related to the breathing modes of the six-atom rings and requires defects for its activation.20 As shown in Fig. 3, the D band strength of the GP sample was relatively small, while the G band was strong and sharp, indicating that the ordered degree of GP was very high. After ball-milling and peeling, the intensity of the D band in the Raman spectrum of the ODA@EGP sample obviously increased, and a D′ band appears on the shoulder of the G band. Also, the D band and G band were obviously widened, indicating that the symmetry vibration of graphite carbon atom was affected, while the disorder degree of the graphite increased, and the defect and disorder degree of the ODA@EGP sample increased. These changes were mainly due to the decrease in thickness of the graphite sheet during ball-milling and the surface modification of the GP.
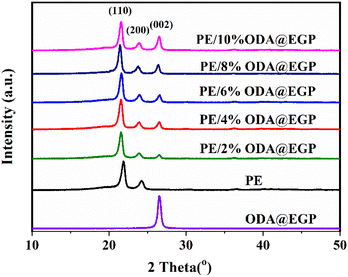
The crystal structures of the ODA@EGP, PE, and PE/ODA@EGP composites were studied. As shown in Fig. 4, the XRD pattern of ODA@EGP showed a graphite (002) diffraction peak at the 2θ value of 26.6°. The strong reflection peak at 26.6° indicated the good crystal structure, which could suggest its excellent thermal properties. The grain size of the (002) crystal plane was calculated according to Scherrer's equation,21 and the grain size perpendicular to the crystal plane was found to be 16.64 nm. In addition, two strong peaks at 2θ = 21.4° and 2θ = 23.8°, corresponding to the (110) and (200) reflection peaks of the orthorhombic phase of PE, could be clearly seen in the XRD pattern of PE. The peaks in the XRD pattern of the PE/ODA@EGP composites were superpositions of the peaks occurring in PE and ODA@EGP. The intensity of the peaks at (110) and (200) did not change much with the increase in ODA@EGP loading, while the intensity of the peak at (002) increased. A similar trend was observed by Wang22 and Sever,23 demonstrating that the crystal structure of the PE matrix was not affected by the addition of the ODA@EGP.
3.2 Thermal properties of the PE/ODA@EGP composites
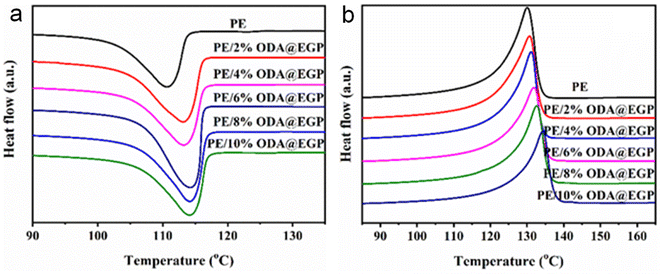
The crystallinity of a composite is an important factor affecting its thermal conductivity and mechanical properties. It was therefore of great application value to study the effect of different fillers on the crystallinity of the composites. Fig. 5 and S2† show the DSC curves of the composites of ODA@EGP and GP with different filler amounts. The crystallization parameters of the PE, PE/ODA@EGP, and PE/GP composites are listed in Tables 2 and S1,† respectively. It can be seen that the crystallization and melting temperatures of both composites gradually increased with the increase in the amount of filler. The crystallization and melting temperature of the composite gradually increased with the addition of ODA@EGP, while the crystallinity increased first and then decreased with the addition of ODA@EGP. This indicates that the addition of ODA@EGP provided crystallization sites for the PE matrix, and ODA@EGP played the role of a nucleating agent in the crystallization of PE, which is conducive to the formation of crystallization. Therefore, the composite could crystallize at a higher temperature. With the increase in ODA@EGP to a certain amount, the crystallinity of the composite began to decline, which illustrates that the addition of ODA@EGP formed more interfaces with the matrix, thus limiting the crystal space of the matrix and reducing the crystallinities of the composites.24,25 In addition, the crystallinity of all the PE/ODA@EGP composites was higher than that of PE/GP for the same amount of filler, which may be attributed to the interaction of ODA@EGP with the matrix PE, resulting in a more regular arrangement in the matrix, which also corresponded to an improvement in the thermal conductivity.| Sample | Tc (°C) | Tm (°C) | χc (%) | T5 (°C) | T50 (°C) |
|---|---|---|---|---|---|
| PE | 110.67 | 132.41 | 40.96 | 425.6 | 466.8 |
| PE/2 wt% ODA@EGP | 113.16 | 126.13 | 46.36 | 430.1 | 471.1 |
| PE/4 wt% ODA@EGP | 113.24 | 126.19 | 46.84 | 436.9 | 474.6 |
| PE/6 wt% ODA@EGP | 113.35 | 126.21 | 47.60 | 440.2 | 478.2 |
| PE/8 wt% ODA@EGP | 113.51 | 126.46 | 46.75 | 440.6 | 481.7 |
| PE/10 wt% ODA@EGP | 113.88 | 126.58 | 46.52 | 441.8 | 485.8 |
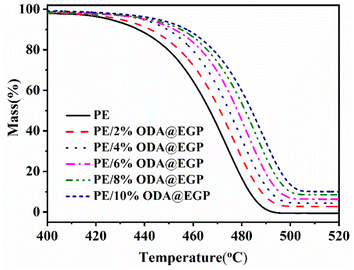
In practical applications, the thermal stability of polymer composites is another important factor. Increasing the heat-resistant temperature of a material is more conducive to expanding its use range. Fig. 6 shows the thermogravimetric analysis curves of the PE/ODA@EGP composites filled with different ODA@EGP mass fractions in a N2 atmosphere. As shown in Fig. 6, the carbon residual mass of the composite increased with the increase in ODA@EGP content. The corresponding TGA data, such as the temperature corresponding to a 5 wt% weight loss (T5) and 50 wt% weight loss (T50), are shown in Table 2. The T5 and T50 of the composite gradually increased with the increase in the ODA@EGP content. The same trend was observed for the T5 and T50 of the composites when GP was used as a filler (Fig. S3 and Table S1†). This phenomenon indicates that the two fillers could improve the thermal stability of the composites to a certain extent. Comparisons of Tables 2 and S1† show that the T5 and T50 of the PE/ODA@EGP composites were higher than those of PE/GP with the same filler amount. This was due to the high heat capacity of ODA@EGP, which stores heat and hinders the diffusion of decomposing materials in the composite.26 Furthermore, the surface modification of ODA@EGP increased the interface combination with the matrix, and the movement of PE molecular segments was limited during the heating process, improving the thermal stability of the composites.
Fig. 7 shows the curves for the thermal conductivity and thermal enhancement rate of PE/GP composites with different amounts of both fillers. It is easy to see that with the increase in filler content, the thermal conductivity of the composites was improved, and when the filler addition was less, the filler was in the form of “islands” dispersed in the matrix, which meant a favorable heat-transfer pathway could not be formed, and so the thermal conductivity was low. With the gradual increase in the addition of fillers, the fillers existing in isolation in the matrix gradually contact each other to form a thermally conductive chain and eventually form a relatively perfect heat-transfer network, so that the thermal conductivity of the composites is improved. When the content of ODA@EGP was 10%, the thermal conductivity of the composite was 1.276 W (m−1 K−1), which was 216% higher than that of the pure PE. While adding the same mass fraction of GP, the thermal conductivity of the composite was only 0.7126 W (m−1 K−1). At the same addition amount, the thermal conductivity of the ODA@EGP-filled composites was better than that of the GP-filled ones, which shows that the addition of ODA@EGP could more obviously improve the thermal conductivity of the PE composites, which was mainly due to the dispersion of fillers in the matrix and the compatibility of the fillers with the matrix. According to the theory of heat conduction paths,27 when heat flow propagates through composites, phonons will preferentially propagate in the heat conduction network with the lowest thermal resistance. In polymer composite systems, the large surface area of the particles maximizes the polymer/particle interfacial area. ODA@EGP showed improved compatibility with PE due to the surface grafting of the alkyl chain ODA, which has a similar structure to the PE molecular chain, thus hindering the agglomeration phenomenon that occurs when the filler is dispersed in the matrix. The filler can effectively reduce the interfacial thermal resistance and enhance the interfacial heat-transfer efficiency through filling the gaps on the contact surface of the polymer and thus increases the actual contact area.28,29 In addition, the number of contact points between the particles in the percolation network increases as the particle size decreases.30 The ODA@EGP obtained here by ball-milling treatment had a smaller particle size compared to the original GP, leading to an increase in the number of contact points between the particles, thus increasing the actual contact area and reducing the interfacial thermal resistance. Therefore, it is reasonable to believe that the interfaces play an important role in the thermal conductivity of composites. Meanwhile, covalent bonds can benefit phonon transfer between the graphite and the polymer matrix,31,32 while the increase in the crystallinity of PE could also improve the thermal conductivity of the composites (Table 2).33 Therefore, the preferential conduction of thermal energy along the particles forming a percolating network is the basic idea behind the use of highly conductive and high aspect ratio particles such as ODA@EGPs. Effective phononic conduction requires geometrically regular and strong bonds, and a good crystallinity of macromolecules, i.e., the packing of polymer chains in crystal lattice structures. The presence and features of the crystalline structure could be expected to strongly influence heat transfer in both the polymer phase and at the interface between the ODA@EGPs and matrix polymer.34–36
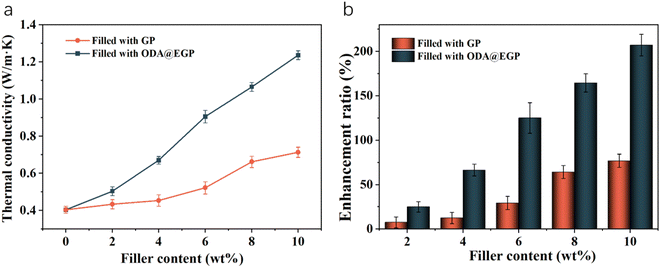 | ||
| Fig. 7 (a) Thermal conductivity and (b) enhancement ratio of the PE/GP composites with different GP contents. | ||
3.3 Mechanical properties and morphology of the PE/ODA@EGP composites
Encouraged by the change in thermal conductivity after adding GP to the PE matrix, we considered it would be of great practical significance to study the effect of GP content on the mechanical properties of the composites. Based on the fact that the modulus of elasticity = stress/strain in the range of elastic strain intervals, we calculated the data for the modulus of elasticity (Table 3) based on the stress–strain curves in the range of the elastic intervals (Fig. S4†). The tensile strength and elongation at break of the GP- and ODA@EGP-filled composites are shown in Table 3. It was found that the tensile strength of the PE/GP composites increased and then decreased with the increase in filler amount, the tensile strength of the PE/ODA@EGP composites increased, and the elongation at break of both composites decreased gradually with the increase in filler amount. When the ODA@EGP mass fraction was 10 wt%, the tensile strength of the PE/ODA@EGP composites reached a maximum of 21.74 MPa, which was 38.4% higher than that of pure PE, and the elongation at break was 390%, while it was only 343% for the graphite-filled composites. Also, the modulus of elasticity of the composites increased with the increase in the amount of ODA@EGP filler; that is, the stiffness of the composites increased. These results show that ODA@EGP had a better reinforcing effect on the composites compared to GP. On the one hand, this was due to the fact that ODA@EGP was uniformly dispersed in the matrix, which facilitates the transfer of stress in the composites. On the other hand, the surface graft-modified ODA@EGP showed increased interfacial bonding with the PE matrix through the interaction between ODA and PE, thereby improving the compatibility with the PE matrix, enhancing the transfer of stress at the interface, and effectively attenuating the stress concentration caused by the filling of ODA@EGP.37 Thus, the surface-modified ODA@EGP had a limiting effect on the movement of PE molecular chains, and played a good role in strengthening the composite.38–40| Sample | Tensile strength/MPa | Elongation at break/% | Elastic modulus/×106 Pa |
|---|---|---|---|
| PE | 15.90 ± 0.35 | 896 ± 25 | 68.7 |
| PE/2 wt% ODA@EGP | 17.13 ± 0.45 | 782 ± 29 | 81.0 |
| PE/4 wt% ODA@EGP | 19.29 ± 0.54 | 679 ± 38 | 93.6 |
| PE/6 wt% ODA@EGP | 20.53 ± 0.27 | 548 ± 29 | 94.3 |
| PE/8 wt% ODA@EGP | 21.37 ± 0.41 | 480 ± 40 | 98.3 |
| PE/10 wt% ODA@EGP | 21.74 ± 0.38 | 390 ± 35 | 105.5 |
| PE/2 wt% GP | 16.08 ± 0.23 | 726 ± 30 | 90.7 |
| PE/4 wt% GP | 16.54 ± 0.42 | 648 ± 48 | 100.5 |
| PE/6 wt% GP | 17.16 ± 0.26 | 517 ± 34 | 119.7 |
| PE/8 wt% GP | 18.21 ± 0.33 | 435 ± 28 | 125.9 |
| PE/10 wt% GP | 17.83 ± 0.22 | 343 ± 39 | 130.4 |
Additionally, the dispersion of ODA@EGP was an important factor affecting the properties of the PE/ODA@EGP composites. In order to observe the distribution of fillers in the PE matrix, the frozen fracture surfaces of the prepared composite samples were observed by SEM. Fig. 8 shows the microstructures of the low-temperature fracture surfaces of the PE and PE/ODA@EGP composites with different ODA@EGP contents. The surface of pure PE was smooth and free of impurities, as shown in Fig. 8. Since ODA@EGP has good electron transparency, it could be easily seen that the transparency of ODA@EGP in the PE matrix gradually increased with the increase in ODA@EGP content. At low filler levels, ODA@EGP was dispersed in the matrix in isolation and was not uniformly dispersed. With the increase in filler content, ODA@EGP gradually contacted each other to form a network structure and became dispersed more uniformly in PE, and the close bonding between ODA@EGP and the PE matrix showed good compatibility, which promoted an improvement in the thermal conductivity of the composites. Furthermore, due to the absorption of energy during the material deforming and breaking, the micro-surfaces of the frozen fracture surface of the composites were raised with increasing the ODA@EGP content, which is conducive to the improvement of the mechanical properties of the materials. The variation of torque with time also reflected the variation of the material homogeneity during the co-mingling process.41 In the plasticization curve, since the material had not reached the molten state for some time after the filler addition, the extrusion of the granular material against the rotor led to an initial rise in torque, which quickly reached its maximum value. With the prolongation of time, the material became in a molten state, so that the material torque decreased gradually, and finally reached the equilibrium torque. As can be seen in Fig. S5,† the PE/ODA@EGP composites were well-mixed after 2 min of raw material mixing, which is consistent with the results observed by SEM.
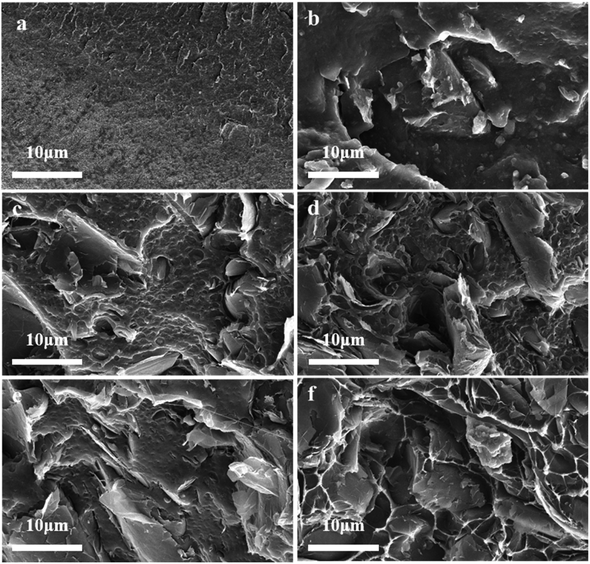 | ||
| Fig. 8 SEM images of the frozen fracture surfaces of the composites with different ODA@EGP contents: (a) 0 wt%, (b) 2 wt%, (c) 4 wt%, (d) 6 wt%, (e) 8 wt%, and (f) 10 wt%. | ||
4. Conclusions
In conclusion, the simultaneous exfoliation and functionalization of few-layer graphite platelets were achieved via an ODA-assisted mechanochemical ball-milling approach. The morphology and structure of ODA@EGP were analyzed systematically. Compared with the original GP, the average transverse dimension of ODA@EGP decreased and the thickness of ODA@EGP was lower. A kind of PE/ODA@EGP composites with enhanced thermal conductivity and mechanical properties was prepared by a melt blending technique. The crystal structure of PE showed few changes after ODA@EGP filling. When the filling amount was low, ODA@EGP could provide crystallization sites, which was helpful for the formation of PE crystals. The addition of ODA@EGP played the role of a nucleating agent, which accelerated the crystallization process of the PE matrix at higher temperature. The thermal conductivity and thermal stability of the PE/ODA@EGP composite increased with the increase in ODA@EGP content. When the ODA@EGP content was 10%, the thermal conductivity reached 1.276 W (m−1 K−1), which was 216% higher than that of the PE matrix. The thermal decomposition temperature increased from 425.6–441.8 °C. With the increase in ODA@EGP content, the tensile strength of the PE/ODA@EGP composite increased while the elongation at break decreased. When the ODA@EGP content reached 10 wt%, the maximum tensile strength was 21.74 MPa, which was 38.4% higher than that of the pure PE matrix. Therefore, the PE/ODA@EGP nanocomposites demonstrated great potential for thermal management applications.Data availability
The data supporting this article have been included as part of the ESI.†Author contributions
Yuan Liu: conceptualization, writing – original draft, formal analysis, data curation; Jimin Zhang: conceptualization, data curation; Xianhong Wang: supervision; Yingchun Liu: supervision; Chaochao Cao: writing – review & editing; Xiongwei Qu: conceptualization, funding acquisition; Beckry Abdel-Magid: writing – review & editing; all authors reviewed the manuscript.Conflicts of interest
The authors declare no competing interests.Acknowledgements
This research was funded by the National Natural Science Foundation of China (contract no. U20A20260) and Natural Science Foundation of Hebei Province (contract no. E2016202036).References
- C. Cao, J. Yang, S. Yang, S. Yan, C. Liu, D. Wang, Y. Xue, X. Qu and C. Tang, Small, 2024, 2401387 CrossRef PubMed.
- X. Wang, W. Cao, Z. Su, K. Zhao, B. Dai, G. Gao, J. Zhao, K. Zhao, Z. Wang and T. Sun, ACS Appl. Mater. Interfaces, 2023, 15, 27130–27143 CrossRef CAS PubMed.
- C. Feng, H. Ni, J. Chen and W. Yang, ACS Appl. Mater. Interfaces, 2016, 8, 19732–19738 CrossRef CAS PubMed.
- S. Zhou, W. Luo, H. Zou, M. Liang and S. Li, J. Compos. Mater., 2016, 50, 327–337 CrossRef CAS.
- G. Xiao, H. Li, Z. Yu, H. Niu and Y. Yao, Nano-Micro Lett., 2024, 16, 17 CrossRef CAS.
- X. Jiang, C. Wang, G. Li, Y. Yu and X. Yang, Composites, Part B, 2024, 273, 111238 CrossRef CAS.
- J. Yang, W. Qiao, J. Qiao, H. Gao, Z. Li, P. Wang, C. Cao, C. Tang and Y. Xue, ACS Appl. Mater. Interfaces, 2022, 14, 48558–48569 CrossRef CAS PubMed.
- J. Yang, C. Cao, W. Qiao, J. Qiao, H. Gao, W. Bai, Z. Li, P. Wang, C. Tang and Y. Xue, ACS Appl. Nano Mater., 2022, 5, 15600–15610 CrossRef CAS.
- S. Kim, S. Kang and J. Lee, ACS Omega, 2023, 8, 17748–17757 CrossRef CAS PubMed.
- H. Fang, S.-L. Bai and C. P. Wong, Composites, Part A, 2018, 112, 216–238 CrossRef CAS.
- Y. Jun, J. Um, G. Jiang and A. Yu, eXPRESS Polym. Lett., 2018, 12, 885–897 CrossRef CAS.
- K. A. Imran, J. Lou and K. N. Shivakumar, J. Appl. Polym. Sci., 2018, 135, 45833 CrossRef.
- J. Zhang, B. Liang and J. Long, J. Appl. Polym. Sci., 2024, 141, e55045 CrossRef CAS.
- H. Lin, L. Pei and L. Zhang, J. Appl. Polym. Sci., 2018, 135, 46397 CrossRef.
- M. Hazarika and T. Jana, Compos. Sci. Technol., 2013, 87, 94–102 CrossRef CAS.
- P. Ding, J. Zhang, N. Song, S. Tang, Y. Liu and L. Shi, Compos. Sci. Technol., 2015, 109, 25–31 CrossRef CAS.
- J.-Z. Liang and Y.-L. Qiu, Polym. Bull., 2015, 72, 1723–1734 CrossRef CAS.
- H. Fouad and R. Elleithy, J. Mech. Behav. Biomed. Mater., 2011, 4, 1376–1383 CrossRef CAS PubMed.
- T. Evgin, A. Turgut, G. Hamaoui, Z. Spitalsky, N. Horny, M. Micusik, M. Chirtoc, M. Sarikanat and M. Omastova, Beilstein J. Nanotechnol., 2020, 11, 167–179 CrossRef CAS PubMed.
- L. G. Cançado, A. Jorio, E. M. Ferreira, F. Stavale, C. A. Achete, R. B. Capaz, M. d. O. Moutinho, A. Lombardo, T. Kulmala and A. C. Ferrari, Nano Lett., 2011, 11, 3190–3196 CrossRef PubMed.
- B. E. Warren, X-Ray Diffraction, Courier Corporation, 1990 Search PubMed.
- Q. Wang, T. Wang, J. Wang, W. Guo, Z. Qian and T. Wei, Polym. Adv. Technol., 2018, 29, 407–416 CrossRef CAS.
- K. Sever, I. H. Tavman, Y. Seki, A. Turgut, M. Omastova and I. Ozdemir, Composites, Part B, 2013, 53, 226–233 CrossRef CAS.
- L. Zhang, C. Wan and Y. Zhang, Polym. Eng. Sci., 2009, 49, 1909–1917 CrossRef CAS.
- W. Zheng, X. Lu and S. C. Wong, J. Appl. Polym. Sci., 2004, 91, 2781–2788 CrossRef CAS.
- L. Zhai, Z. Liu, C. Li, X. Qu, Q. Zhang, G. Li, X. Zhang and B. Abdel-Magid, RSC Adv., 2019, 9, 5722–5730 RSC.
- H. Chen, V. V. Ginzburg, J. Yang, Y. Yang, W. Liu, Y. Huang, L. Du and B. Chen, Prog. Polym. Sci., 2016, 59, 41–85 CrossRef CAS.
- Y. Liu, J. Zhang, S. Chen, Y. Liu, Y. Xie, C. Cao and X. Qu, Polym. Adv. Technol., 2024, 35, e6541 CrossRef CAS.
- C. Li, J. Wang and Y. Su, Int. J. Eng. Sci., 2021, 160, 103453 CrossRef CAS.
- C. Song, T. Luan, J. Wu and T. Deng, J. Integr. Technol., 2019, 8, 54–67 Search PubMed.
- S. Park, S. He, J. Wang, A. Stein and C. W. Macosko, Polymer, 2016, 104, 1–9 CrossRef CAS.
- H. Zou, Y. Feng, X. Tang, X. Zhang and L. Qiu, Compos. Sci. Technol., 2024, 245, 110346 CrossRef CAS.
- Y. Guo, K. Ruan, X. Shi, X. Yang and J. Gu, Compos. Sci. Technol., 2020, 193, 108134 CrossRef CAS.
- A. Visco, A. Grasso, G. Recca, D. C. Carbone and A. Pistone, Polymers, 2021, 13, 975 CrossRef CAS PubMed.
- A. R. Bhattacharyya, T. Sreekumar, T. Liu, S. Kumar, L. M. Ericson, R. H. Hauge and R. E. Smalley, Polymer, 2003, 44, 2373–2377 CrossRef CAS.
- R. Haggenmueller, C. Guthy, J. R. Lukes, J. E. Fischer and K. I. Winey, Macromolecules, 2007, 40, 2417–2421 CrossRef CAS.
- G. Xie, P. Zhang, S. Gong and W. Cao, Eng. Mech., 2005, 22, 228–234 Search PubMed.
- L. Zhang, J. Wu and L. Jiang, Prog. Chem., 2014, 26, 560 CAS.
- J. Longun and J. Iroh, Carbon, 2012, 50, 1823–1832 CrossRef CAS.
- J.-E. An, G. W. Jeon and Y. G. Jeong, Fibers Polym., 2012, 13, 507–514 CrossRef CAS.
- Q. Du and C. Zhou, Res. Explor. Lab., 2004, 46–47 Search PubMed.
Footnote |
| † Electronic supplementary information (ESI) available. See DOI: https://doi.org/10.1039/d4ra03653k |
| This journal is © The Royal Society of Chemistry 2024 |

