 Open Access Article
Functionalization of a porous copper(II) metal–organic framework and its capacity for loading and delivery of ibuprofen†
Adedibu C. Tella *a,
Sunday J. Olatunjiab and
Peter A. Ajibade
 b
b
aDepartment of Chemistry, University of Ilorin, P.M.B.1515, Ilorin, Kwara State, Nigeria. E-mail: ac_tella@yahoo.co.uk; adedibu@unilorin.edu.ng
bSchool of Chemistry and Physics, University of KwaZulu-Natal, Private Bag X01, Scottsville 3209, South Africa
First published on 15th August 2024
Abstract
A porous copper(II) metal–organic framework (MOF) of 4,4′,4′′-tri-tert-butyl-2,2′:6′,2′′-terpyridine(N3ttb) and 5-nitroisophthalic acid (npd) formulated as [Cu(npd)(N3ttb)]·(DMF)(H2O) 1 (DMF = dimethylformamide) was synthesized and characterized by elemental analyses, spectroscopic techniques, single crystal X-ray crystallography, and scanning electron microscopy. Single crystal X-ray crystallographic analysis of the copper(II) metal–organic framework reveals a monoclinic crystal system with space group P21/c. The copper(II) ion is in a five-coordinate geometry consisting of three meridional nitrogen atoms of 4,4′,4′′-tri-tert-butyl-2,2′:6′,2′′-terpyridine and two oxygen atoms of 5-nitroisophthalic acid to form a square pyramidal structure. The compound was functionalized with ethylenediamine (ED) to form [Cu(npd)(N3ttb)]-ED 2 that was characterized by FT-IR, PXRD, SEM-EDX and BET and the drug loading capacity was investigated and compared with that of as-synthesized MOFs. The amount of ibuprofen loaded was 916.44 mg g−1 (15.27%) & 1530.20 mg g−1 (25.50%) over 1 and 2, respectively. The results indicate that the functionalized MOFs 2 have a higher loading capacity for ibuprofen than 1 by 613.76 mg g−1 (10.23%), which could be ascribed to the acid–base interactions in the functionalized molecules. The results show that [Cu(npd)(N3ttb)]-ED 2 is a better drug transporter than [Cu(npd)(N3ttb)]·(DMF)(H2O) 1 due to the presence of an amine functional group that interacts with the acid group on the ibuprofen through non-covalent bonds interactions.
1. Introduction
A huge number of drug transporters have been developed, studied, and reported, each of which has both positive and negative potential.1–5 Some of the most common drug carriers are metal–organic frameworks, nanoparticles, synthetic polymers, liposomes, microspheres, dendrimers, virosomes, protein conjugates erythrocytes etc.5 Various ways of encapsulating the drugs into the transporters have been developed, such as adsorption, covalent bonding, encapsulation, and integration into the bulk structure.1 Different drug transporters use different attachment methods, and some can even implement various attachment methods.1 Metal–organic frameworks have proven to be effective drug carriers due to their ability to distribute the active sites that help in drug immobilization evenly in the pore, which helps in the reduction of drug leakage before delivery. Also, due to MOFs' low cytotoxicity and good biocompatibility, they can effectively penetrate the cell membranes during delivery.2 MOFs usually formed by the coordination of metal ions and rigid organic ligands have attracted great attention due to their distinct structural and topological features.2,4 In addition to the fascinating structural and topological diversities of MOFs, they also possess high structural porosity6 which makes them promising materials for applications such as adsorption,7–9 catalysis,10–15 drug delivery,16–19 electronics,2,20 magnetism21,22 and luminescence.23,24At present, carboxylic acids are being used as linking bridges to form coordination polymer due to their high structural strength and flexible coordination ways.25–28 Various carboxylic acids are very useful ligands for the preparation of coordination polymers.29–34 Neutral nitrogen donor ligands are being used in the synthesis of MOFs due to their ability to form nitrogen-based MOFs with modular nature and framework flexibility. The weak metal–nitrogen bond formed by the coordination of nitrogen donor ligands with metal ions allows incoming guest molecules to alter the environment at the metal centre which makes functionalization of the MOFs easy.35 However, unsymmetrical, and heterocyclic 4,4′,4′′-tri-tert-butyl-2,2′:6′,2′′-terpyridine has three pyridyl nitrogen which can easily bind to a metal node to form various interesting frameworks.36 Copper is one of the most used metals for the synthesis of drug carrier MOFs due to its biological functions and benefits. Nowadays, copper-based metal–organic frameworks (Cu-MOFs) attract great attention in the field of biomaterials due to their unique properties such as tunable measurements, distinct pore dimensions, high porosity, excellent biocompatibility, variable configuration, high drug loading capacity and ideally controlled drug release.37–39 Post-synthetic modifications (PSM) have been used to improve MOF efficiency by the introduction of additional functional groups such as amine and thiols to its surface.16 Metal–organic frameworks can be easily modified covalently by amino or thiol groups due to the availability of unsaturated central metal ions. Chemical modifications can introduce specific functional groups into MOFs and offer the possibility of designing a new generation of enhanced MOFs.40–44
Herein, we report the synthesis and crystal structure of MOFs prepared from copper(II), 4,4′,4′′-tri-tert-butyl-2,2′:6′,2′′-terpyridine and 5-nitroisophthalic acid formulated as [Cu(npd)(N3ttb)]·(DMF)(H2O) 1 and its amino acid functionalization to prepared [Cu(npd)(N3ttb)]-ED 2. The potentials of both compounds 1 and 2 to load and deliver ibuprofen were evaluated.
2. Experimental section
2.1. Materials
All chemicals were analytical grade and used as acquired without further purification. 4,4′,4′′-Tri-tert-butyl-2,2′:6′,2′′-terpyridine, 5-nitroisophthalic acid, copper(II) acetate dihydrate, dimethylformamide, ethanol, methanol and water were acquired from Merck.2.2. Synthesis of [Cu(npd)(N3ttb)]·(DMF)(H2O) 1
The conventional synthesis of [Cu(npd)(N3ttb)]·(DMF)(H2O) was carried out by mixing a solution of 5-nitroisophthalic acid (H2npd, 0.2113 g, 1 mmol) in Millipore water (10 mL) with a solution of 4,4′,4′′-tri-tert-butyl-2,2′:6′,2′′-terpyridine (N3ttb, 0.4014 g, 1 mmol) in 1![[thin space (1/6-em)]](https://www.rsc.org/images/entities/char_2009.gif) :
:![[thin space (1/6-em)]](https://www.rsc.org/images/entities/char_2009.gif) 1 ethanol/water (20 mL) for 5 minutes with constant agitation at 70 °C. A clear colourless solution was obtained and refluxed at 70 °C for 1 h, after which a solution of copper(II) acetate monohydrate (Cu(CH3COO)2·H2O, 0.0999 g, 0.5 mmol) in Millipore water (10 mL) and dimethylformamide (10 mL) were added to the resultant solution and reflux at 160 °C for 24 h. A clear blue solution was obtained and left standing for slow evaporation at room temperature. Light green crystals were formed after 10 days. The green crystals formed were separated by filtration and washed with a mixture of dimethylformamide, ethanol and water in a ratio of 1
1 ethanol/water (20 mL) for 5 minutes with constant agitation at 70 °C. A clear colourless solution was obtained and refluxed at 70 °C for 1 h, after which a solution of copper(II) acetate monohydrate (Cu(CH3COO)2·H2O, 0.0999 g, 0.5 mmol) in Millipore water (10 mL) and dimethylformamide (10 mL) were added to the resultant solution and reflux at 160 °C for 24 h. A clear blue solution was obtained and left standing for slow evaporation at room temperature. Light green crystals were formed after 10 days. The green crystals formed were separated by filtration and washed with a mixture of dimethylformamide, ethanol and water in a ratio of 1![[thin space (1/6-em)]](https://www.rsc.org/images/entities/char_2009.gif) :
:![[thin space (1/6-em)]](https://www.rsc.org/images/entities/char_2009.gif) 1
1![[thin space (1/6-em)]](https://www.rsc.org/images/entities/char_2009.gif) :
:![[thin space (1/6-em)]](https://www.rsc.org/images/entities/char_2009.gif) 3 and dried at room temperature (Scheme 1).
3 and dried at room temperature (Scheme 1).
Colour: green. Yield: 90%. M. pt.: 273.5 °C. Anal. calcd M. wt. = 765.34 g mol−1. Anal. found (calcd)% for (C38H47CuN5O8): C, 52.45 (59.63); H, 5.25 (6.19); N, 7.80 (9.15). UV-Vis (DMSO, nm): 269, 288, 325, 343, 418. FT-IR (ATR, cm−1): 3507, 3380, 3060, 2959, 2870, 2806, 1654, 1610, 1565, 1535, 1476, 1431, 1386, 1323, 1252, 1203, 1088, 786, 711, 659. m/z (DMSO, %): 499.1666 (100.0%), 501.1638 (80.66%), 500.1700 (30.69) 502.1675 (23.76%), 503.1635 (17.69%), 271.1040 (12.78%), 509.1945 (12.55%), 569.6902 (12.20%), 674.1951 (11.51%), 432.7322 (10.95%), 564.1905 (7.64%), 570.1919 (7.35%), 272.1038 (6.99%), 511.1935 (6.44%), 523.2105 (6.13%), 676.1945 (5.96%), 179.0137 (4.43%), 298.6407 (3.98%), 696.1781 (3.20%), 208.1771 (2.44%).
2.3. Functionalization of [Cu(npd)(N3ttb)]·(DMF)(H2O) 1
300 mg of [Cu(npd)(N3ttb)]·(DMF)(H2O) was dehydrated at 150 °C for 18 h and then suspended in 10 mL of anhydrous toluene. 1 mL of ethylenediamine was added to the suspension and the mixture was refluxed at 110 °C for 12 h. Purple crystalline powder was obtained which was recovered by filtration, washed with ethanol (10 mL × 3) and then dried overnight at room temperature in a vacuum. The relative content of nitrogen in the functionalized sample ([Cu(npd)(N3ttb)]-ED 2) was determined by elemental analysis (SEM-EDX); the equation of reaction is shown in Scheme 2 below:Colour: purple, yield: 85%, anal. found (%): C, 20.74; N, 24.45; O, 2.04; Cu, 52.55, IR (ATR cm−1): 3303, 3119, 1613, 1531, 1509, 1453, 1345, 1289, 1159, 1092, 998, 883, 786, 726, 663.
2.4. Physical measurements
The ligands' and synthesized MOFs' electronic absorption spectra (200–700 nm) were obtained from a PerkinElmer Lambda 35 UV-Vis absorption spectrometer. FT-IR spectra (4000–600 cm−1) were obtained from Agilent Cary 630 FT-IR with diamond ATR accessory. The elemental composition of synthesized MOFs was checked on Thermoscientific Flash 2000 elemental analyzer with a TCD detector. The mass spectrum was obtained from waters micromass LCT premier TOF-MS using ESI techniques. Scanning electron microscopy (SEM) images were obtained from the ZEISS EVO LS15 electron microscope. Nitrogen adsorption isotherms were measured using nitrogen gas at (77 K) on a Quantachrome NOVA 4200e. The amount of drug loaded in the MOFs was determined using Agilent 1290 Infinity II liquid chromatography coupled with a diode array detector.2.5. Crystallographic data collection and structural analysis
Single crystals of [Cu(npd)(N3ttb)]·(DMF)(H2O) 1 were obtained by slow evaporation of the compound in a mixture of DMF/ethanol/water in a ratio of 1![[thin space (1/6-em)]](https://www.rsc.org/images/entities/char_2009.gif) :
:![[thin space (1/6-em)]](https://www.rsc.org/images/entities/char_2009.gif) 1
1![[thin space (1/6-em)]](https://www.rsc.org/images/entities/char_2009.gif) :
:![[thin space (1/6-em)]](https://www.rsc.org/images/entities/char_2009.gif) 3 at room temperature. Details of the crystal parameters, data collection and refinements are listed in Table 1. The single crystals data of 1 was collected on a Bruker APEX-II CCD diffractometer fitted with an Oxford Cryostems low-temperature instrument, running at T = 100.07 K. Using Olex2,45 the structure was solved with the XT46 structure solution program using intrinsic phasing and refined with the XL47 refinement package using least squares minimization. Table 2 shows the list of selected bond lengths and angles.
3 at room temperature. Details of the crystal parameters, data collection and refinements are listed in Table 1. The single crystals data of 1 was collected on a Bruker APEX-II CCD diffractometer fitted with an Oxford Cryostems low-temperature instrument, running at T = 100.07 K. Using Olex2,45 the structure was solved with the XT46 structure solution program using intrinsic phasing and refined with the XL47 refinement package using least squares minimization. Table 2 shows the list of selected bond lengths and angles.
| Identification code | 1 |
|---|---|
| Empirical formula | C38H47CuN5O8 |
| Formula weight | 765.34 |
| Temperature/K | 100.07 |
| Crystal system | Monoclinic |
| Space group | P21/c |
| a/Å | 12.6970(11) |
| b/Å | 16.0824(15) |
| c/Å | 18.3656(16) |
| α/° | 90 |
| β/° | 94.885(3) |
| γ/° | 90 |
| Volume/Å3 | 3736.6(6) |
| Z | 4 |
| ρcalcg/cm3 | 1.360 |
| μ/mm−1 | 1.307 |
| F(000) | 1612.0 |
| Crystal size/mm3 | 0.355 × 0.35 × 0.325 |
| Radiation | CuKα (λ = 1.54178) |
| 2θ range for data collection/° | 8.894 to 138.638 |
| Index ranges | −15 ≤ h ≤ 15, −19 ≤ k ≤ 19, −22 ≤ l ≤ 22 |
| Reflections collected | 47![[thin space (1/6-em)]](https://www.rsc.org/images/entities/char_2009.gif) 816 816 |
| Independent reflections | 6985 [Rint = 0.0681, Rsigma = 0.0417] |
| Data/restraints/parameters | 6985/0/483 |
| Goodness-of-fit on F2 | 1.017 |
| Final R indexes [I ≥ 2σ(I)] | R1 = 0.0465, wR2 = 0.1292 |
| Final R indexes [all data] | R1 = 0.0505, wR2 = 0.1309 |
| Largest diff. peak/hole/e Å−3 | 0.82/−0.92 |
| Bond lengths (Å) | Bond angles (°) | ||
|---|---|---|---|
| Cu1–O1 | 1.944(13) | O1–Cu1–O51 | 102.240(5) |
| Cu1–O5 | 2.128(14) | O1–Cu1–N4 | 95.620(6) |
| Cu1–N4 | 2.041(16) | O1–Cu1–N1 | 102.390(6) |
| Cu1–N1 | 2.038(16) | O1–Cu1–N2 | 159.130(6) |
| Cu1–N2 | 1.945(15) | N4–Cu1–O51 | 88.600(6) |
| N1–Cu1–O51 | 98.510(6) | ||
| N1–Cu1–N4 | 158.680(6) | ||
| N2–Cu1–O51 | 97.930(6) | ||
| N2–Cu1–N4 | 79.470(6) | ||
| N2–Cu1–N1 | 79.640(6) | ||
2.6. Ibuprofen loading in 1 and 2
An ethanolic stock solution of the ibuprofen (30![[thin space (1/6-em)]](https://www.rsc.org/images/entities/char_2009.gif) 000 mg L−1) was prepared by dissolving 300 mg of ibuprofen in 10 mL of ethanol. The concentration of ibuprofen was determined at a wavelength of 262 nm using Agilent 1290 Infinity II liquid chromatography coupled with diode array detector. Before ibuprofen loading, the MOFs were activated by heating for 24 h under a vacuum at 120 °C. After activation, 50 mg of each of 1 and 2 were immersed in 10 mL of ethanolic ibuprofen solution (30
000 mg L−1) was prepared by dissolving 300 mg of ibuprofen in 10 mL of ethanol. The concentration of ibuprofen was determined at a wavelength of 262 nm using Agilent 1290 Infinity II liquid chromatography coupled with diode array detector. Before ibuprofen loading, the MOFs were activated by heating for 24 h under a vacuum at 120 °C. After activation, 50 mg of each of 1 and 2 were immersed in 10 mL of ethanolic ibuprofen solution (30![[thin space (1/6-em)]](https://www.rsc.org/images/entities/char_2009.gif) 000 mg L−1) and the suspensions were stirred at 400 rpm using a magnetic stirrer for 3 days at room temperature. After loading for three (3) days, the suspensions were filtered using a nylon membrane filter, and the filtrate's concentration (mg L−1) was determined using an Agilent 1290 Infinity II LC coupled with a DAD. 5 μL of the filtrate was injected into the Zorbax Eclipse XDB-C18 column (4.6 × 150 mm × 5 mm) which was circulated by a mobile phase consisting of acetonitrile and water in a ratio of 3
000 mg L−1) and the suspensions were stirred at 400 rpm using a magnetic stirrer for 3 days at room temperature. After loading for three (3) days, the suspensions were filtered using a nylon membrane filter, and the filtrate's concentration (mg L−1) was determined using an Agilent 1290 Infinity II LC coupled with a DAD. 5 μL of the filtrate was injected into the Zorbax Eclipse XDB-C18 column (4.6 × 150 mm × 5 mm) which was circulated by a mobile phase consisting of acetonitrile and water in a ratio of 3![[thin space (1/6-em)]](https://www.rsc.org/images/entities/char_2009.gif) :
:![[thin space (1/6-em)]](https://www.rsc.org/images/entities/char_2009.gif) 1 respectively at 1.0 mL min−1. After drug immobilization, the solid residue was washed twice with ethanol, allowed to dry at room temperature and further characterized with FT-IR, PXRD, SEM and BET.
1 respectively at 1.0 mL min−1. After drug immobilization, the solid residue was washed twice with ethanol, allowed to dry at room temperature and further characterized with FT-IR, PXRD, SEM and BET.
2.7. Ibuprofen delivery from [Cu(npd)(N3ttb)]@IBU & [Cu(npd)(N3ttb)]-ED@IBU
200 mg of [Cu(npd)(N3ttb)]@IBU & [Cu(npd)(N3ttb)]-ED@IBU were compacted to obtain disks. The delivery assays were carried out by soaking the samples in a simulated body fluid (SBF) at 37 °C. Different samples were taken at different intervals using a cannular to know the amount of ibuprofen delivered with time. The concentration of ibuprofen delivered was determined at a wavelength of 262 nm using Agilent 1290 Infinity II liquid chromatography coupled with a diode array detector. After delivery, the suspension was filtered using a nylon membrane filter, and the filtrate's concentration (mg L−1) was determined using an Agilent 1290 Infinity II LC coupled with a DAD. 10 μL of the filtrate was injected into the Zorbax Eclipse XDB-C18 column (4.6 × 150 mm × 5 mm) which was circulated by a mobile phase consisting of acetonitrile and water in a ratio of 9![[thin space (1/6-em)]](https://www.rsc.org/images/entities/char_2009.gif) :
:![[thin space (1/6-em)]](https://www.rsc.org/images/entities/char_2009.gif) 1 respectively at 1.5 mL min−1. After drug delivery, the solid residue was washed twice with ethanol, allowed to dry at room temperature and further characterized with FT-IR and PXRD.
1 respectively at 1.5 mL min−1. After drug delivery, the solid residue was washed twice with ethanol, allowed to dry at room temperature and further characterized with FT-IR and PXRD.
3. Results and discussions
Green cubic crystals of 1 were synthesized as described in Section 2.2. The synthesized porous mononuclear Cu-MOF is insoluble in common solvents like acetone, acetonitrile, chloroform, dichloromethane, dimethylformamide, ethanol, ethyl acetate, isopropanol, methanol, hexane, and water. 1 was only soluble in dimethyl sulfoxide (DMSO) and the insolubility in other common organic solvents could be due to its polymeric features. The melting point, UV-Vis spectra, FT-IR spectra, elemental analysis and mass spectra data of the synthesized Cu-MOF clearly show the formation of 1 and is confirmed by the X-ray crystal structure.3.1. Description of the crystal structure of 1
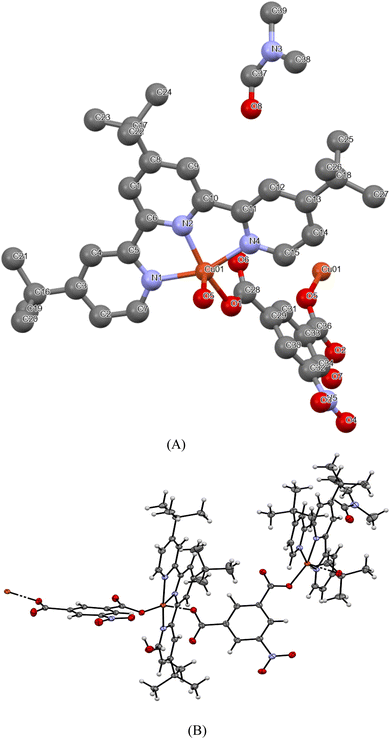
The crystal structure of 1, with atom numbering scheme, is shown in Fig. 1 and the essential bond angles and distances are listed in Table 2. The asymmetric unit of the MOFs consists of one Cu2+, 4,4′,4′′-tri-tert-butyl-2,2′:6′,2′′-terpyridine, 5-nitroisophthalic acid, and two solvents of crystallization; dimethylformamide, and water molecules. The MOFs crystallize in a monoclinic space group P21/c in which the Cu(II) ion is penta-coordinated by three meridional nitrogen atoms of 4,4′,4′′-tri-tert-butyl-2,2′:6′,2′′-terpyridine and two oxygen atoms from two different molecules of 5-nitroisophthalic acid with one molecule acting as a monodentate ligand while the other acts a bridging ligand between the two asymmetric units in the crystal lattice as shown in Fig. 1B.The unit cell packing arrangement of 1 is shown in Fig. 2. The Cu–N bond distances of the two pyridyl rings Cu1–N1 (2.0377 Å) and Cu1–N4 (2.0412 Å) at the edge are longer than the middle pyridyl ring Cu1–N2 (1.9454 Å) (Zn1–N(2) = 2.105 Å) which is due to the constrained bite angle of 4,4′,4′′-tri-tert-butyl-2,2′:6′,2′′-terpyridine.48 The Cu–N distance as reported by the single crystal X-ray crystallographic analysis is in accordance with the previously reported bond distances for metal–terpyridine MOFs.18,48 The two adjacent Cu–O bond distances of the carboxyl group Cu1–O1 (1.9435 Å) and Cu1–O5 (2.1277 Å) are different because the central copper(II) ion is attached to a different molecule of 5-nitroisophthalic acid with one acting as a coordinated ligand while the other acts as bridging ligand. It can be observed from Table 2 that Cu(1)–O(1) bond distance is slightly shorter than Cu(1)–O(5), Cu(1)–N(1), Cu(1)–N(2) and Cu(1)–N(4). This reveals that the binding force of the oxygen atom of the carboxyl group (COO−) from 5-nitroisophthalate ligand is stronger than that of the nitrogen atom of the pyridyl rings from 4,4′,4′′-tri-tert-butyl-2,2′:6′,2′′-terpyridine which could be as a result of Jahn–Teller effects in [Cu(npd)(N3ttb)]·(DMF)(H2O).49,50 The bond angles N–Cu1–N4, N2–Cu01–N4 and N2–Cu1–N1 are 158.68°, 79.47° and 79.64° respectively which are comparable with the previously reported bond angles of metal–terpyridine MOFs.18,48 The other bond angles O1–Cu1–N4 (95.62°), N4–Cu1–O51 (88.60°), N1–Cu1–O51 (98.5°) and N2–Cu1–O51 (97.93°) are between 88 and 98° which is common to 5-coordinate compounds. Generally, 5-coordinate MOFs have either square pyramidal or trigonal bipyramidal geometries which are influenced by steric and electronic factors.48 The geometry around the Cu(II) ion in [Cu(npd)(N3ttb)]·(DMF)(H2O), was calculated using the angular structural index parameter (τ5).49 As reported by Hussain et al. 2020,49 τ5 = (β − α)/60, where β is O1–Cu1–N2 (159.13) and α is N1–Cu1–N4 (158.68). [Cu(npd)(N3ttb)]·(DMF)(H2O) has τ5 value close to zero (0.0075), which confirms that the geometry around Cu(II) is square pyramidal.48,49
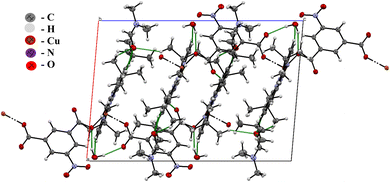 | ||
| Fig. 2 Packing diagram of 1, view down along a-axis showing the hydrogen bonds connecting the uncoordinated water molecules to alternating molecules of 1. | ||
3.2. Electronic spectra of 1
The electronic spectra of copper(II) acetate monohydrate, 5-nitroisophthalic acid, tri-tert-butyl-2,2′:6′,2′′-terpyridine and 1 were obtained within the range of 200–500 nm (Fig. S1†). The spectrum of the synthesized MOFs was found to be different from those of the starting ligands and showed either a bathochromic shift, hypsochromic shift or disappearance of the characteristic bands found in the ligands. Two characteristic bands of C–N (n → σ*) and C![[double bond, length as m-dash]](https://www.rsc.org/images/entities/char_e001.gif) C (π → π*) were observed at 288 nm & 292 nm in 5-nitroisophthalic acid and tri-tert-butyl-2,2′:6′,2′′-terpyridine respectively. A hypsochromic shift was observed in [Cu(npd)(N3ttb)]·(DMF)(H2O), and the two characteristic bands were found at 269 nm and 288 nm for C–N (n → σ*) and C
C (π → π*) were observed at 288 nm & 292 nm in 5-nitroisophthalic acid and tri-tert-butyl-2,2′:6′,2′′-terpyridine respectively. A hypsochromic shift was observed in [Cu(npd)(N3ttb)]·(DMF)(H2O), and the two characteristic bands were found at 269 nm and 288 nm for C–N (n → σ*) and C![[double bond, length as m-dash]](https://www.rsc.org/images/entities/char_e001.gif) C (π → π*) respectively. Three additional bands were observed at 325, 343 and 418 nm which can be assigned to ligand-to-metal charge transfer (LMCT) transitions and d–d transition of d9 Cu2+ complexes in a square pyramidal geometry.51
C (π → π*) respectively. Three additional bands were observed at 325, 343 and 418 nm which can be assigned to ligand-to-metal charge transfer (LMCT) transitions and d–d transition of d9 Cu2+ complexes in a square pyramidal geometry.51
3.3. Infrared spectra studies of 1
The infrared spectrum of 1 in the far IR region 4000–600 cm−1 was compared with those of the 4,4′,4′′-tri-tert-butyl-2,2′:6′,2′′-terpyridine and 5-nitroisophthalic acid (Fig. S2†). The infra-red spectrum of 1 was different from those of the starting materials and showed either disappearance or shift in some of the characteristic wavenumbers of the starting materials. The two carboxylic groups (–COOH) present in 5-nitroisophthalic acid are deprotonated and coordinate with different copper ions. 4,4′,4′′-Tri-tert-butyl-2,2′:6′,2′′-terpyridine is a heterocyclic compound with three (3) pyridyl nitrogen atoms where each can donate a lone pair of electrons while 5-nitroisophthalic acid is a bidentate ligand having the ability to donate two pairs of electrons to the Cu(II) ion. 4,4′,4′′-Tri-tert-butyl-2,2′:6′,2′′-terpyridine is a rigid tridentate bridging ligand, which often binds through the three pyridyl nitrogen with metal ions. This mode of binding is in good agreement with the previous work carried out by Hussain et al., 2020 and Tella et al., 2020.17,49 The IR spectrum of 1 shows characteristic bands of 4,4′,4′′-tri-tert-butyl-2,2′:6′,2′′-terpyridine (N3ttb) and 5-nitroisophthalic acid (H2npd). The appearance of the broadband at 3380 cm−1 in the spectrum of MOFs is due to the stretching vibration of the non-coordinated water molecule.49,52 The strong ν(C–N) absorption bands that appear at 1371 and 1349 cm−1 in 4,4′,4′′-tri-tert-butyl-2,2′:6′,2′′-terpyridine (N3ttb) and 5-nitroisophthalic acid (H2npd) respectively have both shifted to 1386 cm−1 in the MOFs which is an indication of hydrogen bond formation. The appearance of 3112 cm−1, 3060 cm−1, 2959 cm−1 & 2870 cm−1 bands in 1 can be ascribed to aromatic and aliphatic ν(C–H) stretching vibrations. The disappearance of the broad 5-nitroisophthalic acid ν(O–H) absorption band at 2866 cm−1 in the spectrum of MOFs confirms the coordination of Cu(II) through the O–H group.49 The strong ν(C![[double bond, length as m-dash]](https://www.rsc.org/images/entities/char_e001.gif) O) absorption bands at 1654 cm−1 and 1610 cm−1 are characteristic bands of the carbonyl and carboxyl groups respectively.49 The new absorption bands at 711 cm−1 and 695 cm−1 in the MOFs give inference about ν(M–O) and ν(M–N) bonding.49,53
O) absorption bands at 1654 cm−1 and 1610 cm−1 are characteristic bands of the carbonyl and carboxyl groups respectively.49 The new absorption bands at 711 cm−1 and 695 cm−1 in the MOFs give inference about ν(M–O) and ν(M–N) bonding.49,53
3.4. Mass spectra studies of 1
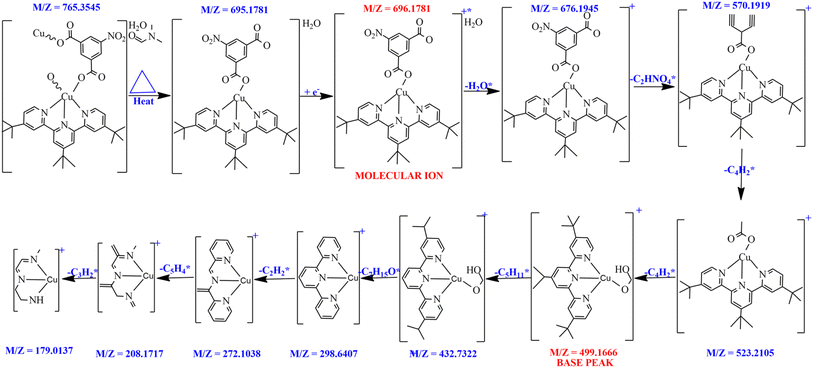
Compound 1 dissolves in DMSO without structural damage as seen on the mass spectrum. The mass spectrum of 1 was collected and compared with those of 4,4′,4′′-tri-tert-butyl-2,2′:6′,2′′-terpyridine and 5-nitroisophthalic acid. The uncoordinated DMF molecule was lost into the LC/MS (oa-TOF) system before the ionization occurred. The Cu-MOF mass spectrum (Fig. S3†) reveals that the molecular ion peak is 696.17 m/z (calculated at 693.34 g mol−1) which is in full agreement with the empirical formula (C35H40CuN4O7) and the molecular weight obtained from elemental analysis. Furthermore, the fragmentations mechanism as shown in Fig. 3 agrees with the peaks shown on the mass spectrum. After ionization, the molecular/parent ion [C35H40CuN4O7]+* formed, and undergo additional nine-step fragmentation (Fig. 3). After ionization, the uncoordinated water was the first radical to be lost from the molecular ion to form [C35H39CuN4O6]+ with 676.1945 m/z. [C35H39CuN4O6]+ fragments further losing [C2HNO4]* radical to generate 570.1919 m/z which is equivalent to [C33H38CuN3O2]+. The molecular ion and base peak of 5-nitroisophthalic acid and tri-tert-butyl-2,2′:6′,2′′-terpyridine obtained are 211 m/z and 401 m/z respectively. After the 4th fragmentation, the most intense peak [C27H37CuN3O2] with 499.1666 m/z was produced (Fig. 3).3.5. Hirshfeld surface analysis
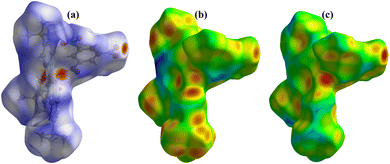
Hirshfeld surface analysis was used to analyze the closed intermolecular atomic interactions in the crystal structure of 1 as shown in Fig. 4 and 5. The dnorm function is the ratio between the distance from the surface to the nearest nucleus internal to the surface (di) and the distance from the surface to the nearest nucleus external to the surface (de).54 The dnorm, di and de were mapped over the ranges −0.5748 to 0.5272 Å, 0.9089–3.0363 Å and 0.7596–2.8609 Å respectively. The dnorm surface was drawn with blue, red, and white colours, where the blue colour region represents the distance of intermolecular interactions greater than van der Waals distance (dnorm = +ve), the red colour region represents the distance of intermolecular interactions lower than van der Waals distance (dnorm = −ve) while the white colour region represent the distance of intermolecular interactions equal to van der Waals distance (dnorm = 0).48,55 The bright red spots on the crystal surface as shown in the dnorm mapping indicate there are closed contacts between the neighbouring molecules to this atom i.e., there is close contact between the oxygen atom on 5-nitrophthalic & the neighbouring central Cu(II) ion. The de and di surfaces indicate that the internal intermolecular interactions are stronger toward the tertiary –CH3 group on 4,4′,4′′-tri-tert-butyl-2,2′:6′,2′′-terpyridine while the external intermolecular interactions are more around the Cu and O atoms.48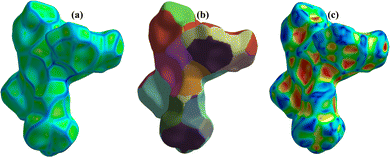 | ||
| Fig. 5 3-D Hirshfeld surfaces mapped with (a) curvedness, (b) fragment patch and (c) shape index of 1. | ||
The curvedness surface analysis was mapped over the range −4.0000 to 0.4000 Å for 1. This surface is a measure of curvature in the total Hirshfeld map. As shown in Fig. 5a, there are many large green flat areas separated by blue edges in the surface of [Cu(npd)(N3ttb)]·(DMF)(H2O) that correspond to high values of curvedness, that provide information about interactions between neighbouring molecules (π⋯π stacking interactions).18,56
Fragment patch surfaces were mapped over the range from 0.0000 to 20.0000 Å for 1 as shown in Fig. 5b. This mapping colour patch allows us to identify the closest neighbour coordination environment of a molecule for 1.57 Shape index was mapped over the range −1.0000 (concave) to 1.0000 (convex) Å for 1 as shown in Fig. 5c. This surface indicates that the electron density surface shape covers the interactions between molecules. The shape index was drawn with blue, red, and green colours, where the blue colour region represents the concave regions indicating atoms of the π-stacked molecule above them while the red colour region represents convex regions indicating the ring atoms of the molecule inside the surfaces.57,58
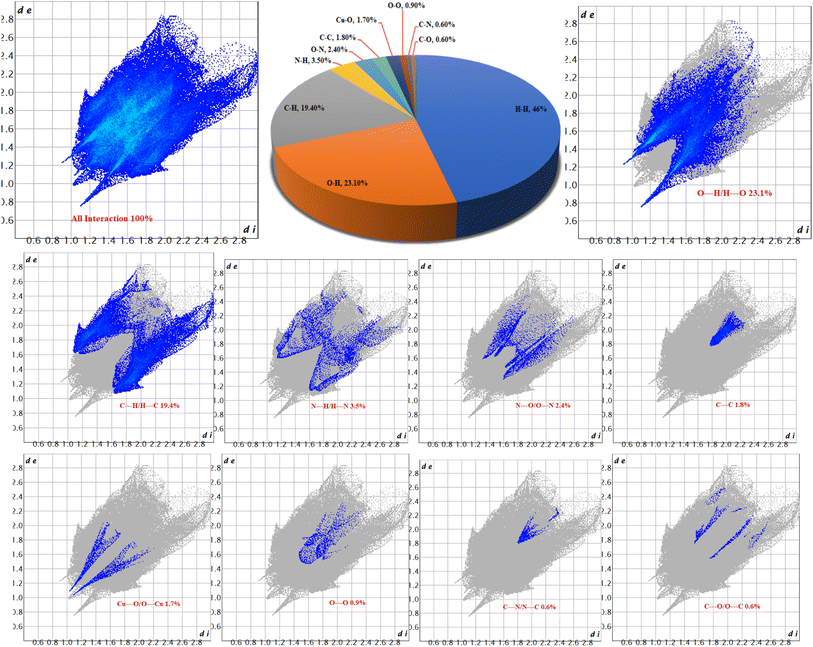
The 2D fingerprint plots for 1 (Fig. 6) revealed eight (8) intermolecular interactions in the crystal structure. The intermolecular interactions through H⋯H, O⋯H and C⋯H are dominant with 46.0, 23.1 and 19.4% of all interactions respectively. The percentage of other intermolecular interactions are 3.5, 2.4, 1.8, 1.7, 0.9, 0.6, and 0.6% for N⋯H, O⋯N, C⋯C, Cu⋯O, O⋯O, C⋯N and C⋯O respectively.
Furthermore, the form index surface reveals that the arrangement of adjacent blue and red triangles on the form index surfaces surrounding the [Cu(npd)(N3ttb)]·(DMF)(H2O) unit provides evidence for π⋯π stacking interactions between aromatic cycles (as depicted in Fig. 4 and 5). The observed percentages of interactions contributing to 1 are depicted in Fig. 6. Notably, this quantitative analysis highlights that H⋯H interactions play a dominant role in the crystal structure. The findings from the Hirshfeld surface analysis align with those observed in the X-ray diffraction analysis.
3.6. Amino functionalization of 1
The amino functionalization of 1 through the coordination of ethylenediamine (ED) to the unsaturated copper(II) centre of the dehydrated 1 framework was carried out as described in Section 2.3. After activation and functionalization, the synthesized mononuclear Cu-MOFs change from green to purple colour to form compound 2. Compound 2 is air-stable and insoluble in common solvents like acetone, acetonitrile, chloroform, dichloromethane, dimethylformamide, dimethyl sulfoxide, ethanol, ethyl acetate, isopropanol, methanol, hexane, and water. Apart from these physical changes, the amino-functionalization was confirmed by elemental analysis, FT-IR, PXRD, SEM and BET. The spectral analyses confirmed the addition of the amino functional group into the MOF framework while the PXRD of the as-synthesized and functionalized MOFs are the same which indicates that amino functionalization did not change the crystal lattice of compound 1.17,40,41 EDX analysis of both the as-synthesized and amino-functionalized compounds (Fig. S8 and Table T1†) confirmed the functionalization with an amino-functional group. After the functionalization of 1, the percentage composition of nitrogen (N) in 1 increased from 10.14% to 24.45% in 2. This clearly shows the addition of nitrogen from ethylenediamine (ED) into 1.17 Fig. S4† shows FT-IR spectra of the ethylenediamine, as-synthesized, activated, and amino-functionalized MOFs. After activation of 1, the broad ν(O–H) band at 3380 cm−1 and the strong ν(C![[double bond, length as m-dash]](https://www.rsc.org/images/entities/char_e001.gif) O) band at 1658 disappeared in the FT-IR spectrum confirming the loss of the uncoordinated DMF and water. To further confirm that the toxic DMF is no longer in the framework of pores and that the pores are empty, BET analysis was performed. After the amino functionalization of the MOFs through the coordination of ethylenediamine (ED) to the unsaturated Cu(II) ion, a new band was observed at 3160 cm−1 which is a characteristic band of ν(N–H). This result confirms that ethylenediamine molecules were successfully coordinated to the central Cu(II) ion in the framework, rather than adsorbed on the coordinated ligands of compound 1.40 Powder X-ray diffraction pattern is a very crucial technique to check the crystalline properties of MOFs. After post-synthetic modification with ethylenediamine, all diffraction peaks of the functionalized 2 were superimposed on 1 (Fig. S5†). The PXRD patterns of 1 and 2, show similar characteristic peaks that confirm the crystalline property of 1 didn't change after functionalization to prepared 2.
O) band at 1658 disappeared in the FT-IR spectrum confirming the loss of the uncoordinated DMF and water. To further confirm that the toxic DMF is no longer in the framework of pores and that the pores are empty, BET analysis was performed. After the amino functionalization of the MOFs through the coordination of ethylenediamine (ED) to the unsaturated Cu(II) ion, a new band was observed at 3160 cm−1 which is a characteristic band of ν(N–H). This result confirms that ethylenediamine molecules were successfully coordinated to the central Cu(II) ion in the framework, rather than adsorbed on the coordinated ligands of compound 1.40 Powder X-ray diffraction pattern is a very crucial technique to check the crystalline properties of MOFs. After post-synthetic modification with ethylenediamine, all diffraction peaks of the functionalized 2 were superimposed on 1 (Fig. S5†). The PXRD patterns of 1 and 2, show similar characteristic peaks that confirm the crystalline property of 1 didn't change after functionalization to prepared 2.
3.7. Experimental characterization of the loading of 1 and 2 with ibuprofen drug
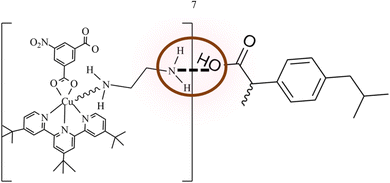
1 and 2 were employed separately for the loading of ibuprofen through adsorption. The loaded quantities of ibuprofen over 1 and 2 were monitored by HPLC coupled with a diode array detector (DAD) at 262 nm (λmax) which was later confirmed by FTIR, SEM and BET. From the results obtained from the HPLC analysis, the amount of ibuprofen loaded was 916.44 (15.27%) & 1530.20 (25.50%) over 1 and 2 respectively which is comparable to those reported in the literature.16 The results obtained show that the functionalized MOFs 2 have a higher loading capacity for ibuprofen than 1 by 613.76 (10.23%) due to acid–base interactions. The functionalization of 1 with ethylenediamine introduces a basic (–NH2) functional group to the MOF framework. Since ibuprofen exists as an organic acid with –COOH group, there will be an acid–base interaction during the loading which makes 2 loads better than 1.40 The acid–base interactions occur between the ibuprofen carboxyl group (–COOH) and amine (–NH2) group on 2 surfaces. The acidic ibuprofen molecules can be easily attracted and adsorbed onto the basic surface of 2 through acid–base attraction as shown in Fig. 7.40After loading for three (3) days, the colour of the MOF framework remained unchanged. To confirm the loading of ibuprofen over 1 and 2 the FT-IR analysis was carried out. The FT-IR spectra of the drug absorbed in pores of the MOFs are presented in Fig. S9 and S10.† The changes observed in the spectra indicated the possible involvement of those functional groups in the pores of the MOF after loading. It reflects the nature of MOF and shows significant band shifting and intensity changes due to ibuprofen absorption. The ν(C![[double bond, length as m-dash]](https://www.rsc.org/images/entities/char_e001.gif) O) and ν(C
O) and ν(C![[double bond, length as m-dash]](https://www.rsc.org/images/entities/char_e001.gif) C) (aromatic) stretching vibrations observed in MOF@IBU at 1700 cm−1 and 1560 cm−1 respectively in comparison with the ibuprofen (Fig. S9 and S10†), indicates absorption of ibuprofen into the MOFs. In addition to that, the ν(O–H) bending vibration of the carboxyl (1006 cm−1) is due to the presence of ibuprofen in the pores of the MOF. After the incorporation of ibuprofen into 1 and 2, all the diffraction peaks were indexed as shown in Fig. S11 and S12.† High-intensity Bragg diffraction peaks are observed at 2θ = 9.82° and 21.18° with many low-intensity peaks for Cu-MOF. The PXRD pattern of 1 and 2 (before and after), shows similar characteristic peaks confirming that their crystalline property didn't change after the incorporation of ibuprofen into the MOF pores.
C) (aromatic) stretching vibrations observed in MOF@IBU at 1700 cm−1 and 1560 cm−1 respectively in comparison with the ibuprofen (Fig. S9 and S10†), indicates absorption of ibuprofen into the MOFs. In addition to that, the ν(O–H) bending vibration of the carboxyl (1006 cm−1) is due to the presence of ibuprofen in the pores of the MOF. After the incorporation of ibuprofen into 1 and 2, all the diffraction peaks were indexed as shown in Fig. S11 and S12.† High-intensity Bragg diffraction peaks are observed at 2θ = 9.82° and 21.18° with many low-intensity peaks for Cu-MOF. The PXRD pattern of 1 and 2 (before and after), shows similar characteristic peaks confirming that their crystalline property didn't change after the incorporation of ibuprofen into the MOF pores.
After confirming the ability of 1 and 2 to load ibuprofen, a comparison was made with those reported in the literature as shown in Table T2.† The report showed that 1 and 2 have higher loading capacity than previously reported MOFs.59–66 The large volume of ibuprofen loaded after functionalization with ethylenediamine is noteworthy, as shown in Table T2.†59–67
3.8. Experimental characterization of ibuprofen delivery from MOF@IBU
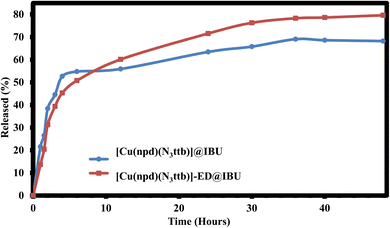
After loading, we further investigated the delivery capability and pharmacokinetics of the loaded MOFs ([Cu(npd)(N3ttb)]@IBU & [Cu(npd)(N3ttb)]-ED@IBU). The drug released was monitored with HPLC and the resultant powder was characterized using FT-IR and PXRD. The release profiles of [Cu(npd)(N3ttb)]@IBU & [Cu(npd)(N3ttb)]-ED@IBU were evaluated in simulated body fluid (SBF) at pH 7.4 and temperature of 37 °C ± 1 °C with a constant stirring at a rate of around 75 rpm. At different time intervals (1, 1.5, 2, 3, 4, 6, 12, 24, 30, 36, 40 and 48 h), an aliquot of 50 μL was withdrawn, filtered and the amount of ibuprofen release from [Cu(npd)(N3ttb)]@IBU & [Cu(npd)(N3ttb)]-ED@IBU was ascertained with Agilent 1290 Infinity II LC with DAD. From the results obtained from the HPLC analysis, the amount of ibuprofen released was 69.05% and 79.62% of ibuprofen from [Cu(npd)(N3ttb)]@IBU & [Cu(npd)(N3ttb)]-ED@IBU respectively. As shown in Fig. 8, the release profile demonstrated two stages for [Cu(npd)(N3ttb)]@IBU & [Cu(npd)(N3ttb)]-ED@IBU. In the first stage, the release rates for [Cu(npd)(N3ttb)]@IBU & [Cu(npd)(N3ttb)]-ED@IBU were around 54.75% and 50.75% respectively within the first 6 h. The second stage of ibuprofen release from [Cu(npd)(N3ttb)]@IBU & [Cu(npd)(N3ttb)]-ED@IBU was a slow stage where the ibuprofen was released within 36 h and continued at the stationary level for 48 h. We further investigated the drug delivery by characterizing the residual solid using FT-IR and PXRD. Moreover, the release of ibuprofen from different MOFs has been reported.16,59–61The FT-IR spectra of the MOF, drug absorbed, and drug released from the pores of the MOFs are presented in Fig. S14 and S15.† To establish or clarify these findings, these samples were characterized by FT-IR. The changes observed in the spectra indicated the possible involvement of those functional groups in the MOF's pores after release. The characteristics band of ν(O–H) and ν(C![[double bond, length as m-dash]](https://www.rsc.org/images/entities/char_e001.gif) C) (aromatic) found in [Cu(npd)(N3ttb)]@IBU and [Cu(npd)(N3ttb)]-ED@IBU at 3446 cm−1 and 1560 cm−1 respectively were missing after releasing, indicating the release of ibuprofen from MOFs. In addition to that, the ν(C
C) (aromatic) found in [Cu(npd)(N3ttb)]@IBU and [Cu(npd)(N3ttb)]-ED@IBU at 3446 cm−1 and 1560 cm−1 respectively were missing after releasing, indicating the release of ibuprofen from MOFs. In addition to that, the ν(C![[double bond, length as m-dash]](https://www.rsc.org/images/entities/char_e001.gif) O) showing as an acid carbonyl (1695 cm−1) due to the presence of ibuprofen in the pores of [Cu(npd)(N3ttb)]@IBU and [Cu(npd)(N3ttb)]-ED@IBU are missing confirming the releases of ibuprofen from the [Cu(npd)(N3ttb)]@IBU. The broadband found around 3380 cm−1 after the release of ibuprofen could be attributed to moisture absorbed from the simulated body fluid. As shown in Fig. S16,† the PXRD pattern of [Cu(npd)(N3ttb)]-ED and [Cu(npd)(N3ttb)]-ED@IBU (loaded and released), shows similar characteristic peaks at 2θ value confirming that their crystalline property didn't change after loading. High-intensity Bragg diffraction peaks are observed at 2θ = 9.82° and 21.18° with many low-intensity peaks for copper MOF.16,59–67
O) showing as an acid carbonyl (1695 cm−1) due to the presence of ibuprofen in the pores of [Cu(npd)(N3ttb)]@IBU and [Cu(npd)(N3ttb)]-ED@IBU are missing confirming the releases of ibuprofen from the [Cu(npd)(N3ttb)]@IBU. The broadband found around 3380 cm−1 after the release of ibuprofen could be attributed to moisture absorbed from the simulated body fluid. As shown in Fig. S16,† the PXRD pattern of [Cu(npd)(N3ttb)]-ED and [Cu(npd)(N3ttb)]-ED@IBU (loaded and released), shows similar characteristic peaks at 2θ value confirming that their crystalline property didn't change after loading. High-intensity Bragg diffraction peaks are observed at 2θ = 9.82° and 21.18° with many low-intensity peaks for copper MOF.16,59–67
To examine the leaching of copper ion and amine functionalities concentration after ibuprofen releasing, ICP-OES, FT-IR and HPLC were used to quantify the copper ion and amine in the supernatant of the IBU@MOF after delivery. As shown in Table T3,† the copper ion concentration was found to be less than 0.1 ppb which confirms that the copper ion did not leach after delivery. Similarly, a comparison of the SBF IR spectra (Fig. S17†) was carried out before and after delivery and no significant difference was observed. Furthermore, the amine concentration was determined to be zero ppb (as shown in Fig. S18 and Table T4†) which confirms that the amine did not leach into the SBF after drug delivery.
3.9. SEM analysis
To investigate the surface morphology of compounds 1 and 2 before and after the incorporation of ibuprofen, the samples were characterized with SEM as shown in Fig. S6, S7 and S13† using the same magnification. Before the amino-functionalization, 1 sample was cylindrical with a smooth surface (Fig. S6†) but after the amino-functionalization, the sample was spherical with a rough surface. Moreover, for the amino-modified sample, increasing the N/Cu molar ratio to 3.69 caused a significant morphological change from regular cylindrical 1 crystal to irregular particles, which is due to the partial decomposition of the framework. After ibuprofen loading, the surfaces of 1 and 2 samples were covered with rough particles.17,413.10. BET analysis
To investigate the surface area and porosity of 1 and 2 before and after drug loading, the samples were characterized with Brunauer–Emmett–Teller (BET) analysis as depicted in Fig. S19–S26.† Before the BET analyses were carried out, 1 and 2 were activated by heating for 24 hours under a vacuum at 120 °C to remove the uncoordinated DMF and water.17 It can be observed in Fig. S19–S26,† that the hysteresis loops of the BET nitrogen adsorption–desorption plots fit into type IV isotherm. As detailed in Table T5,† the BET pore volume of 1 and 2 were 0.466 cc g−1 and 0.425 cc g−1 respectively while the BET surface area of 1 and 2 were 527.645 m2 g−1 and 497.591 m2 g−1 respectively confirming that the DMF and water are no longer in the framework of pores and the pore frameworks are ready for the incorporation of ibuprofen. After the incorporation of ibuprofen into 1 and 2, the BET analysis confirmed that the ibuprofen was loaded into the pore cavity of 1 and 2. As shown in Table T2,† it can be seen from the BET analysis that after the ibuprofen loading, the surface areas and pores volumes decreased by 59% and 50% for 1 and 2 respectively, because the ibuprofen molecules were incorporated into the pore cavity of the MOFs.173.11. Reusability of 1 and 2
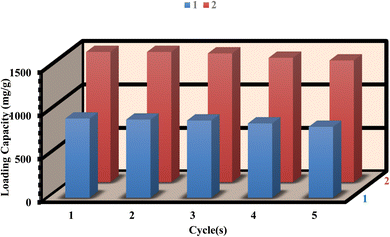
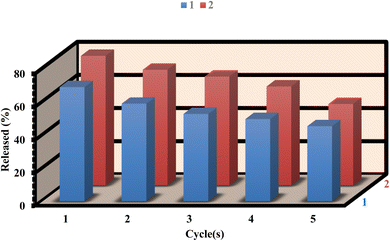
To assess the recyclability of 1 and 2, we conducted five drug load/delivery loop experiments to evaluate their reusability. After the delivery process, the residue powder was immersed in 10 mL of ethanol for 48 hours and exchanged for ethanol three times. After that, the sample was dried under vacuum at 100 °C for 12 hours. Furthermore, the FT-IR and PXRD patterns of 1 and 2, both before and after loading/delivery of ibuprofen, exhibit no substantial alterations in structural stability (as shown in Fig. S14–S17†). After five cycles, the loading capacities of 1 and 2 were 89.63% and 91.67% respectively, indicating the stability and reusability of the MOFs for ibuprofen loading (Fig. 9). Similarly, the releasing of ibuprofen from 1 and 2 were 65.85% and 62.84% respectively after five cycles (Fig. 10). However, the slight decrease in the loading/delivery capacity of 1 and 2 with each cycle can be attributed to physicochemical adsorption or the loss of adsorbent during the cycling process. These observations align with previous research findings.68–714. Conclusion
A porous three-dimensional metal–organic framework of Cu(II) formed by the bridging 5-nitroisophthalic acid and 4,4′,4′′-tri-tert-butyl-2,2′:6′,2′′-terpyridine has been synthesized. The crystal structure of the complex was determined by single-crystal X-ray crystallography and further characterized by elemental analyses, UV-Vis and FT-IR spectroscopy and mass spectrometry. The molecular structure of the copper(II) metal–organic framework reveals a monoclinic crystal system with space group P21/c in which the copper(II) ion is in a five-coordinate geometry consisting of three meridional nitrogen atoms of 4,4′,4′′-tri-tert-butyl-2,2′:6′,2′′-terpyridine and two oxygen atoms of 5-nitroisophthalic acid acting as coordinated and bridging atom to form a square pyramidal structure. The copper(II) MOF was functionalized with an amino group to form compound 2 which was characterized by elemental analyses, FTIR, PXRD, SEM and BET. The drug loading capacity of compounds 1 and 2 were investigated using ibuprofen. The amount of ibuprofen loaded was 916.44 mg g−1 (15.27%) & 1530.20 mg g−1 (25.50%) over 1 and 2 respectively. The results indicate that compound 2 has a higher loading capacity for ibuprofen than 1 by 613.76 mg g−1 (10.23%) which could be ascribed to the acid–base interactions in the functionalized molecules. After the loading of ibuprofen, the drug release and pharmacokinetics of the MOF@IBU were investigated. The drug release was monitored with HPLC confirmed by characterizing the desolated MOFs using FT-IR spectroscopy and PXRD. The pharmacokinetics of [Cu(npd)(N3ttb)]@IBU shows that ibuprofen was initially released within 3 hours with full release after 2 days while [Cu(npd)(N3ttb)]-ED shows that ibuprofen was steadily released for 8 hours within full release after 2 days. The results show that the functionalization of MOF could offer a better drug loading and transport mechanism for effective biomedical applications.Data availability
The data supporting this article have been included as part of the ESI.†Author contributions
Adedibu C. Tella: project administration, supervision, conceptualization, methodology, writing review and editing. Sunday J. Olatunji: investigation, data curation, formal analysis, writing original draft and visualization. Peter A. Ajibade: supervision, funding acquisition, visualization, writing review and editing.Conflicts of interest
There are no conflicts to declare.Acknowledgements
The authors are grateful to the AGNES fellowship and UKZN. This study was financially supported by the African German Network of Excellence in Science (AGNES), through the Programme “AGNES Intra-Africa Mobility Grant for Junior Researchers”. Special thanks to the Inorganic Nanomaterials Research Group, the School of Chemistry & Physics, University of Kwazulu-Natal, Pietermaritzburg, South Africa. Adedibu C. Tella is grateful to TETFUND National Research Fund (NRF), Nigeria for the award of grant (TETF/ES/DR&D/CE/NRF-2021/SETI/SAE/00275) that supported the research.References
- S. Zhang, Z. Chu, C. Yin, C. Zhang, G. Lin and Q. Li, J. Am. Chem. Soc., 2013, 135, 5709–5716 CrossRef CAS PubMed.
- P.-H. Tong, L. Zhu, Y. Zang, J. Li, X.-P. He and T. D. James, Chem. Commun., 2021, 57, 12098–12110 RSC.
- W. Wang, Z. Xiao, H. Lin, R. Wang, L. Zhang and D. Sun, RSC Adv., 2016, 6, 16575–16580 RSC.
- S. Kitagawa, R. Kitaura and S. Noro, Angew. Chem., Int. Ed., 2004, 43, 2334–2375 CrossRef CAS PubMed.
- S. Svenson, ACS Symp. Ser., 2004, 879, 2–23 CrossRef CAS.
- O. M. Yaghi, M. O'Keeffe, N. W. Ockwig, H. K. Chae, M. Eddaoudi and J. Kim, Nature, 2003, 423, 705–714 CrossRef CAS PubMed.
- A. C. Tella, S. O. Owalude, S. J. Olatunji, V. O. Adimula, S. E. Elaigwu, L. O. Alimi, P. A. Ajibade and O. S. Oluwafemi, J. Environ. Sci., 2018, 64, 264–275 CrossRef CAS PubMed.
- A. C. Tella, M. D. Olawale, M. Neuburger and J. A. Obaleye, J. Solid State Chem., 2017, 255, 157–166 CrossRef CAS.
- A. C. Tella, S. O. Owalude, C. A. Ojekanmi and O. S. Oluwafemi, New J. Chem., 2014, 38, 4494–4500 RSC.
- A. C. Tella, A. Y. Isaac, H. S. Clayton, A. S. Ogunlaja, A. T. Venugopalan, M. Prabu and R. Thirumalaiswamy, Inorganics, 2022, 10, 100 CrossRef CAS.
- M. B. Lalonde, O. K. Farha, K. A. Scheidt and J. T. Hupp, ACS Catal., 2012, 2, 1550–1554 CrossRef CAS.
- K. S. Jeong, Y. B. Go, S. M. Shin, S. J. Lee, J. Kim, O. M. Yaghi and N. Jeong, Chem. Sci., 2011, 2, 877 RSC.
- L. Ma, C. Abney and W. Lin, Chem. Soc. Rev., 2009, 38, 1248 RSC.
- H. Yamazaki, A. Shouji, M. Kajita and M. Yagi, Coord. Chem. Rev., 2010, 254, 2483–2491 CrossRef CAS.
- K. Sasan, Q. Lin, C. Mao and P. Feng, Chem. Commun., 2014, 50, 10390 RSC.
- M. Sarker, S. Shin and S. H. Jhung, ACS Omega, 2019, 4, 9860–9867 CrossRef CAS PubMed.
- A. C. Tella, S. E. Eliagwu, M. Amali, A. T. Kola-Mustapha, S. J. Olatunji, F. Ishola, V. O. Adimula and O. S. Oluwafemi, Chem. Pap., 2020, 74, 2287–2296 CrossRef CAS.
- A. C. Tella, J. A. Obaleye, M. D. Olawale, J. M. Vianney Ngororabanga, A. S. Ogunlaja and S. A. Bourne, C. R. Chim., 2019, 22, 3–12 CrossRef CAS.
- A. C. Tella, M. D. Olawale, A. O. Oyediran and A. B. Alabi, J. Chem. Soc. Niger., 2020, 45, 94–99 Search PubMed.
- D. Zhao, J.-L. Shui, C. Chen, X. Chen, B. M. Reprogle, D. Wang and D.-J. Liu, Chem. Sci., 2012, 3, 3200 RSC.
- A. Bousseksou, G. Molnár, L. Salmon and W. Nicolazzi, Chem. Soc. Rev., 2011, 40, 3313 RSC.
- J. Zhang, S. Chen, H. Valle, M. Wong, C. Austria, M. Cruz and X. Bu, J. Am. Chem. Soc., 2007, 129, 14168–14169 CrossRef CAS PubMed.
- G. Sun, Y. Song, Y. Liu, X. Tian, H. Huang, Y. Zhu, Z. Yuan, X. Feng, M. Luo, S. Liu, W. Xu and F. Luo, CrystEngComm, 2012, 14, 5714 RSC.
- Y.-W. Li, H. Ma, Y.-Q. Chen, K.-H. He, Z.-X. Li and X.-H. Bu, Cryst. Growth Des., 2011, 12, 189–196 CrossRef.
- K. Biradha, A. Ramanan and J. J. Vittal, Cryst. Growth Des., 2009, 9, 2969–2970 CrossRef CAS.
- O. M. Yaghi, G. Li and H. Li, Nature, 1995, 378, 703–706 CrossRef CAS.
- B. K. Tripuramallu, P. Manna, S. Nagaprasad Reddy and S. K. Das, Cryst. Growth Des., 2011, 12, 777–792 CrossRef.
- P. Pachfule, B. K. Balan, S. Kurungot and R. Banerjee, Chem. Commun., 2012, 48, 2009 RSC.
- S. Dalai, P. S. Mukherjee, E. Zangrando, F. Lloret and N. R. Chaudhuri, J. Chem. Soc., Dalton Trans., 2002, 6, 822–823 RSC.
- A. L. Pochodylo and R. L. LaDuca, Zeitschrift für anorganische und allgemeine Chemie, 2010, 636, 2568–2573 CrossRef CAS.
- D. P. Martin, M. R. Montney, R. M. Supkowski and R. L. LaDuca, Cryst. Growth Des., 2008, 8, 3091–3097 CrossRef CAS.
- P. S. Mukherjee, S. Konar, E. Zangrando, T. Mallah, J. Ribas and N. R. Chaudhuri, Inorg. Chem., 2003, 42, 2695–2703 CrossRef CAS PubMed.
- G. A. Farnum and R. L. LaDuca, Acta Crystallogr., Sect. E: Struct. Rep. Online, 2008, 64, m1603 CrossRef CAS PubMed.
- R. Vaidhyanathan, S. Natarajan and C. N. R. Rao, Cryst. Growth Des., 2003, 3, 47–51 CrossRef CAS.
- S. Sharma, S. Dutta, G. K. Dam and S. K. Ghosh, Chem.–Asian J., 2021, 16, 2569–2587 CrossRef CAS PubMed.
- A. L. Gavrilova and B. Bosnich, Chem. Rev., 2004, 104, 349–384 CrossRef CAS PubMed.
- P. Wang, Y. Yuan, K. Xu, H. Zhong, Y. Yang, S. Jin, K. Yang and X. Qi, Bioact. Mater., 2021, 6, 916–927 CAS.
- N. Singh and A. Thakur, Mater. Today: Proc., 2021, 50, 1906–1911 Search PubMed.
- A. E. Angkawijaya, V. Bundjaja, S. P. Santoso, A. W. Go, S.-P. Lin, K.-C. Cheng, F. E. Soetaredjo and S. Ismadji, Biomater. Adv., 2023, 146, 213269 CrossRef CAS PubMed.
- Z. Hasan, E.-J. Choi and S. H. Jhung, Chem. Eng. J., 2013, 219, 537–544 CrossRef CAS.
- F. Ke, L.-G. Qiu, Y.-P. Yuan, F.-M. Peng, X. Jiang, A.-J. Xie, Y.-H. Shen and J.-F. Zhu, J. Hazard. Mater., 2011, 196, 36–43 CrossRef CAS PubMed.
- Z. Q. Yin, S. Wan, J. Yang, M. Kurmoo and M.-H. Zeng, Coord. Chem. Rev., 2017, 378, 500–512 CrossRef.
- S. Mukherjee, S. Dutta, Y. D. More, S. Fajal and S. K. Ghosh, Dalton Trans., 2021, 50, 17832–17850 RSC.
- Y. Qin, M. Hao, D. Wang and Z. Li, Dalton Trans., 2021, 50, 13201–13215 RSC.
- O. V. Dolomanov, L. J. Bourhis, R. J. Gildea, J. A. K. Howard and H. Puschmann, J. Appl. Crystallogr., 2009, 42, 339–341 CrossRef CAS.
- G. M. Sheldrick, Acta Crystallogr., Sect. A: Found. Adv., 2015, 71, 3–8 CrossRef PubMed.
- G. M. Sheldrick, Acta Crystallogr., Sect. A: Found. Crystallogr., 2008, 64, 112–122 CrossRef CAS PubMed.
- Q.-Z. Zhang, X. He, Y.-Q. Yu, S.-M. Chen and C.-Z. Lu, Zeitschrift für anorganische und allgemeine Chemie, 2005, 631, 798–802 CrossRef CAS.
- S. Hussain, S. Muhammad, X. Chen, M. Akkurt, A. M. Alshehri, S. U. Din, H. Ullah and A. G. Al-Sehemi, Russ. J. Inorg. Chem., 2020, 65, 368–377 CrossRef.
- A. C. Tella, S. O. Owalude, P. A. Ajibade, N. Simon, S. J. Olatunji, M. S. M. Abdelbaky and S. Garcia-Granda, J. Mol. Struct., 2016, 1125, 570–575 CrossRef CAS.
- S. Sengupta, O. Pandey, J. Kumar, P. Gajendra and K. Pandey, Indian J. Chem., Sect. A: Inorg., Bio-inorg., Phys., Theor. Anal. Chem., 2001, 40A, 887–890 CAS.
- A. Şengül and O. Büyükgüngör, Acta Crystallogr., Sect. C: Cryst. Struct. Commun., 2005, 61, m119–m121 CrossRef PubMed.
- R. Kumar, T. Guchhait, V. Subramaniyan and G. Mani, J. Mol. Struct., 2019, 1195, 1–9 CrossRef CAS.
- M. A. Spackman and D. Jayatilaka, CrystEngComm, 2009, 11, 19–32 RSC.
- Organic Spectroscopy: Principles And Applications, 2/E by J. Mohan: New N.A. (2018) | Books in my Basket, https://www.abebooks.com/servlet/BookDetailsPL?bi=30606439474%26cm_sp=rec-_-pd_hw_o_1-_-bdp%26reftag=pd_hw_o_1, accessed 12 January 2023.
- S. Jain, T. A. Khan, Y. P. Patil, D. Pagariya, N. Kishore, S. Tapryal, A. D. Naik and S. G. Naik, J. Photochem. Photobiol., B, 2017, 174, 35–43 CrossRef CAS PubMed.
- A. Harchani and A. Haddad, Theor. Chem. Acc., 2018, 137, 90 Search PubMed.
- S. Shyamapada, M. Christoph and S. Mitra, Acta Chim. Slov., 2016, 63, 129–137 CrossRef PubMed.
- P. Horcajada, C. Serre, M. Vallet-Regí, M. Sebban, F. Taulelle and G. Férey, Angew. Chem., Int. Ed., 2006, 45, 5974–5978 CrossRef CAS PubMed.
- M. C. Bernini, D. Fairen-Jimenez, M. Pasinetti, A. J. Ramirez-Pastor and R. Q. Snurr, J. Mater. Chem. B, 2014, 2, 766–774 RSC.
- R. Babarao and J. Jiang, J. Phys. Chem. C, 2009, 113, 18287–18291 CrossRef CAS.
- M. O. Rodrigues, M. V. de Paula, K. A. Wanderley, I. B. Vasconcelos, S. Alves and T. A. Soares, Int. J. Quantum Chem., 2012, 112, 3346–3355 CrossRef CAS.
- P. Horcajada, T. Chalati, C. Serre, B. Gillet, C. Sebrie, T. Baati, J. F. Eubank, D. Heurtaux, P. Clayette, C. Kreuz, J.-S. Chang, Y. K. Hwang, V. Marsaud, P.-N. Bories, L. Cynober, S. Gil, G. Férey, P. Couvreur and R. Gref, Nat. Mater., 2009, 9, 172–178 CrossRef PubMed.
- P. Horcajada, C. Serre, G. Maurin, N. A. Ramsahye, F. Balas, M. Vallet-Regí, M. Sebban, F. Taulelle and G. Férey, J. Am. Chem. Soc., 2008, 130, 6774–6780 CrossRef CAS PubMed.
- R. Bueno-Perez, A. Martin-Calvo, P. Gómez-Álvarez, J. J. Gutiérrez-Sevillano, P. J. Merkling, T. J. H. Vlugt, T. S. van Erp, D. Dubbeldam and S. Calero, Chem. Commun., 2014, 50, 10849–10852 RSC.
- K. Sun, L. Li, X. Yu, L. Liu, Q. Meng, F. Wang and R. Zhang, J. Colloid Interface Sci., 2017, 486, 128–135 CrossRef CAS PubMed.
- X. Liu, Y. Wang, J. Yuan, X. Li, S. Wu, Y. Bao, Z. Feng, F. Ou and Y. He, Bioengineering, 2022, 9, 517 CrossRef CAS PubMed.
- A. C. Oladipo, A. D. Aderibigbe, V. T. Olayemi, P. A. Ajibade, H. S. Clayton, G. J. Clarkson, R. I. Walton and A. C. Tella, J. Photochem. Photobiol., A, 2024, 448, 115331 CrossRef CAS.
- M. Vesali-Naseh, M. R. Vesali Naseh and P. Ameri, J. Cleaner Prod., 2021, 291, 125917 CrossRef CAS.
- Y. Zheng, F. Rao, M. Zhang, J. Li and W. Huang, Cleaner Engineering and Technology, 2021, 5, 100344 CrossRef.
- M. A. Ghasemzadeh, M. H. Abdollahi-Basir and B. Mirhosseini-Eshkevari, Green Chem. Lett. Rev., 2018, 11, 47–53 CrossRef CAS.
Footnote |
| † Electronic supplementary information (ESI) available. CCDC 2192001. For ESI and crystallographic data in CIF or other electronic format see DOI: https://doi.org/10.1039/d4ra03678f |
| This journal is © The Royal Society of Chemistry 2024 |


