 Open Access Article
Mesoporous silica stabilized perovskite quantum dots for the preparation of ultra-stable green flexible film
Fei Maa,
Yanrui Yang a,
Guanwei Jiaoa,
Shengnan Lia,
Xianglin Menga,
Jiahao Songa and
Lin Zhang*ab
aFuyang Normal University, China. E-mail: 715zhanglin@163.com
bConversion and Pollution Prevention of Anhui Educational Institutions, Fuyang Normal University, China
First published on 13th August 2024
Abstract
CsPbBr3 perovskite quantum dots (QDs) have attracted much attention in the optical field because of their low band gap, wide absorption spectrum and high color purity. However, their poor stability in extreme environments such as water, light and heat severely limits their application in optical fields. Here, we prepared m-SiO2/CsPbBr3 composite luminescent material using an aqueous phase method combined with high temperature calcination. The material can retain 87% of the initial photoluminescence quantum efficiency after 60 days of storage under ambient conditions (humidity ∼80%; temperature ∼25 °C), its photoluminescence intensity only decreased by 33% after immersion in water for 90 min. This indicates that the material retains good stability under a high humidity environment. Finally, PMMA@m-SiO2/CsPbBr3 flexible films were prepared by aqueous solution polymerization. The flexible film has excellent green light emission properties and exhibits (0.092, 0.625) CIE coordinates.
1. Introduction
All-inorganic cesium-lead-halide perovskite quantum dots (QDs) with the molecular formula CsPbX3 (X = Cl, Br, I) have demonstrated great potential in the fields of optoelectronics and bio-imaging due to their excellent optical and electrical properties, such as high photoluminescence quantum yields (PLQYs), a wide spectral response range, narrow emission bands, and high light absorption coefficients.1–3 Based on these excellent performances, perovskite QDs are widely used in solar cells,4–6 light-emitting diodes,7–9 backlit displays,10,11 and lasers and other devices.12 However, the poor stability of perovskite-based materials against extreme environments such as polarity, light, oxygen and heat has greatly hindered their practical applications.13–16 Despite many efforts, the stability problem of perovskite-based materials has not been completely solved.In recent years, researchers have proposed many methods to improve the stability of perovskite-based materials, including ligand modification,17,18 inorganic material encapsulation,19,20 polymer encapsulation,21,22 and ion doping.23–25 Wu et al. successfully prepared stable monodisperse CsPbX3 QDs using the branched capping ligand trioctylphosphine oxide (TOPO). The CsPbX3 QDs modified by TOPO ligand showed excellent resistance to ethanol washing.26 Compared to ligand modification, inorganic material coating can provide higher stability to perovskite-based materials. He et al., obtained CsPbBr3–SiO2 NSs with high emission efficiency, solution dispersion, stability and uniform size by growing perovskite QDs directly inside K2CO3-sintered mesoporous silica nanospheres (NSs), which were completely isolated from the external environment.27 In addition, polymer encapsulation is also able to provide decent stability for perovskite-based materials. Wang et al., used polymer nanofibers as a protective layer to synthesize chemically and structurally stable CsPbBr3 perovskite materials, exhibiting improved air and light stability.28 Ion doping is used to stabilize perovskite QDs by substituting or partially substituting the A-site or B-site ions of perovskite-like materials. He et al., reported an Mn2+ doped hydrothermal synthesis of highly luminescent CsCdCl3 single crystals, and the synthesized crystals exhibited stable photoluminescence at both high temperature (423 K) and high humidity.29 Despite the great progress in stabilizing perovskite QDs, the long-term stability of halide perovskites is still affected by environmental factors, leading to a decrease in the intensity of their photoluminescence, or even to quenching.30 Therefore, there is a need to continue to explore ways to stabilize perovskite QDs to improve or even overcome the problems in stability of perovskite QDs.
In this paper, we prepared highly luminescent and stable m-SiO2/CsPbBr3 composites capped with mesoporous silica (m-SiO2) using a combination of an aqueous phase method and high temperature calcination. The m-SiO2/CsPbBr3 composites exhibits excellent tolerance in environments such as high humidity and water, and achieves a photoluminescence quantum efficiency of up to 82.34%. Based on this, we prepared a PMMA@m-SiO2/CsPbBr3 composite green luminescent flexible film by pre-dispersing m-SiO2/CsPbBr3 composites in methyl methacrylate (MMA) using aqueous solution polymerization. The PMMA@m-SiO2/CsPbBr3 flexible film prepared by this method exhibited excellent green light-emitting properties with CIE coordinates of (0.092, 0.625), showing potential for light-emitting device applications.
2. Experimental methods
2.1. Materials and chemicals
Cesium bromide (CsBr, 99.9%), lead bromide (PbBr2, 99.9%), cetyltrimethylammonium bromide (CTAB, 99%), sodium hydroxide (NaOH, ≥96%), tetraethyl orthosilicate (TEOS, AR), methyl methacrylate (MMA, AR), azobisisobutyronitrile (AIBN, AR), stearic acid (C18H36O2, AR), anhydrous ethanol (C2H5OH, AR). All chemicals were used without further purification.2.2. Preparation of m-SiO2
First, 1.00 g CTAB, 400 ml deionized water and 80 ml anhydrous ethanol were mixed in a beaker and strictly sealed, and then ultrasonicated for 15 min at room temperature. 3.5 ml of 2 M NaOH solution was added, and then stirred in a water bath at 80 °C for 30 min. Then 5.0 ml LTEOS was dropped into the above solution, and after stirring the whole for 2 h, a flocculent solution was obtained. Finally, the solid was collected by suction filtration and washed with deionized water several times until all impurities were removed. After drying at 80 °C for 3 h, it was ground into powder, and the powder was transferred to a muffle furnace for calcination at 550 °C for 6 h to obtain white m-SiO2 powder.2.3. Synthesis of CsPbBr3 QDs and m-SiO2/CsPbBr3 composites
First, 0.3 mmol CsBr and 0.3 mmol PbBr2 were dissolved in 25 ml of deionized water and sonicated for 15 min until the solution was clarified. The mixture was stirred continuously at 80 °C until dry. The powder was collected and calcined in a muffle furnace at 600 °C for 30 min to obtain CsPbBr3 QDs. For m-SiO2/CsPbBr3 composites, 521.85 mg of m-SiO2 (mass ratio of CsBr/PbBr2![[thin space (1/6-em)]](https://www.rsc.org/images/entities/char_2009.gif) :
:![[thin space (1/6-em)]](https://www.rsc.org/images/entities/char_2009.gif) MSNs = 1
MSNs = 1![[thin space (1/6-em)]](https://www.rsc.org/images/entities/char_2009.gif) :
:![[thin space (1/6-em)]](https://www.rsc.org/images/entities/char_2009.gif) 3) pre-dispersed in 10 ml of deionized water was added to the above solution, and the other steps were the same as those for the preparation of the CsPbBr3 QDs were the same.
3) pre-dispersed in 10 ml of deionized water was added to the above solution, and the other steps were the same as those for the preparation of the CsPbBr3 QDs were the same.
2.4. Preparation of PMMA@m-SiO2/CsPbBr3 flexible film
First, add 0.3 g m-SiO2/CsPbBr3 powder and appropriate amount of MMA to the agate mortar and grind until the composite is uniformly dispersed in MMA and MMA is volatilized completely. The treated samples, 0.03 g AIBN and 53 ml MMA were dissolved in 100 ml three-neck flask and ultrasonic for 2 h. Then heat up to 80 °C in a water bath and keep the reaction. When the prepolymer becomes viscous, add 0.3 g stearic acid immediately and stir to dissolve it. Remove the heat source, pour the product into the self-made cuboid mold and seal it in the 90 °C oven. After drying for 2 h, the mold was removed and the PMMA@m-SiO2/CsPbBr3 flexible film was obtained.2.5. Characterization
The material was physically characterized using a SmartLab SEX-ray powder diffractometer. Fourier transform infrared (FTIR) spectra of the materials were obtained using a Nicolet iS50 FTIR spectrometer. The emission spectra, excitation spectra, and time-resolved photoluminescence spectra of the materials were measured with a HORIBA FluoroMax-4 near-infrared full-featured steady state transient fluorometer at 365 nm under laser and xenon lamps, respectively, and the photoluminescence quantum yields of the materials were obtained with an integrating sphere. The thermal weight loss curves of the materials were obtained using an SDT Q600 simultaneous thermal analyzer (TG-DSC) at an N2 flow rate of 100 ml min−1 and a heating rate of 20 °C min−1. The microscopic morphology of the materials was observed using a Tecnai G2 F30 S-TWIN transmission electron microscope. The contact angle of the flexible films was measured using a JC2000D1 contact angle meter. The specific surface area and pore size information of the material were analyzed using a fully automatic gas adsorption analyzer (Autosorb-iQ).3. Results and discussion
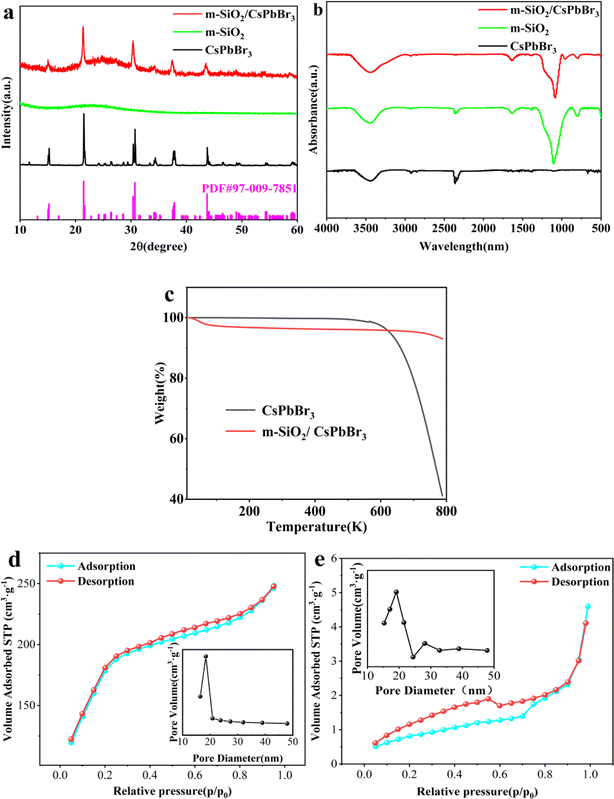
Since m-SiO2 has a regular pore structure, it provides abundant growth sites for perovskite QDs. Under the aqueous solution method CsBr and PbBr2 enter into the pores of m-SiO2 and grow in the pores to form CsPbBr3 QDs, which makes the CsPbBr3 QDs get some protection. Then the m-SiO2/CsPbBr3 composite powder was calcined at 600 °C, which led to the sealing of the pores of m-SiO2, and thus the CsPbBr3 QDs were completely enclosed in the m-SiO2 pores, which further enhanced the luminescence performance and stability of the CsPbBr3 QDs.31 Then poly(methyl methacrylate) (PMMA) was synthesized by in situ radical reaction, in which the m-SiO2/CsPbBr3 composite powder was pre-dispersed in methyl methacrylate, and PMMA@m-SiO2/CsPbBr3 flexible film were obtained by drying at 90 °C.To demonstrate the successful composite of m-SiO2 with CsPbBr3 QDs, Fig. 1a shows the XRD patterns of CsPbBr3 QDs, m-SiO2 and m-SiO2/CsPbBr3 composites. For m-SiO2 there is a broadening diffraction peak at 2θ = 20°–30°, which is a characteristic peak of amorphous silica. And for m-SiO2/CsPbBr3 composite, the characteristic peak of amorphous silica was also observed at 2θ = 20°–30°. And the characteristic peaks of cubic phase CsPbBr3 QDs were observed at 2θ = 15.08°, 21.40°, 30.36°, 37.50° and 43.54°, which corresponded to the (100), (110), (200), (211), and (220) crystallographic facets of the cubic CsPbBr3 (PDF#97-009-7851), respectively. This indicates that the CsPbBr3 QDs are well crystallized. These results indicate that m-SiO2 was successfully complexed with CsPbBr3 QDs.
Fig. 1b compares the Fourier transform infrared (FTIR) spectra of CsPbBr3 QDs, m-SiO2 and m-SiO2/CsPbBr3 composites. In the IR spectra of m-SiO2 and m-SiO2/CsPbBr3 composites, the absorption band at 800 cm−1 corresponds to the Si–O symmetric stretching vibration, and the strong and broad absorption band at 1100 cm−1 is the Si–O–Si antisymmetric stretching vibration peak, and the peak near 1635 cm−1 is the H–O–H bending vibration peak of water. The strong absorption band at 3444 cm−1 for the three samples is the absorption peak from the hydrogen-bonding antisymmetric stretching vibration of the residual water in the air. The FTIR patterns showed that the CsPbBr3 QDs successfully entered into the apertures of m-SiO2.
The thermogravimetric (TG) analysis curves of CsPbBr3 QDs and m-SiO2/CsPbBr3 composites were obtained under the condition of N2 flow rate 100 ml min−1 and heating rate 20 °C min−1, as shown in Fig. 1c. There was almost no mass loss of CsPbBr3 QDs before 511 °C, and the rapid loss after 511 °C was caused by the decomposition of CsPbBr3 QDs at high temperatures. However, due to the unfixed melting point of m-SiO2, the weight loss in m-SiO2/CsPbBr3 composites is slow from 80 °C to 800 °C, and the main mass loss comes from the thermal decomposition behavior of CsPbBr3 QDs in m-SiO2/CsPbBr3 composites at high temperature.32 The TG curves also showed that the m-SiO2/CsPbBr3 composites has excellent thermal stability. In addition, the melting point of nanomaterials decreases with their size, so the weight loss onset temperature of the composites is lower than that of CsPbBr3 QDs, which also proves that the size of CsPbBr3 QDs in m-SiO2/CsPbBr3 composites is smaller than that of CsPbBr3 QDs.
In addition, we obtained the specific surface area and pore size distribution of m-SiO2 and m-SiO2/CsPbBr3 composites by nitrogen isothermal adsorption–desorption curves (Fig. 1d and e). According to the IUPAC definition, both materials are mesoporous. m-SiO2 has a large specific surface area, but when CsPbBr3 QDs are added, the specific surface area decreases significantly. This indicates that the CsPbBr3 QDs nucleate and grow inside the pore size of m-SiO2, filling the pore size of m-SiO2.
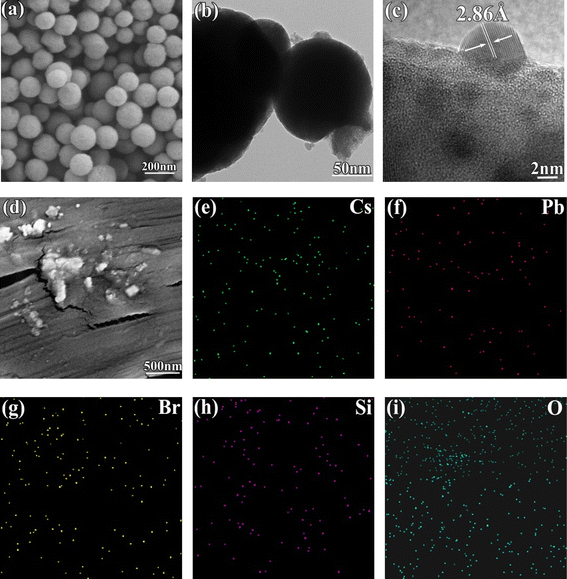
In order to observe the microscopic morphology of m-SiO2/CsPbBr3 composites and PMMA@m-SiO2/CsPbBr3 flexible film, scanning electron microscopy (SEM) and transmission electron microscopy (TEM) tests were performed, as shown in Fig. 2. Fig. 2a shows the SEM picture of m-SiO2, which is mainly distributed in the size of the material in the interval of 100–150 nm. m-SiO2 has a regular pore structure, which provides a channel for CsPbBr3 QDs to enter into the interior of m-SiO2. Fig. 2b shows the TEM image of the m-SiO2/CsPbBr3 composites, and some CsPbBr3 QDs can be seen distributed on the surface. In order to see the CsPbBr3 QDs composited in m-SiO2 more clearly, we performed a high magnification TEM (HRTEM) test (Fig. 2c), and it is very clear to see the diameter of about 3–5 nm of the CsPbBr3 QDs. And the CsPbBr3 QDs show very clear lattice stripes, and by measuring the lattice spacing, we found that the lattice spacing is 2.86 Å, which corresponds to the (200) crystallographic plane of cubic CsPbBr3 QDs. In addition, we performed energy dispersive X-ray spectroscopy (EDS) tests on the PMMA@m-SiO2/CsPbBr3 flexible film after PMMA encapsulation (Fig. 2d–h), where Fig. 2e–h show the distribution of different elements in the whole area of Fig. 2d, respectively. EDS indicates that the elements of Cs, Pb, Br, Si and O are uniformly distributed in Fig. 2d, which indicates that the m-SiO2/CsPbBr3 composite is uniformly distributed in PMMA. In addition, the distribution of Cs, Pb, Br elements is less, which indicates that there are fewer CsPbBr3 QDs exposed on the surface of PMMA, and most of the CsPbBr3 QDs are encapsulated inside PMMA.
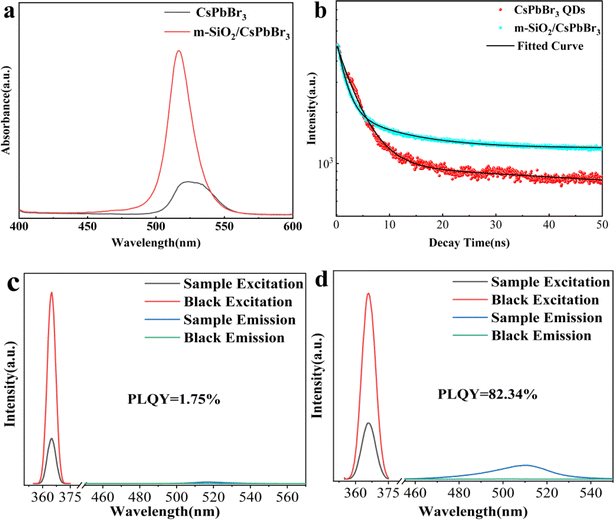
The luminescence properties of CsPbBr3 QDs and m-SiO2/CsPbBr3 composites were investigated by PL spectroscopy. Fig. 3a shows the PL spectra measured at 365 nm as the excitation wavelength. For CsPbBr3 QDs, the emission peak position is 523 nm with a half-height width (FWHM) of 33 nm, whereas the emission peak of the m-SiO2/CsPbBr3 composites is at 516 nm with a FWHM of 20 nm. The emission peak position undergoes a blue-shift of 7 nm due to the fact that CsPbBr3 QDs growth inside the m-SiO2 pores decreases its particle size leading to the enhancement of quantum confinement effect.33 In addition, the FWHM of the m-SiO2/CsPbBr3 composites is much narrower than that of CsPbBr3 QDs, which suggests that the single crystals of CsPbBr3 QDs grown inside the m-SiO2 pores have a high crystalline quality, which is in agreement with the test results of XRD.
Fig. 3b shows the time-resolved PL decay plots of CsPbBr3 QDs and m-SiO2/CsPbBr3 composites, and the fluorescence lifetime decay curves were obtained by fitting using a double exponential function as in eqn (1).
 | (1) |
 | (2) |
The average lifetimes of CsPbBr3 QDs and m-SiO2/CsPbBr3 composites are calculated to be 4.08 ns and 13.52 ns, respectively. m-SiO2/CsPbBr3 composites have significantly stronger decay lifetimes than CsPbBr3 QDs, which suggests that the combination of m-SiO2 with CsPbBr3 QDs enhances the CsPbBr3 QDs stability and effectively suppresses the non-radiative complex jump, which also implies that the CsPbBr3 QDs filled into the silica pores are effectively passivated.
Fig. 3c and d shows the PLQY plots of CsPbBr3 QDs and m-SiO2/CsPbBr3 composites. For CsPbBr3 the PLQY is only 1.75%, but the m-SiO2/CsPbBr3 composites are as high as 82.34%, indicating that the PLQY of the CsPbBr3 QDs is significantly enhanced after composite with m-SiO2. For CsPbBr3 QDs tend to aggregate into solids in air, forming surface defects and vacancies, which leads to the decrease of PLQY. However, for m-SiO2/CsPbBr3 composites, the CsPbBr3 QDs grow inside the pores of m-SiO2 and the pores are closed under high-temperature calcination, which provides excellent protection and isolation of the CsPbBr3 QDs, effectively preventing the aggregation of the CsPbBr3 QDs, and thus greatly enhancing the PLQY of the composites.
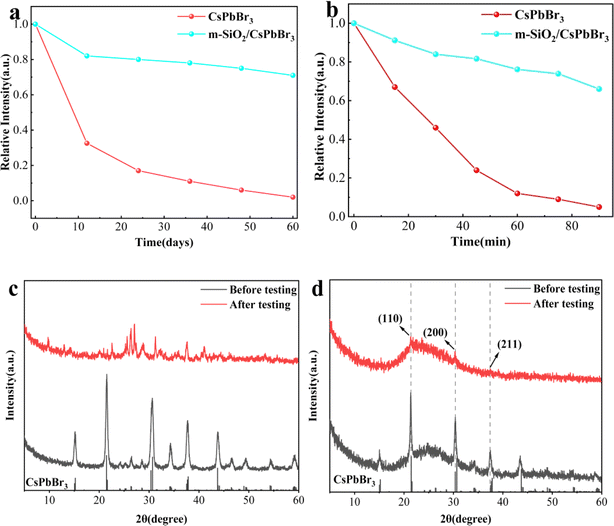
It is well known that the crystal structure of perovskite materials is very easy to be broken under high humidity and high temperature environments, which leads to its fluorescence burst, and this is the main reason for restricting the practical application of perovskite materials. Therefore, overcoming these difficulties is crucial for the practical application of perovskite materials in the field of optoelectronics. Fig. 4a shows the change of relative PL strength of CsPbBr3 QDs and m-SiO2/CsPbBr3 composites stored in air environment (temperature of 25 °C and humidity of ∼60%) for 60 days. It is found that with the increase of exposure time in air, the PL strength of CsPbBr3 QDs decreases sharply, while the PLQY of m-SiO2/CsPbBr3 composites decreases slightly. The m-SiO2/CsPbBr3 composite materials maintained 70% of the initial PL strength after 60 days of storage, while the PL strength of CsPbBr3 QDs remained only 10% of the initial PL strength after 60 days.
In order to verify the change of relative PL strength of CsPbBr3 QDs and m-SiO2/CsPbBr3 composites in water environment, the water stability test was carried out (Fig. 4b). Both of them were immersed in 5 ml water respectively, and the change of relative PL intensity in 90 min was observed. With the extension of immersion time, the PL strength of CsPbBr3 QDs decreased rapidly, and only less than 5% of the initial PL strength was retained after 90 min. However, m-SiO2/CsPbBr3 composites showed a weak downward trend, and maintained 66% of the original luminous intensity after 90 min. Compared with CsPbBr3 QDs, the water tolerance of m-SiO2/CsPbBr3 composites is significantly enhanced, which is due to the coating effect of m-SiO2 on CsPbBr3 QDs.
In addition, the XRD phase diagrams of CsPbBr3 QDs and m-SiO2/CsPbBr3 composites before and after testing were analyzed. Fig. 4c shows the change of XRD spectrum of CsPbBr3 QDs after stability test. It can be seen that the cubic phase of CsPbBr3 QDs has been transformed into orthogonal phase after stability test. For m-SiO2/CsPbBr3 composites (Fig. 4d), the cubic phase is still maintained after stability tests, which also shows that m-SiO2/CsPbBr3 composites have excellent stability in extreme environments.
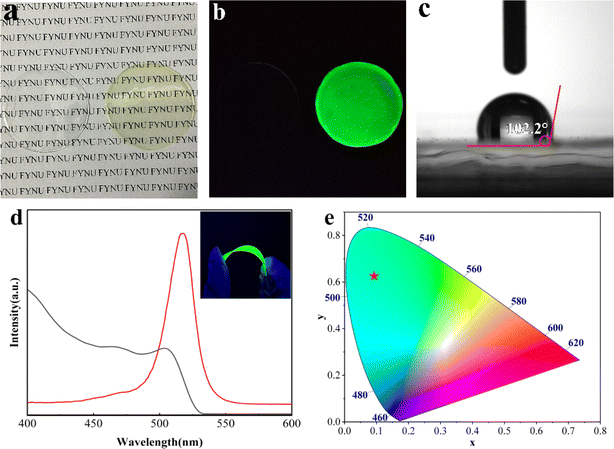
Thanks to the excellent properties of m-SiO2/CsPbBr3 composites and good stability under water and long time storage, PMMA@m-SiO2/CsPbBr3 flexible film were obtained by encapsulating m-SiO2/CsPbBr3 composites in PMMA. Fig. 5a and b show the photos of PMMA@m-SiO2/CsPbBr3 composite luminescent flexible film under natural light and 365 nm UV light, respectively. It can be seen that the PMMA@m-SiO2/CsPbBr3 flexible film is basically indistinguishable from PMMA organic glass under natural light, while the PMMA@m-SiO2/CsPbBr3 flexible film shows bright green fluorescence and uniform distribution of luminescence under 365 nm UV light, which indicates that the m-SiO2/CsPbBr3 composites The dispersion in PMMA is very good, which provides a basis for the application of m-SiO2/CsPbBr3 composites in luminescent flexible film. Fig. 5c shows the contact angle test of PMMA@m-SiO2/CsPbBr3 flexible film, and the result shows that the contact angle is 102.2°, which indicates that PMMA@m-SiO2/CsPbBr3 composite luminescent flexible film has a good water-repellent property. Fig. 5d shows the PL spectra and UV absorption spectra of the PMMA@m-SiO2/CsPbBr3 flexible film, which exhibits bright green emission at 517 nm under 365 nm excitation. The forbidden bandwidth Eg = 2.32 eV of the film was calculated. Fig. 5e shows the CIE color coordinate plot of the sample, and the PMMA@m-SiO2/CsPbBr3 flexible film has a chromaticity coordinate of (0.091, 0.62), which is a pure green emission. This indicates that the PMMA@m-SiO2/CsPbBr3 flexible film has great potential for green light-emitting device applications.
4. Conclusion
In this paper, m-SiO2/CsPbBr3 composites were prepared by aqueous phase method and high temperature calcination. The encapsulation of CsPbBr3 QDs was realized by utilizing the pores of m-SiO2, which significantly improved its stability in extreme environments. In addition, the m-SiO2/CsPbBr3 composites have excellent photoluminescence performance with significantly enhanced fluorescence lifetime and PLQY of 82.34%. Therefore, we prepared PMMA@m-SiO2/CsPbBr3 flexible films with hydrophobicity and stable optical properties using PMMA with good transmittance as a substrate, which showed excellent green light emission, making the material of great potential application in optical devices.Data availability
The authors will supply the relevant data in response to reasonable requests.Author contributions
Lin Zhang – funding acquisition, conceptualization, writing – reviewing and editing; Fei Ma – writing – reviewing and editing, supervision, methodology, data curation and conceptualization; Yanrui Yang – formal analysis, methodology, investigation, validation and writing; Guanwei Jiao – methodology, investigation and writing; Shengnan Li – software, investigation and methodology. Xianglin Meng – methodology and investigation; Jiahao Song – supervision and investigation.Conflicts of interest
There are no conflicts to declare.Acknowledgements
This work is supported by the National Natural Science Foundation of China (201807012), Natural Science Research in Universities of Anhui Province (KJ2020A05250), Natural Science Research in Universities of Anhui Province (gxgnfx2021127), the Natural Science Foundation of Fuyang Normal University (rcxm202003).Notes and references
- Y. Pan, Y. Zhang, W. Kang, N. Deng, Z. Yan, W. Sun, X. Kang and J. Ni, Mater. Adv., 2022, 3, 4053–4068 RSC
.
- T. Xu, B. Liu, Z. Liu and J. Li, J. Solid State Chem., 2022, 316, 123536 CrossRef CAS
.
- Y. Zhao, C. Wang, X. Hu and J. Fan, ChemNanoMat, 2021, 7, 789–804 CrossRef CAS
.
- Y. Xu, M. Lyu and J. Zhu, Mater. Chem. Front., 2024, 8, 2029–2055 RSC
.
- S. Yang, Y. Duan, Z. Liu and S. Liu, Adv. Energy Mater., 2023, 13, 2201733 CrossRef CAS
.
- X. Liu, J. Li, X. Cui, X. Wang and D. Yang, RSC Adv., 2022, 12, 32925–32948 RSC
.
- M. Lu, J. Guo, S. Sun, P. Lu, X. Zhang, Z. Shi, W. W. Yu and Y. Zhang, Chem. Eng. J., 2021, 404, 126563 CrossRef CAS
.
- Y. Yang, S. Li, G. Jiao, B. Xue, B. Wei, F. Ma and L. Zhang, J. Mater. Sci., 2024, 59, 9237–9249 CrossRef CAS
.
- J. Zhang, C. Yin, F. Yang, Y. Yao, F. Yuan, H. Chen, R. Wang, S. Bai, G. Tu and L. Hou, J. Phys. Chem. Lett., 2021, 12, 2437–2443 CrossRef CAS
.
- K. Dave, Z. Bao, S. Nakahara, K. Ohara, S. Masada, H. Tahara, Y. Kanemitsu and R.-S. Liu, Nanoscale, 2020, 12, 3820–3826 RSC
.
- C. Yang, B. Zhuang, J. Lin, S. Wang, M. Liu, N. Jiang and D. Chen, Chem. Eng. J., 2020, 398, 125616 CrossRef CAS
.
- Y. Li, X. Zhang, H. Huang, S. V. Kershaw and A. L. Rogach, Mater. Today, 2020, 32, 204–221 CrossRef CAS
.
- Y. Wei, Z. Cheng and J. Lin, Chem. Soc. Rev., 2019, 48, 310–350 RSC
.
- B. W. Park and S. I. Seok, Adv. Mater., 2019, 31, e1805337 CrossRef PubMed
.
- L. Xu, S. Yuan, L. Ma, B. Zhang, T. Fang, X. Li and J. Song, J. Mater. Chem. A, 2021, 9, 18947–18973 RSC
.
- S. Li, Z. Shi, F. Zhang, L. Wang, Z. Ma, D. Yang, Z. Yao, D. Wu, T.-T. Xu, Y. Tian, Y. Zhang, C. Shan and X. J. Li, Chem. Mater., 2019, 31, 3917–3928 CrossRef CAS
.
- K. Zhang, M. Zhang, N. Zhu, H. Yin, J. Xing and L. Wang, J. Mater. Sci., 2021, 56, 11436–11447 CrossRef CAS
.
- S. Akhil, V. G. V. Dutt and N. Mishra, Nanoscale Adv., 2021, 3, 2547–2553 RSC
.
- J. Shi, M. Wang, H. Wang, C. Zhang, Y. Ji, J. Wang, Y. Zhou and A. S. Bhatti, Nanoscale, 2022, 14, 16548–16559 RSC
.
- Y. Yang, S. Li, J. Song, B. Xue, G. Jiao, F. Ma and L. Zhang, Appl. Surf. Sci., 2024, 664, 160262 CrossRef CAS
.
- Y. Ren, N. Zhang, Z. Arain, M. Mateen, J. Chen, Y. Sun and Z. Li, J. Power Sources, 2020, 475, 228676 CrossRef CAS
.
- W. Lv, L. Li, M. Xu, J. Hong, X. Tang, L. Xu, Y. Wu, R. Zhu, R. Chen and W. Huang, Adv. Mater., 2019, 31, e1900682 CrossRef PubMed
.
- N. Wu, Y. Zhai, P. Chang, H. Mei, Z. Wang, H. Zhang, Q. Zhu, P. Liang and L. Wang, Nanotechnology, 2023, 34, 145701 CrossRef
.
- H. Jiang, C. Zang, Y. Dong, M. Lai, S. Xu and J. Xu, Part. Part. Syst. Charact., 2023, 40, 2300032 CrossRef CAS
.
- S. Kachhap, S. Singh, A. K. Singh and S. K. Singh, J. Mater. Chem. C, 2022, 10, 3647–3676 RSC
.
- L. Wu, Q. Zhong, D. Yang, M. Chen, H. Hu, Q. Pan, H. Liu, M. Cao, Y. Xu, B. Sun and Q. Zhang, Langmuir, 2017, 33, 12689–12696 CrossRef CAS PubMed
.
- M. He, Q. Zhang, F. Carulli, A. Erroi, W. Wei, L. Kong, C. Yuan, Q. Wan, M. Liu, X. Liao, W. Zhan, L. Han, X. Guo, S. Brovelli and L. Li, ACS Energy Lett., 2022, 8, 151–158 CrossRef
.
- Q. F. Li, J. T. Wang, B. Tian, S. Kong, T. Wang and Z. Wang, Eur. J. Inorg. Chem., 2018, 2018, 4215–4220 CrossRef CAS
.
- S. He, Q. Qiang, T. Lang, M. Cai, T. Han, H. You, L. Peng, S. Cao, B. Liu, X. Jing and B. Jia, Angew. Chem., Int. Ed., 2022, 61, 1–8 Search PubMed
.
- J. Shen and Q. Zhu, Mater. Res. Bull., 2022, 156, 111987 CrossRef CAS
.
- M. He, Q. Zhang, F. Carulli, A. Erroi, W. Wei, L. Kong, C. Yuan, Q. Wan, M. Liu, X. Liao, W. Zhan, L. Han, X. Guo, S. Brovelli and L. Li, ACS Energy Lett., 2023, 8, 151–158 CrossRef CAS
.
- Q. A. Akkerman, G. Rainò, M. V. Kovalenko and L. Manna, Nat. Mater., 2018, 17, 394–405 CrossRef CAS PubMed
.
- P. Ma, Y. Hou, Z. Chen, J. Su, L. Li, N. Liu, Z. Zhang, X. Jiang, F. Long, Y. Ma and Y. Gao, Chem. Eng. J., 2021, 425, 130471 CrossRef CAS
.
| This journal is © The Royal Society of Chemistry 2024 |

