 Open Access Article
Decontamination of textile effluents via the adsorption process on various raw clay minerals enhanced by ozonation: a modeling approach and optimization
K. Hendaouia,
S. Ben Ayed a,
L. Mansourc,
A. Ben Othmanb and
F. Ayari
 *a
*a
aFaculty of Sciences of Bizerte, LR 05/ES09 Laboratory of Applications of Chemistry to Resources and Natural Substances and to the Environment (LACReSNE), Carthage University, Zarzouna 7021, Tunisia. E-mail: fadhilaayari@yahoo.fr
bSchool of Chemistry Polymers Materials, Molecular Design Laboratory, EPCM-ULP-CNRS, 25 Rue Becquerel, F-67087 Strasbourg, France
cDepartment of Zoology, College of Science, King Saud University, P.O. Box 2455, Riyadh 11451, Saudi Arabia
First published on 27th November 2024
Abstract
This study seeks to characterize three different clays and compare their capability to decontaminate a textile effluent using the adsorption process and to explore the synergistic effects of ozonation on the treatment. Response surface methodology, based on central composite design, was used to investigate the impact of three key parameters, namely, solution pH, clay dosage, and contact time, on the adsorption process. The three clays were sourced from distinct regions across Tunisia: Rommana, Tabarka, and Medenine. The analysis of the clays revealed that the Rommana green clay (RGC) was predominantly composed of smectite, the Tabarka white clay (TWC) was rich in kaolinite, and the Medenine red clay (MRC) contained a combination of illite and kaolinite. Under optimal conditions for color removal, the attained efficiencies for removing color, chemical oxygen demand (COD), and total suspended solids (TSS) were as follows: 86.89%, 57.2% and 80.7% for RGC; 80.56%, 55.02% and 75.28% for TWC; and 81.7%, 56.8% and 75.5% for MRC, respectively. Results show that RGC exhibited the highest adsorption percent of dye removal (≅87%) at the optimal conditions evaluated via the CCD design of the response surface methodology (pH ≈ 3.98, adsorbent dose 7 g L−1, contact time = 89 min). The enhancement of the adsorption process through ozonation achieved color removal efficiencies of 98.2%, COD removal efficiencies of 71.4%, and TSS removal efficiencies of 89.3% for RGC; 98.15%, 70.13%, and 88.74% for TWC; and 98.3%, 70.32%, and 88.56% for MRC, respectively, in compliance with the Tunisian standard for river discharge. The treated effluent can be used in the irrigation of saline plants.
1. Introduction
Colors are used at a large scale in industries for increasing the attractiveness of articles. The textile and finishing, paper and pulp, automotive and pharmaceutical sectors use large amounts of dyes to achieve the desired color. Finally, they dispose the used wastewater loaded with residual quantities of dyes in the environment.1,2 In 2017, the Tunisian textile sector imported about 6580 tons of dyes against 5943 tons in 2014, about 30% of which will be discharged as effluents. These effluents have high chemical oxygen demand (COD) and high biological oxygen demand (BOD), which make them very toxic to the fauna and flora.3 Moreover, dyes and their degradation by-products are toxic to microorganisms and disturb the biological activity of biomass in water sources by reducing sunlight penetration.4 In addition, most dyes are carcinogenic, mutagenic and reported to be the cause of several health problems in humans and aquatic life. As one of the most important environmental remediation tasks today, the removal of toxicity and dyes from rejected effluents has led to the development of numerous techniques and methods for their decontamination and eradication of pollutants.5 Currently, several methods and techniques including coagulation–floculation, electrocoagulation, advanced oxidation, biological degradation, membrane filtration and adsorption are applied to treat and decontaminate industrial effluents.6 All these techniques have reported some limitations7 regarding the dye removal efficiency, operating cost and design. Biological methods need a long treatment time and large space for design, while most dyes are toxic and non-biodegradable by nature.8 Chemical coagulation–floculation technique produces a large amount of sludge, causing a lot of pollution and disposal problems.9 Chemical oxidation and advanced oxidation techniques have been reported to be quite effective for the decolorization of water. However, they generate secondary pollutants sub-products and many of them are not economically feasible.10 Finally, the membrane filtration technique can be effective for dye removal.11 However, flux decline and the waste generated with high dye content and salt as well as the expensive cost of both initial installation and maintenance are considered as the greatest restraints to such techniques. Based on the above study, the treatment techniques based on adsorption are among the most suitable methods. Indeed, they have an eco-friendly nature, low usage cost and high effectiveness for the large dyes category. Many adsorbents have been investigated and active carbon has been reported as the most effective one due to its large surface area and its porous structure. Nevertheless, its application is limited due to the high cost of manufacturing and regeneration as well as the slow adsorption kinetics.12 Alternative low-cost materials such as agricultural waste,13,14 silica,15 natural phosphate,16 algae,17 celluloses extracted from Posidonia oceanica,18 sewage sludge19 and clay minerals have been also investigated for dye adsorption due to their high adsorption capability and complexation potential,20,21 attributed to their lamellar structure, which furnishes a high specific surface area.22 Moreover, natural clays are characterized by their abundance and availability at low cost, eco-friendly nature and capability of ion exchange.23–25 However, the application of the adsorbents is restricted due to numerous problems such as the high cost of some adsorbents such as activated carbon, sludge regeneration and pollution displacement.26 Chemical oxidation using ozone (O3) is considered among the most suitable oxidation processes for textile effluent decolorization without slide generation.27 Ozone is a strong oxidizing agent capable of breaking down various organic and inorganic pollutants, including dyes, phenols, and pharmaceuticals, which are difficult to treat using conventional biological processes. Ozone's effectiveness in degrading these pollutants, coupled with its powerful disinfectant properties, allows it to eliminate bacteria, viruses, and other pathogens in wastewater without leaving behind harmful residuals such as chlorine.28 It is particularly valuable for reducing color and odor in industrial wastewater, such as those from textile and paper industries, by reacting with the complex dye molecules and converting them into simpler, colorless compounds, thus improving both the appearance and environmental quality of the effluent.29Ozone also excels at breaking down refractory organic compounds, such as endocrine disruptors, pharmaceuticals, and pesticides, which resist traditional biological treatments but can be efficiently degraded through ozonation.30 Additionally, it is often used in combination with other methods such as biological treatments, activated carbon, or advanced oxidation processes (AOPs), where ozone aids in the breakdown of large organic molecules into smaller, more biodegradable ones. This makes it easier to remove pollutants in subsequent biological treatments. When combined with hydrogen peroxide or UV, ozone produces hydroxyl radicals, which are highly reactive and effective at degrading difficult pollutants in advanced oxidation processes.31
Several studies have examined the combination of ozone with other techniques to treat textile and industrial effluents, particularly to enhance the pollutant removal efficiency. These combinations include
• Ozonation + biological rreatment
• Ozonation + coagulation–flocculation
• Ozonation + Advanced Oxidation Processes (AOPs)
• Ozonation + membrane filtration
• Ozonation + Fenton or electro-Fenton process
• Ozonation + activated carbon adsorption
These combined methods optimize wastewater treatment by improving the removal of dyes, COD, and other contaminants in textile effluents, making treatment more effective and sustainable, albeit more expensive. Combining ozonation with clay adsorption is a promising approach for textile wastewater treatment as ozonation breaks down complex dye molecules while clay adsorbs residual organic molecules and other contaminants. However, there is limited research published on this hybrid method involving ozonation and clay adsorption for textile wastewater treatment.
It should be noted that the COD values, which are crucial in wastewater treatment, depend heavily on the receiving environment. Stricter limits are generally applied for wastewater entering sensitive ecosystems such as rivers, lakes, or areas, where aquatic life and human health are at risk. COD limits vary by region and should align with local environmental regulations. In many places, these limits are similar to the World Health Organization (WHO) guidelines, with typical COD values for treated wastewater ranging from approximately 30 to 350 mg L−1, depending on the environmental sensitivity of the discharge area.
In this context, for the benefits of both an environment-friendly process and to fill the gaps of one by the other, the actual work aims to set up a database with different Tunisian clays characteristics, to study and optimize their capability for treating a real indigo dyeing and finishing effluent provided by a local company (SITEX) and to enhance its decontamination using the ozonation method in order to reuse them in the input process or agriculture.
2. Materials and methods
2.1. Wastewater samples and chemicals
tDark-blue effluent samples were collected from an equalization tank at a cotton textile mill located in Monastir, Tunisia (SITEX), specializing in fabric and yarn manufacturing, blue indigo dyeing processes (Fig. 1), and fabric finishing. The primary operations include pretreatment, dyeing, sizing, and finishing. The facility discharges approximately 700 m3 of water per day, containing a mixture of vat dyes, particularly blue indigo, along with various secondary products used in textile treatment such as hydrosulfite, salt, surfactants, wetting agents, leveling agents, softeners, and dispersing agents. Both untreated and treated samples were stored in opaque containers at temperatures ≤4 °C to prevent any alteration in their characteristics. Table 1 provides a summary of the effluent parameters before treatment.| Parameter | Value before treatment | Tunisian standard (for river discharge) |
|---|---|---|
| PH | 12.4 | 6.5–8.5 |
| DBO5 | 400 mg L−1 | 30 |
| COD | 1400 mg L−1 | 190 |
| Color | 1580 Pt–Co | 70 |
| Total suspended solids (TSS) | 200 mg L−1 | 30 |
| Oil and grease | 10 mg L−1 | 20 |
| Chloride | 2000 mg L−1 | 600 |
The chemicals used in this work to characterize the clays and to adjust the pH were of analytical grade and used without further purification.
2.2. Clay samples
The raw clays used in this study were collected from Rommana green deposit situated in the region of Gabes (south of Tunisia), Tabarka white deposit (north of Tunisia) and Medenine red deposit (south-east of Tunisia). The three raw clay samples were used as collected without additional treatment except drying at 100 °C for 24 hours to remove excess moisture and then sieving in particles sizes lower than 100 μm. The adsorbents acquired were named as follows: Rommana green clay (RGC), Tabarka white clay (TWC), and Medenine red clay (MRC).2.3. Clays characterization
X-ray diffraction (XRD) analysis of the adsorbent was carried out using an X-ray diffractometer with Cu–Kα radiation, λ = 0.154056 nm, 2θ range 3–65°. The purified samples were used to identify the relative percentage of different clay natures using the X'pert High Score software.The chemical composition (wt%) of the raw powdered was obtained by X-ray fluorescence (XRF) using a commercial instrument (ARL 9900 of Thermo Fisher by monochromatic radiation Kα1 of cobalt (λ = 1.7889 Å).
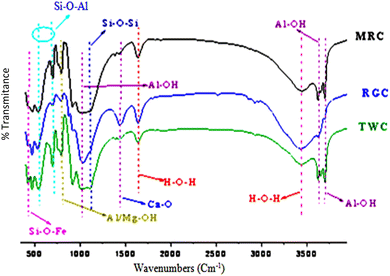
Fourier Transform Infrared Spectroscopy (FTIR) was performed by mixing the powdered clay samples with a fine powder of KBr and then hydraulically pressing to obtain a thin transparent disk. FTIR spectra were obtained in the range of 4000–500 cm−1 using an FTIR spectrometer, model PerkinElmer Spectrum.
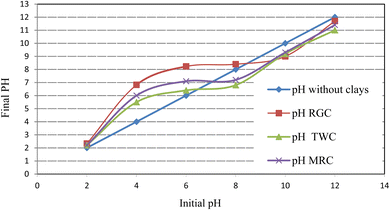
To investigate the surface charge of natural clays, the point zero charge pHpzc of the clay samples was determined by a titrimetric method using NaOH/HCl, as described by Sharma, Y. C. et al.32 For this reason, 0.01 M NaCl was prepared and its pH was regulated between 2 and 12. Then, samples of 50 mL 0.01 M NaCl were withdrawn into 250 mL flasks and 0.20 g of the adsorbent was added to the solutions. The mixture was stirred for 24 hours and the final pH solutions were recorded.
The specific surface area (SS) was measured using the methylene blue (MB) titration method, in which a spectrophotometer was used to evaluate the amount of residual MB in the solution, as described by Morali et al.33
The cationic exchange capacity (CEC) of the samples was measured according to the Maintin method34 based on the adsorption of a copper ethylenediamine complex.35
2.4. Adsorption experiments
All adsorption experiments were realized in the batch mode in duplicate at room temperature 22 ± 2 °C in different conical flasks having a capacity of 250 mL and containing 50 mL of effluent at various conditions using a mechanical shaker (Stuart reciprocating shaker SSL2) at 250 shakes per minute. An adsorption run was carried out by varying the solution pH from 3.98 to 9.02, the clay weight from 1.98 g L−1 to 7.02 g L−1 and the contact time from 40 to 140 min. The pH was adjusted by adding HCl (1 N) or NaOH (1 N) and was measured with a Hanna HI 8424 pH-meter. After each run, samples were centrifuged at 4000 rpm for 20 min to remove the clay. Limpid supernatant solutions were collected and filtered for residual color determination using an Hach Lange DR3900 UV-vis spectrophotometer and the retained solid mater for TSS (mg L−1) determination.The color (Re%) and COD (Re COD%) removal efficiency were calculated using eqn (1) as follows.
 | (1) |
Total suspended solid removal efficiency (Re TSS%) was calculated using eqn (2) as follows.
 | (2) |
2.5. Ozonation experimental set-up
Ozone experiments were realized in a 1.5 liter glass reactor and only 1 liter was used in each experiment. Ozone was produced from air using an air pump and ozone generator (confident engineering India private limited) with an average capacity of 2 g h−1. The gas was purged into the reactor bottom thanks to a bubble diffuser. During all experiments, the flow rate was fixed at 60 L h−1 at a room temperature 22 ± 2 °C.2.6. Adsorption experimental design and decolorization optimization
The significant factors affecting the treatment of indigo dye effluent through the adsorption process with local clays were investigated using surface response methodology (RSM), employing the central composite design (CCD) approach. This experimental design method is appropriate for fitting a full quadratic polynomial and quadratic surface, which helps to optimize the adsorption process and to investigate the effect of parameters and their interaction with the minimum number of experiments to N runs, according to eqn (3).36| N = 2k + 2k + n0 | (3) |
To optimize the process, a CCD design with three factors, namely, pH solution, clay weight and contact time, varied at five levels (−α, −1, 0, 1 and +α) were set up. The lowest and the highest levels (Table 2) were fixed based on the preliminary experiments. To examine the relationship between the responses (color removal) and the factors, the second order polynomial equations were fitted according to eqn (4). Then, the optimum responses of the adsorption process were evaluated from the quadratic surfaces and the Derringer's desirability function.37
 | (4) |
| Factors | Levels | ||||
|---|---|---|---|---|---|
| (−α) = −1.682 | −1 | 0 | 1 | (+α) = 1.682 | |
| X1, solution pH | 3.98 | 5 | 6.5 | 8 | 9.02 |
| X2, clay weight (g L−1) | 1.98 | 3 | 4.5 | 6 | 7.02 |
| X3, contact time (min) | 39.54 | 60 | 90 | 120 | 140.4 |
Y or Re (%) is the response (color removal percent), β0, βi, βii and βij are respectively the constant, the linear, the quadratic and the interaction coefficients, xi and xj are the coded independent parameters and n is the parameters' number. Minitab 14 software has been used to optimize the adsorption on clays and to analyze the interaction between the factors.
3. Results and discussion
3.1. Clay characterization
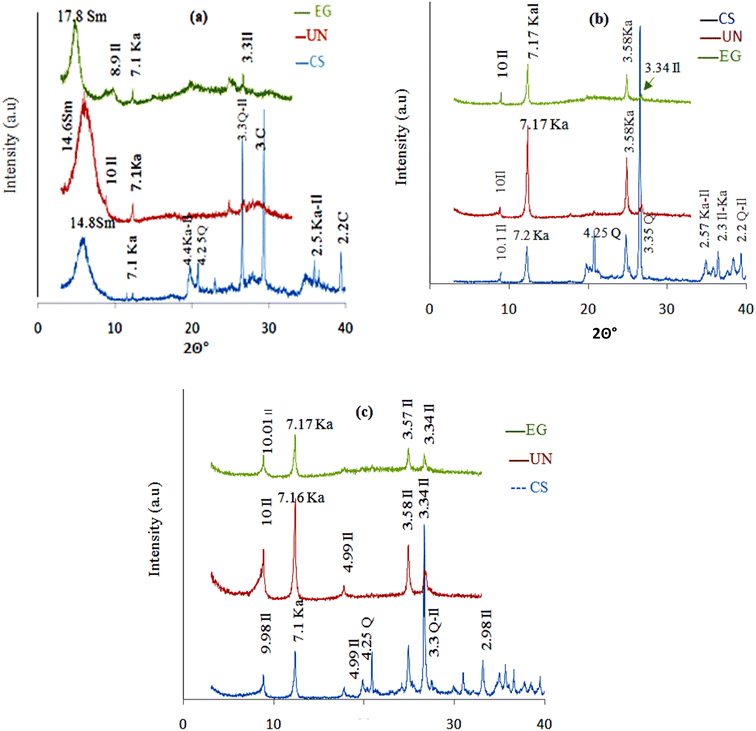 | ||
| Fig. 2 XRD patterns of: (a) RGC, (b) TWC and (c) MRC: (UN) purified sample; (EG) ethylene glycol treated sample; (CS) crude sample. Q: quartz; C: calcite, Sm: smectite; Il: illite; Ka: kaolinite. | ||
| Samples | Crude samples | Fraction ≤2 μm | ||||
|---|---|---|---|---|---|---|
| Phy | Q | C | Sm | Ka | Il | |
| RGT | 73.92 | 9.6 | 11.88 | 89.91 | 7.23 | 2.85 |
| TWC | 78.65 | 21.35 | 0 | 0 | 81.79 | 18.21 |
| MRC | 67.77 | 19.4 | 0 | 0 | 41.48 | 51.85 |
RGC is a smectite clay mineral as a major fraction ((001) basal reflection at 14.85 Å), associated with kaolinite (7.1 Å), illite (10 Å), and calcite (3.00 Å).
TWC is characterized by the presence of kaolinite as a major fraction ((001) with basal reflections at 7.22 Å), in conjunction with illite (10 Å) and quartz (3.35 Å).
MRC is predominantly present as the illite fraction, highlighted by the (001) reflection at 10.01 Å, alongside kaolinite (7.17 Å) and quartz (4.25 Å and 3.3 Å) as secondary components.
After purification, the mineralogical analysis (Table 3) shows the removal of impurities, specifically quartz and calcite, confirming the findings reported in the XRD analysis (Fig. 3). It was noted that RGC primarily consists of smectite (89.91%) with minor amounts of kaolinite and illite.38 TWC, on the other hand, exclusively included kaolinite (81.79%)39 and illite (18.21%).38 As for MRC, it is predominantly composed of illite (51.85%) and kaolinite (41.48%).38
| Elements | RGC | TWC | MRC |
|---|---|---|---|
| SiO2 | 43.4 | 53.63 | 44.86 |
| Al2O3 | 17.1 | 32.18 | 23.53 |
| Fe2O3 | 5.82 | 2.59 | 9.16 |
| CaO | 12.67 | 3.66 | 4.24 |
| SO3 | 1 | 0.1 | 0.41 |
| MgO | 2.04 | 0.74 | 1.71 |
| K2O | 1.08 | 1.17 | 3.83 |
| Na2O | 1.13 | 0.11 | 0.23 |
| LOI | 14.3 | 5.2 | 11.3 |
| Total | 98.54 | 99.38 | 99.27 |
Results show (Fig. 3 and Table 5) the total absence of bands characteristics of organic matter in the 3 samples (2920 and 2850 cm−1 for the stretching of the C–H bonds of the aliphatic chain, 1740–1720 cm−1 for the C![[double bond, length as m-dash]](https://www.rsc.org/images/entities/char_e001.gif) O bond40). The most important chemical functions and their assignments are summarized in Table 5 and Fig. 3. The IR results corroborate and very well support the XRD and XRF analysis.
O bond40). The most important chemical functions and their assignments are summarized in Table 5 and Fig. 3. The IR results corroborate and very well support the XRD and XRF analysis.
| RGC band (cm−1) | TWC band (cm−1) | MRC band (cm−1) | Assignments |
|---|---|---|---|
| 3706.7 | 3706.7 | 3707.2 | Al–OH |
| 3642.61 | 3623.9 | 3626.3 | Al–OH |
| 3440 | 3440.4 | 3453.2 | H–O–H |
| 1642.8 | 1625.2 | 1627.8 | H–O–H |
| 1460.32 | 1442.4 | 1431.3 | Ca–O |
| 1126.06 | 1102.9 | 1107.8 | Si–O, Si–O–Si |
| 929.11 | 910.4 | 911.2 | Al–OH |
| 791.09 | 800.7 | 795.6 | Si–O, Si–O–Al, Al–OH, Mg–OH, Si–O–Mg |
| 699.3 | 699.3 | 703.4 | Si–O, Si–O–Al |
| 534.4 | 543.3 | 552.9 | Si–O, Si–O–Al |
| 479.2 | 470.2 | 742.1 | Si–O, Si–O–Fe |
| SS (m2 g−1) | CEC (meq/100 g of air-dried clay) | pHpzc | Loss of ignition (wt%) | |
|---|---|---|---|---|
| RGC | 568.11 | 82.7 | 8.4 | 14.3 |
| TWC | 172.63 | 14.6 | 6.4 | 5.2 |
| MRC | 208.45 | 37.3 | 7.1 | 11.3 |
3.2. Evaluation of adsorption experimental results with CCD
On the basis of central composite design (CCD), there were twenty runs for studying the effect of the three parameters, namely, pH, amount of clay (Wc (g L−1)) and time (t (min)), on the color removal efficiency for each clay. The design matrix with the experimental (Exp) and predicted (Pred) values is summarized in Table 7.| Std order | pH | Wc (g L−1) | t (min) | Exp Re RGC (%) | Pred Re RGC (%) | Exp Re TWC (%) | Pred Re TWC (%) | Exp Re MRC (%) | Pred Re MRC (%) |
|---|---|---|---|---|---|---|---|---|---|
| 1 | 5.00 | 3.00 | 60.00 | 77.53 | 77.38 | 73.99 | 74.92 | 71.01 | 71.14 |
| 2 | 8.00 | 3.00 | 60.00 | 68.48 | 68.35 | 62.78 | 63.35 | 65.00 | 65.44 |
| 3 | 5.00 | 6.00 | 60.00 | 80.13 | 80.10 | 75.82 | 76.43 | 75.00 | 75.15 |
| 4 | 8.00 | 6.00 | 60.00 | 71.01 | 71.07 | 62.97 | 64.07 | 66.01 | 66.60 |
| 5 | 5.00 | 3.00 | 120.00 | 78.99 | 78.83 | 73.99 | 73.76 | 73.29 | 73.20 |
| 6 | 8.00 | 3.00 | 120.00 | 72.34 | 72.27 | 63.48 | 63.74 | 65.00 | 65.34 |
| 7 | 5.00 | 6.00 | 120.00 | 81.58 | 81.61 | 78.42 | 78.71 | 77.97 | 78.03 |
| 8 | 8.00 | 6.00 | 120.00 | 75.00 | 75.05 | 67.97 | 67.90 | 66.96 | 67.33 |
| 9 | 3.98 | 4.50 | 90.00 | 82.97 | 83.11 | 79.49 | 78.96 | 77.03 | 77.12 |
| 10 | 9.02 | 4.50 | 90.00 | 70.00 | 70.01 | 60.82 | 60.14 | 64.11 | 63.32 |
| 11 | 6.50 | 1.98 | 90.00 | 73.99 | 74.25 | 67.97 | 67.48 | 67.97 | 67.73 |
| 12 | 6.50 | 7.02 | 90.00 | 78.99 | 78.87 | 72.97 | 72.25 | 73.23 | 72.77 |
| 13 | 6.50 | 4.50 | 39.55 | 71.01 | 71.11 | 72.47 | 70.99 | 70.00 | 69.46 |
| 14 | 6.50 | 4.50 | 140.45 | 75.63 | 75.68 | 72.97 | 73.24 | 71.96 | 71.80 |
| 15 | 6.50 | 4.50 | 90.00 | 74.49 | 74.25 | 72.72 | 72.97 | 71.77 | 71.76 |
| 16 | 6.50 | 4.50 | 90.00 | 73.48 | 74.25 | 73.23 | 72.97 | 72.03 | 71.76 |
| 17 | 6.50 | 4.50 | 90.00 | 72.91 | 74.25 | 72.91 | 72.97 | 71.52 | 71.76 |
| 18 | 6.50 | 4.50 | 90.00 | 75.32 | 74.25 | 72.97 | 72.97 | 72.78 | 71.76 |
| 19 | 6.50 | 4.50 | 90.00 | 73.67 | 74.25 | 72.78 | 72.97 | 71.58 | 71.76 |
| 20 | 6.50 | 4.50 | 90.00 | 75.63 | 74.25 | 72.97 | 72.97 | 70.76 | 71.76 |
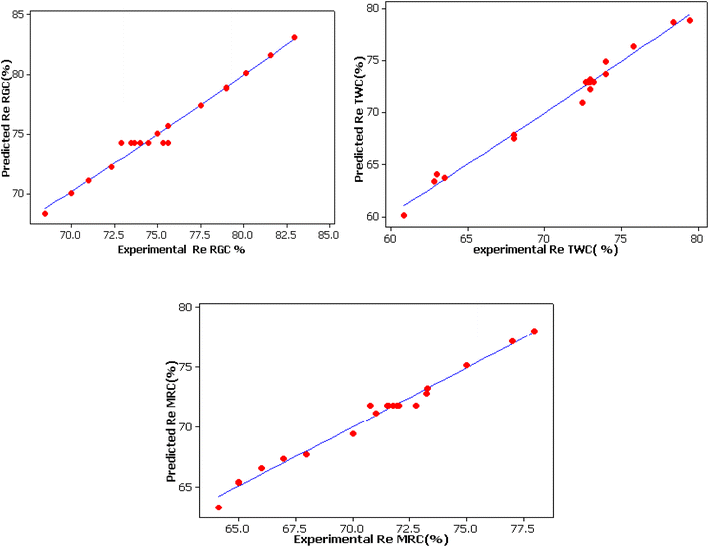
The predicted values were in good agreement with the experimental results (Table 7 and Fig. 5). Moreover, the very high coefficient of the correlation R2 and the adjusted R2 values (R2 = 97.9% adj R2 = 96%, R2 = 98.6% adj R2 = 97.4% and R2 = 98.5% adj R2 = 97.2% for RGC, TWC and MRC, respectively) obtained in the actual study for color removal efficiency using the different clays as well as their good harmony, prove the high accuracy of the full quadratic regression models in terms of the encoded parameters given respectively by eqn (5)–(7) to predict the responses since the values of R2 were higher than 0.80.
This implies that regardless of the clay nature, more than 97% of variation in the dye removal efficiency is explained by the independent variables.
| Y1 = Re RGC (%) = 111.106 − –8.557pH − 2.386Wc + 0.015t + 0.363pH × pH + 0.363Wc × Wc + 0.014pH × t | (5) |
| Y2 = Re TWC (%) = 65.8914 + 2.8738pH + 4.1786Wc − 0.0594t − 0.5372pH × pH − 0.4874Wc × Wc − 0.0003t × t + 0.0879pH × Wc + 0.0086pH × t + 0.0192Wc × t | (6) |
| Y3 = Re MRC (%) = 49.8954 + 2.9176pH + 4.7828Wc + 0.1604t − 0.2425pH × pH − 0.2375Wc × Wc − 0.0004t × t − 0.3165pH × Wc − 0.012pH × t + 0.0046Wc × t | (7) |
The significance of each operating factor (parameter) along with their interactions was investigated by analyzing the P-value at 95% confidence level. In other words, to be significant, the P-value should be less than 0.05. Results (Table 8) show that the clay weight, time, time square and both the interaction between the pH and the clay weight, clay weight and time are insignificant for the color removal efficiency using RGC. Concerning the TWC, the pH, time, time square and both the interactions between pH and clay weight, pH and time are also insignificant for the color removal efficiency. However, when MRC was used as an adsorbent, except for the interaction between clay weight and time, all the others parameters, their squares and their interactions are significant for the model.
| Term | Re RGC (%) | Re TWC (%) | Re MRC (%) | |||
|---|---|---|---|---|---|---|
| T | P | T | P | T | P | |
| Const | 14.888 | 0.000 Sig | 8.241 | 0.000 Sig | 7.921 | 0.000 Sig |
| pH | −6.027 | 0.000 Sig | 1.889 | 0.088 Insig | 2.435 | 0.035 Sig |
| Wc | −1.876 | 0.090 Insig | 3.068 | 0.012 Sig | 4.457 | 0.001 Sig |
| t | 0.231 | 0.822 Insig | −0.873 | 0.403 Insig | 2.988 | 0.014 Sig |
| pH × pH | 4.002 | 0.003 Sig | −5.520 | 0.000 Sig | −3.163 | 0.010 Sig |
| Wc × Wc | 4.002 | 0.003 Sig | −5.009 | 0.001 Sig | −3.098 | 0.011 Sig |
| T × t | −1.473 | 0.172 Insig | −1.381 | 0.197 Insig | −2.320 | 0.043 Sig |
| pH × Wc | 0 | 1 Insig | −0.673 | 0.516 Insig | −3.076 | 0.012 Sig |
| pH × t | 2.250 | 0.048 Sig | 1.319 | 0.216 Insig | −2.324 | 0.042 Sig |
| Wc × t | 0.058 | 0.955 Insig | 2.935 | 0.015 Sig | 0.888 | 0.395 Insig |
| R2 | 97.9% | 98.6% | 98.5% | |||
| R2 adj | 96% | 97.4% | 97.2% | |||
Using the data in Table 7, the regression RSM models can be simplified to eqn (8)–(10).
| Y1 = 111.106 − 8.557pH + 0.363pH × pH + 0.363Wc × Wc + 0.014pH × t | (8) |
| Y2 = 65.8914 + 4.1786Wc − 0.5372pH × pH − 0.4874Wc × Wc + 0.0192Wc × t | (9) |
| Y3 = 49.8954 + 2.9176pH + 4.7828Wc + 0.1604t − 0.2425pH × pH − 0.2375Wc × Wc − 0.0004t × t − 0.3165pH × Wc − 0.012pH × t | (10) |
The Fisher's statistical test for analysis of variance (ANOVA) was employed to assess the performance of the model. As observed in Table 9, the p-value for the regression of the three responses is 0, and the sum of squared residual errors is considerably lower compared to the total sum of squares for the three responses. This indicates the high reliability of the developed models at a 95% confidence level.
| Source | Regression | Linear | Square | Interaction | Residual error | Total | |
|---|---|---|---|---|---|---|---|
| Re RGC (%) | DF | 9 | 3 | 3 | 3 | 10 | 19 |
| SS | 281.87 | 258.33 | 20.491 | 3.048 | 6.019 | 287![[thin space (1/6-em)]](https://www.rsc.org/images/entities/char_2009.gif) 891 891 |
|
| F | 52.04 | 13.64 | 11.35 | 1.69 | |||
| P | 0 | 0.001 | 0.001 | 0.232 | |||
| Re TWC (%) | DF | 9 | 3 | 3 | 3 | 10 | 19 |
| SS | 503.499 | 460.968 | 35.066 | 7.464 | 6.907 | 510.406 | |
| F | 80.99 | 4.72 | 16.92 | 3.6 | |||
| P | 0 | 0.027 | 0 | 0.054 | |||
| Re MRC (%) | DF | 9 | 3 | 3 | 3 | 10 | 19 |
| SS | 282.8 | 267.101 | 8.989 | 6.710 | 4.288 | 287.088 | |
| F | 73.28 | 8.16 | 6.99 | 5.22 | |||
| P | 0 | 0.005 | 0.008 | 0.02 |
Furthermore, the data values are situated in the adequate range (Fig. 6 and 7) and they form a quite straight line and there is no dominance of positive or negative residuals, which means that the errors are normally distributed and the RSM models are quite adequate to predict the responses (Re%).
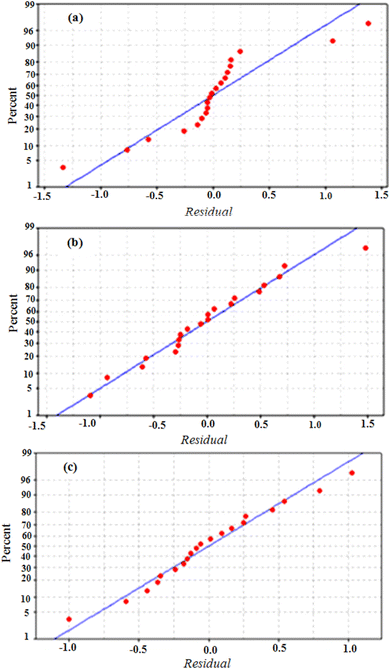 | ||
| Fig. 6 Normal probability plot of the residuals for the color removal efficiency using RGC (a), TWC (b) and MRC(c). | ||
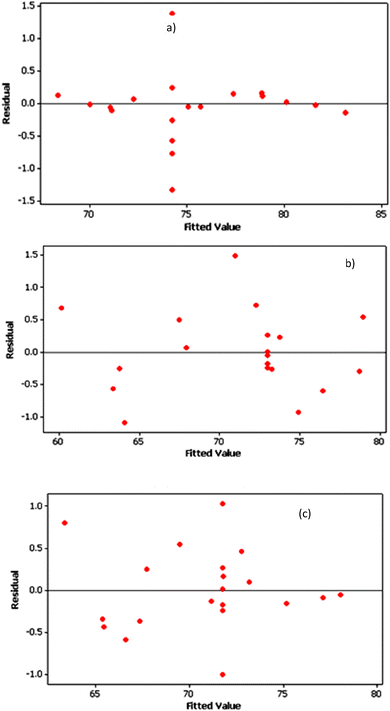 | ||
| Fig. 7 Residuals versus the fitted values for the color removal efficiency using RGC (a), TWC (b) and MRC (c). | ||
3.3. Effects of operating parameters on the adsorption
The main effect plots in Fig. 8, the interaction plot in Fig. 9 as well as the 3D surfaces plots in Fig. 10 obtained from eqn (5)–(7) are used to investigate the effects of factors on the different responses (color removal percent using RGC, TWC and MRC) conjointly with the determination of the optimum values, thus allowing the best color removal percentage.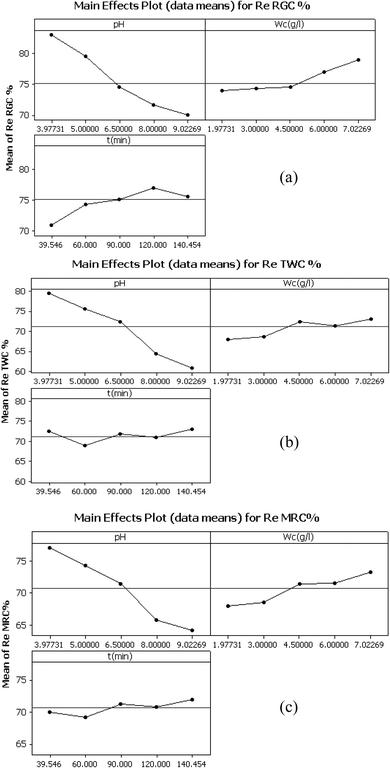 | ||
| Fig. 8 Main effects plot (data means) for color removal efficiency using: (a) RGC, (b) TWC and (c) MRC. | ||
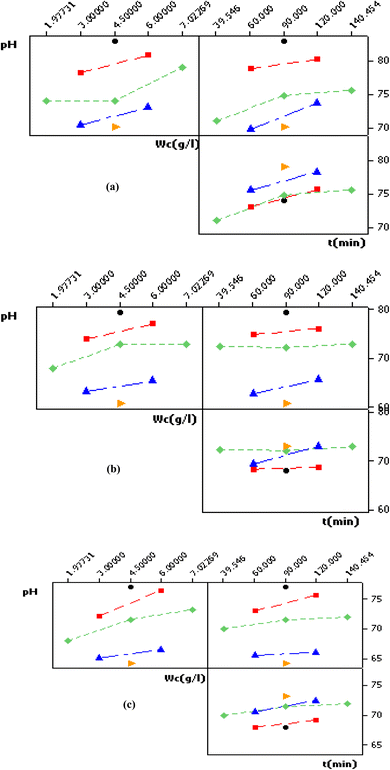 | ||
| Fig. 9 Interaction plot (data means) for color removal efficiency using: (a) RGC, (b) TWC and (c) MRC. | ||
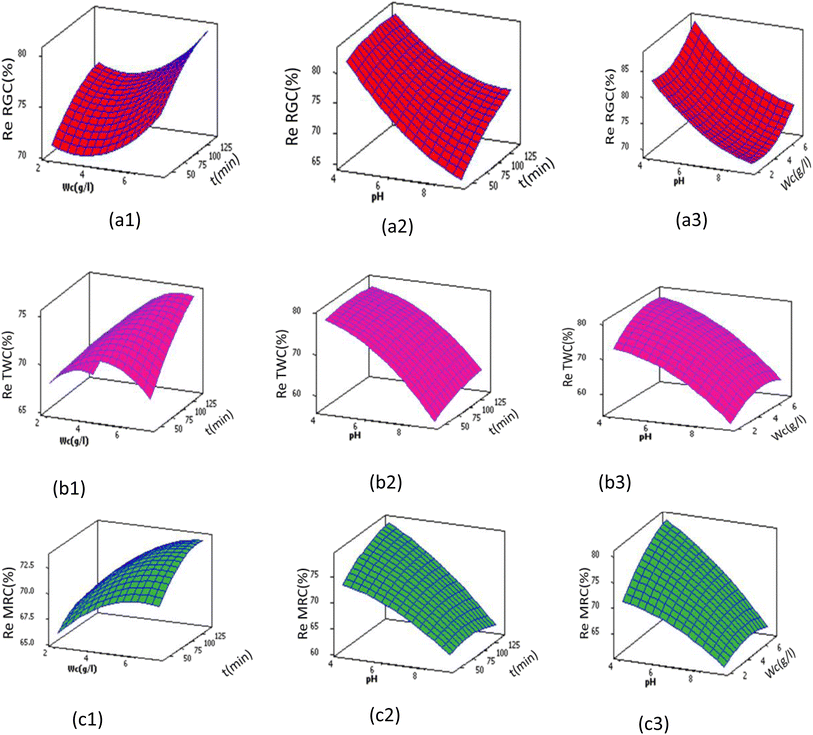 | ||
| Fig. 10 3D plot for color removal efficiency using (a) RGC, (b) TWC and (c) MRC versus solution pH, clay weight and time at middle levels. | ||
Soares et al.47 utilized untreated montmorillonite clay and reported that acidic pH enhances the adsorption capacity of anionic dyes. The high adsorption capacity observed in acidic conditions can be attributed to electrostatic attraction forces between the positively charged surface of the clay and the negatively charged soluble leuco-indigo dye.48 Specifically, at the edges of a layer, unsaturated valences of silicon and oxygen in the tetrahedral sheet, as well as aluminum and oxygen in the octahedral sheet, result in the presence of silanols (Si–OH) and aluminols (Al–OH) groups. These groups are pH-dependent and can either capture or release protons as described by eqn (11)–(14).
| Si–OH + H+ → SiOH2+ (At acidic pH) | (11) |
| Si–OH + OH− → Si–O− + H2O (At basic pH) | (12) |
| Al–OH + H+ → Al–OH2+ (at acidic pH) | (13) |
| Al–OH + OH− → Al–O− + H2O (at basic pH) | (14) |
At a constant time (of 90 min) and with an initial adsorbent weight of 4.5 g L−1, the percentage of color removal at pH equal to pHpzc was 70.58%, 73.35%, and 69.96% for RGC, TWC, and MRC, respectively. Despite the presence of OH− ions and negatively charged clay faces and edges at basic pH (pH > pHpzc), the adsorption process coexists due to other mechanisms, especially ion-exchange processes.20
Moreover, irrespective of clay type, optimal removal efficiency is attained at adsorbent dosages ranging between 6.5 and 7 g L−1, 4.5 and 5.5 g L−1, and 5.8 and 6.3 g L−1 for RGC, TWC, and MRC, respectively. Beyond these dosages, additional adsorbent yields negligible results and the Re (%) values remain almost constant. This can be attributed to the equilibrium achieved between the clay adsorbent and dissolved dyes in the effluent, inhibiting further color removal via excess clay addition. Similar findings were reported by Tunali-Akar et al.,49 Tombácz 2013,50 and Crini et al.51
These findings can be rationalized by the fact that at shorter contact times, clay pores remain unoccupied, boasting a sizable specific surface area that accelerates the adsorption process. Initially, decolorization occurs swiftly during the early stages of the adsorption process. However, as time progresses, the clay pores become filled with soluble blue indigo dye, resulting in their surfaces and edges becoming fully covered and saturated. Consequently, color removal reaches a plateau, indicating a slower uptake of dye at longer contact times. The 3D surface plots (Fig. 10) illustrate that the optimal contact time for adsorption with RGC was approximately 90 min, while for TWC and MRC, it was about round 110 min and 130 min, respectively. Notably, there is a significant interaction between the clay dose and time, with higher adsorbent dosage resulting in shorter adsorption contact times, particularly evident in the case of TWC. These findings align with those reported by Abidi Nejib,23 Alkhatib et al.,52 and Mohamed et al.53
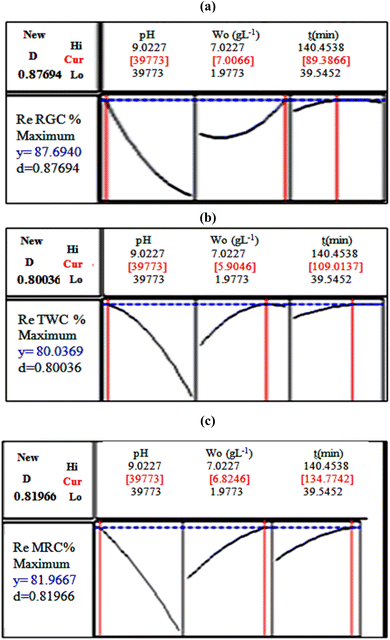
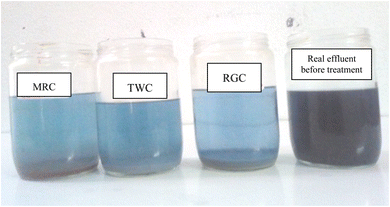
The optimized operational parameter values obtained by Minitab 14 (Table 10 and Fig. 11), indicating a pH solution of 3.98 regardless of the clay type, 7 g L−1 of adsorbent dose, and 89 minutes of contact time for Re RGC (%); 5.9 g L−1 of adsorbent dose and 109 minutes of contact time for Re TWC (%) and 6.82 g L−1 of adsorbent dose and 135 min of contact time for Re MRC (%). To verify the sufficiency of the model and ensure agreement with the predicted results, additional experiments were conducted under optimal conditions defined by the optimizer functions. The predicted Re RGC (%) of 87.69%, Re TWC (%) of 80.04%, and Re MRC (%) of 81.98% closely matched the experimental values of 86.89%, 80.56%, and 81.7%, respectively, with differences not exceeding 0.2% for all the responses. This confirms the accuracy of the model and demonstrates the capability of RSM in optimizing the color removal efficiency via clay adsorption. Additionally, Fig. 12 illustrates the raw and treated effluents at optimum conditions with the three different clays, thus enhancing the good result.
| pH | Cw (g L−1) | t (min) | Predicted Re (%) | Experimental Re (%) | Desirability D | |
|---|---|---|---|---|---|---|
| RGC | 3.98 | 7 | 89 | 87.69 | 86.89 | 0.87 |
| TWC | 3.98 | 5.9 | 109 | 80.04 | 80.56 | 0.8 |
| MRC | 3.98 | 6.82 | 135 | 81.98 | 81.7 | 0.82 |
The most effective adsorbent for blue indigo dye appears to be RGC. Although TWC and MRC have comparable color removal capacities, MRC exhibits higher adsorption capacity for blue indigo dye under optimal conditions compared to TWC. This suggests that higher specific surface area (SSA) and cation exchange capacity (CEC) of clay lead to increased adsorption capacity for blue indigo dye. Moreover, higher clay fraction and smectite percentage enhance indigo adsorption on crude clay.
At optimum conditions of decolorization, COD removal and TSS removal were evaluated. The obtained results show that the achieved chemical oxygen demand (COD) removal efficiencies and the total suspended solids (TSS) removal efficiencies were 57.2% and 80.7% for RGC, 55.02% and 75.28% for TWC, 56.8% and 75.5% for MRC, respectively.
3.4. Ozonation results
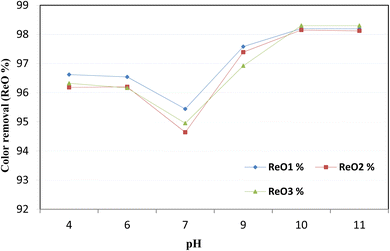
After adsorption under optimum conditions, the three samples treated with RGC (sample 1), TWC (sample 2) and MRC (sample 3) were collected and treated with ozone to enhance the removal of pollutants. ReO1%, ReO2%, and ReO3% are the color removal efficiencies, after ozonation of sample 1, sample 2, and sample 3, respectively.The rate of ozone degradation in the effluents increases significantly at elevated pH levels. At a pH of about 10, the half-life of ozone in a water solution decreases to one minute, and the generation of hydroxyl radicals (OH˙) occurs rapidly. Consequently, the decolorization rate accelerates due to two oxidation pathways: direct ozone molecule (O3) attack and indirect hydroxyl radical (OH˙) attack. At this pH level of 10, the color removal efficiencies were measured to be 98.2%, 98.15%, and 98.3% for samples treated with RGC, TWC, and MRC, respectively.
Ozone is widely recognized as one of the most potent oxidants, with an oxidation potential (E0) of 2.08 V, capable of producing highly reactive hydroxyl radicals (OH˙) at high pH levels. Due to its remarkable oxidation potential, ozone effectively eliminates color from the dye solutions by breaking down the chromophoric groups and aromatic rings present in the dyes. Ozone interacts with compounds in wastewater through two pathways: direct molecular reactions as per eqn (15) and indirect reactions involving hydroxyl radicals as per eqn (16).56
 | (15) |
 | (16) |
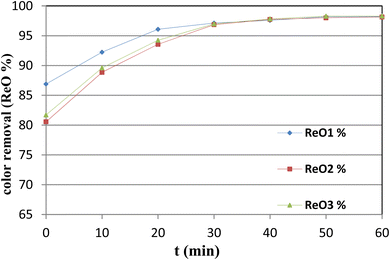
Ultimately, when operating under the optimal conditions for decolorization—specifically, with a solution pH set at 10 and subjecting the solution to one hour of ozonation—the achieved removal rates for chemical oxygen demand (COD) and total suspended solids (TSS) were as follows: 72.4% for COD and 89.3% for TSS in sample 1; 70.13% for COD and 88.74% for TSS in sample 2; and 70.32% for COD and 88.56% for TSS in sample 3. Although the combined process of natural clay adsorption and ozonation demonstrates excellent effectiveness in removing the color and TSS, it also shows notable efficacy in COD removal, achieving a maximum efficiency of 72.4%. The COD level decreased from 1400 mg L−1 before treatment to 389 mg L−1, underscoring the substantial potential of this treated water for reuse in the textile industry.
3.5. Comparison between actual and previous studies
Recently, researchers have become increasingly interested in the treatment of synthesized effluents using combined processes based on adsorption and ozonation. However, to date, there have been no studies in the literature focused on the decontamination of real effluents loaded with indigo dye (an anionic dye) using adsorption on crude clay and ozonation. The results of the present study were compared to other relevant studies that employed different types of adsorbents such as activated carbon (AC), granular activated carbon (GAC), and various anionic dyes (Table 11). The high decolorization efficiency obtained by Tizaoui et al.57 for the removal of acid and reactive dyes, and by Soares et al.47 for the removal of 1![[thin space (1/6-em)]](https://www.rsc.org/images/entities/char_2009.gif) :
:![[thin space (1/6-em)]](https://www.rsc.org/images/entities/char_2009.gif) 2 metal complex dye stuff, could be explained by the easier removal of a single dye from the synthesized effluent compared to the complex composition of the real effluent on the one hand and by the difficulty of removing vat dye from aqueous solutions, especially blue indigo dye, on the other hand.
2 metal complex dye stuff, could be explained by the easier removal of a single dye from the synthesized effluent compared to the complex composition of the real effluent on the one hand and by the difficulty of removing vat dye from aqueous solutions, especially blue indigo dye, on the other hand.
| Used dye | Used adsorbent + ozonation | Color removal% | COD removal% | TSS removal% | Reference |
|---|---|---|---|---|---|
| Real effluent loaded with Blue indigo dye | Smectite-rich raw clay + ozone | 98.2% | 72.4% | 89.3% | |
| Real effluent loaded with Blue indigo dye | Kaolinite-rich raw clay + ozone | 98.15% | 70.13% | 88.74% | This study |
| Real effluent loaded with Blue indigo dye | Illito–kaolinite-rich raw clay + ozone | 98.3% | 70.32% | 88.56% | |
| CI acid blue and reactive red | AC + ozone | 100% | — | — | 57 |
| Methylene blue | MnO2 + Kaolin + ozone | 98.9% | 88.3% | — | 58 |
| Real bio-treated effluent | AC bed + ozone | >90% | — | — | 59 |
1![[thin space (1/6-em)]](https://www.rsc.org/images/entities/char_2009.gif) : :![[thin space (1/6-em)]](https://www.rsc.org/images/entities/char_2009.gif) 2 metal complex dye stuff 2 metal complex dye stuff |
PAC + ozone | 99% | 96% | — | 47 |
| Low concentration dyeing effluent | AC + ozone | ≈100% | — | — | 60 |
The differences in decolorization efficiency and COD removal, as seen in this study, compared to other works using synthetic effluents (as shown in Table 11), can be attributed to the complexity of real effluents. Real effluents, especially those containing vat dyes such as indigo blue, are harder to treat. This adds to both the challenge and cost of treatment, while synthetic effluents used in other studies are typically simpler and more expensive to process such as activated carbon.61–63
Although we achieve nearly complete decolorization through the implementation of an environment-friendly system, our COD elimination rate remains slightly below the Tunisian standard limits for water discharged into rivers (190 mg L−1) or used in irrigation (90 mg L−1). However, this treated water holds significant potential for reuse in the textile industry, highlighting its value as a sustainable inexpensive resource.
4. Conclusion
This paper examines the decontamination of actual textile wastewater through adsorption using three different types of Tunisian clays, with the process further enhanced by ozonation. Key factors such as solution pH, adsorbent dosage, and adsorption contact time were systematically evaluated using the Central Composite Design (CCD) method within the framework of response surface methodology. Characterization of the clays revealed that RGC is smectite-rich, TWC is kaolinite-rich, and MRC is illite–kaolinite rich.Optimum adsorption conditions were determined by the Derringer's desirability function of Minitab 14 as follows: pH = 3.98, Wc = 7 g L−1, t = 89 min and pH = 3.98, Wc = 5.9 g L−1, t = 109 min and pH = 3.98, Wc = 6.82 g L−1, t = 135 min for RGC, TWC and MRC, respectively. Under these optimal conditions, the achieved removal efficiencies were notable: color removal rates reached 86.89%, 80.56%, and 81.7% for RGC, TWC, and MRC, respectively, while COD removal efficiencies were 57.2%, 55.02%, and 56.8%, and TSS removal efficiencies were 80.7%, 75.28%, and 75.5%. After application of ozone during one hour at pH 10, nearly total decolorization (∼98.3% color removal) was obtained across all three treated samples and TSS removal efficiencies rose to approximately 90%, accompanied by a maximum COD reduction of 72.4%. Remarkably, the COD levels decreased from 1400 mg L−1 to 389 mg L−1, underscoring the significant potential of this treated water for reuse in the textile industry. This highlights its value not only as a sustainable resource but also as an economically viable option for water recovery in textile processing.
These hybrid methods are highly effective in reducing both organic pollutants and residual dyes in textile wastewater, making them more sustainable solutions for large-scale treatment processes.
Data availability
The data provided in this study are included in the article.Conflicts of interest
The authors declare that they have no known competing financial interests or personal relationships that could have appeared to influence the work reported in this paper.Acknowledgements
This research received no external funding. We thank the Ministry of Industry of Tunisia for providing the statistics, the SITEX Company and the National Office of Mines for assistance with information and providing the laboratory equipment. The authors extended their appreciation to the Researchers Supporting Project Number (RSP 2024R75), King Saudi University, Riyadh Saudi Arabia.References
- A. Mittal, J. Mittal, A. Malviya, D. Kaur and V. K. Gupta, Adsorption of hazardous dye crystal violet from wastewater by waste materials, J. Colloid Interface Sci., 2010, 34, 463–473 CrossRef PubMed.
- C. H. Weng and Y. F. Pan, Adsorption of a cationic dye (methylene blue) onto spent activated clay, J. Hazard. Mater., 2007, 144, 355–362 CrossRef CAS PubMed.
- G. Samchetshabam, A. Hussan and T. G. Choudhury, Impact of Textile Dyes Waste on Aquatic Environments and its Treatment, Environ. Ecol., 2017, 35, 2349–2353 Search PubMed.
- M. M. Abd El-Latif, M. F. El-Kady, A. M. Ibrahim and M. E. Ossman, Alginate/polyvinyl alcohol-kaolin composite for removal of methylene blue from aqueous solution in a batch stirred tank reactor, J. Am. Sci., 2010, 6, 280–292 Search PubMed.
- T. Ngulube, J. R. Gumbo, V. Masindi and A. Maity, An update on synthetic dyes adsorption onto clay based minerals: A state-of-art review, J. Environ. Manag., 2017, 191, 35–57 CrossRef CAS PubMed.
- E. Pajootan, M. Arami and N. Mohammad, Binary system dye removal by electrocoagulation from synthetic and real colored wastewaters, J. Taiwan Inst. Chem. Eng., 2012, 43, 282–290 CrossRef CAS.
- K. Hendaoui, F. Ayari, I. Ben Rayana, R. BenAmar, F. Darragia and M. Trabelsi-Ayadi, Real indigo dyeing effluent decontamination using continuous electrocoagulation cell: study and optimization using Response Surface Methodology, Process Saf. Environ. Prot., 2018, 116, 578–589 CrossRef CAS.
- S. P. Buthelezi, A. O. Olaniran and B. PillayTextile, dye removal from wastewater effluents using bioflocculants produced by indigenous bacterial isolates, Molecules, 2012, 17, 14260–14274, DOI:10.3390/molecules171214260.
- O. Y. Balik and S. Aydin, Coagulation/flocculation optimization and sludge production for pre-treatment of paint industry wastewater, Desalination Water Treat., 2016, 57(27), 12692–12699, DOI:10.1080/19443994.2015.1051125.
- N. Daneshvar, A. Oladegaragoze and N. Djafarzadeh, Decolorization of basic dye solutions by electrocoagulation: an investigation of the effect of operational parameters, J. Hazard. Mater., 2006, 129, 116–122 CrossRef CAS PubMed.
- M. N. Chollom, S. Rathilal, V. L. Pillay and D. Alfa, The applicability of nano- filtration for the treatment and reuse of textile reactive dye effluent, Water SA, 2015, 41, 398–405 CrossRef CAS.
- N. Barka, A. Assabbane, Y. Aît Ichou and A. Nounah, Decontamination of textile wastewater by powdered activated carbon, J. Appl. Sci., 2006, 6, 692–695 CrossRef CAS.
- M. A. Ahmad, N. A. Ahmad Puad and O. S. Bello, Kinetic, equilibrium and thermodynamic studies of synthetic dye removal using pomegranate peel activated carbon prepared by microwave-induced KOH activation, Water Resour. Ind., 2014, 6, 18–35, DOI:10.1016/j.wri.2014.06.002.
- M. Dogan, H. Abak and M. Alkan, Adsorption of methylene blue onto hazelnut shell: kinetics, mechanism and activation parameters, J. Hazard. Mater., 2009, 16, 172–181, DOI:10.1016/j.jhazmat.2008.07.155.
- M. Zarezadeh-Mehrizi and A. Badiei, Highly efficient removal of basic blue 41 with nanoporous silica, Water Resour. Ind., 2014, 5, 9–57, DOI:10.1016/j.wri.2014.04.002.
- S. P. Buthelezi, A. O. Olaniran and B. Pillay, Textile dye removal from wastewater effluents using bioflocculants produced by indigenous bacterial isolates, Molecules, 2012, 17, 14260–14274, DOI:10.3390/molecules171214260.
- T. Akar, A. S. Ozcan, S. Tunali and A. Ozcan, Biosorption of a textile dye (Acid Blue 40) by cone biomass of Thuja orientalis: estimation of equilibrium, thermodynamic and kinetic parameters, Bioresour. Technol., 2008, 99, 3057–3065, DOI:10.1016/j.biortech.2007.06.029.
- N. BenDouissa, L. Bergaoui, S. Mansouri, R. Khiari and M. FaroukMhenni, Macroscopic and microscopic studies of methylene blue sorption onto extracted celluloses from Posidonia oceanic, Ind. Crops Prod., 2013, 45, 106–113, DOI:10.1016/j.indcrop.2012.12.007.
- H. Dhaouadi and F. M'Henni, Vat dye sorption onto crude dehydrated sewage sludge, J. Hazard. Mater., 2009, 16, 448–458, DOI:10.1016/j.jhazmat.2008.08.029.
- F. Bergaya, B. K. G. Theng and G. Lagaly, Handbook of Clay Science, Elsevier Science, 2006, vol. 1, p. 1246, eBook ISBN: 9780080457635, Hardcover ISBN: 9780080441832 Search PubMed.
- G. Sheng, H. Dong and Y. Li, Characterization of diatomite and its application for the retention of radiocobalt: role of environmental parameters, J. Environ. Radioact., 2012, 113, 108–115, DOI:10.1016/j.jenvrad.2012.05.011.
- W. T. Tsai, C. Y. Chang, C. H. Ing and C. F. Chang, Adsorption of acid dyes from a queous solution on activated bleaching earth, J. Colloid Interface Sci., 2004, 275, 72–78, DOI:10.1016/j.jcis.2004.01.072.
- A. Nejib, D. Joelle, A. Fadhila, G. Sophie and T. A. Malika, Adsorption of anionic dye on natural and organophilic clays: effect of textile dyeing additives, Desalination Water Treat., 2015, 54, 1754–1769, DOI:10.1080/19443994.2014.895781.
- S. Eturki, F. Ayari, H. Kallali, N. Jedidi and H. BenDhia, Treatment of rural wastewater by infiltration percolation process using sand-clay fortified by pebbles, Desalination Water Treat., 2012, 49, 65–73, DOI:10.1080/19443994.2012.708200.
- S. Khelifi, F. Ayari, A. Choukchou-Braham and D. BenHassan- Chehimi, The remarkable effect of Al–Fe pillaring on the adsorption and catalytic activity of natural Tunisian bentonite in the degradation of azo dye, J. Porous Mater., 2018, 25, 885–896, DOI:10.1007/s10934-017-0500-4.
- I. Ali, O. M. L. Alharbi, Z. A. Alothman, A. Y. Badjah, A. Alwarthan and A. Basheer, Artificial neural network modelling of amido black dye sorption on iron composite nano material: Kinetics and thermodynamics studies, J. Mol. Liq., 2018, 250, 1–8, DOI:10.1016/j.molliq.2017.11.163.
- S. Doğruel, B. F. Germirli, I. Kabdasl and D. Guclu, Orhon, Effect of stream segregation on ozonation for the removal of significant COD fractions from textile wastewater, J. Chem. Technol. Biotechnol., 2002, 78, 6–14 CrossRef.
- K. Ikehata and M. G. El-Din, Degradation of recalcitrant organic contaminants in water by ozone and advanced oxidation processes: A review, Ozone: Sci. Eng., 2004, 26(5), 327–343 CrossRef CAS.
- E. Villar-Navarro, Decolorization of industrial wastewater by ozonation: A case study, Chem. Eng. J., 2018, 334, 203–210 Search PubMed.
- M. M. Huber, Oxidation of pharmaceuticals during ozonation of municipal wastewater, Environ. Sci. Technol., 2005, 39(11), 4290–4299 CrossRef CAS PubMed.
- R. Andreozzi, V. Caprio, A. Insola and R. Marotta, Advanced oxidation processes (AOP) for water purification and recovery, Catal. Today, 1999, 53(1), 51–59 CrossRef CAS.
- Y. C. Sharma and S. N. Uma, Upadhyay, An economically viable removal of methylene blue by adsorption on activated carbon prepared from rice husk, Can. J. Chem. Eng., 2011, 89, 377–383, DOI:10.1002/cjce.20393.
- E. K. Morali, N. Uzal and U. Yetis, Ozonation pre and post-treatment of denim textile mill effluents: Effect of cleaner production measures, J. Cleaner Prod., 2016, 137, 1–9, DOI:10.1016/j.jclepro.2016.07.059.
- J. I. Torregrasa, L. F. Navarro, P. Lopez, S. C. Cardona, A. Abad and L. Capablanca, Study of the ozonation of a dye using kinetic information reconstruction, Ozone: Sci. Eng., 2008, 30, 344–355 CrossRef.
- M. A. Hassan, A. El Nemr and F. F. Madkour, Testing the advanced oxidation processes on the degradation of Direct Blue 86 dye in wastewater, Egypt. J. Aquat. Res., 2016 DOI:10.1016/j.ejar.2016.09.006.
- J. C. S. Antamarina, K. A. Klein, Y. H. Wang and E. Prencke, Specific surface: determination and relevance, Can. Geotech. J., 2012, 39, 233–241, DOI:10.1139/T01-077.
- I. Mantin, Mesure des capacités d'échange par l'éthylène diamine et les ions complexes de l'éthylène diamine, C. R. Acad. Sci., 1969, 269, 815–818 CAS.
- F. Bergaya and M. Vayer, CEC of clays: Measurement by adsorption of a copper ethylenediamine complex, Appl. Clay Sci., 1997, 12, 275–280, DOI:10.1016/S0169-1317(97)00012-4.
- R. Azargohar and A. K. Dalai, Production of activated carbon from Luscar char: experimental and modelling studies, Microporous Mesoporous Mater., 2005, 85, 219–225, DOI:10.1016/j.micromeso.2005.06.018.
- G. Derringer and R. Suich, Simultaneous optimization of several response variables, Journal of Quality Technology, 1980, 12, 214–219, DOI:10.1080/00224065.1980.11980968.
- S. Boussen, D. Sghaier, F. Chaabani, B. Jamoussi, S. BenMessaoud and A. Bennour, The rheological, mineralogical and chemical characteristic of the original and the Na2CO3-activated Tunisian swelling clay (Aleg Formation) and their utilization as drilling mud, Appl. Clay Sci., 2015, 118, 344–353, DOI:10.1016/j.clay.2015.10.017.
- S. Harti, G. Cifredo, J. M. Gatica, H. Vidal and T. Chafik, Physicochemical characterization and adsorptive properties of some Moroccan clay minerals extruded as lab-scale monoliths, Appl. Clay Sci., 2007, 36, 287–296, DOI:10.1016/j.clay.2006.10.004.
- L. J. Bellamy, The Infrared Spectra of Complex Molecules, Advances in Infrared Group Frequencies, 1975 Search PubMed.
- R. E. Grim, Applied Clay Mineralogy, Mc Graw-Hill, New York, 1962, p. 422 Search PubMed.
- J. Temuujin, Ts. Jadambaa, G. Burmaa, Sh. Erdenechimeg, J. Amarsanaab and K. J. D. MacKenzie, Characterisation of acid activated montmorillonite clay from Tuulant (Mongolia), Ceram. Int., 2004, 30, 251–255, DOI:10.1016/S0272-8842(03)00096-8.
- A. Mittal, J. Mittal and L. Kurup, Batch and bulk removal of hazardous dye, indigo carmine from wastewater through adsorption, J. Hazard. Mater., 2006, 137, 591–602, DOI:10.1016/j.jhazmat.2006.02.047.
- O. S. G. P. Soares, J. J. M. Órfão, D. Portela, A. Vieira and M. F. R. Pereira, Ozonation of textile effluents and dye solutions under continuous operation: Influence of operating parameters, J. Hazard. Mater., 2006, 137, 1664–1673, DOI:10.1016/j.jhazmat.2006.05.006.
- K. Chinoune, K. Bentale, Z. Bouberka, A. Nadim and U. Maschke, Adsorption of reactive dyes from aqueous solution by dirty bentonite, Appl. Clay Sci., 2016, 123, 64–75, DOI:10.1016/j.clay.2016.01.006.
- S. Tunali-Akar and R. Uysal, Untreated clay with adsorption capacity for effective removal of C.I. Acid Red 88 from aqueous solutions: Batch and dynamic flow mode studies, Chem. Eng. J., 2010, 162, 591–598, DOI:10.1016/j.cej.2010.06.001.
- E. Tombácz and M. Szekeres, Surface charge heterogeneity of kaolinite in aqueous suspension in comparison with montmorillonite, Appl. Clay Sci., 2006, 34, 105–124, DOI:10.1016/j.clay.2006.05.009.
- G. Crini, Non-conventional low-cost adsorbents for dye removal: a review, Bioresour. Technol., 2006, 97, 1061–1085, DOI:10.1016/j.biortech.2005.05.001.
- M. F. Alkhatib, A. A. Mamun and I. Akbar, Application of response surface methodology (RSM) for optimization of color removal from POME by granular activated carbon, Int. J. Environ. Sci. Technol., 2015, 12, 1295, DOI:10.1007/s13762-014-0504-4.
- R. R. Mohammed, Decolorisation of biologically treated palm oil mill effluent (POME) using adsorption technique, Int. Refereed J. Eng. Sci., 2013, 2, 01–11 Search PubMed.
- C. Zaharia and D. Suteu, Coal fly ash as adsorptive material for treatment of a real textile effluent: operating parameters and treatment efficiency, Environ. Sci. Pollut. Res., 2013, 20, 2226–2235, DOI:10.1007/s11356-012-1065-z.
- O. T. Ogunmodede, A. A. Ojo, E. Adewole and O. L. Adebayo, Adsorptive removal of anionic dye from aqueous solutions by mixture of Kaolin and Bentonite clay: characteristics, isotherm, kinetic and thermodynamic studies, Iran. J. Energy Environ., 2015, 6, 147–153, DOI:10.5829/idosi.ijee.2015.06.02.11.
- Y. Nakamura, M. Daidai and F. Kobayashi, Bioremediation of phenolic compounds having endocrine-disrupting activity using ozone oxidation and activated sludge treatment, Biotechnol. Bioprocess Eng., 2004, 9, 151–155 CrossRef CAS.
- C. Tizaoui, L. Bouselmi, L. Mansouri and A. Ghrabi, Landfill leachate treatment with ozone and ozone/hydrogen peroxide systems, J. Hazard. Mater., 2007, 140, 316–324 CrossRef CAS PubMed.
- I. Arslan and I. A. Balcioglu, Effect of common reactive dye auxiliaries on the ozonation of dyehouse effluents containing vinylsulphone and aminochlorotriazine dyes, Desalination, 2000, 130, 61–71, DOI:10.1016/s0011-9164(00)00074-6.
- P. C. C Faria, J. J. M. Órfão and M. F. R. Pereira, Mineralisation of coloured aqueous solutions by ozonation in the presence of activated carbon, Water Res., 2005, 39, 1461–1470, DOI:10.1016/j.watres.2004.12.03.
- E. Oguz and B. Keskinler, Removal of colour and COD from synthetic textile wastewaters using O3, PAC, H2O2 and HCO3, J. Hazard. Mater., 2008, 151, 753–760, DOI:10.1016/j.jhazmat.2007.06.045.
- L. Gao, Y. Zhai, H. Ma and B. Wang, Degradation of cationic dye methylene blue by ozonation assisted with kaolin, Appl. Clay Sci., 2009, 46, 226–229, DOI:10.1016/j.clay.2009.08.030.
- O. S. G. P. Soares, P. C. C. Faria, J. J. M. Órfão and M. F. R. Pereira, Ozonation of Textile Effluents and Dye Solutions in the Presence of Activated Carbon under Continuous Operation, Sep. Sci. Technol., 2007, 42(7), 1477–1492, DOI:10.1080/01496390701290102.
- S. S. Liu and J. X. He, Research on Reuse of Low Concentration Dyeing Effluent Decolorized Continuously On-line by Ozone Combined with Active Carbon, J. Donghua Univ., 2006, 2(3), 1421–1432 Search PubMed.
| This journal is © The Royal Society of Chemistry 2024 |


