 Open Access Article
A practical approach to demonstrate the circular economy in remediation of textile dyes using nutraceutical industrial spent
Syed Noeman Taquia,
Usman Taqui Syedb,
Rayees Afzal Mirc,
Akheel Ahmed Syed*d,
Shareefraza J. Ukkunde,
Hemavathi Nagaraju Deepakumarif,
Abdullah I. Al-Mansourg,
Shamshad Alamg,
Parveen Berwal *h and
Hasan Sh. Majdii
aDepartment of Studies in Chemistry, Bharathi College – Post Graduate and Research Centre, Bharathi Nagara, 571422, Karnataka, India. E-mail: noemansyed89@gmail.com
bDepartment of Chemistry, Faculty of Science and Technology, LAQV-REQUIMTE, Universidade NOVA de Lisboa, 2829-516, Caparica, Portugal. E-mail: s.taqui@campus.fct.unl.pt
cGlocal School of Agricultural Science, Glocal University, Mirzapur Pole, Saharanpur, Uttar Pradesh 247121, India. E-mail: raies.afzal@gmail.com
dCentre for Advanced Research and Innovation, Glocal University, Delhi-Yamunotri Marg, SH – 57, Mirzapur Pole, Saharanpur, Uttar Pradesh 247121, India. E-mail: akheelahmed54@gmail.com
eDepartment of Biotechnology, P. A. College of Engineering, Mangaluru 574153, India. E-mail: shareef_bio@pace.edu.in
fDepartment of Chemistry, Regional Institute of Education (NCERT), Bhubaneswar 751022, Odisha, India. E-mail: deepakumari_22@yahoo.com
gDepartment of Civil Engineering, College of Engineering, King Saud University, Riyadh 11421, Saudi Arabia. E-mail: amansour@ksu.edu.sa; salam@ksu.edu.sa
hDepartment of Civil Engineering, Galgotias College of Engineering and Technology, Greater Noida, India. E-mail: parveenberwal@gmail.com
iDepartment of Chemical Engineering and Petroleum Industries, Al-Mustaqbal University College, Babylon 51001, Iraq. E-mail: mn13022020@gmail.com
First published on 22nd August 2024
Abstract
We used Nutraceutical Industrial Coriander Seed Spent (NICSS), a readily available, cheap, eco-friendly, and ready-to-use material, as an innovative adsorbent for the bioremediation of a bisazo Acid Red 119 (AR 119) dye, which is likely a mutagen from textile industrial effluents (TIE). A laboratory-scale experiment was tailored to demonstrate the framework of the circular economy (CE) in the remediation of textile dyes using Nutraceutical Industrial Spent to align with the principles of sustainability and valorization. An experimental qe value of 97.00 mg g−1 was obtained. For the practicality and effectiveness of the method, a two-level fractional factorial experimental design (FFED) was employed to determine variables that influence the adsorption capacity of NICSS. At optimal settings (pH of 1.4, adsorbent dosage of 6.000 g L−1, adsorbent particle size of 96 μm, initial dye concentration of 599 mg L−1, adsorption duration of 173 min, orbital shaking speed of 165 rpm, and temperature of 35 °C), the maximum adsorption efficiency achieved through statistical optimization was 614 mg g−1. Six factors influencing the adsorption process were examined experimentally and were considered important for commercialization. Three orders of magnitude were applied to the identified variables in scaling experiments. Adsorption-equilibrium data were analyzed using nine isotherm models. The best fit was discovered to be the Vieth–Sladek adsorption isotherm model. The suitable mechanism for the overall rate of the adsorption process was a pseudo-second-order reaction: mass-transfer mechanistic studies were predicted to predominate over the diffusion process. NICSS was characterized using SEM and FTIR spectroscopy. Utilizing plastic trash, the dye-adsorbed NICSS that was recovered as “sludge” was utilized as a reinforcing material to create composites. Dye-adsorbed NICSS thermoplastic and thermoset composites were studied and compared with NICSS composites in terms of their physicomechanical and chemical properties.
1. Introduction
The “circular economy” (CE) has become essential to the sustainability agenda as the world grapples with the need for more sustainable practices. The CE presents an economic approach focused on minimizing/eliminating waste while promoting the optimal use or complete reuse of resources. It emphasizes the significance of embracing a holistic view of products and processes. Many countries are embracing practices aligned with the principles of the CE to enhance industrial productivity, competitiveness, and efficient use of resources.1 Achieving circularity is a daunting challenge that requires a systemic approach.2 However, the latest Circular Gap Report paints a worrying picture: adoption of the CE has stalled, and material usage has declined yearly.3 One of the major reasons is that the CE is perceived as expensive. CE is a resource-intensive economy,4 so it is desirable to demonstrate the principles of CE to all leading industries. Most countries have adopted rules on management of plastic waste, e-waste, construction, and demolition waste, as well as metals-recycling policies, to promote the CE. However, little attention has been paid to management of textile industrial effluents (TIE). This article explores how to drive change in this critical area of TIE management with simple laboratory experiments.The United Nations has acknowledged water security to be one of the 17 goals for sustainable development.5 Sustainable development aims to optimize economic growth by severing ties with wastewater discharge and water usage.6 Water, therefore, represents a significant concern, hindrance, and avenue for the sustainable growth of enterprises that produce effluents that contain high concentrations of harmful and hazardous materials. According to the World Resources Institute, an estimated 5 trillion liters of water are used in the dyeing process, and an estimated 48–144 billion square meters of fabric from factory waste end up in landfills each year. Overall, the industry is responsible for 20% of the world's water pollution, which is enough water to quench the thirst of 110 million people for an entire year.7 Furthermore, the textile industry dumps effluent straight into waterways due to lax laws in many developing nations, gravely harming the ecosystem and environment.8 As a result, metrics for measuring the sustainability of textile production are crucial.
The sustainable index prioritizes the control of effluents by taking into account the effects of pollution on human health resulting from the manufacture of textiles.9 The significance of waste treatment and water management in the textile industries has been highlighted by these shifts. The latter is seen as one of the major issues facing the modern economy, and the idea of valorization attempts to address it.10,11 The process of transforming trash into components for additional use, or valorization, adds value above the initial cost of transformation. It draws attention to procedures and activities that lessen emissions and their negative effects on the environment. In contrast to linear economics, which prioritizes end-of-life considerations,12 the CE envisions the idea of recycling trash from one process and using it as a resource for another.13 To achieve the status of a sustainable economic system, both approaches make an effort to divorce economic growth from natural resources through the processes of reduction, reuse, recycling, and return.14 Therefore, to change laboratory research in line with the most recent ideas, valorization and CE have been postulated.
Azo dyes are reactive dyes, representing about one-half of all the dyes in common use. They are synthetic compounds made from two aromatic amines joined by an azo bond. They are characterized by chemical groups that can form covalent bonds with textile substrates. They are synthesized by diazotization and coupling. Most azo dyes are toxic. Azo dyes are non-biodegradable and harmful to the environment. Some azo dyes release aromatic amines and generate carcinogenic metabolites when metabolized in the body.15
Azo dyes are widely utilized in the textile and related industries.16 Due to their mutagenic and carcinogenic qualities, these substances are prohibited worldwide. Even though they are harmful, their proven benefits have made them indispensable to the textile industry. These include: (i) easy and affordable ways to synthesize them in aqueous media; (ii) a vast array of starting materials available; (iii) a wide spectrum of shades; (iv) high intensity and superior fastness of color; (v) versatility in applications on various substrates; (vi) an energy-saving dyeing process at 60 °C compared with the boiling temperature of its counterparts.17 However, these colors are released as TIE because there are not enough appropriate disposal methods for the ∼4.50 × 10⁵ tonnes of dyes produced annually worldwide.18 Thus, remediation of toxic dyes from TIE remains a daunting task.
AR119 is an azo dye. The published techniques for removal/remediation/decolorization of AR119 can be broadly categorized as biological,19 chemical,20 and physical.21,22 Biological techniques cannot be used to break down AR119 dye, which is intended to withstand microbial breakdown and continue to be a stable, long-lasting colorant. The financial viability of the enterprises and sustainability of the environment are compromised by the high operational costs associated with treating and disposing of significant volumes of chemical sludge through the employment of chemical treatment methods.20 Adsorption, a physical process, has been used to remediate AR119 with sewage sludge and ash.21,22 Despite being efficient, the adsorption method has drawbacks, such as high investment, high operational costs, low efficiency, as well as the disposal problem of recyclability for real application in wastewater decontamination. These methods have serious limitations in the disposal of the dye-adsorbed sludge because they involve the Environmental Impact Factor (E-factor), and have a carbon footprint.23 Because of these shortcomings, scholars have chosen to employ Nutraceutical Industrial Coriander Seed Spent (NICSS) as a superior and innovative adsorbent material for the bioremediation of AR119 from TIE. NICSS has seven main advantages: (i) it is readily available; (ii) it is environmentally friendly; (iii) it is abundant; (iv) it is low-cost; (v) it offers a workable solution for the valorization of Nutraceutical Industrial Spent (NIS); (vi) it presents opportunities for the creation of low-cost green composites using plastic waste and dye-adsorbed spent as filler material; (vii) NICSS has a competitive advantage over reported agriculture waste.
The market for nutraceuticals is expected to reach US$ 336 billion by 2023, growing at a compound annual growth rate of 8%.24 Nonetheless, a substantial 50–95% of waste is produced during the processing and manufacturing of the main components and/or active substances from nutraceuticals. Given the economics of nutraceuticals, it is possible that the total amount spent (for which data are not available) could reach millions of metric tonnes.
Coriander belongs to the Apiceae family and genus Coriandrum (Coriandrum sativum L.). With a yearly production of 3.15 × 10⁵ tonnes, India holds a larger share of the global export market for this spice than any other country, making it the top producer, consumer, and exporter.25 NICSS is a by-product obtained by mechanical, thermal, and chemical methods that extract oleoresins as the main component. Thus, NICSS is not a useful feed or fertilizer. Currently, it is used as fuel with a low E-factor. A comparison of maximum adsorption capacities of various natural adsorbents is shown in Table 1.
The present study explores the porous nature of NICSS as an outstanding, ready-to-use biosorbent for the remediation of AR119, a toxic dye from TIE. Furthermore, little information is accessible on the elimination of colors from aqueous water and/or industrial effluents via adsorptive remediation and the appropriate disposal of the dye-adsorbed biosorbent (“sludge”). Our Research School has made innovative attempts to create composites using NIS, a filler material32–34 and as adsorbent for the removal of harmful dyes.35–39 Scant literature is available on the use of the CE concept in textile industries.37
The current work focused on the treatment of textile effluents employing the adsorption technique using NICSS. One of the main goals of this research was to build composites using plastic waste and dye-adsorbed NICSS, a waste material, as a filler and reinforcement material to fit into the concept of the CE.
2. Experimental
2.1. Preparation and characterization of the adsorbent
2.2. Studies on composites
Using 2% (v/v) methyl ethyl ketone as a catalyst, thermoset composites of unsaturated polyester resin (USP) and dm-NICSS and NICSS in ratios of 2, 5, 10, 15, and 20% (w/w) were created. A straightforward process was chosen. After the liquid had been stirred to create a homogenised slurry, it was carefully placed in a glass frame that met the necessary measurements. We let the slurry dry in air. A pressure plate was applied to the resulting thermoset for ∼3 h. A sample with the necessary dimensions was used to examine the chemical and physicomechanical characteristics of the material. Relevant ASTM procedures were used to prepare thermoplastic and thermoset composites to examine their properties: ASTM D 570-98, ASTM D 638-95, ASTM D 792-00, and ASTM D 2240.
3. Results and discussion
3.1. Surface characterization of the adsorbent
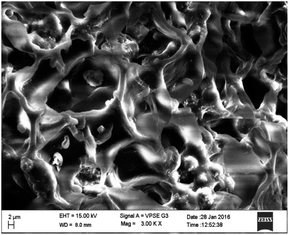
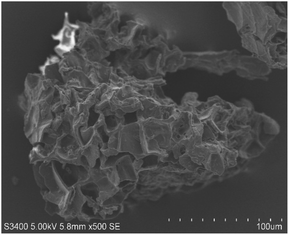
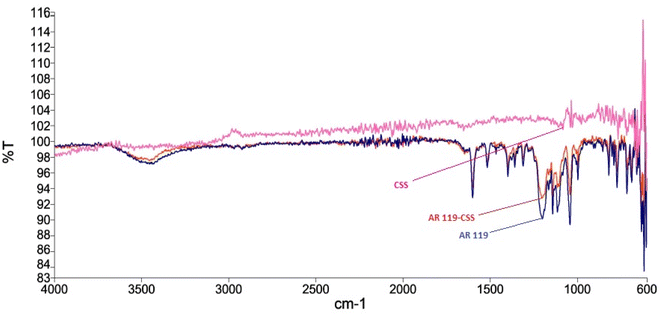
Surface characterization of NICSS was done through SEM, and exhibited a slightly porous structure (Fig. 1). Upon adsorption (Fig. 2) of AR119 dye, some pores were filled with the adsorbate, forming a thin film over the particle. The IR spectra of NIFGS (Fig. 3) suggested that the absorption at 3339 cm−1 was due to the stretching of hydroxyl groups of cellulose, hemicellulose, and lignin present in NICSS. The bands at 2924 cm−1 and 2851 cm−1 were due to the C–H stretching of saturated carbon. The bands at 1621 and 1775 cm−1 were due to C![[double bond, length as m-dash]](https://www.rsc.org/images/entities/char_e001.gif) O stretching. The bands at 1390 cm−1, 1607 cm−1, and 2923 were assigned to C–O–C, C–O, and CH vibrations, respectively. The fingerprint region of the biological material NICSS indicated complex bands, and accurate assignment of the peaks was difficult in the absence of a standard sample. However, the presence of cellulose and lignin indicated that the spent material had hydrophilic and hydrophobic properties.
O stretching. The bands at 1390 cm−1, 1607 cm−1, and 2923 were assigned to C–O–C, C–O, and CH vibrations, respectively. The fingerprint region of the biological material NICSS indicated complex bands, and accurate assignment of the peaks was difficult in the absence of a standard sample. However, the presence of cellulose and lignin indicated that the spent material had hydrophilic and hydrophobic properties.
3.2. Effect of pH and the initial dye concentration
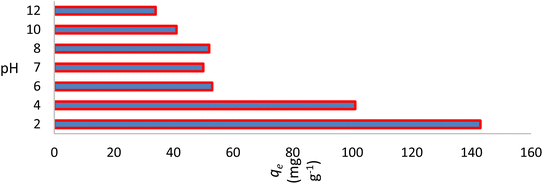
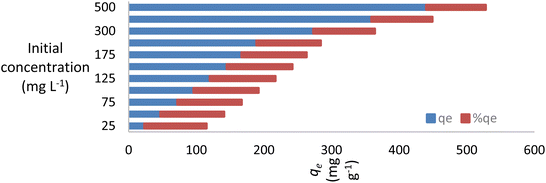
The pH of the solution affects the adsorption capability of NICSS. First, the pH affects the properties of the adsorbent surface. Second, the pH affects the chemistry of the dye solution. In order to validate the effectiveness of the adsorbent under investigation and scale it up to commercial levels, the parameter pH is crucial. A positively charged bisazo dye, AR119, will be present at lower pH, aiding in the adsorption of NICSS, a cellulose substance rich in –OH groups. The positively charged dye eventually loses its positive nature as the pH rises, which makes the dye adsorb less readily. The curve shape in Fig. 4 was in line with the anticipated chemistry.The initial concentration of AR119 dye had a significant impact on the adsorption capability of NICSS. The findings are shown in Fig. 5. The curve form indicated that the starting concentration of the dye in the range under study had little bearing on the ability of the absorbent (NICSS) to remove the adsorbate (AR119) according to percent removal. When the design is changed to improve the commercial viability of the technique, this observation becomes even more crucial.
3.3. Effect of adsorbent dosage
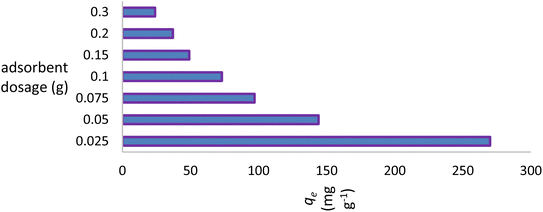
Due to its ability to determine the economic viability of the process, the dose parameter will also have a significant impact on commercialization of the process. The adsorbent dosage range of 0.025–0.300 g (0.500–6.000 g L−1) was examined. The removal capacity of the dye affected only the lower concentrations (0.500 to 1.000 g L−1) and remained nearly constant up to 6.000 g L−1. Increasing the number of trials with minimal amounts of the adsorbent significantly increased the removal efficiency of the dye by NICSS, an observation that is likely of scientific and economic importance (Fig. 6).3.4. Effect of adsorbent particle size
At neutral pH, the maximal adsorption capability of the AR119 dye was discovered at a preliminary concentration of 100 mg L−1 (Fig. 7). This observation aligns with the theory that, as particle size increases, and surface area decreases. The extent range of ≥125 μm ≤ 177 μm (80-mesh ASTM) was chosen for additional research because particles of this size range are frequently used in the fabrication of composites, and screening particles with smaller sizes requires more time and money.3.5. Effect of contact time
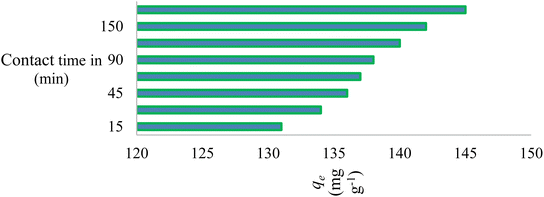
Adsorption is a commonly employed separation technique in the removal of hazardous and toxic materials from industrial effluents. Using kinetic models, one can analyse adsorption kinetics by tracking the uptake of the dye by the adsorbent over time under constant pressure and starting dye concentration. Fig. 8 shows how contact time affected the adsorption of AR119 dye onto NICSS. Based on those data, we concluded that the adsorption process proceeded nearly spontaneously and that the dye was removed with an efficiency of ∼80% of the rapid adsorption seen in the first 60 min. However, a modest increase in adsorption was seen as the contact period increased to 90 min, after which it gradually achieved equilibrium in ∼180 min.3.6. Effect of temperature
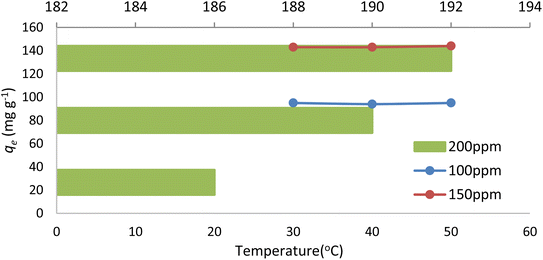
The dye-adsorption process of NICSS as a function of solution temperature was tested, keeping in mind our goal of scaling up to commercial applications. Fig. 9 shows how temperature affected the adsorption of AR119 dye onto NICSS. It may be concluded from the data that the adsorption process was essentially unaffected by the temperature range under study (30 °C–50 °C).403.7. Adsorption isotherms
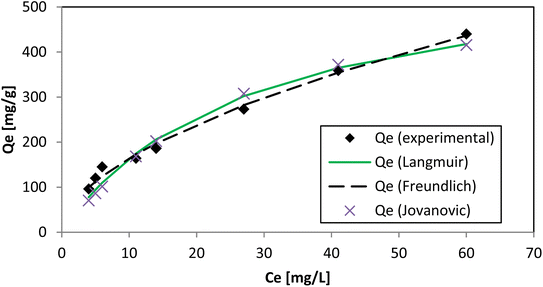
The parameters of adsorption isotherms reflect the interactions of adsorbate molecules with adsorbent surfaces. This is achieved through Langmuir and Freundlich isotherm models by predicting the adsorption capacity. The Langmuir isotherm model implies that adsorption is a monolayer process that occurs on the surface of the adsorbent, and it involves a finite number of similar adsorption sites processing uniform energies.41 In the Langmuir isotherm model, the separation factor RL has a crucial role.42 The calculated RL values, between 0.052 and 0.214, remained constant, indicating favorable and nearly linear AR119 dye adsorption on NICSS.The Freundlich isotherm model suggests that the adsorption process takes place on a heterogeneous surface.43 However, from Langmuir and Freundlich models, no definite inference was obtained for the homogeneity or heterogeneity of the process of adsorption. Therefore, the Jovanovic isotherm44 model was attempted (Table 2 and Fig. 10).
| Langmuir | Freundlich | Jovanovic | |||
|---|---|---|---|---|---|
| Qm | 607.65 | KF | 46.62 | Qm | 450.84 |
| KS | 0.037 | nF | 1.831 | KJ | 0.042 |
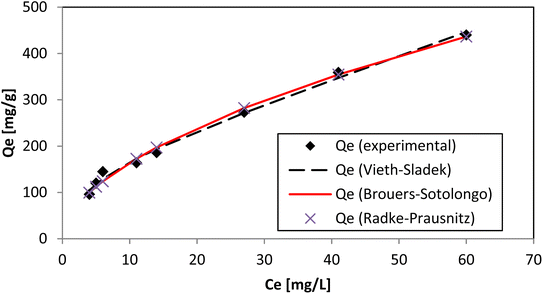
Redlich–Peterson, Brouers–Sotolongo, Vieth–Sladek, Toth, Sips, and Radke–Prausnitz were the six other three-parameter isotherm models we tried for academic interest. The Redlich–Peterson isotherm model45 is an improved version of the Langmuir–Freundlich isotherm model, and a correction factor (“g”) is included. The Brouers–Sotolongo isotherm46 is similar to the Vieth–Sladek isotherm. The KBS and α in the equation represent the adsorption power and active-site distribution, respectively, of the adsorbent–adsorbate system (Fig. 11).
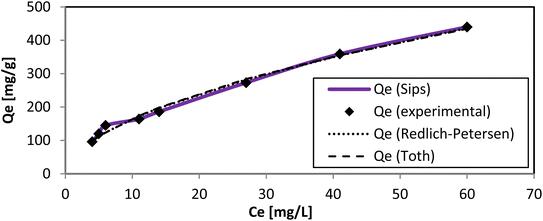
The Vieth–Sladek isotherm47 is useful for such solutes that are adsorbed because some specific isotherms simplify linear components (Henry's law) and nonlinear components (Langmuir equation) according to the solute dissolved in the amorphous region of the adsorbent. The Toth isotherm48 is useful for heterogeneous adsorption systems. The Sips isotherm,49 depending on the adsorbate concentration, can be either the Langmuir isotherm equation or Freundlich isotherm equation (Fig. 12). The Radke–Prausnitz isotherm50 experimentally observed the Qm value, and the expected Qm value was not near the trial qe value. These models discuss more complicated equations, but they help make the mechanism of adsorption clearer. The value of R2 alone could not be considered for our experiment because it can be applied only to linear models. χ2 values, however, are applicable only if model data and experimental data are similar. The Qm, χ2, and R2 values of all nine models are presented in Tables 3 and 4. The values of all these models, as well as the actual experimental data (qe), could provide useful guidance for further research to develop new models for solving adsorption phenomena occurring in the AR119-NICSS system.
| Redlich–Peterson | Toth | Sips | Vieth–Sladek | Brouers–Sotolongo | Radke–Prausnitz | ||||||
|---|---|---|---|---|---|---|---|---|---|---|---|
| ARP | 17190.5 | Qm | 7![[thin space (1/6-em)]](https://www.rsc.org/images/entities/char_2009.gif) 679 679![[thin space (1/6-em)]](https://www.rsc.org/images/entities/char_2009.gif) 696 696 |
Qm | 38298.3 | Qm | 151.3 | Qm | 2![[thin space (1/6-em)]](https://www.rsc.org/images/entities/char_2009.gif) 895 895![[thin space (1/6-em)]](https://www.rsc.org/images/entities/char_2009.gif) 200 200 |
Qm | 1.5 |
| BRP | 368.076 | nT0 | 0.076 | Ks | 4.61 × 10⁻⁶ | KVS | 5.045 | KBS | 1.61 × 10⁻⁵ | krp | 518.505 |
| g | 0.454 | bT0 | 1.508 | ms | 0.546 | βVS | 0.313 | α | 0.546 | mrp | 0.454 |
| Isotherms | Langmuir | Freundlich | Jovanovic | Radke–Prausnitz | Redlich–Peterson | Toth | Sips | Vieth–Sladek | Brouers–Sotolongo |
|---|---|---|---|---|---|---|---|---|---|
| SSE | 4163.6 | 825.8 | 5927.3 | 826.2 | 826.8 | 957.0 | 826.2 | 650.0 | 825.9 |
| χ2 | 24.937 | 5.159 | 37.125 | 5.161 | 5.164 | 5.823 | 5.158 | 3.818 | 5.159 |
| R2 | 0.97 | 0.99 | 0.96 | 0.99 | 0.99 | 0.99 | 0.99 | 0.99 | 0.99 |
3.8. Adsorption kinetics
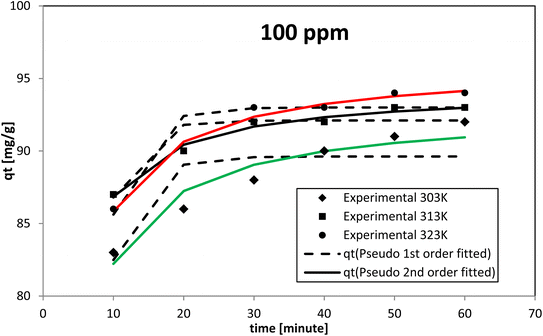
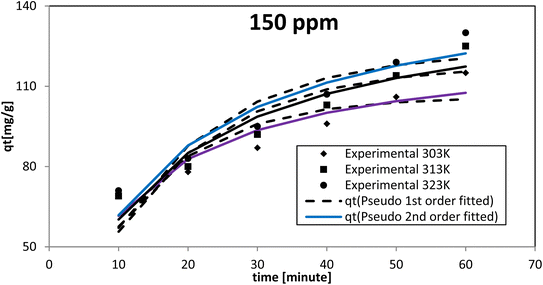
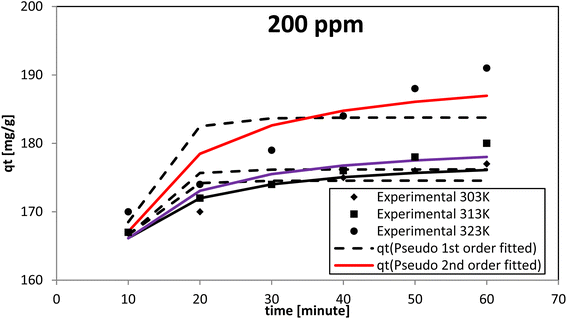
The pseudo-second-order model proposed by Ho and McKay had the best fit at all the dye concentrations and temperatures investigated, as evidenced by the coefficient of determination (R2) and chi-square (χ2) values. The AR119 dye molecules moved from the solution to the solid surface and then diffused into the pores of NICSS. Thus, it may be inferred that multi-step adsorption, which is not rate-limiting, had arisen. For kinetic investigations, three concentrations of AR119 dye were used: 100, 150, and 200 ppm. The difference in the adsorption rate at different temperatures was provided by kinetics studies conducted at 303 K, 313 K, and 323 K. The pseudo-first-order model,51 pseudo-second-order model,52 intra-particle diffusion (Weber–Morris) model,53 Dumwald–Wagner model,54 and film diffusion model55 (Table 5) were used as non-linear methods to examine the adsorption kinetic data (Microsoft Excel® 2010). Table 6 displays the estimated parameters.| Initial concentration [ppm] | Temp. [K] | qe,expt [mg g−1] | Pseudo-first order | Pseudo-second order | ||||||
|---|---|---|---|---|---|---|---|---|---|---|
| Qmpred [mg g−1] | k1 | R2 | χ2 | Qmpred [mg g−1] | k2 | R2 | χ2 | |||
| 100 | 303 | 95 | 89.62 | 2.53 × 10⁻¹ | 0.66 | 0.22 | 92.91 | 8.27 × 10⁻³ | 0.92 | 0.38 |
| 313 | 94 | 92.11 | 2.85 × 10⁻¹ | 0.82 | 0.05 | 94.31 | 1.24 × 10⁻² | 0.98 | 0.01 | |
| 323 | 95 | 93.00 | 2.53 × 10⁻¹ | 0.84 | 0.09 | 96.00 | 8.81 × 10⁻³ | 0.98 | 0.01 | |
| 150 | 303 | 143 | 106.13 | 7.81 × 10⁻² | 0.78 | 4.46 | 126.44 | 7.51 × 10⁻⁴ | 0.87 | 2.27 |
| 313 | 143 | 118.07 | 1.18 × 10² | 0.85 | 4.77 | 65.88 | 1.71 × 10⁻³ | 0.76 | 1.65 | |
| 323 | 144 | 123.42 | 6.21 × 10⁻² | 0.85 | 4.97 | 152.08 | 4.50 × 10⁻⁴ | 0.91 | 2.69 | |
| 200 | 303 | 186 | 174.55 | 3.09 × 10⁻¹ | 0.65 | 0.15 | 178.24 | 7.71 × 10⁻³ | 0.93 | 0.03 |
| 313 | 190 | 176.19 | 2.91 × 10⁻¹ | 0.66 | 0.21 | 180.60 | 6.36 × 10⁻³ | 0.92 | 0.05 | |
| 323 | 192 | 183.77 | 2.49 × 10⁻¹ | 0.50 | 0.92 | 191.51 | 3.57 × 10⁻³ | 0.81 | 0.35 | |
| Initial concentration [ppm] | Temp. [K] | Film diffusion model | Weber–Morris model | Dumwald–Wagner | |||
|---|---|---|---|---|---|---|---|
| R1 [min−1] | R2 | kist [mg g−1 s−0.5] | R2 | K [min−1] | R2 | ||
| 100 | 303 | 0.0277 | 0.99 | 1.98 | 0.99 | 0.027 | 0.99 |
| 313 | 0.0395 | 0.93 | 1.29 | 0.89 | 0.039 | 0.93 | |
| 323 | 0.0452 | 0.92 | 1.72 | 0.87 | 0.044 | 0.92 | |
| 150 | 303 | 0.0192 | 0.98 | 10.06 | 0.98 | 0.015 | 0.96 |
| 313 | 0.0275 | 0.96 | 12.27 | 0.99 | 0.023 | 0.94 | |
| 323 | 0.0320 | 0.95 | 12.96 | 0.99 | 0.027 | 0.93 | |
| 200 | 303 | 0.0584 | 0.89 | 2.23 | 0.96 | 0.015 | 0.95 |
| 313 | 0.0158 | 0.99 | 2.71 | 0.99 | 0.015 | 0.99 | |
| 323 | 0.0584 | 0.89 | 4.77 | 0.99 | 0.059 | 0.89 | |
When testing initial AR119 dye concentrations of 100, 150, and 200 ppm at different temperatures, the pseudo-second-order model aligned more closely with the experimental results compared with the pseudo-first-order model (Fig. 13–15). After reaching maximum adsorption, the initially very fast adsorption rate gradually slowed down to become stagnant. The temperature increased along with the adsorption capacity (qe). These findings suggested no rate limitation caused by adsorption processes. Additionally, this information indicated that in a multi-stage adsorption process, solute particles transitioned from the bulk solution to the solid surface, and then proceeded to diffuse into the pores of NICSS.
The Dumwald–Wagner model was employed to determine the true rate constant of absorption (K) (Fig. 16), which incorporates adjustments for experimental diffusion (Table 6). Our experimental data clearly showed numerous levels of linearity at all solute concentrations, as per the Weber–Morris model (Fig. 17). The adsorption rate was high at first (100 ppm) and lower temperatures. After that, it shifted and took a different linear trajectory before eventually stabilising with time. At higher temperatures, the rate became more linear. This was especially true after fitting the film diffusion model with data at higher temperatures (Fig. 18 and Table 6). These data suggested that the rate obstruction caused by adsorption was negligible due to diffusional constraints at higher temperatures. Hence, diffusion is a mechanism that limits rate. The solute is first absorbed rapidly onto the particle surface, generating a coating that subsequently slows down further diffusion and alters the absorption rate.
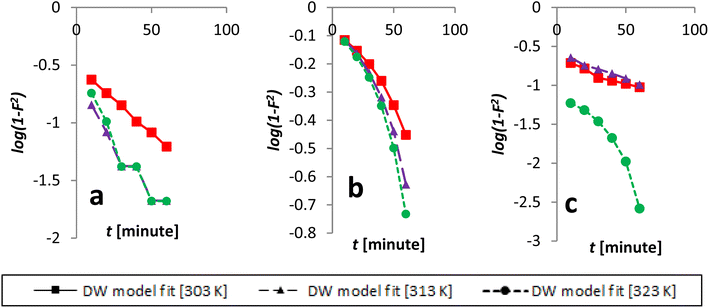 | ||
| Fig. 16 Kinetics data, beginning with an initial concentration of AR119, was modeled according to the Dumwald–Wagner model: (a) 100 ppm, (b) 150 ppm and (c) 200 ppm. | ||
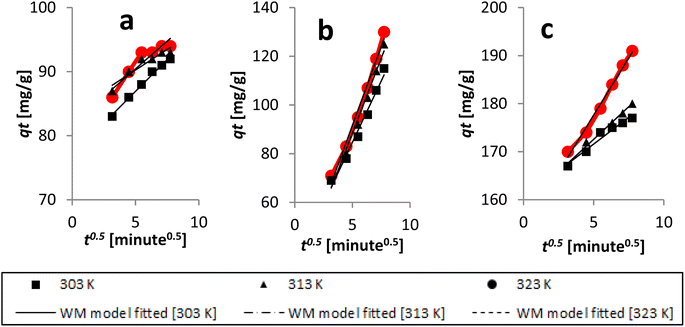 | ||
| Fig. 17 Kinetics data, with an initial concentration of AR119, were analyzed using the Weber–Morris model: (a) 100 ppm, (b) 150 ppm and (c) 200 ppm. | ||
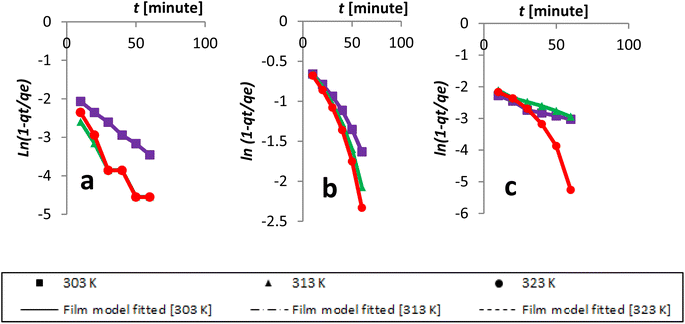 | ||
| Fig. 18 Kinetics data, with an initial concentration of AR119, were modeled according to the film diffusion model: (a) 100 ppm, (b) 150 ppm and (c) 200 ppm. | ||
3.9. Adsorption thermodynamics
The primary variables of the communication method are energy and entropy. The spontaneity of adsorption is signified by the change in Gibbs free energy (ΔG°). Adsorption was efficient when the change in free energy (ΔG°) related to the adsorption process was negative (Fig. 19 and 20). Table 7 provides estimations of the thermodynamic parameters.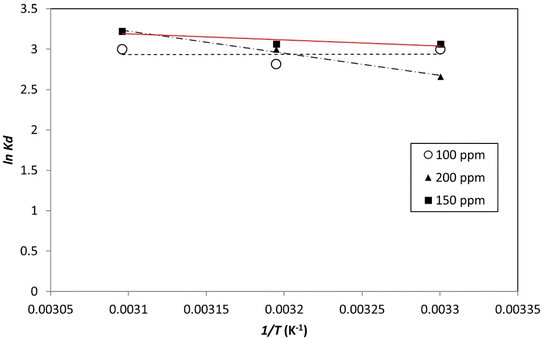 | ||
| Fig. 19 Plotting the thermodynamic equilibrium constant versus the reciprocal of temperature (1/T), the enthalpy and Gibbs free energy of the process was determined. | ||
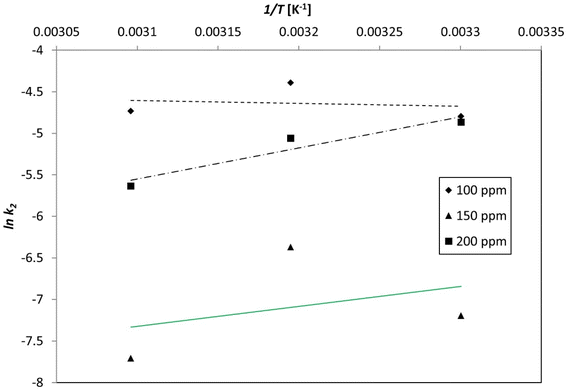 | ||
| Fig. 20 Plotting the pseudo-second-order kinetic constant as a function of the inverse of temperature (1/T) unveiled the activation energy of the process. | ||
| Initial concentration [ppm] | Temperature [K] | ΔG° [kJ mol−1] | ΔS° [J mol−1 K−1] | ΔH° [kJ mol−1] | ln![[thin space (1/6-em)]](https://www.rsc.org/images/entities/char_2009.gif) A A |
Ea [kJ mol−1] |
|---|---|---|---|---|---|---|
| 100 | 303 | −7.55 | 198.67 | −1.31 | −3.52 | 24.08 |
| 313 | −7.32 | |||||
| 323 | −8.05 | |||||
| 150 | 303 | −7.72 | 380.26 | 51.57 | −14.74 | −165.41 |
| 313 | −7.97 | |||||
| 323 | −8.64 | |||||
| 200 | 303 | −6.69 | 810.74 | 189.63 | −17.16 | −258.96 |
| 313 | −7.79 | |||||
| 323 | −8.64 |
3.10. Statistical optimization using a reduced factorial experimental framework
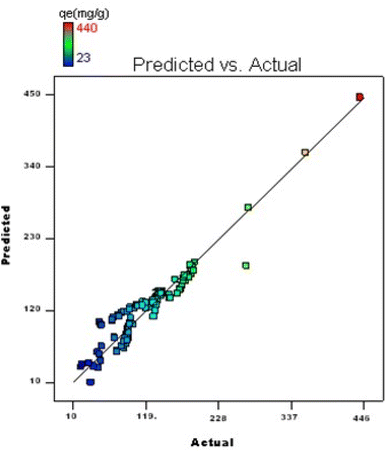
Tests were conducted using various combinations of the six independent factors to analyze their individual and combined impacts. The variance analysis of the quadratic regression model, as detailed in Table 8, highlighted the significance of the singular and interactive impacts of these factors. There was reasonable agreement between the modified R2 value of 89.6% and projected R2 value of 70.7%. The high coefficient of variance (16.2%) and R2 value of 91.0% of the model ensure that it could be utilized to navigate the design space. The expected reactions and experimental results showed a strong connection, as seen in the comparison graph of actual versus predicted values (Fig. 21). The following equation displays the regression equation that was derived from the investigation:| Adsorption = −15.1 + 28.0 × A + 4.6 × B + 203.1 × C − 12.6 × D − 75.7 × E − 53.4 × F − 0.3 × AB + 8.8 × AC + 8.6 × BC − 22.0 × A2 + 3.7 × B2 − 4.2 × C2 + 0.6 × D2 + 88.6 × E2 + 39.6 × F2 |
| Source | Sum of squares | Degree of freedom | Mean square | F value | P-value |
|---|---|---|---|---|---|
| a Significant figures. + suggestive significance (0.05 < p < 0.10). * moderately significant (0.01 < p ≤ 0.05). ** strongly significant (p ≤ 0.01). | |||||
| Model | 380042.7 | 15 | 25336.2 | 63.9 | <0.001** |
| A | 4515.5 | 1 | 4515.5 | 8.4 | 0.0011** |
| B | 115.2 | 1 | 115.2 | 0.3 | 0.5913 |
| C | 78941.2 | 1 | 78941.2 | 199.0 | <0.001** |
| D | 650.8 | 1 | 650.8 | 1.6 | 0.2034 |
| E | 24492.9 | 1 | 24492.9 | 61.7 | <0.001** |
| F | 13544.5 | 1 | 13544.5 | 34.1 | <0.001** |
| AB | 1.9 | 1 | 1.9 | 0.0 | 0.9443 |
| AC | 221.0 | 1 | 221.0 | 0.6 | 0.4573 |
| BC | 100.9 | 1 | 100.9 | 0.3 | 0.6152 |
| A2 | 4373.8 | 1 | 4373.8 | 8.0 | 0.0013** |
| B2 | 175.0 | 1 | 175.0 | 0.4 | 0.5082 |
| C2 | 31.4 | 1 | 31.4 | 0.1 | 0.7792 |
| D2 | 0.4 | 1 | 0.4 | 0.0 | 0.9750 |
| E2 | 8991.8 | 1 | 8991.8 | 22.7 | <0.001** |
| F2 | 2812.7 | 1 | 2812.7 | 7.1 | 0.0091** |
| Residual | 37689.6 | 95 | 396.7 | ||
| Total | 417732.3 | 110 | |||
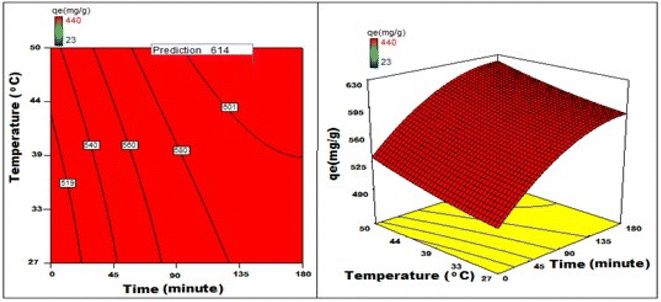
By applying the second-order polynomial equation, optimal variable values could be achieved by maximizing the interaction terms derived from multiple regression analysis, as suggested by the factorial fixed effects design (FFED). At the optimal settings, which included a pH of 1.4, an adsorbent dosage of 6.000 g L−1, an adsorbent particle size of 96 μm, an initial dye concentration of 599 mg L−1, an adsorption duration of 173 min, and an orbital shaking speed of 165 rpm at a temperature of 35 °C, the maximum adsorption efficiency achieved through statistical optimization was 614 mg g−1. The final phase of the investigation entailed generating a 3D response surface and contour plots to analyze the effects of two independent variables within the statistical optimization process.
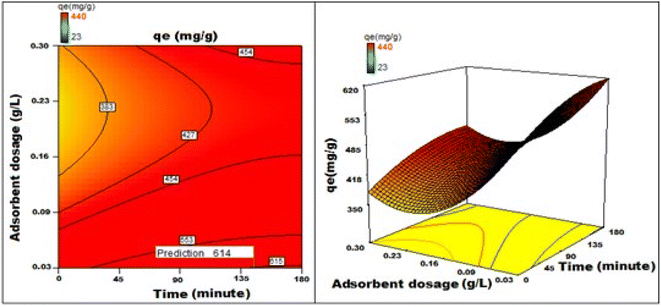
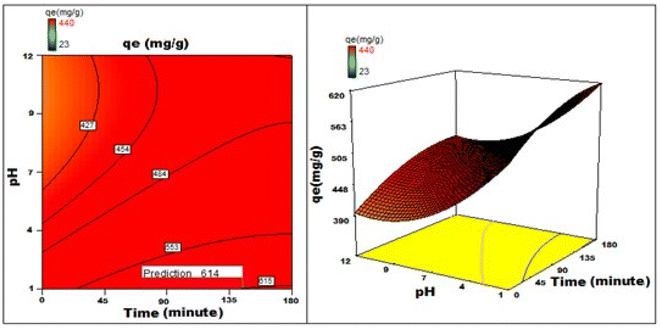
Fig. 22–25 show 3D graphs revealing the relationship between time and temperature (AB), concentration (AC), adsorbent particle size (AD), adsorbent dosage (AE), and pH (AF), where A is time, B is temperature, C is concentration, D is adsorbent particle size, E is adsorbent dosage, and F is pH. Time was shown to have a beneficial effect on adsorption ability. Adsorption capacity was positively impacted by time according to 3D graphs that plotted time against all other variables. We could speed-up the adsorption process by increasing the duration in addition to the temperature, particle size, and dye concentration. The “ideal” duration for the adsorption process was 173 min, and increasing the period further was found to enhance adsorption. Adsorption capacity was positively impacted by temperature increases. Adsorption capacity increased in tandem with temperature over time.
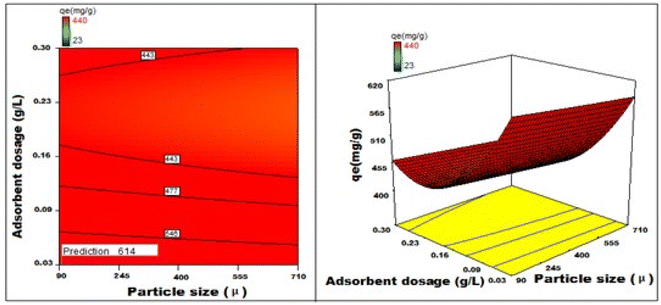 | ||
| Fig. 25 Fluctuations in adsorption capability correlated with the size of the particles and quantity of adsorbent deployed. | ||
It has been noted that a rise in the starting concentration of a dye boosts the adsorption capacity. A particle size of 96 μm was the maximum for adsorption; at larger sizes, the reactivity decreased. Higher initial dye concentrations led to increased levels of adsorption. The maximum pH at which the enhanced adsorption capacity can occur was around 1 and, as time increased, so did the sorption capacity. Positive numbers denote an incremental effect; for instance, a substantial increase in sorption capacity was caused by a temperature increase (B). Similarly, a negative number denoted a negative effect; in the case of adsorption dose (D), this meant that a rise in adsorption dosage resulted in a fall in the adsorption capacity of the adsorbent. Therefore, the surface and contour plots (Fig. 22–25) graphically depict the combined outcome of two limitations on biosorption.
It has been discovered that the quadratic model created for process optimization is useful for understanding the relationship between independent variables and how it affects the adsorption method, as well as for forecasting the maximum adsorption capacity. Adsorption was amplified from 420 mg g−1 to 614 mg g−1, a rise of >46.2%, as a result of statistical optimization.
3.11. Characterization of composites
Thermoplastic bio-composites comprising polypropylene and unsaturated polyester thermoset composites were investigated for their physicomechanical characteristics. Furthermore, an assessment was conducted on the impact of ageing on the tensile strength and chemical resistance of unsaturated polyester thermoset composites. Tables 9–12 provide more specific results.| Properties | Percent composition of polymer matrix and filler material | |||||||||||
|---|---|---|---|---|---|---|---|---|---|---|---|---|
PP![[thin space (1/6-em)]](https://www.rsc.org/images/entities/char_2009.gif) : :![[thin space (1/6-em)]](https://www.rsc.org/images/entities/char_2009.gif) NICSS NICSS |
PP![[thin space (1/6-em)]](https://www.rsc.org/images/entities/char_2009.gif) : :![[thin space (1/6-em)]](https://www.rsc.org/images/entities/char_2009.gif) dm-NICSS dm-NICSS |
|||||||||||
100![[thin space (1/6-em)]](https://www.rsc.org/images/entities/char_2009.gif) : :![[thin space (1/6-em)]](https://www.rsc.org/images/entities/char_2009.gif) 00 00 |
90![[thin space (1/6-em)]](https://www.rsc.org/images/entities/char_2009.gif) : :![[thin space (1/6-em)]](https://www.rsc.org/images/entities/char_2009.gif) 10 10 |
80![[thin space (1/6-em)]](https://www.rsc.org/images/entities/char_2009.gif) : :![[thin space (1/6-em)]](https://www.rsc.org/images/entities/char_2009.gif) 20 20 |
70![[thin space (1/6-em)]](https://www.rsc.org/images/entities/char_2009.gif) : :![[thin space (1/6-em)]](https://www.rsc.org/images/entities/char_2009.gif) 30 30 |
60![[thin space (1/6-em)]](https://www.rsc.org/images/entities/char_2009.gif) : :![[thin space (1/6-em)]](https://www.rsc.org/images/entities/char_2009.gif) 40 40 |
50![[thin space (1/6-em)]](https://www.rsc.org/images/entities/char_2009.gif) : :![[thin space (1/6-em)]](https://www.rsc.org/images/entities/char_2009.gif) 50 50 |
|
| a NRR: Non-reproducible results. | ||||||||||||
| Tensile strength (MPa) | 30.2 | 29.2 | 28.1 | 26.3 | 23.9 | 18.2 | 30.3 | 29.3 | 28.2 | 25.9 | 22.8 | 19.1 |
| Tensile modulus (MPa) | 1035 | 1354 | 1543 | 1758 | 1722 | 1613 | 1035 | 1358 | 1532 | 1747 | 1739 | 1634 |
| Tensile elongation at break (%) | 151 | 12.7 | 9.6 | 5.7 | 3.3 | 2.6 | 151 | 12.9 | 9.9 | 5.4 | 3.4 | 2.3 |
| Flexural strength (MPa) | 32.8 | 49.5 | 51.7 | 53.6 | 55.2 | NRR | 33.8 | 50.7 | 52.7 | 55.1 | 55.6 | NRR |
| Flexural modulus (MPa) | 821 | 492 | 1582 | 1747 | 2089 | NRR | 821 | 1126 | 1569 | 1782 | 2142 | NRR |
| Density (g cm−3) | 0.894 | 0.923 | 0.983 | 1.009 | 1.053 | NRR | 0.899 | 0.923 | 0.981 | 1.009 | 1.057 | NRR |
| Surface hardness (shores D) | 65 | 69 | 71 | 74 | 79 | NRR | 65 | 69 | 70 | 73 | 81 | NRR |
| Water absorption in 48 h (%) | 0.009 | 0.09 | 0.23 | 0.75 | 2.62 | NRR | 0.009 | 0.09 | 0.25 | 0.76 | 2.82 | NRR |
| Properties | Percentage composition | |||||||||
|---|---|---|---|---|---|---|---|---|---|---|
USP![[thin space (1/6-em)]](https://www.rsc.org/images/entities/char_2009.gif) : :![[thin space (1/6-em)]](https://www.rsc.org/images/entities/char_2009.gif) NICSS NICSS |
USP![[thin space (1/6-em)]](https://www.rsc.org/images/entities/char_2009.gif) : :![[thin space (1/6-em)]](https://www.rsc.org/images/entities/char_2009.gif) dm-NICSS dm-NICSS |
|||||||||
100![[thin space (1/6-em)]](https://www.rsc.org/images/entities/char_2009.gif) : :![[thin space (1/6-em)]](https://www.rsc.org/images/entities/char_2009.gif) 00 00 |
95![[thin space (1/6-em)]](https://www.rsc.org/images/entities/char_2009.gif) : :![[thin space (1/6-em)]](https://www.rsc.org/images/entities/char_2009.gif) 05 05 |
90![[thin space (1/6-em)]](https://www.rsc.org/images/entities/char_2009.gif) : :![[thin space (1/6-em)]](https://www.rsc.org/images/entities/char_2009.gif) 10 10 |
85![[thin space (1/6-em)]](https://www.rsc.org/images/entities/char_2009.gif) : :![[thin space (1/6-em)]](https://www.rsc.org/images/entities/char_2009.gif) 15 15 |
80![[thin space (1/6-em)]](https://www.rsc.org/images/entities/char_2009.gif) : :![[thin space (1/6-em)]](https://www.rsc.org/images/entities/char_2009.gif) 20 20 |
|
| Density (g mL−1) | ||||||||||
| Experimental | 1.214 | 1.216 | 1.223 | 1.217 | 1.234 | 1.214 | 1.214 | 1.223 | 1.226 | 1.227 |
| Theoretical | — | 1.217 | 1.225 | 1.235 | 1.236 | — | 1.217 | 1.225 | 1.235 | 1.236 |
![[thin space (1/6-em)]](https://www.rsc.org/images/entities/char_2009.gif) |
||||||||||
| Surface hardness (shores) ± 2 | 88.5 | 89.7 | 91.3 | 0.93 | 1.02 | 88.5 | 90.1 | 90.9 | 91.5 | 92.1 |
| Void content (%) | — | 0.42 | 0.84 | 0.89 | 1.00 | — | 0.40 | 0.81 | 0.91 | 1.06 |
| Specific tensile strength (kN m kg−1) | 36.5 | 25.1 | 24.6 | 20.7 | 18.6 | 36.5 | 25.3 | 24.7 | 20.7 | 18.4 |
| Properties | Percent composition | |||||||||||
|---|---|---|---|---|---|---|---|---|---|---|---|---|
USP![[thin space (1/6-em)]](https://www.rsc.org/images/entities/char_2009.gif) : :![[thin space (1/6-em)]](https://www.rsc.org/images/entities/char_2009.gif) NICSS NICSS |
USP![[thin space (1/6-em)]](https://www.rsc.org/images/entities/char_2009.gif) : :![[thin space (1/6-em)]](https://www.rsc.org/images/entities/char_2009.gif) dm-NICSS dm-NICSS |
|||||||||||
100![[thin space (1/6-em)]](https://www.rsc.org/images/entities/char_2009.gif) : :![[thin space (1/6-em)]](https://www.rsc.org/images/entities/char_2009.gif) 00 00 |
90![[thin space (1/6-em)]](https://www.rsc.org/images/entities/char_2009.gif) : :![[thin space (1/6-em)]](https://www.rsc.org/images/entities/char_2009.gif) 10 10 |
80![[thin space (1/6-em)]](https://www.rsc.org/images/entities/char_2009.gif) : :![[thin space (1/6-em)]](https://www.rsc.org/images/entities/char_2009.gif) 20 20 |
70![[thin space (1/6-em)]](https://www.rsc.org/images/entities/char_2009.gif) : :![[thin space (1/6-em)]](https://www.rsc.org/images/entities/char_2009.gif) 30 30 |
60![[thin space (1/6-em)]](https://www.rsc.org/images/entities/char_2009.gif) : :![[thin space (1/6-em)]](https://www.rsc.org/images/entities/char_2009.gif) 40 40 |
50![[thin space (1/6-em)]](https://www.rsc.org/images/entities/char_2009.gif) : :![[thin space (1/6-em)]](https://www.rsc.org/images/entities/char_2009.gif) 50 50 |
100![[thin space (1/6-em)]](https://www.rsc.org/images/entities/char_2009.gif) : :![[thin space (1/6-em)]](https://www.rsc.org/images/entities/char_2009.gif) 00 00 |
90![[thin space (1/6-em)]](https://www.rsc.org/images/entities/char_2009.gif) : :![[thin space (1/6-em)]](https://www.rsc.org/images/entities/char_2009.gif) 10 10 |
80![[thin space (1/6-em)]](https://www.rsc.org/images/entities/char_2009.gif) : :![[thin space (1/6-em)]](https://www.rsc.org/images/entities/char_2009.gif) 20 20 |
70![[thin space (1/6-em)]](https://www.rsc.org/images/entities/char_2009.gif) : :![[thin space (1/6-em)]](https://www.rsc.org/images/entities/char_2009.gif) 30 30 |
60![[thin space (1/6-em)]](https://www.rsc.org/images/entities/char_2009.gif) : :![[thin space (1/6-em)]](https://www.rsc.org/images/entities/char_2009.gif) 40 40 |
50![[thin space (1/6-em)]](https://www.rsc.org/images/entities/char_2009.gif) : :![[thin space (1/6-em)]](https://www.rsc.org/images/entities/char_2009.gif) 50 50 |
|
| Density (g cm−3) [experimental] | 1.213 | 1.216 | 1.223 | 1.217 | 1.234 | 1.213 | 1.214 | 1.224 | 1.226 | 1.227 | 1.214 | 1.216 |
| Density (g cm−3) [theoretical] | — | 1.216 | 1.225 | 1.235 | 1.236 | — | 1.216 | 1.225 | 1.235 | 1.236 | — | 1.217 |
| Surface hardness (shores) [±2] | 88.5 | 89.7 | 91.3 | 0.93 | 1.02 | 88.5 | 90.1 | 89.9 | 91.5 | 92.1 | 88.5 | 89.7 |
| Void content (%) | — | 0.42 | 0.84 | 0.90 | 1.00 | — | 0.40 | 0.81 | 0.91 | 1.06 | — | 0.42 |
| Specific tensile strength (kN m kg−1) | 36.5 | 25.1 | 24.6 | 20.7 | 18.6 | 36.5 | 25.3 | 24.7 | 20.7 | 18.4 | 36.5 | 25.1 |
| Chemical reagents | Percentage change in weight after seven days | ||||||||
|---|---|---|---|---|---|---|---|---|---|
| Neat USP | USP![[thin space (1/6-em)]](https://www.rsc.org/images/entities/char_2009.gif) : :![[thin space (1/6-em)]](https://www.rsc.org/images/entities/char_2009.gif) NICSS NICSS |
USP![[thin space (1/6-em)]](https://www.rsc.org/images/entities/char_2009.gif) : :![[thin space (1/6-em)]](https://www.rsc.org/images/entities/char_2009.gif) dm-NICSS dm-NICSS |
|||||||
100![[thin space (1/6-em)]](https://www.rsc.org/images/entities/char_2009.gif) : :![[thin space (1/6-em)]](https://www.rsc.org/images/entities/char_2009.gif) 00 00 |
95![[thin space (1/6-em)]](https://www.rsc.org/images/entities/char_2009.gif) : :![[thin space (1/6-em)]](https://www.rsc.org/images/entities/char_2009.gif) 05 05 |
90![[thin space (1/6-em)]](https://www.rsc.org/images/entities/char_2009.gif) : :![[thin space (1/6-em)]](https://www.rsc.org/images/entities/char_2009.gif) 10 10 |
85![[thin space (1/6-em)]](https://www.rsc.org/images/entities/char_2009.gif) : :![[thin space (1/6-em)]](https://www.rsc.org/images/entities/char_2009.gif) 15 15 |
80![[thin space (1/6-em)]](https://www.rsc.org/images/entities/char_2009.gif) : :![[thin space (1/6-em)]](https://www.rsc.org/images/entities/char_2009.gif) 20 20 |
|
| Water | 1.07 | 2.15 | 3.13 | 3.35 | 4.94 | 2.16 | 3.15 | 3.41 | 4.95 |
| 10% (v/v) acetic acid | 0.26 | 0.37 | 0.35 | 0.38 | 0.47 | 0.31 | 0.34 | 0.37 | 0.47 |
| 10% (v/v) hydrochloric acid | 0.31 | 0.36 | 0.45 | 0.47 | 0.51 | 0.35 | 0.43 | 0.46 | 0.47 |
| 10% (v/v) nitric acid | 0.35 | 0.40 | 0.59 | 0.65 | 0.67 | 0.39 | 0.57 | 0.63 | 0.65 |
| 10% (v/v) ammonium hypochlorite | 0.65 | 0.72 | 0.77 | 0.80 | 0.84 | 0.70 | 0.76 | 0.79 | 0.83 |
| 10% (v/v) sodium hydroxide | 2.87 | 3.33 | 4.35 | 5.94 | 7.79 | 3.17 | 4.27 | 5.91 | 7.68 |
According to a study on the physicomechanical characteristics of thermoplastic polypropylene composites, adding more NICSS or dm-NICSS filler increased the tensile modulus, reduced elongation at break, and increased tensile strength. However, when compared with plain PP, flexural characteristics significantly improved. Table 9 illustrates how the inclusion of hydrophilic NICSS affected the water-adsorption properties by causing a weight increase.
Our findings indicate that thermoset composites made of dmNICSS/NICSS and USP had superior dimensional stability compared with USP. Additionally, it verified enhanced resistance to all chemical reagents examined, with the exception of sodium hydroxide (10% w/v). On the other hand, the tensile strength declined as the filler content increased, most likely as a result of lower interfacial adhesion and decreased interaction between the filler material and polymer matrix.
3.12. Application of the proposed method to textile industrial effluent
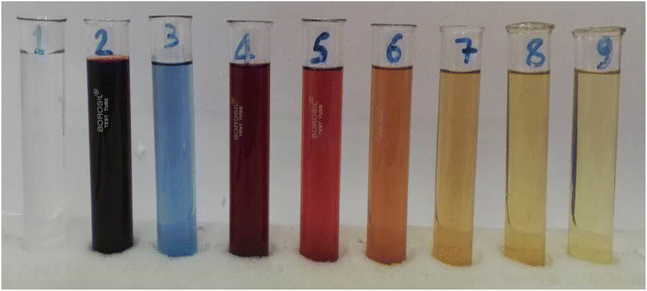
A simple procedure was developed to compare the remediation process for AR119 dye in water as well as in textile industrial effluent, and these are explained elsewhere.39 The detailed procedure involved nine steps. Step 1 involved 500 mL of solution 1 being transferred to a 1 L conical flask. Then, 5 g of NICSS was added to the conical flask and the solution was agitated at ∼700 rpm using magnetic stirrer. At the end of 15 min, agitation was stopped and solution was passed through number-42 Whatman filter paper using the Büchner funnel apparatus. If the filtrate was not clear, the filtration was repeated and absorbance recorded. For step 2, the dye-adsorbed NICSS on the filter paper of step 1 was carefully transferred from a Büchner funnel to a watch glass and kept in an oven at 60 °C for 24 h for drying. The dried powder was scraped using a spatula and transferred to a watch glass. For step 3, the second portion of 5 g NICSS was added to the conical flask containing the filtrate solution from step 1, and agitation was continued on a magnetic stirrer at ∼700 rpm for 15 min. At the end of 15 min, the agitation was stopped and the solution was passed through number-42 Whatman filter paper using the Büchner funnel apparatus. If the filtrate was not clear, the filtration was repeated and absorbance recorded. In step 4, the dye-adsorbed NICSS on the filter paper of step 3 was carefully transferred from a Büchner funnel to a watch glass and kept in an oven at 60 °C for 24 h for drying. The dried powder was scraped using a spatula and transferred to a watch glass. In step 5, the third portion of 5 g NICSS was added to the conical flask containing filtrate solution from step 3 and agitation was continued on a magnetic stirrer at ∼700 rpm for 15 min. At the end of 15 min, agitation was stopped and the solution was passed through number-42 Whatman filter paper using the Büchner funnel apparatus. If the filtrate was not clear, the filtration was repeated and absorbance recorded. At step 6, the dye-adsorbed NICSS on the filter paper of step 5 was carefully transferred from a Büchner funnel to a watch glass and kept in an oven at 60 °C for 24 h for drying. The dried powder was scraped using a spatula and transferred to a watch glass. For step 7, the fourth portion of 5 g NICSS was added to the conical flask containing the filtrate solution from step 5 and agitation was continued on a magnetic stirrer at ∼700 rpm for 15 min. At the end of 15 min, agitation was stopped and the solution passed through number-42 Whatman filter paper using the Büchner funnel apparatus. If the filtrate was not clear, the filtration was repeated and absorbance recorded. At step 8, the dye-adsorbed NICSS on the filter paper of step 7 was carefully transferred from a Büchner funnel to a watch glass and kept in an oven at 60 °C for 24 h for drying. The dried powder was scraped using a spatula and transferred to a watch glass. At step 9, steps 1 to 8 were repeated with solution 2.This procedure was also adopted using NICSS as an adsorbent. Recovery of the dye and allied substances to the extent of 75%, 85%, 94%, and 96% after 15, 30, 45, and 60 min, respectively, was obtained. This observation was in line with the kinetic results, where the solute is adsorbed onto the surface, quickly forming a film. Later on, the adsorption is retarded due to the formation of the film, thereby causing a change in absorption rates. The scaling up of the experiment was done using 10 g, 20 g, and 50 g of NICSS and using 1, 2 and 5 L of AR119 dye dissolved in TIE. In all cases, the results did not exceed ±2% error. The scale-up experimental data yielded promising and reliable results about the process, which could be extended to a higher scale to operate in an industrial environment. The powder and filtrate solutions after the adsorption of constituents of the solution on NICSS are shown in Fig. 26 and 27.
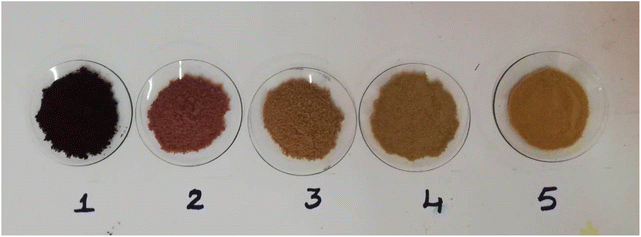 | ||
| Fig. 26 : Powders 1 to 4: fresh samples of NICSS added to AR119-TIE solution after every 15 min, filtered and the residue dried in an oven. Sample 5: NICSS. | ||
3.13. Regeneration of the adsorbent and cost analysis
Dye-adsorbed NICSS could be regenerated for reuse along with the recovery of the adsorbed NICSS. However, the proposition may not prove economical because the process and solvent costs will be much higher when compared with the recovered adsorbent cost (<1 US$ for 50 kg of NICSS). In addition, enhancement of E-factor23 is not desirable because it will add to the unprecedented load of environmental toxicants. However in our research team, work is in progress to use dye-adsorbed nutraceutical industrial spent as filler/reinforcing material, and encouraging results have emerged, some of which have been published elsewhere.35For academic curiosity, preliminary investigations were carried out to desorb the adsorbed toxicants on NICSS. The solvents we aimed to use were methyl alcohol, ethyl alcohol, acetone, and dimethylformamide. However, dimethylformamide was not used because it is toxic. Use of acetone created turbidity after three cycles. Methyl alcohol and ethyl alcohol displayed almost similar results. Methyl alcohol was toxic compared with ethyl alcohol. However, the cost of ethyl alcohol is exorbitantly high compared with the cost of the material. Five cycles were carried out with an efficiency of ∼90%. However, the idea of recycling is not a desirable proposition because the cost of recycling is approximately 500-times than the cost of the adsorbent.
4. Conclusions
NICSS has been utilized as a biosorbent for the treatment of harmful dyes, adding value to the waste produced in the nutraceutical sector. NICSS showed efficacy as an adsorbent for AR119 in an aqueous solution. The adsorption mechanism of AR119 was nearly spontaneous and endothermic. The results aligned closely with the pseudo-second-order kinetic model. Intra-particular diffusion was significantly impacted by the film, and the method was primarily physical. The FTIR and SEM spectra verified that AR119 was adsorbed onto NICSS. Using by-products from nutraceutical industries as adsorbents to tackle pollution offers a more sustainable, cost-effective, and efficient solution. As an assumption, tonnes of renewable trash and waste materials are being produced by the unprecedently fast ascent of the nutraceutical industries to prominence in the global economy. The ecosystem is being adversely affected by this. Under such circumstances, the agro-industrial sector, which includes the nutraceutical industry, is unable to sustainably contaminate the environment. Efficient management of nutraceutical expenditures and/or waste is urgently needed to maintain the development of the nutraceutical industry. The key elements of recycling include reutilization, renewal, and retrieval. These are the remedial strategies used in environmental management employing the concepts of the CE. In brief, the textile industry is facing new challenges with emerging trends such as sustainability, transparency, and new businesses with consumption models derived from the waste of one industry to be used as a raw material for another industry and/or a process. This aligns with the CE model based on product design and development, waste collection and sorting, and effectively reusing waste as a starting material for the next process.Data availability
Data are available upon request to the corresponding author.Conflicts of interest
No conflicts of interest exist among the authors.Acknowledgements
The authors would like to acknowledge the support provided by Researchers Supporting Project Number RSP2024R424, King Saud University, Riyadh, Saudi Arabia.References
- E. Mazur-Wierzbicka, Towards circular economy—A comparative analysis of the countries of the European Union, Resour, 2021, 10(5), 49 CrossRef.
- O. E. Ogunmakinde, W. Sher and T. Egbelakin, Circular economy pillars: A semi-systematic review, Clean Technol. Environ. Policy, 2021, 23, 899–914 CrossRef.
- A. S. Homrich, G. Galvão, L. G. Abadia and M. M. Carvalho, The circular economy umbrella: Trends and gaps on integrating pathways, J. Cleaner Prod., 2018, 175, 525–543 CrossRef.
- B. Jaeger and A. Upadhyay, Understanding barriers to circular economy: cases from the manufacturing industry, J. Enterp. Inf. Manag., 2020, 33(4), 729–745 CrossRef.
- United Nations, The Sustainable Development Agenda, available online: https://www.un.org/sustainabledevelopment/development-agenda/, accessed on 6 May 2024.
- Y. Li, L. Lu, Y. Tan, L. Wang and M. Shen, Decoupling water consumption and environmental impact on textile industry by using water footprint method: A case study in China, Water, 2017, 9, 124 CrossRef.
- https://dnbam.com/en/finance-blog/textile-industry-responsible-for-20-of-global-waterpollution#:%7E:text=AccordingtoWRI%2Canestimated,tomakeacottonshirt, accessed on 6 May 2024.
- T. Akter, A. T. Protity, M. Shaha, M. Al Mamun and A. Hashem, The impact of textile dyes on the environment, in Nanohybrid Materials for Treatment of Textiles Dyes, Springer Nature Singapore, Singapore, 2023, pp. 401–431 Search PubMed.
- S. S. Muthu, Y. Li, J. Hu and P. Y. Mok, Quantification of environmental impact and ecological sustainability for textile fibres, Ecol. Indic., 2012, 13, 66–74 CrossRef CAS.
- C. O. Tuck, E. Pérez, I. T. Horváth, R. A. Sheldon and M. Poliakoff, Valorization of biomass: Deriving more value from waste, Science, 2012, 337, 695–699 CrossRef CAS PubMed.
- S. N. Taqui, R. Yahya, A. Hassan, F. Khanum and A. A. Syed, Valorization of Nutraceutical Industrial Coriander Seed Spent by the Process of Sustainable Adsorption System of Acid Black 52 from Aqueous Solution, Int. J. Environ. Res., 2019, 13, 639–659 CrossRef CAS.
- M. Geissdoerfer, P. Savaget, N. M. Bocken and E. J. Hultink, The Circular Economy–A new sustainability paradigm?, J. Cleaner Prod., 2017, 143, 757–768 CrossRef.
- J. Kirchherr, D. Reike and M. Hekkert, Conceptualizing the circular economy: An analysis of 114 definitions, Resour., Conserv. Recycl., 2017, 127, 221–232 CrossRef.
- P. Morseletto, Targets for a circular economy, Resour., Conserv. Recycl., 2020, 153, 104553 CrossRef.
- F. M. D. Chequer, D. J. Dorta and D. P. de Oliveira, Azo dyes and their metabolites: does the discharge of the azo dye into water bodies represent human and ecological risks, Adv. Treat. Text. Efflu., 2011, 48, 28–48 Search PubMed.
- A. Bafana, S. S. Devi and T. Chakrabarti, Azo dyes: past, present and the future, Environ. Rev., 2011, 19, 350–371 CrossRef CAS.
- F. D. Chequer, G. R. De Oliveira, E. A. Ferraz, J. C. Cardoso, M. B. Zanoni and D. P. de Oliveira, Textile dyes: Dyeing process and environmental impact, Eco-Friendly Text. Dyeing Finish., 2013, 6, 151–176 Search PubMed.
- D. Rawat, V. Mishra and R. S. Sharma, Detoxification of azo dyes in the context of environmental processes, Chemosphere, 2016, 155, 591–605 CrossRef CAS PubMed.
- S. R. Dave and R. H. Dave, Isolation and characterization of Bacillus thuringiensis for Acid red 119 dye decolourisation, Bioresour. Technol., 2009, 100, 249–253 CrossRef CAS PubMed.
- S. S. Moghaddam, M. A. Moghaddam and M. Arami, Response surface optimization of acid red 119 dye from simulated wastewater using Al based waterworks sludge and polyaluminium chloride as coagulant, J. Environ. Manage., 2011, 92, 1284–1291 CrossRef PubMed.
- S. Sadri Moghaddam, M. Alavi Moghaddam and M. Arami, A comparison study on Acid Red 119 dye removal using two different types of waterworks sludge, Water Sci. Technol., 2010, 61, 1673–1681 CrossRef CAS PubMed.
- S. S. Moghaddam, M. R. Alavi Moghaddam and M. Arami, Response surface optimization of acid red 119 dye adsorption by mixtures of dried sewage sludge and sewage sludge ash, Clean: Soil, Air, Water, 2012, 40(6), 652–660 CAS.
- R. A. Sheldon, Organic synthesis-past, present and future, Chem. Ind., 1992, 23, 903–906 Search PubMed.
- R. Sidari and R. Tofalo, A comprehensive overview on microalgal-fortified/based food and beverages, Food Rev. Int., 2019, 35, 778–805 CrossRef CAS.
- K. V. Peter, Handbook of Herbs and Spices, Woodhead Publishing, Cambridge, 2006, vol. 3 Search PubMed.
- B. Yu, Y. Zhang, A. Shukla, S. S. Shukla and K. L. Dorris, The removal of heavy metal from aqueous solutions by sawdust adsorption—removal of copper, J. Hazard. Mater., 2000, 80(1–3), 33–42 CrossRef CAS PubMed.
- Y. Bulut and Z. Tez, Adsorption studies on ground shells of hazelnut and almond, J. Hazard. Mater., 2007, 149(1), 35–41 CrossRef CAS PubMed.
- S. R. Shukla and R. S. Pai, Removal of Pb (II) from solution using cellulose-containing materials, J. Chem. Technol. Biotechnol., 2005, 80(2), 176–183 CrossRef CAS.
- Y. S. Ho, C. T. Huang and H. W. Huang, Equilibrium sorption isotherm for metal ions on tree fern, Process Biochem., 2002, 37(12), 1421–1430 CrossRef CAS.
- M. Martinez, N. Miralles, S. Hidalgo, N. Fiol, I. Villaescusa and J. Poch, Removal of lead (II) and cadmium (II) from aqueous solutions using grape stalk waste, J. Hazard. Mater., 2006, 133(1–3), 203–211 CrossRef CAS PubMed.
- A. Saeed, M. Iqbal and M. W. Akhtar, Removal and recovery of lead (II) from single and multimetal (Cd, Cu, Ni, Zn) solutions by crop milling waste (black gram husk), J. Hazard. Mater., 2005, 117(1), 65–73 CrossRef CAS PubMed.
- S. Pashaei, S. Hosseinzadeh and A. A. Syed, Studies on coconut shell powder and crysnanoclay incorporated acrylonitrile butadiene rubber/styrene butadiene rubber (NBR/SBR) green nanocomposites, Polym. Compos., 2017, 38(4), 727–735 CrossRef CAS.
- S. N. Taqui, R. Yahya, A. Hassan, N. Nayak and A. A. Syed, A novel sustainable design to develop polypropylene and unsaturated polyester resin polymer composites from waste of major polluting industries and investigation on their physicomechanical and wear properties, Polym. Compos., 2019, 40(3), 1142–1157 CrossRef CAS.
- M. A. Syed, S. Akhtar, S. Siddaramaiah and A. A. Syed, Studies on the physico-mechanical, thermal, and morphological behaviors of high density polyethylene/coleus spent green composites, J. Appl. Polym. Sci., 2011, 119(4), 1889–1895 CrossRef CAS.
- S. N. Taqui, R. Yahya, A. Hassan, N. Nayak and A. A. Syed, Adsorption of Acid Blue 113 from aqueous solution onto nutraceutical industrial coriander seed spent: Isotherm, kinetics, thermodynamics and modeling studies, Desalin. Water Treat., 2019, 153, 321–337 CrossRef CAS.
- S. N. Taqui, M. Cs, M. S. Goodarzi, M. A. Elkotb, B. A. Khatoon, M. E. M. Soudagar, I. B. Koki, A. Elfasakhany, A. S. Khalifa, M. A. Ali and Z. Saifullah, Sustainable adsorption method for the remediation of crystal violet dye using nutraceutical industrial fenugreek seed spent, Appl. Sci., 2021, 11(16), 7635 CrossRef CAS.
- S. N. Taqui, U. T. Syed, R. T. Syed, M. S. Alqahtani, M. Abbas and A. A. Syed, Bioremediation of Textile Industrial Effluents Using Nutraceutical Industrial Spent: Laboratory-Scale Demonstration of Circular Economy, Nanomaterials, 2022, 12(10), 1684 CrossRef CAS PubMed.
- R. Sulthana, S. N. Taqui, U. T. Syed, M. E. M. Soudagar, M. A. Mujtaba, R. A. Mir, K. Shahapurkar, A. Khidmatgar, V. Mohanavel, A. A. Syed and N. Hossain, Biosorption of crystal violet by nutraceutical industrial fennel seed spent equilibrium, kinetics, and thermodynamic studies, Biocatal. Agric. Biotechnol., 2022, 43, 102402 CrossRef CAS.
- S. A. Yakuth, S. N. Taqui, U. T. Syed and A. A. Syed, Nutraceutical industrial chillies stalk waste as a new adsorbent for the removal of Acid Violet 49 from water and textile industrial effluent: Adsorption isotherms and kinetic models, Desalin. Water Treat., 2019, 155, 94–112 CrossRef CAS.
- S. Chowdhury and P. Das, Utilization of a domestic waste—eggshells for removal of hazardous malachite green from aqueous solutions, Environ. Prog. Sustainable Energy, 2012, 31(3), 415–425 CrossRef CAS.
- I. Langmuir, The constitution and fundamental properties of solids and liquids. Part I. Solids, J. Am. Chem. Soc., 1916, 38(11), 2221–2295 CrossRef CAS.
- T. W. Webber and R. K. Chakravorti, Pore and solid diffusion models for fixed-bed adsorbers, AIChE J., 1974, 20(2), 228–238 CrossRef.
- H. M. F. Freundlich, Over the adsorption in solution, J. Phys. Chem., 1906, 57(385471), 1100–1107 Search PubMed.
- D. S. Jovanović, Physical adsorption of gases, Kolloid Z. Z. Polym., 1969, 235(1), 1203–1213 CrossRef.
- O. J. D. L. Redlich and D. L. Peterson, A useful adsorption isotherm, J. Phys. Chem., 1959, 63(6), 1024 CrossRef CAS.
- F. Brouers, O. Sotolongo, F. Marquez and J. P. Pirard, Microporous and heterogeneous surface adsorption isotherms arising from Levy distributions, Phys. A, 2005, 349(1–2), 271–282 CrossRef CAS.
- W. R. Vieth and K. J. Sladek, A model for diffusion in a glassy polymer, J. Colloid Sci., 1965, 20(9), 1014–1033 CrossRef CAS.
- J. Toth, State equation of the solid-gas interface layers, Acta Chim. Hung., 1971, 69, 311–328 CAS.
- R. Sips, Combined form of Langmuir and Freundlich equations, J. Phys. Chem., 1948, 16(429), 490–495 CrossRef CAS.
- C. J. Radke and J. M. Prausnitz, Thermodynamics of multi-solute adsorption from dilute liquid solutions, AIChE J., 1972, 18(4), 761–768 CrossRef CAS.
- S. K. Lagergren, About the theory of so-called adsorption of soluble substances, Sven. Vetenskapsakad. Handingarl., 1898, 24, 1–39 Search PubMed.
- Y. S. Ho and G. McKay, Sorption of dye from aqueous solution by peat, Chem. Eng. J., 1998, 70(2), 115–124 CrossRef CAS.
- M. Alkan, Ö. Demirbaş and M. Doğan, Adsorption kinetics and thermodynamics of an anionic dye onto sepiolite, Microporous Mesoporous Mater., 2007, 101(3), 388–396 CrossRef CAS.
- H. L. Wang, J. L. Chen and Z. C. Zhai, Study on thermodynamics and kinetics of adsorption of p-toluidine from aqueous solution by hypercrosslinked polymeric adsorbents, Environ. Chem., 2004, 23(2), 188–192 CAS.
- G. E. Boyd, A. W. Adamson and L. S. Myers Jr, The exchange adsorption of ions from aqueous solutions by organic zeolites. II. Kinetics1, J. Am. Chem. Soc., 1947, 69(11), 2836–2848 CrossRef CAS PubMed.
| This journal is © The Royal Society of Chemistry 2024 |

