 Open Access Article
Realization of Mg2+ intercalation in a thermodynamically stable layer-structured oxide†
Junhao Zhangab,
Haotian Guanab,
Jili Yue *ab,
Yangfan Lu
 ab,
Qian Liab,
Guangsheng Huangab,
Jingfeng Wangab,
Baihua Qu*ab and
Fusheng Panab
aCollege of Materials Science and Engineering, National Engineering Research Center for Magnesium Alloys, National Innovation Center for Industry-Education Integration of Energy Storage Technology, Chongqing University, Chongqing, 400044, China. E-mail: jili.yue@cqu.edu.cn; bhqu@cqu.edu.cn
bChongqing Institute of New Energy Storage Materials and Equipment, Chongqing, 401135, China
First published on 14th October 2024
Abstract
Magnesium batteries have emerged as one of the considerable choices for next-generation batteries. Oxide compounds have attracted great attention as cathodes for magnesium batteries because of their high output voltages and ease of synthesis. However, a majority of the reported results are based on metastable nanoscale oxide materials. This study puts forward a thermodynamically stable layer-structured oxide K0.5MnO2 with an enlarged lattice spacing as a model cathode material employing optimized electrolytes, enabling Mg2+ intercalation into the K0.5MnO2 framework in a real magnesium battery directly using Mg foil as the anode. First-principles calculations implied that the enlarged layer spacing could decrease the migration energy barrier of Mg2+ in the layered oxide. This work can pave the way to understanding the fundamental intercalation behavior of Mg2+ in magnesium batteries.
Introduction
Magnesium batteries are considered as a promising next-generation electrochemical energy storage technology because of the high volumetric capacity (Mg: 3833 mA h cm3), abundance of Mg resources, and lower tendency of forming dendrites.1–8 However, the high charge density of Mg2+ leads to strong coulombic interactions with the host framework, making Mg2+ intercalation into many host materials difficult. The first magnesium battery prototype was achieved using a Chevrel-phase Mo6S8 as the cathode, in which Mg2+ could be intercalated reversibly with relatively fast kinetics in the three-dimensional channels.9 This prototype promoted the research on magnesium batteries. However, this Mo6S8 cathode displayed low discharge voltage (about 1 V) with a low capacity of 75 mA h g1, and the synthesis method was also time-consuming and complicated.10–12Oxide compounds have attracted great attention because of their high output voltages and ease of synthesis.13 The voltage profile and mobility of Mg2+ intercalation in a chromium oxide spinel (MgxCr2O4) as a cathode for magnesium batteries were studied by first-principles calculations; the results indicated that the stable Mg-vacancy orderings for the cathode compositions of Mg0.33Cr2O4 and Mg0.5Cr2O4 can severely limit Mg (de)intercalation.14,15 Kown et al. pointed out that spinels with a single redox metal, such as MgCr2O4 or MgMn2O4, were not found to demonstrate sufficiently reversible Mg2+ intercalation at high redox potentials when coupled with nonaqueous Mg electrolytes.16–18
Novak et al. reported that Mg2+ can be reversibly intercalated into α-V2O5, displaying a capacity of ∼170 mA h g−1 using an acetonitrile electrolyte containing water.19 Yu et al. also showed improvements in the capacity using a Mg(ClO4)2/polycarbonate (PC) system with water.20 First-principles calculations showed the scenario of Mg2+ and H2O co-intercalation in nanocrystalline Xerogel-V2O5; the remarkable Mg mobility was ascribed to the electrostatic shielding of divalent Mg2+ by the water molecules contained in the crystal structure.21 Meanwhile, the realization of Mg2+ co-intercalation with H2O into V2O5 using an electrolyte containing water was done in a three-electrode or two-electrode system with active carbon anode.22,23 The presence of H2O in the electrolyte or that coordinated with the Mg2+ caused passivation at the Mg anode. Son et al. built an artificial Mg2+-conductive interphase on the Mg anode surface, enabling the reversible cycling of a Mg‖V2O5 full-cell in the water-containing carbonate-based electrolyte.24 However, the Mg powder used in this work is difficult to handle and the procedure is complicated. Chromium oxides and vanadium oxides are toxic; thus, it is necessary to use environmentally-friendly oxides.
Manganese-based oxide is also a kind of promising cathode candidate for magnesium batteries because of the abundance of Mn resources and its environmental friendliness. Nam et al. reported that nanoscale layer-structured Birnessite-MnO2 with crystal water can effectively screen the electrostatic interactions between Mg2+ and the host anions.25,26 Wang et al. demonstrated similar results that crystal water in layer-structured Birnessite-MnO2 with enlarged interlayer spacing could facilitate Mg2+ migration.27 Unfortunately, they used Ag/AgCl as the reference electrode instead of Mg foil anode, which was not a real magnesium battery. Miralles et al. proved the insertion of Mg2+ in Mn2O3 electrodes through a spectroelectrochemical study using aqueous media with Ag/AgCl reference electrode.28 Shimokawa et al. studied Mg-ion storage materials based on MnO2 frameworks, while the MnO2 polymorphs were metastable or nanoscale.29
To date, although several oxide systems have been investigated as cathode materials for magnesium batteries, the majority of the reported results are based on metastable nanoscale materials, H2O or other molecules-inserted materials using a three-electrode system or active carbon anode (Table S1†). To demonstrate Mg2+ intercalation into a host and study the fundamental principles of Mg2+ intercalation, the model materials should satisfy the following conditions: (1) the host compound should be thermodynamically stable; (2) Mg foil can be directly used as the anode; (3) there exist vacancies in its crystal structure that permit Mg2+ intercalation. Herein, we utilized thermodynamically stable K0.5MnO2 as the cathode in optimized electrolytes, realizing Mg2+ intercalation into the K0.5MnO2 framework in a real magnesium battery directly using Mg foil as the anode, where a high specific capacity of 99 mA h g1 was obtained at the first discharge at 10 mA g1. This work can pave the way to understanding the fundamental intercalation behaviors of Mg2+ in magnesium batteries.
Results and discussion
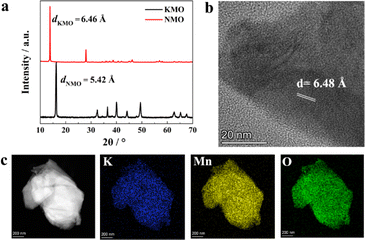
Layer-structured transition metal oxides are not only suitable cathodes for commercial batteries but also an excellent platform to study various fundamental scientific issues.30–34 Typically, it is reported that the first-cycle voltage hysteresis is determined by the superstructure in the cathode, specifically the local ordering of lithium and transition metal ions in the transition metal layers by comparing two closely related layer-structured transition metal oxide intercalation cathodes, namely, Na0.75[Li0.25Mn0.75]O2 and Na0.6[Li0.2Mn0.8]O2.34 Inspired by this work, we selected thermodynamically stable AxMnO2 (A = alkali, such as Li, Na, and K) as model materials, which have similar layered structure with different interlayer spacing due to the different radius of A (Li+ 0.76 Å, Na+ 1.02 Å, K+ 1.38 Å). Because layered LixMnO2 is meta-stable and the value of x in LixMnO2 is close to 1.0, there is no vacancy to accommodate Mg2+ ions.35 There exist A-site vacancies in thermodynamically stable Na and K-containing layer-structured manganese oxide, which can be used to insert Mg2+ directly. Typical Na-deficient Na0.67MnO2 (abbreviated as NMO in the following part)36 and K-deficient K0.5MnO2 (abbreviated as KMO in the following part)37 were selected as the host framework to investigate the intercalation behaviors of Mg2+ ion.Fig. 1 shows the characterization results of the as-prepared NMO and KMO. The XRD pattern of the as-synthesized KMO and NMO can be well indexed with PDF card no. 16-0205 and no. 27-0751. However, the crystallographic parameters of PDF card no. 16-0205 are not included in the Inorganic Crystal Structure Database (ICSD) yet. According to the literature,38–40 the crystallographic parameters of KMO38,39 and NMO40 are listed in Table S2 and S3,† respectively. The XRD pattern shows sharp peaks and a good match between the sample and the PDF card with almost no presence of spurious peaks, which not only indicates the good crystallinity of KMO and NMO but also the high purity of the sample. The first reflection peak in the X-ray diffraction (XRD) patterns represent the layer-spacing of layered-structure oxide,31–33 according to the Bragg equation 2d·sin(θ) = λ, where a lower 2θ means larger layer spacing. As shown in Fig. 1a, the first reflection peak of KMO in the XRD patterns is located at lower 2θ than that of NMO; thus, KMO has a larger layer spacing distance. Calculated from the XRD patterns, the d-spacing of NMO (dNMO) is 5.42 Å, and the d-spacing of KMO (dKMO) is 6.46 Å. Fig. 1b shows the high-resolution transmission electron microscopy (HRTEM) result of KMO, showing the clear lattice strips with d-spacing of 6.48 Å, which is consistent with the XRD result. The larger d-spacing can weaken the interactions between Mg2+ and the MnO2 host framework, facilitating Mg2+ migration; thus, Mg2+ can be intercalated into KMO. Fig. 1c shows the high-angle annular dark field (HAADF) energy dispersive spectrometry (EDS) mapping of KMO, indicating the homogeneous elemental distribution of K, Mn, and O. Fig. S1a and b† show the scanning electron microscopy (SEM) images of the as-synthesized NMO and KMO, respectively. Both materials show a distinct lamellar structure and have particle sizes ranging from about 1 to 3 μm. It implies that particle size is not the main factor affecting the electrochemical performances.
 | ||
| Fig. 1 Characterization of the as-prepared NMO and KMO. (a) XRD patterns of NMO and KMO, (b) HRTEM image of KMO, and (c) EDS mapping of KMO. | ||
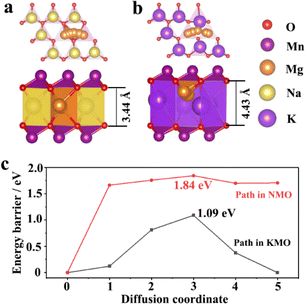
Density functional theory (DFT) calculations were applied to understand the migration energy barriers of Mg2+ in the alkali layers of NMO and KMO. The migration path of Mg2+ in NMO and KMO obtained by DFT-based climbing nudged elastic band (CI-NEB) method is shown in Fig. 2a and b. The interlayer distance of “O–Na–O” is 3.44 Å, and for “O–K–O”, it is 4.43 Å. Fig. 2c shows the migration energy barriers of Mg2+ in the alkali layers of NMO and KMO calculated by the CI-NEB method. It is obvious that the migration energy barriers of Mg2+ in KMO is lower than that in NMO, suggesting that increasing the layer spacing can promote Mg2+ migration.
 | ||
| Fig. 2 Schematic diagrams of crystal structures of (a) NMO, (b) KMO; (c) the migration energy of Mg2+ in NMO and KMO. | ||
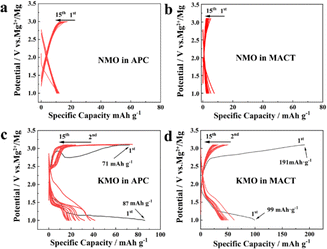
In a previous report in the area of magnesium batteries, activated carbon was used as the anode, and the electrode potential of activated carbon will change, more like an asymmetric electrochemical capacitor.38 In this work, NMO and KMO were tested in all-phenyl complex electrolyte (APC) and MgCl2/AlCl3/Mg(TFSI)2 in dimethyl ether (DME) electrolyte (MACT) with magnesium foil as real magnesium batteries. Fig. S2† shows the linear sweep voltammetry curves of the APC and MACT electrolytes using the Mo electrode; the electrochemical stability window of APC and MACT are both more than 3.5 V vs. Mg2+/Mg. Fig. 3 shows the electrochemical performances of NMO and KMO in real magnesium batteries at a current density of 10 mA g1 between 1.0 and 3.1 V. The open circuit potential (OCP) of NMO in APC is 2.1 V, and the first discharge capacity of NMO in APC is only ∼12 mA h g1; there is still about 12 mA h g−1 capacity in the following cycles (Fig. 3a). The OCP of NMO in MACT is 1.99 V; the first discharge capacity of NMO in MACT is only ∼7.6 mA h g−1, which decays to ∼3 mA h g1 at the 15th cycle. Although the capacities in the two electrolytes are slightly different, they both display little capacity decay. These results mean that Mg2+ can hardly intercalate into NMO (Fig. 3b). As shown in Fig. 3c, the OCP of KMO in APC is 2.07 V; the first discharge curve of KMO in APC displays two plateaus: the first one is located from 1.82 to 1.36 V with a capacity of 12 mA h g1, following a discharge plateau from 1.35 to 1.0 V with a capacity of 74.2 mA h g1, thus with a total capacity of 86.2 mA h g1. The first charge capacity is 71 mA h g1. The second discharge curve shows a voltage plateau from 1.5 to 1.0 V; the capacity of the second cycle is 41 mA h g1, which decays to about 20 mA h g1 in the 15th cycle. Fig. 3d shows the charge–discharge curves of KMO in MACT. The OCP of KMnO in MACT is 2.08 V, and the first discharge curve of KMO in MACT displays two plateaus as well. The first one is located from 1.85 to 1.33 V with a capacity of 22.87 mA h g1, following a discharge plateau from 1.33 to 1.0 V with a capacity of 76.13 mA h g1, with a total capacity of 99.0 mA h g1. The capacity decays to about 36.8 mA h g−1 in the 15th cycle. Fig. S4† shows the cycle performance of KMO in MACT at 10 mA g1; the capacity reaches 10.2 mA h g1 in the 60th cycle. Though Mg2+ can be intercalated into KMO, it suffers from quick capacity fading, which needs to be improved by doping, coating and additives in electrolytes. Fig. S5† shows the cyclic voltammetry (CV) curve of KMO in MACT in the potential range of 1.0–3.1 V vs. Mg2+/Mg at the scan rate of 0.1 mV s1. The OCP is 2.03 V, which is close to the value in the galvanostatic charge/discharge curve. There is a hump from 1.8 to 1.1 V and a peak at about 1.5 V. These electrochemical curves imply that Mg2+ can be intercalated into KMO. Galvanostatic intermittent titration technique (GITT) test was performed to estimate the Mg2+ diffusion coefficient (DMg2+), as shown in Fig. S6.† The values of DMg2+ calculated at each interval were determined in the order of magnitudes ranging from 10−12 to 1010 cm2 s−1. The Nyquist plots obtained using electrochemical impedance spectroscopy (EIS) at the OCP for KMO are shown in Fig. S7;† the order of magnitude of DMg2+ deduced from EIS is 1011 cm2 s1, which is in the range calculated from GITT.
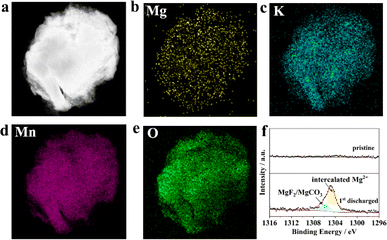
Fig. 4a–e show the HAADF images and the corresponding EDS mapping of KMO in the completed state of the first discharge, from which we can clearly see the presence of Mg and the uniform distribution of the four elements K, Mn, Mg, and O. In addition, Fig. 4f displays the XPS spectra of the pristine KMO electrode and the state of first discharge in the binding energy range from 1296 eV to 1316 eV. It clearly shows a featured peak of the Mg 1s core level, which can be fitted into two peaks centred at 1306.01 and 1304.63 eV. The peak at 1306.01 eV could be dominated by MgF2/MgCO3 in the cathode electrolyte interface, which originated from the decomposition of the electrolyte.41 The peak at 1304.63 eV could be characteristic of intercalated Mg2+ species in the discharge state. Fig. S3† shows the XRD patterns of the fully discharged and re-charged KMO electrodes; there exists obvious shifts in the first reflection peak for the discharged and re-charged states, implying the intercalation reaction mechanism. A new reflection peak emerges at 28.9°, which could be ascribed to MnO2 (PDF. 72-1982), implying that part of KMO is degraded. Doping in the transition metal layer could improve the stability of KMO and mitigate capacity degradation. The above results show that Mg2+ can be successfully embedded into the KMO material during the discharge process, which is in good agreement with the previous charge–discharge curve.
 | ||
| Fig. 4 (a) HAADF image and (b–e) EDS mapping of KMO after first discharge; (f) the Mg 1s core level XPS of KMO and KMO after first discharge. | ||
Conclusions
In summary, we proposed a thermodynamically stable layer-structured oxide K0.5MnO2 as the cathode using the solid-state reaction method for magnesium-ion battery. The Mg-ion storage performance was then evaluated using it as the cathode for rechargeable magnesium-ion batteries, with a high specific capacity of 99 mA h g1 at the first discharge state at 10 mA g1. This work demonstrated that the layer-structured oxide K0.5MnO2 as the cathode with larger lattice spacing enables reversible Mg2+ intercalation/deintercalation. Based on the above results, we believe that through reasonable optimization strategy, layer-structured oxides also have great development potential in real rechargeable magnesium-ion batteries while also providing new insights for exploring new and efficient cathode materials for magnesium-ion batteries.Data availability
All relevant data are provided within the paper.Author contributions
Junhao Zhang, Jili Yue, Baihua Qu conceived the project and wrote the manuscript with contributions from all authors. Haotian Guan, Yangfan Lu and Qian Li performed the calculations. Guangsheng Huang, Jingfeng Wang and Fusheng Pan supervised this project.Conflicts of interest
There are no conflicts to declare.Acknowledgements
This work was financially supported by National Natural Science Foundation of China (No. 51902163), the Chongqing Technology Innovation and Application Development Project (No. CSTB2022TIAD-KPX0028), the Fundamental Research Funds for the Central Universities (No. 2024CDJXY003), the Venture & Innovation Support Program for Chongqing Overseas Returnees (No. cx2023087), and the Chongqing Technology Innovation and Application Development Project (No. 2024TIAD-KPX0003).Notes and references
- S. Hou, X. Ji, K. Gaskell, P. F. Wang, L. Wang, J. Xu, R. Sun, O. Borodin and C. Wang, Science, 2021, 374, 172–178 CrossRef CAS PubMed.
- F. Liu, G. Cao, J. Ban, H. Lei, Y. Zhang, G. Shao, A. Zhou, L. Z. Fan and J. Hu, J. Magnesium Alloys, 2022, 10, 2699–2716 CrossRef CAS.
- X. Liu, A. Du, Z. Guo, C. Wang, X. Zhou, J. Zhao, F. Sun, S. Dong and G. Cui, Adv. Mater., 2022, 34, 2201886 CrossRef CAS PubMed.
- T. Mandai and M. Watanabe, J. Mater. Chem. A, 2023, 11, 9755–9761 RSC.
- T. Wen, Y. Deng, B. Qu, G. Huang, J. Song, C. Xu, A. Du, Q. Xie, J. Wang, G. Cui, D. Peng, X. Zhou and F. Pan, ACS Energy Lett., 2023, 8, 4848–4861 CrossRef CAS.
- X. Chen, L. Han, G. Zhao, L. Zhao, G. Gao, L. Yu, Y. Li, X. Shan, J. Li, X. Liu and G. Zhu, Chem. Commun., 2024, 60, 3067 RSC.
- S. Li, J. Zhang, S. Zhang, Q. Liu, H. Cheng, L. Fan, W. Zhang, X. Wang, Q. Wu and Y. Lu, Nat. Energy, 2024, 9, 285–297 CrossRef CAS.
- B. Zhang, J. Yue, D. Wang, H. Jia, G. Huang, J. Wang and F. Pan, ACS Energy Lett., 2024, 9, 1771–1776 CrossRef CAS.
- D. Aurbach, Z. Lu, A. Schechter, Y. Gofer, H. Gizbar, R. Turgeman, Y. Cohen, M. Moshkovich and E. Levi, Nature, 2000, 407, 724–727 CrossRef CAS.
- E. Lancry, E. Levi, Y. Gofer, M. Levi, G. Salitra and D. Aurbach, Chem. Mater., 2004, 16, 2832–2838 CrossRef CAS.
- Y. Cheng, L. Parent, Y. Shao, C. Wang, V. L. Sprenkle, G. Li and J. Liu, Chem. Mater., 2014, 26, 4904–4907 CrossRef CAS.
- M. Mao, Z. Lin, Y. Tong, J. Yue, C. Zhao, J. Lu, Q. Zhang, L. Gu, L. Suo, Y. Hu, H. Li, X. Huang and L. Chen, ACS Nano, 2020, 14, 1102–1110 CrossRef CAS PubMed.
- J. Zhang, X. Wang, H. Li, H. Zhang, Y. Zhang and K. Wang, Adv. Funct. Mater., 2023, 33, 2301974 CrossRef CAS.
- T. Chen, G. S. Gautam, W. Huang and G. Ceder, Chem. Mater., 2018, 30, 153–162 CrossRef CAS.
- I. D. Johnson, A. N. Mistry, L. Yin, M. Murphy, M. Wolfman, T. T. Fister, S. H. Lapidus, J. Cabana, V. Srinivasan and B. J. Ingram, J. Am. Chem. Soc., 2022, 144, 14121–14131 CrossRef CAS.
- B. J. Kwon, S. H. Lapidus, J. T. Vaughey, G. Ceder, J. Cabana and B. Key, Acc. Chem. Res., 2024, 57, 1–9 CrossRef CAS.
- B. J. Kwon, K.-C. Lau, H. Park, Y. A. Wu, K. L. Hawthorne, H. Li, S. Kim, I. L. Bolotin, T. T. Fister, P. Zapol, F. K. Klie, J. Cabana, C. Liao, S. H. Lapidus, B. Key and J. T. Vaughey, Chem. Mater., 2020, 32, 1162–1171 CrossRef CAS.
- B. J. Kwon, L. Yin, H. Park, P. Parajuli, K. Kumar, S. Kim, M. X. Yang, M. Murphy, P. Zapol, C. Liao, T. T. Fister, R. F. Klie, J. Cabana, J. T. Vaughey, S. H. Lapidus and B. Key, Chem. Mater., 2020, 32, 6577–6587 CrossRef CAS.
- P. Novak and J. Desilvestro, J. Electrochem. Soc., 1993, 140, 140–144 CrossRef CAS.
- L. Yu and X. Zhang, J. Colloid Interface Sci., 2004, 278, 160–165 CrossRef CAS.
- G. S. Gautam, P. Canepa, W. D. Richards, R. Malik and G. Ceder, Nano Lett., 2016, 16, 2426–2431 CrossRef PubMed.
- S. H. Lee, R. A. DiLeo, A. C. Marschilok, K. J. Takeuchi and E. S. Takeuchi, ECS Electrochem. Lett., 2014, 3, A87–A90 CrossRef CAS.
- J. Yin, C. J. Pelliccione, S. H. Lee, E. S. Takeuchi, K. J. Takeuchi and A. C. Marschilok, J. Electrochem. Soc., 2016, 163, A1941–A1943 CrossRef CAS.
- S. Son, T. Gao, S. P. Harvey, K. S. Steirer, A. Stokes, A. Norman, C. Wang, A. Cresce, K. Xu and C. Ban, Nat. Chem., 2018, 10, 532–539 CrossRef CAS PubMed.
- K. W. Nam, S. Kim, S. Lee, M. Salama, I. Shterenberg, Y. Gofer, J.-S. Kim, E. Yang, C. S. Park, J.-S. Kim, S.-S. Lee, W.-S. Chang, S.-G. Doo, Y. N. Jo, Y. Jung, D. Aurbach and J. W. Choi, Nano Lett., 2015, 15, 4071–4079 CrossRef CAS.
- H. J. Lee, J. Shin and J. W. Choi, Adv. Mater., 2018, 30, 1705851 CrossRef PubMed.
- M. Wang and S. Yagi, J. Alloys Compd., 2020, 820, 153135 CrossRef CAS.
- C. Miralles and R. Gómez, Electrochem. Commun., 2019, 106, 106512 CrossRef CAS.
- K. Shimokawa, T. Hatakeyama, H. Li and T. Ichitsubo, Curr. Opin. Electrochem., 2023, 38, 101209 CrossRef CAS.
- J. B. Goodenough and K. Park, J. Am. Chem. Soc., 2013, 135, 1167–1176 CrossRef CAS PubMed.
- J. B. Goodenough, Acc. Chem. Res., 2013, 46, 1053–1061 CrossRef CAS PubMed.
- A. Van der Ven, Z. Deng, S. Banerjee and S. P. Ong, Chem. Rev., 2020, 120, 6977–7019 CrossRef CAS.
- H. Wan, S. Li, X. Zhang, L. Wu, Z. Liu, G. Liu, C. Gao, W. Huang, H. Deng, W. Hu and F. Gao, J. Phys. Chem. Lett., 2023, 14, 10537–10544 CrossRef CAS PubMed.
- A. R. House, U. Maitra, M. A. Pérez-Osorio, J. G. Lozano, L. Jin, J. S. Somerville, L. C. Duda, A. Nag, A. Walters, Z. K. Zhou, M. R. Roberts and P. G. Bruce, Nature, 2020, 577, 502–508 CrossRef PubMed.
- X. Zhu, F. Meng, Q. Zhang, L. Xue, H. Zhu, S. Lan, Q. Liu, J. Zhao, Y. Zhuang, W. Guo, B. Liu, L. Gu, X. Lu, Y. Ren and H. Xia, Nat. Sustain., 2021, 4, 392–401 CrossRef.
- S. Kumakura, Y. Tahara, K. Kubota, K. Chihara and S. Komaba, Angew. Chem., Int. Ed., 2016, 55, 12760–12763 CrossRef CAS PubMed.
- H. Kim, D. Seo, J. Kim, S. Bo, L. Liu, T. Shi and G. Ceder, Adv. Mater., 2017, 29, 1702480 CrossRef PubMed.
- R. Luo, X. Li, J. Ding, J. Bao, C. Ma, C. Du, X. Cai, X. Wu and Y. Zhou, Energy Storage Mater., 2022, 47, 408–414 CrossRef.
- J. Weng, J. Duan, C. Sun, P. Liu, A. Li, P. Zhou and J. Zhou, Chem. Eng. J., 2020, 392, 123649 CrossRef CAS.
- W. Zuo, J. Qiu, X. Liu, B. Zheng, Y. Zhao, J. Lia, H. He, K. Zhou, Z. Xiao, Q. Li, G. F. Ortiza and Y. Yang, Energy Storage Mater., 2020, 26, 503–512 CrossRef.
- W. Sun, L. Chen, J. Wang, H. Zhang, Z. Quan, F. Fu, H. Kong, S. Wang and H. Chen, J. Mater. Chem. A, 2023, 11, 15724–15731 RSC.
Footnote |
| † Electronic supplementary information (ESI) available. See DOI: https://doi.org/10.1039/d4ra03923h |
| This journal is © The Royal Society of Chemistry 2024 |

