 Open Access Article
Creative Commons Attribution 3.0 Unported Licence
Ferrocenyl–triazole complexes and their use in heavy metal cation sensing†
Khaled Al Khalyfeh *a,
Asma Ghazzy
 bc,
Randa M. Al-As' ada,
Tobias Rüffer
 d,
Olfa Kanoune and
Heinrich Lang
 f
f
aDepartment of Chemistry, Faculty of Natural Science, Al-Hussein Bin Talal University, Ma'an 71111, Jordan. E-mail: k.khalyfeh@ahu.edu.jo
bFaculty of Pharmacy, Faculty of Pharmacy and Applied Medical Sciences, Al-Ahliyya Amman University, Amman 19328, Jordan
cPharmacological and Diagnostic Research Center, Faculty of Pharmacy and Allied Medical Sciences, Al-Ahliyya Amman University, Amman 19328, Jordan
dDepartment of Inorganic Chemistry, Chemnitz University of Technology, 09111 Chemnitz, Germany
eProfessorship Measurement and Sensor Technology, Chemnitz University of Technology, 09126 Chemnitz, Germany
fResearch Center for Materials, Architectures and Integration of Nanomembranes (MAIN), Research Group Organometallics, Chemnitz University of Technology, 09126 Chemnitz, Germany
First published on 28th June 2024
Abstract
Complexes tris((1-ferrocenyl-1H-1,2,3-triazol-4-yl)methyl)amine (3), bis((1-ferrocenyl-1H-1,2,3-triazol-4-yl)methyl)amine (6), bis((1-ferrocenyl-1H-1,2,3-triazol-4-yl)methyl)ether (7), and 1-ferrocenyl-1H-1,2,3-triazol-4-yl)methanamine (9) were synthesized using the copper-catalyzed click reaction. Complexes 3, 6, 7, and 9 were characterized using NMR (1H and 13{1H}) and IR spectroscopy, elemental analysis, and mass spectrometry. Structures of 3, 7, and 9 in the solid state were determined using single-crystal X-ray diffraction. It was found that the triazole rings were planar and slightly twisted with respect to the cyclopentadienyl groups attached to them. Chains and 3D network structures were observed due to the presence of π⋯π and C–H⋯N interactions between the cyclopentadienyl and triazole ligands. A reversible redox behavior of the Fc groups between 239 and 257 mV with multicycle stability was characteristic for all the compounds, revealing that the electrochemically generated species Fc+ remained soluble in dichloromethane. Electrochemical sensor tests demonstrated the applicability of all the complexes to enhance the quantification sensing behavior of the screen-printed carbon electrode (SPCE) toward Cd2+, Pb2+, and Cu2+ ions.
1. Introduction
Due to the limited resources of water around the world, waste-water treatment processes have received much attention from researchers, especially towards heavy metals, which are significantly discharged with the rapid development of industry and have now become one of the main components responsible for environmental pollution.1–5 Heavy metals are non-biodegradable and hence can accumulate during the living cycle, even at a trace level in living tissues,6–8 whereby they can cause several diseases as well as affect the living organs of humans as well as other organisms.9–11 The detection of such metals, for example, using state-of-the-art techniques, including atomic-fluorescence and inductively coupled plasma mass spectrometry, is expensive and requires high operating costs (e.g., for sample preparation, training operators, time).12,13Recently, chemo-sensing portable devices with advantages of simple, rapid, sensitive, and selective operation are still lacking. Modifying the surface of electrochemical sensor electrodes has become the key element in today's diverse sensing technologies.4,5,14–17 Among the electrochemical sensor electrodes, modified screen-printed carbon electrodes (SPCEs) due to their unique advantages such as facile mass production, disposable cast, low cost, reproducibility and sensitivity are widely applied to construct highly selective electrodes for electrochemical detection in environmental applications.18–20 In recent advances in electrode modification, inorganic materials/nanomaterials are often used.4,5,21–23 However, simple, inexpensive, and reversible redox-active modifying materials for signal amplification in electrochemical sensors are still lacking.24–28 The unique redox activity of ferrocene and some of its derivatives have raised their potential as chemo-sensing materials.29–33 In addition, heterocyclic compounds such as oxazolines, imidazoles, and triazoles have proven to be efficient recognition units for metal cation detection.34–39 Therefore, ferrocenes are considered invaluable templates as redox-moieties and in combination with a triazole-heterocyclic derivative can be expected to offer a greater surface area available for the deposition of specific analytes as well as an enhancement in the electron-transfer processes, and consequently, such compounds should stimulate the modified electrodes to behave as multiple signaling molecular selective chemo-sensors for metal cations.4,5,29,40–48
Herein, we present the synthesis and characterization of diverse ferrocenyl-containing triazole complexes. In addition, their structural and electrochemical properties are reported. Their use as modifier materials to design a voltammetric sensor for the quantification of heavy metals is discussed.
2. Experimental
2.1. General data
All the reactions were carried out under an argon atmosphere (5.0) employing standard Schlenk techniques. Tetrahydrofuran and N,N-dimethylformamide were purified by distillation from sodium/benzophenone and calcium hydride, respectively. For the electrochemistry experiments, HPLC grade dichloromethane was purified by distillation from calcium hydride. For the column chromatography, alumina with a particle size of 90 μm (Standard, Merck KGaA) and silica with a particle size of 40–60 μm (230–400 mesh (ASTM), Fa. Macherey-Nagel) were used.2.2. Instruments
A Bruker Avance III 500 spectrometer operating in the Fourier transform mode at 298 K was utilized to acquire the NMR spectra, including (1H NMR (500.3 MHz) and 13C{1H} NMR (125.8 MHz)). Chemical shifts (δ) are reported in parts per million (ppm) relative to tetramethylsilane using the solvent as the internal reference (CDCl3: 1H NMR δ = 7.26 ppm; 13C{1H} NMR δ = 77.16 ppm).49 A FT-Nicolet IR 200 spectrometer was employed to capture the infrared spectra. The determination of the melting points utilized analytical pure samples tested with a Gallenkamp MFB 595 010 M melting point apparatus.Elemental analyses were conducted using a Thermo FlashEA 1112 Series instrument, and high-resolution mass spectra were recorded using a micrOTOF QII Bruker Daltonite spectrometer.
2.3. Reagents
All the starting materials were obtained from commercial suppliers and used without further purification. [NnBu4][B(C6F5)4],50,51 and 1-azidoferrocene (1)52,53 were synthesized according to published procedures.2.4. Synthesis
2.5. Electrochemistry
Electrochemical measurements were performed using 1.0 mmol L−1 solutions of the analytes and [NnBu4][B(C6F5)4] as the supporting electrolyte in anhydrous dichloromethane at 25 °C.32,33,38,54 The instrumentation consisted of a Radiometer Gamry interface 1010E workstation interfaced with a personal computer. The measurement cell comprised three electrodes: a Pt auxiliary electrode, a glassy carbon working electrode, and a Ag/Ag+ (0.01 mol L−1 AgNO3) reference electrode. The working electrode underwent pretreatment involving polishing on a Buehler microcloth subsequently with 1 μm and 1/4 μm diamond paste. The reference electrode composed a silver wire, which was inserted into a Luggin capillary with a Vycor tip filled with a solution of 0.01 mol L−1 [AgNO3] and 0.1 mol L−1 [NnBu4][B(C6F5)4] in acetonitrile. This Luggin capillary was further inserted into a second Luggin capillary with a Vycor tip filled with a solution of 0.1 mol L−1 [NnBu4][B(C6F5)4] in dichloromethane.54–60 Under these conditions, all the experiments demonstrated that all the oxidation and reduction processes were reproducible in the range of ±5 mV. The experimental potentials were internally referenced against a Ag/Ag+ reference electrode, while all the presented results are referenced against ferrocene (as internal standard) as recommended by IUPAC.61 The experimentally measured potential was adjusted into E vs. FcH/FcH+ by adding −614 mV. This correction was applied when decamethylferrocene served as an internal standard. Under our experimental conditions, the Fc*/Fc*+ couple was at −614 mV vs. FcH/FcH+, ΔEp = 60 mV, and the FcH/FcH+ couple itself was at 220 mV vs. Ag/Ag+, (ΔEp = 61 mV).62–64 A Microsoft Excel worksheet was employed to process the data, ensuring the formal redox potentials of the FcH/FcH+ couple were set to E° = 0.0 V.62 The cyclic voltammograms were obtained after two scans and were deemed to be steady-state cyclic voltammograms, wherein the signal pattern remained consistent with the initial sweep.2.6. Electrochemical sensing
The sensing measurements were conducted with a PalmSens4 portable potentiostat (Palmsens BV, GA Houten, Netherlands) and screen-printed carbon electrodes (SPCEs) featuring a carbon counter electrode, a graphite working electrode, and a Ag/AgCl reference electrode.65 The selection of an appropriate buffer as an electrolyte for metal analysis was necessary to avoid the metal cations precipitation.66 Therefore, HAcO–NaAcO buffer solution (ABS (0.1 M), pH = 5.6) was used as the supporting electrolyte. The electrochemical responses for ABS (0.1 M, pH = 5.6) containing the target cations were recorded by square wave voltammetry measurements in the potential range from –1.3 V to + 1.0 V, modulation amplitude of 50 mV, step potential of ±5 mV, and equilibration time of 5 s.2.7. Functionalization of the SPCEs with the ferrocenyl–triazole complexes
To improve the performance of the SPCEs, additives may be used to enhance the response behaviors, sensitivity, and selectivity.22,67–69 Thus, dichloromethane solutions (1.0 mM) of the ferrocenyl–triazole complexes 3, 6, 7, and 9 were prepared and used to modify the working SPCEs using the drop-casting technique with the desired complex solution (1 μL × 5 times) and then dried at room temperature and atmospheric pressure for approximately 6 h.2.8. Single-crystal X-ray diffraction analysis
The diffusion of pentane into a dichloromethane solution containing 3, 7, or 9 at ambient temperature offered suitable single crystals for X-ray diffraction analysis. An Oxford Gemini S diffractometer (3, Mo Kα radiation, λ = 0.71073 Å, 120 K) and a Bruker Venture D8 diffractometer (7/9, Cu Kα radiation, λ = 1.54178 Å, 100 K) were utilized to acquire the corresponding data. The molecular structures were determined through direct methods and refined using full-matrix least-squares procedures on Fo2 using SHELXS- and SHELXL-2013 implemented in the WINGX v2013.3 suite.70,71 All non-hydrogen atoms were refined anisotropically, and a riding model was employed for treatment of the hydrogen atom positions.In the case of 7, the data set was treated with the command SQUEEZE of the PLATON program.72 Within the unit cell (V = 2650.4(2) Å3), a volume of solvent-accessible voids of 476.1 Å3 (ca. 18%) and an electron count per unit cell of 192.4 were determined. Considering that one dichloromethane packing solvent molecule possessed 42 electrons, the calculated total electron count per unit cell (Z = 4, Cc) was 168 electrons, in agreement with the SQUEEZE calculated value. Each dichloromethane packing solvent involved the next three non-hydrogen atoms, summing up to 12 non-hydrogen atoms in the VOIDs. As it is reasonable to assume a volume per non-hydrogen atom of disordered solvents in VOIDS of 40 Å3, an overall VOID volume of 480 Å3 was calculated. This is in excellent agreement with the SQUEEZE calculated value of 476.1 Å3.
3. Results and discussion
3.1. Synthesis
In accordance with the classical click chemistry protocol, 1-azidoferrocene (1), which is accessible by the reaction of 1-bromoferrocene with sodium azide in the presence of copper(I) bromide,52,74 was reacted with 3.3 equiv. of tripropargylamine in a tetrahydrofuran–water mixture in the ratio of 6![[thin space (1/6-em)]](https://www.rsc.org/images/entities/char_2009.gif) :
:![[thin space (1/6-em)]](https://www.rsc.org/images/entities/char_2009.gif) 1 (v/v) accompanied by the addition of an aqueous solutions of CuSO4 and Na–ascorbate at 25 °C for 48 h. After appropriate work-up, the ferrocenyl–triazole complex 3 was obtained in a yield 94% (Experimental section, Scheme 1).75–81 However, when using this classical click synthesis protocol for the preparation of 6 and 7 only very low yields could be obtained, while the synthesis of 9 was unsuccessful. Hence, complex 3 was used as an alternative stabilizing ligand instead of tris-(benzyltriazolylmethyl)amine (TBTA) for in situ generation of the respective Cu(I) catalyst.78 Thus, when 1 was reacted with 2.2 equiv. of dipropargylamine or dipropargyl ether and 1.1 equiv. of propargylamine, then 6, 7, and 9 could be isolated in 88–92% yields (Experimental section, Scheme 1).
1 (v/v) accompanied by the addition of an aqueous solutions of CuSO4 and Na–ascorbate at 25 °C for 48 h. After appropriate work-up, the ferrocenyl–triazole complex 3 was obtained in a yield 94% (Experimental section, Scheme 1).75–81 However, when using this classical click synthesis protocol for the preparation of 6 and 7 only very low yields could be obtained, while the synthesis of 9 was unsuccessful. Hence, complex 3 was used as an alternative stabilizing ligand instead of tris-(benzyltriazolylmethyl)amine (TBTA) for in situ generation of the respective Cu(I) catalyst.78 Thus, when 1 was reacted with 2.2 equiv. of dipropargylamine or dipropargyl ether and 1.1 equiv. of propargylamine, then 6, 7, and 9 could be isolated in 88–92% yields (Experimental section, Scheme 1).
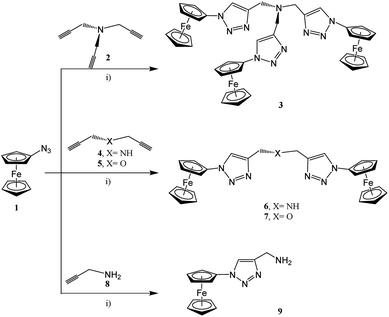 | ||
Scheme 1 Reaction of 1 with 2, 4, 5, or 8 forming the ferrocenyl triazoles 3, 6, 7, and 9; (i) 1st step: solution A: thf–H2O (ratio 7![[thin space (1/6-em)]](https://www.rsc.org/images/entities/char_2009.gif) : :![[thin space (1/6-em)]](https://www.rsc.org/images/entities/char_2009.gif) 1, v/v), for 3: (3.3 equiv. of 1, 1.0 equiv. of 2), for 6 or 7: (2.2 equiv. of 1, 0.15 equiv. of 3, 1.0 equiv. of 4 or 5, respectively), for 9: (1.1 equiv. of 1, 0.15 equiv. of 3, 1.0 equiv. of 8); 2nd: 0.3 equiv. of CuSO4 in H2O; 3rd: 3.0 equiv. of Na–ascorbate in H2O; 4th: 25 °C, 48 h.; 5th: washing with NH3 (until colorless), then with H2O (pH = 7.00).52,53,76–80 1, v/v), for 3: (3.3 equiv. of 1, 1.0 equiv. of 2), for 6 or 7: (2.2 equiv. of 1, 0.15 equiv. of 3, 1.0 equiv. of 4 or 5, respectively), for 9: (1.1 equiv. of 1, 0.15 equiv. of 3, 1.0 equiv. of 8); 2nd: 0.3 equiv. of CuSO4 in H2O; 3rd: 3.0 equiv. of Na–ascorbate in H2O; 4th: 25 °C, 48 h.; 5th: washing with NH3 (until colorless), then with H2O (pH = 7.00).52,53,76–80 | ||
3.2. Characterization
Compounds 3, 6, 7, and 9 were obtained as air-stable yellow-brownish solid materials at room temperature. They were characterized by IR, and NMR spectroscopy (1H, 13C{1H}), high-resolution ESI-TOF mass spectrometry, elemental analysis, and electrochemistry experiments. The molecular structures of 3, 7, and 9 in the solid state were determined by single-crystal X-ray diffraction analysis.The presence of the amine functionality in 9 and 6 could be confirmed by IR spectroscopy by intense N–H stretching and bending vibrations at 3138 and 1206 cm−1 (9) or 3138 and 1106 cm−1 (6). New bands at 1107 cm−1 with a moderate intensity grew which were characteristic of νCN vibrations in 3, 6, and 7. In addition, stretching vibrations (1218 cm−1 (3), 1220 cm−1 (6), 1222 cm−1 (7), and 1213 cm−1 (9)) typical for aromatic amines confirmed the successful introduction of a triazole functionality. Within 7, the ether functionality was characterized by a C–O stretching vibration at 1042 cm−1.
In the 1H NMR spectra of 3, 6, 7, and 9, the Fc units showed the expected pattern between 4.2–4.9 ppm (Experimental). While the C5H5 protons resonated as a singlet at 4.2 ppm, and the C5H4 α and β protons appeared as pseudo-triplets at 4.3 and 4.8 ppm with JHH = 2.0 Hz. The triazole-heterocyclic units showed singlets at 8.09 ppm (3), 7.87 ppm (6), 7.85 ppm (7), and 7.69 ppm (9). The CH2 protons could be detected as singlets at 3.87 ppm (3), 4.02 ppm (6), 4.27 ppm (7), and 4.04 ppm (9). The protons of the amine functionality in 6 and 9 were found as singlets at 2.04 and 1.57 ppm. Within the 13C NMR spectra, all the complexes showed individual signals for the triazole moieties at ca. 145 and 122 ppm, as well as for the ferrocenyl moieties between 62 and 94 ppm in the spectral region. Also, –CH2– signals were detected at different chemical shifts (47 (3), 44 (6), 62 (7), and 38 (9)), reflecting the electron-donating effect of the heteroatoms connected.82–84
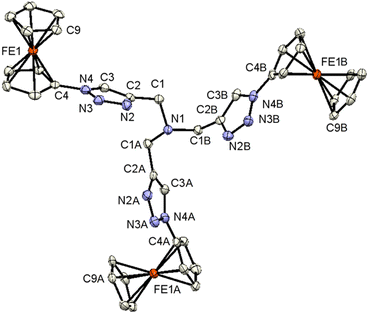
Single crystals of 3, 7, and 9 suitable for X-ray diffraction analysis were obtained by the diffusion of pentane into a dichloromethane solution containing either 3, 7, or 9 at ambient temperature. The crystal and structure refinement data are presented in Table 1. The molecular structures of 3, 7, and 9 with the atom labeling scheme are provided in Fig. 1–3. The bond distances (Å) and valence and torsion angles (deg) are given in Table S1 (see the ESI†).
| 3 | 7 | 9 | |
|---|---|---|---|
| Chemical formula | C39H36Fe3N10 | C26H22Fe2N6O | C26H30Fe2N8O |
| Formula weight/g mol−1 | 812.33 | 546.19 | 582.28 |
| Temperature/K | 120 | 100 | 100 |
| Wavelength/Å | 0.71073 | 1.54178 | 1.54178 |
| Crystal system | Trigonal | Monoclinic | Monoclinic |
| Space group | R3c | Cc | C2/c |
| a/Å | 22.8746(12) | 31.1767(14) | 41.1986(19) |
| b/Å | 22.8746(12) | 5.6862(3) | 5.6676(3) |
| c/Å | 10.8056(9) | 15.4318(7) | 28.3277(15) |
| β/° | 90° | 104.342(2)o | 131.772(2)o |
| γ/° | 120° | 90° | 90° |
| V/Å−3 | 4896.5(7) | 2650.4(2) | 4933.1(4) |
| ρcalcd/g cm−3 | 1.653 | 1.369 | 1.568 |
| F(000) | 2508 | 1120 | 2416 |
| Crystal size/mm | 0.30 × 0.04 × 0.04 | 0.40 × 0.20 × 0.02 | 0.20 × 0.04 × 0.04 |
| Z | 6 | 4 | 8 |
| Max. and min. transmission | 1.00, 0.69801 | 0.81, 0.23 | 0.78, 0.48 |
| μ/mm−1 | 1.365 | 9.009 | 9.738 |
| θ range/° | 3.085–29.013 | 2.926–65.989 | 2.876–63.683 |
| Index ranges | −27 ≤ h ≤ 30 | −36 ≤ h ≤ 35 | −46 ≤ h ≤ 47 |
| −30 ≤ k ≤ 30 | −6≤k ≤ 5 | −6≤k ≤ 6 | |
| −14 ≤ l ≤ 14 | −18 ≤ l ≤ 17 | −32 ≤ l ≤ 25 | |
| Total/unique reflections | 11![[thin space (1/6-em)]](https://www.rsc.org/images/entities/char_2009.gif) 602/2660 602/2660 |
11![[thin space (1/6-em)]](https://www.rsc.org/images/entities/char_2009.gif) 512/4101 512/4101 |
20![[thin space (1/6-em)]](https://www.rsc.org/images/entities/char_2009.gif) 136/4024 136/4024 |
| Data/restraints/parameters | 2660/1/157 | 4101/32/317 | 4024/16/373 |
| Rint | 0.0939 | 0.0573 | 0.1012 |
| R1, wR2 [I ≥ σ(I)] | 0.0486, 0.0788 | 0.07971, 0.2369 | 0.0879, 0.1640 |
| R1, wR2 (all data) | 0.1036, 0.0952 | 0.1076, 0.2480 | 0.1218, 0.1846 |
| Goodness-of-fit S on F2 | 0.984 | 1.062 | 1.159 |
| Largest diff. peak and hole/e·Å−3 | 0.537, −0.518 | 1.073, −0.664 | 0.617, −0.566 |
| Absolute structure parameter73 | 0.01(2) | 0.27(2) | — |
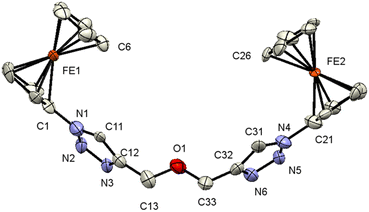 | ||
| Fig. 2 ORTEP (50% probability level) of the molecular structure of 7 with the atom numbering scheme. Hydrogen atoms are omitted for clarity. | ||
Compound 3 crystallizes in the trigonal space group R3c:H. The molecular architecture in which three ferrocenyl-1H-1,2,3-triazole entities are bonded to a trimethylamine scaffold was unambiguously confirmed. The Fc groups adopt intermediate conformations between the staggered and the eclipsed form (C9–Fe1–C4–N4 = 21.2(5)°).85 The intramolecular through-space distance between the Fe atoms is 13.054(3) Å. The 1H-1,2,3-triazole ring exhibits a planar structure, and is slightly twisted in relation to the attached cyclopentadienyl groups, forming a dihedral angle of 15.7(3)°. The dihedral angle between methanamine and 1H-1,2,3-triazole is 76.1(2)°.
All the other structural parameters were unexceptional and compared well with those of related species.86,87 On the other hand, in the solid state, C–H⋯N interactions occur between the 1H-1,2,3-triazole rings, leading to the formation of chains along the a-axis, as illustrated in Fig. S1 (see the ESI†). Within the solid-state analysis of compound 3, there were parallel-displaced π⋯π interactions noted between two cyclopentadienyl rings, resulting in the formation of three-dimensional chains along the c-axis (Fig. S2, see the ESI†).
Compound 7 crystallizes in the monoclinic, space group Cc. The molecule features a central O atom connected on either side by methyl-1-ferrocenyl-1H-1,2,3-triazoles, which are syn-oriented (Fig. 2). The cyclopentadienyl rings at Fe1/Fe2 adopt an eclipsed conformation (torsion angles C6–Fe1–C1–N1/C26–Fe2–C21–N4 = 2.8(9)/−1.4(8)°). As anticipated, the 1H-1,2,3-triazole ring displays a planar structure, and it exhibits a slight twist concerning the attached cyclopentadienyl groups, resulting in dihedral angles of 24(1)°/22(1)°. It is noteworthy that the bond lengths of C11–C12 (1.42(3) Å) and C31–C32 (1.45(3) Å) as formal double bonds are elongated compared to localized C![[double bond, length as m-dash]](https://www.rsc.org/images/entities/char_e001.gif) C double bonds (1.34 Å). In addition, the N1–N2 bond (1.43(2) Å) is longer than the localized N–N single bonds (1.37 (3) Å), while the N4–N3 bond length is within the expected range for such compounds.88,89 The intermolecular separation between two cyclopentadienyl rings bonded to Fe2 is 3.31(3) Å, based on the bond separation between C21 and C26 and is almost identical compared to the situation around Fe1 with a separation of 3.32(2) Å between C1 and C6.90,91 All the remaining structural parameters are typical and align closely with those of related species.85,86,92 Interestingly, the C–H⋯π and C–H⋯ H–C interactions involving the Fc rings lead to the formation of a chain (Fig. S3 and S4, see the ESI†). Moreover, π⋯π interactions between cyclopentadienyl and the 1H-1,2,3-triazole ring were observed forming chains along the b-axis; graphical representations can be found in Fig. S3 (see the ESI†). Further interactions via C–H⋯N (Fig. S4, see the ESI†) lead to the formation of a 3D network.
C double bonds (1.34 Å). In addition, the N1–N2 bond (1.43(2) Å) is longer than the localized N–N single bonds (1.37 (3) Å), while the N4–N3 bond length is within the expected range for such compounds.88,89 The intermolecular separation between two cyclopentadienyl rings bonded to Fe2 is 3.31(3) Å, based on the bond separation between C21 and C26 and is almost identical compared to the situation around Fe1 with a separation of 3.32(2) Å between C1 and C6.90,91 All the remaining structural parameters are typical and align closely with those of related species.85,86,92 Interestingly, the C–H⋯π and C–H⋯ H–C interactions involving the Fc rings lead to the formation of a chain (Fig. S3 and S4, see the ESI†). Moreover, π⋯π interactions between cyclopentadienyl and the 1H-1,2,3-triazole ring were observed forming chains along the b-axis; graphical representations can be found in Fig. S3 (see the ESI†). Further interactions via C–H⋯N (Fig. S4, see the ESI†) lead to the formation of a 3D network.
Compound 9 crystallizes in the monoclinic space group C2/c. The structure of 9 is presented in Fig. 3, which shows that 9 crystallizes in the form of [(9)2 × H2O]. Thereby, the two crystallographically different molecules of 9 are denoted as A (including Fe1) and B (including Fe2) and within the asymmetric unit, one water molecule is present. In both molecules, the two cyclopentadienyl rings exhibit a tilt angle of 0.9(4)°/0.8(9)°, and they are approximately eclipsed with a twist angle of −1.1(8)° (N1–C6–Fe1–C1)/4.8(7)° (N5–C26–Fe2–C21) for the A and B molecules, respectively. The remaining geometrical parameters within the ferrocenyl framework are typical.90 As anticipated, the 1H-1,2,3-triazole ring is planar, and it exhibits a slight twist concerning the attached cyclopentadienyl groups, resulting in dihedral angles of 10.8(3)° and 6.8(8)° for A and B, respectively. The most significant difference between the two molecules comprising the asymmetric unit is evident in the dihedral angle between the methanamine and the 1H-1,2,3-triazole unit, measuring 7.3° for molecule A, in contrast to 73.1° for molecule B. Interestingly, the water molecule exists within the crystal packing connecting both molecules through hydrogen bonding between the NH2 groups and the H2O. Furthermore, a water molecule forms a hydrogen bond with the 1H-1,2,3-triazole ring of molecule B.
Through involving the Fc rings, C–H⋯π interactions between molecules A and B lead to the formation of a chain. Further interactions via C–H⋯π between Fc rings and 1,2,3-triazole rings lead to the formation of a 2D structure (Fig. S5 and S6, see the ESI†). In the perpendicular direction, further C–H⋯π interactions between Fc and 1H-1,2,3-triazole rings and C–H⋯π interactions between Fc rings beside C–H⋯N, CH2⋯C, N⋯N contacts and π⋯π stacking furnish the 3D structure (Fig. S7, see the ESI†).
3.3. Hirshfeld surfaces analysis
Further analysis of the molecular packing scheme was performed by calculating the Hirshfeld surfaces and two-dimensional fingerprint plots (overall and decomposed) employing Crystal Explorer 17 (ref. 93) using standard protocols94 to discern and clarify the impact of the noteworthy intermolecular interactions observed in the crystal packing, which were consistent across the three compounds, prompting an examination of the role played by weak non-covalent interactions in the supramolecular assembly. This included exploring the significance of H⋯N, H⋯O, and π⋯π stacking interactions in establishing the configuration of the extended structure.95–100 Fig. 4 shows the Hirshfeld surfaces mapped over the dnorm of 3, 7, and 9. The 2D fingerprint plots for 3, 7, and 9 are shown in Fig. S8–S10 (see the ESI†).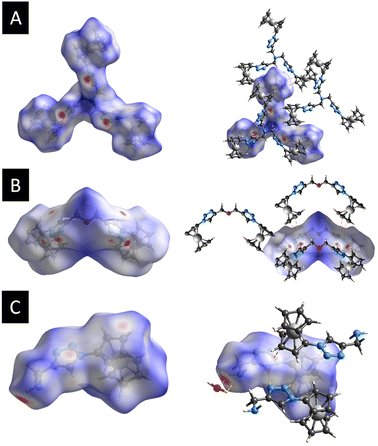 | ||
| Fig. 4 (A) Hirshfeld surfaces of 3 mapped over dnorm, (B) Hirshfeld surfaces of 7 mapped over dnorm, (C) Hirshfeld surfaces of 9 mapped over dnorm. | ||
For each compound, in the crystal packing the bright and deep-red spot in the Hirshfeld surface indicates the closest distance between the atoms at the exterior (de) and interior (di) of the compound. Fingerprint plots (Fig. S8–S10, refer to the ESI†) illustrate that H⋯H interactions predominantly govern the surface contacts, which aligns with expectations given the abundance of H atoms in the molecule. Additionally, H⋯C/C⋯H and H⋯N/N⋯H contacts also play notable roles in the surface interactions (Table S2, see the ESI†).
Fig. 4a displays the Hirshfeld surfaces of 3. The prominent red areas on the Hirshfeld surfaces represent classical H⋯N/N⋯H hydrogen bonds, while the less pronounced red circles denote weaker π⋯π stacking contacts. In the dnorm map of 7, the dark red regions are associated with N⋯H/N⋯H hydrogen bonds and π⋯π stacking interactions, while the bright-red regions are attributed to C–H⋯π interactions (Fig. 4b). Hydrogen bonding interaction between 9 and the co-crystallized water molecule in the crystal structure was observed in the Hirshfeld surfaces. Fig. 4c represents the Hirshfeld surface of 9. As expected, deep-red spots were observed corresponding to the presence of hydrogen bonds (H⋯O/O⋯H, H⋯N/N⋯H), while the bright-red spots corresponded to the presence of C–H⋯π stacking.
3.4. Electrochemistry
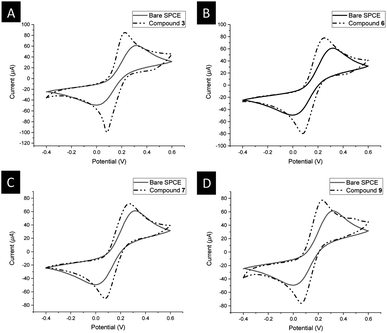
The electrochemical behavior of 3, 6, 7, and 9 was investigated by cyclic voltammetry (CV) using an anhydrous dichloromethane solution of [NnBu4][B(C6F5)4] (0.1 mol L−1) as a supporting electrolyte.32,33,38,54–56,59,101 The electrochemical measurements were conducted at 25 °C under an argon atmosphere and referenced against the potential of the FcH/FcH+ redox couple. In all compounds, reversible and well-defined redox events were observed, as illustrated in Fig. 5. The electrochemical data are consolidated in Table 1. The multicyclic experiments indicated the stability of the Fc/Fc+ redox couples for all the compounds.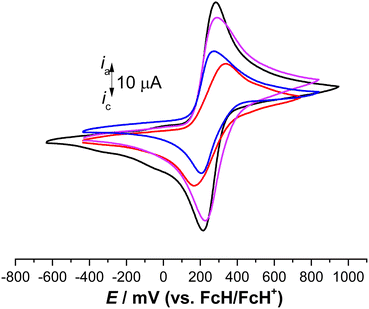 | ||
| Fig. 5 Cyclic voltammograms of 1.0 mM solution of 3 (red line), 6 (violet line), 7 (black line), and 9 (blue line), scan rate 100 mV s−1 in anhydrous dichloromethane with [NnBu4][PF6] (0.1 mol L−1) used as a supporting electrolyte at 25 °C.33 | ||
In the cyclic voltammetry (CV) data, concerning the redox event of ferrocene (FcH/FcH+), the formal potentials were shifted toward anodic potentials (E°′ = 251 mV (3), 257 mV (6), 249 mV (7), 239 mV (9)), due to the electron-withdrawing character of the triazole moieties (Fig. 5, Table 2).102 The large ΔEp value of 176 mV for 3 suggests that three individual reversible one-electron processes exist in a close potential range, indicating a certain degree of electrostatic interaction between the Fc/Fc+ moieties.33,103–106 The cyclic voltammetry (CV) data for compounds 6 and 7 revealed the presence of two distinct reversible one-electron processes superimposed on each other (ΔEp = 66 mV for 6, 65 mV for 7). This suggests the absence of electronic and electrostatic interactions between Fc/Fc+, as illustrated in Fig. 5 and summarized in Table 2. The current for 6 and 7 was twice as intense as that of 9 (Fig. 5). Hence, the concurrent oxidation of the Fc units in 6 and 7 resulted in a lower thermodynamic stability of the mono-oxidized [6]+ and [7]+ species compared to the isovalent species [6]2+ and [7]2+, respectively. This implies a negligible electronic interaction between the Fc/Fc+ units.105,107
It is noteworthy that the cationic species [3]n+ (n = 1, 2, or 3), [6]n+ (n = 1 or 2), [7]n+ (n = 1 or 2), and [9]+ did not precipitate during the oxidation, neither at the electrode surface nor in the electrochemical cell. Therefore, even the fully oxidized cations remained soluble under the measurement conditions employed. However, in situ spectroelectrochemical-NIR measurements were not conducted for 3 due to the negligible redox separations, the connectivity pattern of the molecules, and reports from previous investigations on compounds containing sp3-hybridized bridging atoms.104,108,109
3.5. Electrochemical sensing
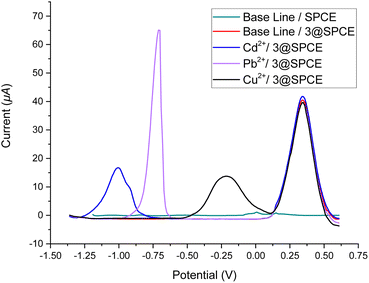 | ||
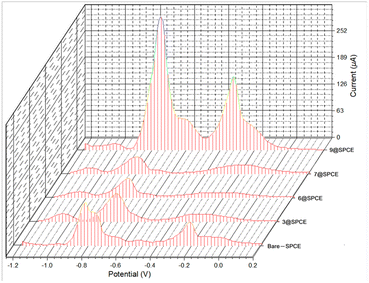
| Fig. 7 Square wave voltammograms of ABS solutions of Cd2+, Pb2+, and Cu2+ (250 μM) using a drop-casting method for the bare SPCE and 3@SPCE modified electrodes. | ||
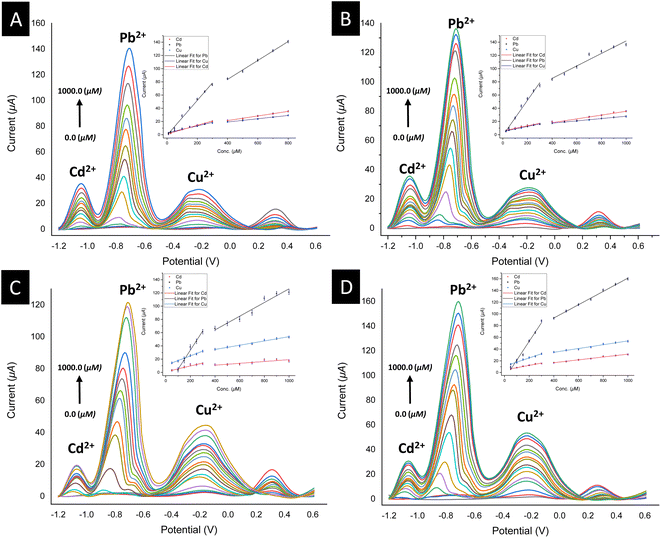
To validate the potential of the ferrocenyl–triazole materials more comprehensively for detecting multiple heavy metal ions simultaneously, we recorded their SWV responses with different concentrations (0–1000 μM) of Cd2+, Pb2+, and Cu2+ (Fig. 9, Table 3). It was noteworthy that the observed non-linearity and splitting in the calibration curve (Fig. 9) could be attributed to the interaction between heavy metal ions and the electrode surface. As the concentration of heavy metal ions increased, they adsorbed onto the electrode surface and formed a layer that inhibits electron transfer between the electrode and the solution.112 Nevertheless, the response patterns for the simultaneous detection of Cd2+, Pb2+, and Cu2+ could be easily discriminated with their response patterns and observed at the same detection potentials that appear as observed in Fig. 7, indicating that the potential separation was large enough to distinguish between the peaks. The limit of detections (LODs) of theses electrochemical sensors estimated based on a signal-to-noise ratio are summarized in Table 3 and were found to be comparable with electrochemical platforms for the detection of Cd2+, Pb2+, and Cu2+ in aqueous solutions (Table S3†).
| Electrode | [Cd2+] | [Pb2+] | [Cu2+] | |||
|---|---|---|---|---|---|---|
| Corresponding linear range | Corresponding linear range | Corresponding linear range | ||||
| Linear regression equation | Linear regression equation | Linear regression equation | ||||
| (R2) | (R2) | (R2) | ||||
| LoD | LoD | LoD | ||||
| 3@SPCE | (10–400) μM | (500–800) μM | (10–400) μM | (500–800) μM | (10–400) μM | (500–800) μM |
| y = 1.11814 + 0.06508 × x | y = 7.48275 + 0.03476 × x | y = −0.9587 + 0.26426 × x | y = 26.3971 + 0.14327 × x | y = 2.58801 + 0.05381 × x | y = 9.3273 + 0.02473 × x | |
| (R2 = 0.98612) | (R2 = 0.99542) | (R2 = 0.99357) | (R2 = 0.99715) | (R2 = 0.98285) | (R2 = 0.99722) | |
| 9.2 nM | — | 6.3 nM | — | 20.1 nM | — | |
| 6@SPCE | (50–400) μM | (500–1000) μM | (50–400) μM | (500–1000) μM | (50–400) μM | (500–1000) μM |
| y = 5.65554 + 0.0387 × x | y = 6.67621 + 0.02873 × x | y = −1.23602 + 0.2667 × x | y = 47.46199 + 0.0944 × x | y = 4.92772 + 0.03808 × x | y = 10.44341 + 0.01749 × x | |
| (R2 = 0.93922) | (R2 = 0.95304) | (R2 = 0.98957) | (R2 = 0.95814) | (R2 = 0.99896) | (R2 = 0.99634) | |
| 30.5 nM | — | 8.7 nM | — | 23.9 nM | — | |
| 7@SPCE | (50–400) μM | (500–1000) μM | (100–400) μM | (500–1000) μM | (50–400) μM | (500–1000) μM |
| y = 0.86345 + 0.04393 × x | y = 5.34728 + 0.0138 × x | y = −24.24902 + 0.28923 × x | y = 22.75788 + 0.10343 × x | y = 10.73873 + 0.07073 × x | y = 21.68721 + 0.03217 × x | |
| (R2 = 0.91739) | (R2 = 0.77043) | (R2 = 0.98846) | (R2 = 0.95759) | (R2 = 0.9892) | (R2 = 0.98431) | |
| 4.3 nM | — | 29.0 nM | — | 7.1 nM | — | |
| 9@SPCE | (50–400) μM | (500–1000) μM | (50–400) μM | (500–1000) μM | (50–400) μM | (500–1000) μM |
| y = 4.29173 + 0.03969 × x | y = 7.02349 + 0.02437 × x | y = −10.79841 + 0.31988 × x | y = 47.6892 + 0.11351 × x | y = 10.75638 + 0.07072 × x | y = 21.54613 + 0.03241 × x | |
| (R2 = 0.98255) | (R2 = 0.98967) | (R2 = 0.98368) | (R2 = 0.99651) | (R2 = 0.9887) | (R2 = 0.98475) | |
| 3.7 nM | — | 32.0 nM | — | 7.1 nM | — | |
4. Conclusions
In conclusion, the ferrocenyl–triazole compounds 3, 6, 7, and 9 were prepared starting from the reaction of 1-azidoferrocene (1) with propargylamine/propargyl ether in tetrahydrofuran–water mixtures accompanied by the addition of aqueous solutions of CuSO4 and Na–ascorbate. All the compounds were characterized by IR and NMR spectroscopy (1H, 13C{1H}), high-resolution ESI-TOF mass spectrometry, as well as elemental analysis. The solid-state structures for 3, 7, and 9 were determined by single-crystal X-ray diffraction. The molecular structure of 3 involves a trimethylamine scaffold bonded to three ferrocenyl-1H-1,2,3-triazole entities, while compound 9 comprises ferrocenyl-1H-1,2,3-triazole entities bonded to a methylamine scaffold. On the other hand, the molecular structure of 7 consists of a central oxygen (O) atom linked on both sides to methyl-1-ferrocenyl-1H-1,2,3-triazoles. Several intermolecular interactions such as π⋯π and C–H⋯N, between the cyclopentadienyl and triazole ligands lead to the formation of chains and 3D network structures within compounds 3, 7, and 9. Hirshfeld surface analysis confirmed the presence of similar intermolecular contact patterns. Within the electrochemical measurements (CV), all the compounds showed anodically shifted (relative to FcH/FcH+) reversible events, and the multicyclic measurements showed stable redox behaviors for the cationic species of [3]n+ (n = 1, 2 or 3), [6]n+ (n = 1 or 2), [7]n+ (n = 1 or 2), and [9]+. In the cyclic voltammetry (CV) curves of 6 and 7, two distinct reversible one-electron processes were superimposed, indicating the absence of electronic and electrostatic interactions between Fc/Fc+. In addition, the potential use of these compounds to fabricate 3, 6, 7, and 9@SPCE as electrochemical sensors for the detection of some heavy metals (Cu2+, Pb2+, and Cd2+) was successfully realized. These results open an avenue to the use of such ferrocene-triazole-containing materials in combination with carbon-based nanomaterials and/or conductive polymers as promising modifiers with compatible sensing properties toward heavy metals for real applications.5,87Author contributions
Khaled Al Khalyfeh: conceptualization, project administration, investigation, formal analysis, methodology, validation and writing – review & editing. Asma Ghazzy: conceptualization and formal analysis. Randa Al-As'ad: investigation. Tobias Rüffer: formal analysis. Olfa Kanoun: resources and writing – review & editing. Heinrich Lang: resources and writing – review & editing.Conflicts of interest
The authors declare no conflict of interest.Acknowledgements
The author (K. K.) grateful to Deanship of Scientific Research at Al-Hussein Bin Talal University, Jordan for funding this work through the Research Project No. 400/2020.Notes and references
- A. Stahl, A. I. Lazar, V. N. Muchemu, W. M. Nau, M. S. Ullrich and A. Hennig, Anal. Bioanal. Chem., 2017, 409, 6485–6494 CrossRef CAS PubMed
.
- S. N. Khudyakova, A. B. Vishnikin and N. M. Smityuk, Int. J. Environ. Anal. Chem., 2018, 98, 1253–1273 CrossRef CAS
.
- A. Karawek, C. Srisuwannaket, P. Mayurachayakul, M. Sukwattanasinitt, K. Pratumyot, A. Dilokpramuan, W. Mingvanish, P. Kidkhunthod and N. Niamnont, Color. Technol., 2022, 138, 38–46 CAS
.
- X. Wang, Y. Qi, Y. Shen, Y. Yuan, L. Zhang, C. Zhang and Y. Sun, Sens. Actuators, B, 2020, 310, 127756 CrossRef CAS
.
- J. Wan, Y. Shen, L. Xu, R. Xu, J. Zhang, H. Sun, C. Zhang, C. Yin and X. Wang, J. Electroanal. Chem., 2021, 895, 115374 CrossRef CAS
.
- T. A. Fayed, M. N. Nahass, H. A. El-Daly and A. A. Shokry, Appl. Organomet. Chem., 2019, 33(1–23), e4868 CrossRef
.
- Q. Wang, J. Li, C. Chen, X. Ren, J. Hu and X. Wang, Chem. Eng. J., 2011, 174, 126–133 CrossRef CAS
.
- T. Mayr, I. Klimant, O. S. Wolfbeis and T. Werner, Anal. Chim. Acta, 2002, 462, 1–10 CrossRef CAS
.
- Y. S. Ho, J. C. Y. Ng and G. Mckay, Sep. Purif. Rev., 2000, 29, 189–232 CrossRef CAS
.
- C. Huang, K. Chang, H. Ou, Y. Chiang and C. Wang, Microporous Mesoporous Mater., 2011, 141, 102–109 CrossRef CAS
.
- B. K. Weller, S. U. Atan and M. S. Metin, Ethno Med, 2017, 11, 63–69 CrossRef
.
- C. Huang, K. Chang, H. Ou, Y. Chiang, E.-E. Changc and C.-F. Wang, J. Hazard. Mater., 2011, 186, 1174–1182 CrossRef CAS PubMed
.
- A. H. Karim, A. A. Jalil, S. Triwahyono, S. M. Sidik, N. H. N. Kamarudin, R. Jusoh, N. W. C. Jusoh and B. H. Hameed, J. Colloid Interface Sci., 2012, 386, 307–314 CrossRef CAS PubMed
.
- D. T. Mcquade, A. E. Pullen and T. M. Swager, Chem. Rev., 2000, 100, 2537–2574 CrossRef CAS PubMed
.
- L. M. Goldenberg, R. Bryce and M. C. Petty, J. Mater. Chem., 1999, 9, 1957–1974 RSC
.
- P. D. Beer, Acc. Chem. Res., 1998, 31, 71–80 CrossRef CAS
.
- G. D. Brindley, O. D. Fox and P. D. Beer, J. Chem. Soc., Dalton Trans., 2000, 4354–4359 RSC
.
- X. Dai, S. Wu and S. Li, J. Chin. Adv. Mater. Soc., 2018, 6, 91–111 CrossRef CAS
.
- H. Hou, K. M. Zeinu, S. Gao, B. Liu, J. Yang and J. Hu, Energy Environ. Mater., 2018, 1, 113–131 CrossRef CAS
.
- S. F. Zhou, J. J. Wang, L. Gan, X. J. Han, H. L. Fan, L. Y. Mei, J. Huang and Y. Q. Liu, J. Alloys Compd., 2017, 721, 492–500 CrossRef CAS
.
- N. Busschaert, C. Caltagirone, W. Van Rossom and P. A. Gale, Chem. Rev., 2015, 115, 8038–8155 CrossRef CAS PubMed
.
- L. Cui, J. Wu and H. Ju, Biosens. Bioelectron., 2015, 63, 276–286 CrossRef CAS PubMed
.
- B. Çeken, M. Kandaz and A. Koca, J. Coord. Chem., 2012, 65, 3383–3394 CrossRef
.
- D. A. K. Singh, J. Inclusion Phenom., 1988, 6, 351–396 CrossRef
.
- G. W. Gokel, Chem. Soc. Rev., 1992, 21, 39–47 RSC
.
- P. D. Beer, Adv. Inorg. Chem., 1992, 39, 79–157 CrossRef CAS
.
- T. Saji and I. Kinoshita, J. Chem. Soc. Chem. Commun., 1986, 716–717 RSC
.
- S. Sapari, N. H. A. Razak, S. A. Hasbullah, L. Y. Heng, K. F. Chong and L. L. Tan, J. Electroanal. Chem., 2020, 878, 114670 CrossRef CAS
.
- A. Thakur, D. Mandal and S. Ghosh, Anal. Chem., 2013, 85, 1665–1674 CrossRef CAS PubMed
.
- P. L. Boulas, M. Gómez-Kaifer and L. Echegoyen, Angew. Chem., Int. Ed., 1998, 37, 216–247 CrossRef CAS PubMed
.
- A. Pal, S. Ranjan Bhatta and A. Thakur, Coord. Chem. Rev., 2021, 431, 213685–213748 CrossRef CAS
.
- K. Al Khalyfeh, J. F. Nawroth, M. Uhlemann, U. Stoeck, L. Giebeler, R. Jordan and A. Hildebrandt, J. Organomet. Chem., 2017, 853, 149–158 CrossRef CAS
.
- A. Hildebrandt, K. Al Khalyfeh, J. F. Nawroth and R. Jordan, Organometallics, 2016, 35, 3713–3719 CrossRef CAS
.
- A. Satheshkumar, R. Manivannan and K. P. Elango, J. Organomet. Chem., 2014, 750, 98–106 CrossRef CAS
.
- C. Arivazhagan, R. Borthakur and S. Ghosh, Organometallics, 2015, 34, 1147–1155 CrossRef CAS
.
- R. Sun, L. Wang, H. Yu, Z. ul-Abdin, Y. Chen, J. Huang and R. Tong, Organometallics, 2014, 33, 4560–4573 CrossRef CAS
.
- T. Romero, R. A. Orenes, A. Tárraga and P. Molina, Organometallics, 2013, 32, 5740–5753 CrossRef CAS
.
- K. AL Khalyfeh, D. Taher, W. Helal, M. Korb, I. Hamadneh, A. Al-Dujaili, A. Imraish, H. M. Hammad, R. M. Al-As’ad, S. T. Abu-Orabi, A. Hildebrandt and H. Lang, J. Chem. Sci., 2020, 132(117), 1–16 Search PubMed
.
- A. K. Agrahari, P. Bose, M. K. Jaiswal, S. Rajkhowa, A. S. Singh, S. Hotha, N. Mishra and V. K. Tiwari, Chem. Rev., 2021, 121, 7638–7956 CrossRef CAS PubMed
.
- F. Zapata, A. Caballero, A. Espinosa, A. Tárraga and P. Molina, Inorg. Chem., 2009, 48, 11566–11575 CrossRef CAS PubMed
.
- A. Thakur and S. Ghosh, Organometallics, 2012, 31, 819–826 CrossRef CAS
.
- A. Thakur, S. Sardar and S. Ghosh, J. Chem. Sci., 2012, 124, 1255–1260 CrossRef CAS
.
- S. R. Bhatta, V. Bheemireddy, G. Vijaykumar, S. Debnath and A. Thakur, Organometallics, 2017, 36, 2141–2152 CrossRef CAS
.
- P. D. Beer, P. A. Gale and G. Z. Chen, Coord. Chem. Rev., 1999, 185–186, 3–36 CrossRef CAS
.
- A. Chesney, M. R. Bryce, A. S. Batsanov, J. A. K. Howard and L. M. Goldenberg, Chem. Commun., 1998, 677–678 RSC
.
- P. Molina, A. Tárraga and A. Caballero, Eur. J. Inorg. Chem., 2008, 3401–3417 CrossRef CAS
.
- K. Sarikavak, G. Kurtay and F. Sevin, J. Mol. Model., 2020, 26(50), 1–13 Search PubMed
.
- M. Alfonso, A. Tárraga and P. Molina, Dalton Trans., 2010, 39, 8637–8645 RSC
.
- G. R. Fulmer, A. J. M. Miller, N. H. Sherden, H. E. Gottlieb, A. Nudelman, B. M. Stoltz, J. E. Bercaw and K. I. Goldberg, Organometallics, 2010, 29, 2176–2179 CrossRef CAS
.
- R. J. LeSuer, C. Buttolph and W. E. Geiger, Anal. Chem., 2004, 76, 6395–6401 CrossRef CAS PubMed
.
- F. Barrière and W. E. Geiger, J. Am. Chem. Soc., 2006, 128, 3980–3989 CrossRef PubMed
.
- S. Vanicek, M. Jochriem, C. Hassenrück, S. Roy, H. Kopacka, K. Wurst, T. Müller, R. F. Winter, E. Reisner and B. Bildstein, Organometallics, 2019, 38, 1361–1371 CrossRef CAS PubMed
.
- A. G. Tennyson, D. M. Khramov, C. D. V. Jr, P. T. Creswell, J. W. Kamplain, V. M. Lynch and C. W. Bielawski, Organometallics, 2009, 28, 5142–5147 CrossRef CAS
.
- V. N. Nemykin, G. T. Rohde, C. D. Barrett, R. G. Hadt, J. R. Sabin, G. Reina, P. Galloni and B. Floris, Inorg. Chem., 2010, 49, 7497–7509 CrossRef CAS PubMed
.
- H. J. Gericke, N. I. Barnard, E. Erasmus, J. C. Swarts, M. J. Cook and M. A. S. Aquino, Inorg. Chim. Acta, 2010, 363, 2222–2232 CrossRef CAS
.
- E. Fourie, J. C. Swarts, D. Lorcy and N. Bellec, Inorg. Chem., 2010, 49, 952–959 CrossRef CAS PubMed
.
- J. C. Swarts, A. Nafady, J. H. Roudebush, S. Trupia and W. E. Geiger, Inorg. Chem., 2009, 48, 2156–2165 CrossRef CAS PubMed
.
- A. Hildebrandt, T. Rüffer, E. Erasmus, J. C. Swarts and H. Lang, Organometallics, 2010, 29, 4900–4905 CrossRef CAS
.
- V. N. Nemykin, G. T. Rohde, C. D. Barrett, R. G. Hadt, C. Bizzarri, P. Galloni, B. Floris, I. Nowik, R. H. Herber, A. G. Marrani, R. Zanoni and N. M. Loim, J. Am. Chem. Soc., 2009, 131, 14969–14978 CrossRef CAS PubMed
.
- A. Hildebrandt, D. Schaarschmidt and H. Lang, Organometallics, 2011, 30, 556–563 CrossRef CAS
.
- G. Gritzner and J. Kuta, Pure Appl. Chem., 1984, 56, 461–466 CrossRef
.
- A. Nafady and W. E. Geiger, Organometallics, 2008, 27, 5624–5631 CrossRef CAS
.
- I. Noviandri, K. N. Brown, D. S. Fleming, P. T. Gulyas, P. A. Lay, A. F. Masters and L. Phillips, J. Phys. Chem. B, 1999, 103, 6713–6722 CrossRef CAS
.
- J. R. Aranzaes, M.-C. Daniel and D. Astruc, Can. J. Chem., 2006, 84, 288–299 CrossRef
.
- S. Weheabby, A. Al-Hamry, S. Nasraoui, T. Ruffer and O. Kanoun, 19th IEEE Int. Multi-Conference Syst. Signals Devices, SSD’22, 2022, pp. 1024–1027 Search PubMed
.
- S. Di Masi, A. Garcia Cruz, F. Canfarotta, T. Cowen, P. Marote, C. Malitesta and S. A. Piletsky, ChemNanoMat, 2019, 5, 754–760 CrossRef CAS
.
- Y. Liao, Q. Li, Y. Yue and S. Shao, RSC Adv., 2015, 5, 3232–3238 RSC
.
- A. J. Saleh Ahammad, J. J. Lee and M. A. Rahman, Sensors, 2009, 9, 2289–2319 CrossRef CAS PubMed
.
- M. Díaz-González, M. Gutiérrez-Capitán, P. Niu, A. Baldi, C. Jiménez-Jorquera and C. Fernández-Sánchez, Trends Anal. Chem., 2016, 77, 186–202 CrossRef
.
- L. J. Farrugia, J. Appl. Crystallogr., 2012, 45, 849–854 CrossRef CAS
.
- G. M. Sheldrick, Acta Crystallogr., Sect. A: Found. Crystallogr., 2008, 64, 112–122 CrossRef CAS PubMed
.
- A. L. Speck, Plat. –A Multipurp. Crystallogr. Tool–© 1980–2015, Version 70515 Search PubMed
.
- S. Parsons and H. Flack, Acta Crystallogr., Sect. A: Found. Crystallogr., 2004, 60, 61 Search PubMed
.
- A. G. Tennyson, D. M. Khramov, C. D. Varnado, P. T. Creswell, J. W. Kamplain, V. M. Lynch and C. W. Bielawski, Organometallics, 2009, 28, 5142–5147 CrossRef CAS
.
- C. W. Tornøe, C. Christensen and M. Meldal, J. Org. Chem., 2002, 67, 3057–3064 CrossRef PubMed
.
- V. V. Rostovtsev, L. G. Green, V. V. Fokin and K. B. Sharpless, Angew. Chem., Int. Ed., 2002, 41, 2596–2599 CrossRef CAS PubMed
.
- V. V. Rostovtsev, L. G. Green, V. V. Fokin and K. B. Sharpless, Angew. Chem., 2002, 114, 2708–2711 CrossRef
.
- T. R. Chan, R. Hilgraf, K. B. Sharpless and V. V. Fokin, Org. Lett., 2004, 6, 2853–2855 CrossRef CAS PubMed
.
- S. Gatard, C. Deraedt, A. Rapakousiou, D. Sonet, L. Salmon, J. Ruiz and D. Astruc, Organometallics, 2015, 34, 1634–1650 CrossRef
.
- V. Ganesh, V. S. Sudhir, T. Kundu and S. Chandrasekaran, Chem.–Asian J., 2011, 6, 2670–2694 CrossRef CAS PubMed
.
- R. M. Al-As’ad, K. Al Khalyfeh, D. Taher, K. I. Assaf, M. H. Tawara, T. Rüffer and H. Lang, J. Organomet. Chem., 2024, 1013, 123170 CrossRef
.
- D. Taher, F. F. Awwadi, J. M. Speck, M. Korb, D. Schaarschmidt, C. Wagner, H. Amarne, K. Merzweiler, G. van Koten and H. Lang, J. Organomet. Chem., 2018, 863, 1–9 CrossRef CAS
.
- D. Taher, Transition Met. Chem., 2009, 34, 641–645 CrossRef CAS
.
- D. Taher, F. Awwadi, M. El-khateeb and H. Lang, Transition Met. Chem., 2012, 37, 601–604 CrossRef CAS
.
- J. Skiba, Q. Yuan, A. Hildebrandt, H. Lang, D. Trzybiński, K. Woźniak, R. K. Balogh, B. Gyurcsik, V. Vrček and K. Kowalski, ChemPlusChem, 2018, 83, 77–86 CrossRef CAS PubMed
.
- Z. Z. Ang, S. Laxmi, F. León, J. E. M. Kooij, F. García and J. England, Inorg. Chem., 2021, 60, 3556–3564 CrossRef CAS PubMed
.
- P. Biegański, E. Kovalski, N. Israel, E. Dmitrieva, D. Trzybiński, K. Woźniak, V. Vrček, M. Godel, C. Riganti, J. Kopecka, H. Lang and K. Kowalski, Inorg. Chem., 2022, 61, 9650–9666 CrossRef PubMed
.
- J. D. Crowley, P. H. Bandeen and L. R. Hanton, Polyhedron, 2010, 29, 70–83 CrossRef CAS
.
- D. Mandal, A. Thakur and S. Ghosh, Polyhedron, 2013, 52, 1109–1117 CrossRef CAS
.
- A. Hildebrandt, K. Al Khalyfeh, D. Schaarschmidt and M. Korb, J. Organomet. Chem., 2016, 804, 87–94 CrossRef CAS
.
- D. Taher and J. F. Corrigan, Organometallics, 2011, 30, 5943–5952 CrossRef CAS
.
- D. Taher, F. F. Awwadi, J. M. Speck, M. Korb, C. Wagner, E. M. Hamed, M. Al-Noaimi, A. Y. Habashneh, M. El-khateeb, S. T. Abu-Orabi, K. Merzweiler and H. Lang, J. Organomet. Chem., 2017, 847, 59–67 CrossRef CAS
.
- M. J. Turner, J. J. McKinnon, S. K. Wolff, D. J. Grimwood, P. R. Spackman, D. Jayatilaka and M. A. Spackman, Cryst. Explor. 17, Univ. West. Aust., 2017 Search PubMed
.
- S. L. Tan, M. M. Jotani and E. R. T. Tiekink, Acta Crystallogr., Sect. E: Crystallogr. Commun., 2019, 75, 308–318 CrossRef CAS PubMed
.
- K. Al Khalyfeh, D. Taher, W. Helal, M. Korb, H. Amarne and H. Lang, J. Chem. Crystallogr., 2022, 52, 113–121 CrossRef CAS
.
- A. A. Abu-Yamin, D. Taher, M. Korb, K. Al Khalyfeh, Z. Ishtaiwi, H. K. Juwhari, W. Helal, H. Amarne, S. Mahmood, R. Loloee, Y. A. YouSef, A. Ghazzy and H. Lang, Polyhedron, 2022, 222, 115906 CrossRef CAS
.
- R. M. Al-As’ad, A. Abu-yamin, M. Korb, K. Al Khalyfeh, I. A. Elayan, M. H. Almatarneh, H. K. Juwhari, H. Amarne, D. Taher, Z. Ishtaiwi and H. Lang, J. Mol. Struct., 2023, 1280, 135061 CrossRef
.
- Z. Ishtaiwi, D. Taher, M. Korb, W. Helal, A. Al-Hunaiti, H. K. Juwhari, H. Amarne, M. W. Amer, Y. A. YouSef, S. Klaib and S. T. Abu-Orabi, Arabian J. Chem., 2022, 15, 104349 CrossRef CAS
.
- D. Taher, S. Klaib, M. Korb, K. I. Assaf, G. Rheinwald and H. Lang, J. Mol. Struct., 2024, 1312, 138510 CrossRef CAS
.
- Z. Ishtaiwi, D. Taher, M. Korb, W. Helal, H. K. Juwhari, A. Al-Hunaiti, H. Amarne, K. Assaf, L. Alrawashdeh, M. W. Amer, Y. A. Yousef and H. Lang, J. Mol. Struct., 2023, 1288, 135747 CrossRef CAS
.
- D. Chong, J. Slote and W. E. Geiger, J. Electroanal. Chem., 2009, 630, 28–34 CrossRef CAS
.
- S. D. Köster, J. Dittrich, G. Gasser, N. Hüsken, I. C. H. Castañeda, J. L. Jios, C. O. D. Védova and N. Metzler-Nolte, Organometallics, 2008, 27, 6326–6332 CrossRef
.
- D. Taher, F. F. Awwadi, U. Pfaff, J. M. Speck, T. Rüffer and H. Lang, J. Organomet. Chem., 2013, 736, 9–18 CrossRef CAS
.
- D. Taher, A. Ghazzy, F. F. Awwadi, W. Helal, K. Al Khalyfeh, M. Korb, A. Hildebrandt, E. Kovalski and H. Lang, Polyhedron, 2018, 152, 188–194 CrossRef CAS
.
- A. Ghazzy, D. Taher, W. Helal, M. Korb, K. Khalyfeh, F. F. Awwadi, R. K. Al-Shewiki, S. Weheabby, N. Al-Said, S. T. Abu-Orabi and H. Lang, Arabian J. Chem., 2020, 13, 3546–3557 CrossRef CAS
.
- A. Ghazzy, D. Taher, M. Korb, K. Al Khalyfeh, W. Helal, H. Amarne, T. Rüffer, Z. Ishtaiwi and H. Lang, Inorganics, 2022, 10, 1–12 CrossRef
.
- D. Taher, F. F. Awwadi, J. M. Speck, M. Korb, D. Schaarschmidt, S. Weheabby, A. Y. Habashneh, M. Al-Noaimi, M. El-Khateeb, S. T. Abu-Orabi and H. Lang, J. Organomet. Chem., 2017, 845, 55–62 CrossRef CAS
.
- M. Korb and H. Lang, Eur. J. Inorg. Chem., 2017, 276–287 CrossRef
.
- M. Korb, P. J. Swarts, D. Miesel, A. Hildebrandt, J. C. Swarts and H. Lang, Organometallics, 2016, 35, 1287–1300 CrossRef CAS
.
- P. R. Vernekara, N. P. Shettia, M. M. Shanbhaga, S. J. Malodea, R. S. Malladib and K. R. Reddy, Microchem. J., 2020, 159, 105441 CrossRef
.
- D. Zhu, H. Ma, Q. Zhen, J. Xin, L. Tan, C. Zhang, X. Wang and B. Xiao, Appl. Surf. Sci., 2020, 526, 146721 CrossRef CAS
.
- S. Weheabby, Z. Wu, A. Al-Hamry, I. A. Pašti, A. Anurag, D. Dentel, C. Tegenkamp and O. Kanoun, Microchem. J., 2023, 193, 109192 CrossRef CAS
.
Footnote |
| † Electronic supplementary information (ESI) available: IR, NMR and mass spectra as well as additional figures containing structural details of 7, 3 and 9. CCDC 2291749–2291751. For ESI and crystallographic data in CIF or other electronic format see DOI: https://doi.org/10.1039/d4ra04023f |
| This journal is © The Royal Society of Chemistry 2024 |

