 Open Access Article
From e-waste to eco-sensors: synthesis of reduced graphene oxide/ZnO from discarded batteries for a rapid electrochemical bisphenol A sensor
Md Humayun Kabir *a,
Md Yeasin Pabela,
Nishat Tasnim Bristyab,
Md. Abdus Salamb,
Muhammad Shahriar Basharc and
Sabina Yasmin
 *a
*a
aInstitute of National Analytical Research and Service (INARS), Bangladesh Council of Scientific and Industrial Research (BCSIR), Dhanmondi, Dhaka-1205, Bangladesh. E-mail: sabinayasmin@bcsir.gov.bd; humayunkabir@bcsir.gov.bd
bDepartment of Chemistry, University of Dhaka, Dhaka-1000, Bangladesh
cInstitute of Energy Research & Development (IERD), Bangladesh Council of Scientific and Industrial Research (BCSIR), Dhanmondi, Dhaka-1205, Bangladesh
First published on 11th November 2024
Abstract
Improper disposal of used dry cell batteries and the leaching of bisphenol A (BPA), a prevalent endocrine disruptor present in food packaging, into surface water pose a significant threat to both the environment and drinking water, threatening the sustainability of the ecosystem. Thus, it is imperative to manage detrimental e-waste and regularly monitor BPA using a sensitive and reliable technique. This study proposes a cost-effective reduced graphene oxide/zinc oxide (rGO/ZnO) nanohybrid, entirely synthesized from electronic waste, for electrochemically detecting BPA in an aqueous medium. Graphite and metallic Zn precursors obtained from discarded batteries were employed to synthesize rGO/ZnO. The successful characterization of the prepared rGO and rGO/ZnO nanohybrid was conducted through different state-of-the-art techniques. An rGO/ZnO-modified glassy carbon electrode (GCE) exhibited superior conductivity and a larger surface area. Voltammetric study at the rGO/ZnO-modified GCE successfully detected BPA in an aqueous medium, demonstrating a one-electron and proton pathway for BPA oxidation. The sensor demonstrated a linear response within the concentration range of 1–30 μM, with a limit of detection of 0.98 nM and sensitivity of 0.055 μA μM−1. The developed electrode could also detect BPA in real water samples with reasonable recovery. These findings imply that the developed sensor has the potential to be a sensitive, practical, and economical monitoring system for BPA in water.
1 Introduction
Bisphenol A (BPA), also known as 2,2′-bis(4-hydroxyphenyl)propane, functions as a monomer in the synthesis of diverse plastic materials utilized across various industries, notably in the production of food and water packaging, from which it leaches into food stuffs.1–3 The widespread application of BPA in these industries raises concerns regarding the regular ingestion of minute quantities of BPA by people, which could lead to higher vulnerability to cardiovascular diseases, obesity, diabetes, and adverse effects on sexual differentiation, immunological function, and cardiovascular health.1,4 Therefore, it is crucial to establish an accurate and highly sensitive analytical system for the detection of minute quantities of BPA.Several methods can be employed for detecting BPA, such as gas chromatography-mass spectrometry, high-performance liquid chromatography, chemiluminescence, and capillary electrophoresis.5,6 The utilization of these techniques is highly limited by the requirement for complex instrumentation and substantial time spent, despite their accuracy and sensitivity.3,6,7 Electrochemical technique, on the other hand, has become increasingly popular in the field of sensing applications owing to its many advantages, which include ease of operation, real-time detection, high sensitivity, and selectivity.8–10 However, achieving these advantages is dependent upon the choice of appropriate materials for modification of substrate electrodes.
Numerous attempts have been made to develop effective materials for the fabrication of electrochemical sensors used for the detection of BPA.7–9,11–17 To improve the current performance of BPA sensing electrodes, several endeavors have been undertaken, such as employing a range of carbon-based materials, including biochar (BC),13 multi-walled carbon nanotubes (MWCNTs),9,18 single-walled carbon nanotubes (SWCNTs),12 graphene oxide (GO),4,19–22 and reduced graphene oxide (rGO).7,8,11,15–17,23 Additionally, metal oxides such as zinc oxide (ZnO),8,9,11,13,18,19,24 nickel oxide (NiO),11,25 iron oxide (Fe3O4),10,26 copper oxide (CuO),14 and molybdenum oxide (MoO3)27,28 have garnered considerable attention in these efforts. ZnO has garnered significant interest in electrocatalysis due to its notable catalytic activity,29,30 stability, and non-toxic nature.31 Despite these advantages, ZnO faces significant drawbacks, including inadequate electrical conductivity and agglomeration stemming from its inherent polarity,31 making it a suboptimal choice for electroanalysis. Additionally, the limited adsorption capacity of organic compounds on the ZnO surface32,33 imposes limitations on its utility in electro-sensors. Consequently, the integration of a good supporting material becomes essential to overcome these challenges. Among carbon nanomaterials, graphene-based materials such as GO and rGO have demonstrated promising potential as supports for metal oxides.34–40 This is attributed to their favorable surface-area ratio, high organic compound adsorption capacity (e.g., BPA), and excellent electrical conductivity and electrocatalytic properties.2,34,36,41 Therefore, the incorporation of ZnO onto the surface of rGO holds promise for enhancing the electrochemical performance of BPA sensing.
To our knowledge, this study represents the first use of rGO/ZnO derived from discarded batteries for electrochemical detection of BPA in aqueous media. We successfully synthesized a rGO/ZnO nanohybrid using precursor materials obtained from graphite and zinc extracted from discarded dry cells, enabling a cost-effective and innovative source for the synthesis of this nanohybrid material. The utilization of electronic waste (e-waste) as the exclusive source of precursors not only enhances cost-effectiveness but also addresses environmental concerns by repurposing and management of detrimental e-waste. Analytical measurements were performed using cyclic and linear sweep voltammetry techniques. The prepared rGO/ZnO nanohybrid offers advantages such as environmental friendliness, low cost, scalability, and high sensitivity.
2 Experimental
2.1 Reagents and chemicals
H2SO4 (CAS No. 7664-93-9) and KMnO4 (CAS No. 7722-64-7) were purchased from Scharlau, Spain. H3PO4 (CAS No. 7664-38-2) was purchased from Janssen Chemica, Belgium. NaOH (CAS No. 1310-73-2) and HCl (CAS No. 7647-01-0) were purchased from Sigma-Aldrich, USA. N2H4·H2O (CAS No. 7803-578), KHPO4, K2HPO4, and KOH were purchased from AppliChem, Germany. BPA was collected from Sigma Aldrich, Switzerland. All reagents were of analytical grade and used without further purification. All solutions were prepared using ultrapure deionized water (18 MΩ cm).2.2 Instruments
The morphology of the prepared samples was studied by scanning electron microscopy (SEM) (JEOL, JSM 6490LA, USA), and photographs were taken by changing different magnifications by stereo SEM at 30 tilt and 10 kV. Transmission electron micrographs were obtained with transmission electron microscopy (TEM) (JEOL, JEM 2100F, Japan) operated at 200 kV FE (field emission) accelerating voltage. An energy-dispersive X-ray (EDX) spectrometer (JEOL, JED 2200, Japan) was utilized for the elemental composition determination of the prepared samples. Fourier transform infrared (FT-IR) spectra were acquired in the transmittance mode using a Fourier transform spectrophotometer (Frontier FT-NIR/MIR, PerkinElmer, USA). The X-ray diffraction (XRD) patterns of the materials were acquired with ARL, Equinox (Thermo Scientific) diffractometer running at 40 kV and 30 mA using a Cu Kα1 (λ = 1.5406 Å) source. The CHI660 (USA) instrument was used to perform all electrochemical analysis, and glassy carbon (CHI104, Φ = 3 mm), Ag/AgCl/KCl (sat.) (CHI111) and spiral Pt wire (BAS Inc, 23 cm) were used as the working electrode, reference and counter electrodes, respectively.2.3 Recovery of graphite and Zn-metal from waste dry cell
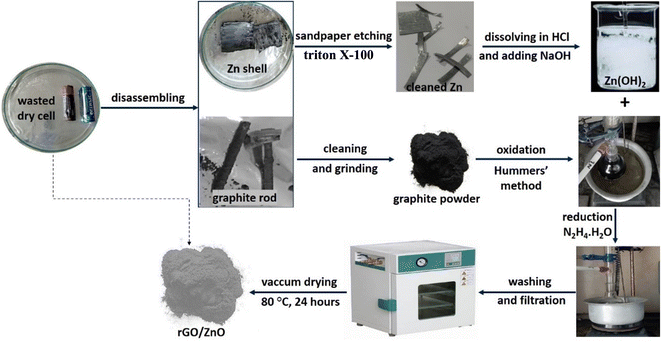
Graphite rods and zinc metal were obtained from abandoned dry cells obtained from residential houses. Scheme 1 shows the schematic diagram of the recovery of graphite and Zn from the wasted dry cell and the synthesis of rGO/ZnO nanohybrid. To maintain the integrity of the graphite rods and Zn shell, the dry cells were carefully disassembled. Then, in order to remove the adherent paste made of MnO2, NH4Cl, carbon powder, etc., the collected graphite rods and Zn shells were cleaned with DI water. The extraction of graphite powder from the collected graphite rods was described in detail in our previous publications.42–44 For the Zn metal, sandpaper etching and thorough washing with Triton-X-100 surfactant were performed to remove any adherent impurities, resulting in a shining Zn metal, as shown in Scheme 1.2.4 Synthesis of GO
GO was prepared from the obtained graphite using the modified Hummers' method. Briefly, a solution of H2SO4 and H3PO4 was mixed with KMnO4 and graphite powder, heated to 50 °C for six hours, cooled, and then gradually DI water and H2O2 were added while stirring continuously at almost 4 °C. After the reaction was halted, the product was separated using centrifugation and then underwent a washing process. The GO powder was obtained after drying the freshly prepared GO.2.5 Synthesis of rGO/ZnO nanohybrid
100 mg of GO was suspended thoroughly in 100 mL of DI water using an ultrasonic bath for about 30 minutes at room temperature. In a separate beaker, 25 mg of Zn metal was completely dissolved in a sufficient amount of concentrated HCl (eqn (1)), and then 1 M NaOH was added dropwise until Zn(OH)2 was completely precipitated (eqn (2)). The contents from the two beakers were mixed thoroughly.| Zn (s) + 2HCl (aq) = ZnCl2 (aq) + H2 (g) | (1) |
| ZnCl2 (aq) + 2NaOH (aq) = Zn(OH)2 (s)↓ + 2NaCl (aq) | (2) |
To reduce GO, 10 mL of 1 M N2H4·H2O was slowly added. The entire mixture was stirred at 80 °C for 2 hours in an oil bath at 400 rpm. The resulting nanohybrid was separated through centrifugation and washed with DI water several times until a pH of 7 was reached. Finally, the mixture was washed with ethanol to remove any organic residue present. The prepared nanohybrid was dried at 80 °C for 24 hours in a vacuum drying oven.
2.6 Fabrication of the rGO/ZnO modified GCE
The glassy carbon electrode (GCE) (CHI104, Φ = 3 mm) underwent meticulous polishing using a polishing microcloth and an aqueous slurry containing fine alumina particles. After 5 minutes of ultrasonication in DI water, any remaining alumina particle was extracted from the GCE. Sonication was employed to dissolve 1 mg mL−1 of active materials in DI water for a duration of 30 minutes in order to modify the GCE. Drop-casting the homogeneous suspension onto the GCE and allowing it to dry at room temperature resulted in the formation of a film composed of uniform active materials (1.13 mg cm−2). The modified electrode was utilized in subsequent electrochemical analyses. Before each electrochemical experiment, the electrolyte was saturated with Ar gas to remove dissolved oxygen, ensuring the highest standard of experimental consistency. Although oxygen does not interfere within the specific potential window studied, this step eliminates any possibility of unforeseen interactions between oxygen and BPA.3 Results and discussion
We synthesized rGO/ZnO nanohybrid from the wasted batteries and used it in the electrochemical BPA sensors. The thorough characterization of the prepared materials, as well as their electrochemical performance, are discussed.3.1 Characterization
The prepared rGO/ZnO nanohybrid was characterized using various techniques, including SEM, EDX, CHNS, EDX, FTIR, and XRD, as described in the following subsections.![[thin space (1/6-em)]](https://www.rsc.org/images/entities/char_2009.gif) :
:![[thin space (1/6-em)]](https://www.rsc.org/images/entities/char_2009.gif) H) of 27.3
H) of 27.3![[thin space (1/6-em)]](https://www.rsc.org/images/entities/char_2009.gif) :
:![[thin space (1/6-em)]](https://www.rsc.org/images/entities/char_2009.gif) 1 and 49.5
1 and 49.5![[thin space (1/6-em)]](https://www.rsc.org/images/entities/char_2009.gif) :
:![[thin space (1/6-em)]](https://www.rsc.org/images/entities/char_2009.gif) 1, respectively. The higher C
1, respectively. The higher C![[thin space (1/6-em)]](https://www.rsc.org/images/entities/char_2009.gif) :
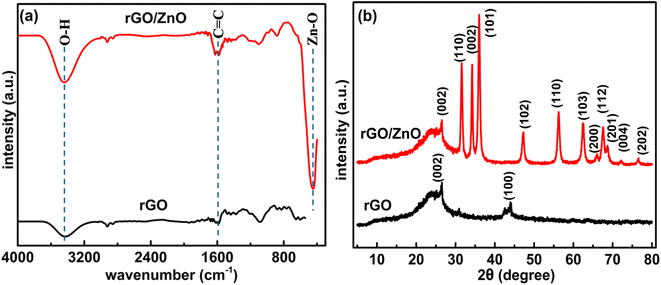
:![[thin space (1/6-em)]](https://www.rsc.org/images/entities/char_2009.gif) H in rGO suggests an effective reduction process that eliminates certain oxygen-containing functional groups inherent in GO, which was also evidenced in the FTIR spectrum (Fig. 2a) and XRD pattern (Fig. 2b).
H in rGO suggests an effective reduction process that eliminates certain oxygen-containing functional groups inherent in GO, which was also evidenced in the FTIR spectrum (Fig. 2a) and XRD pattern (Fig. 2b).
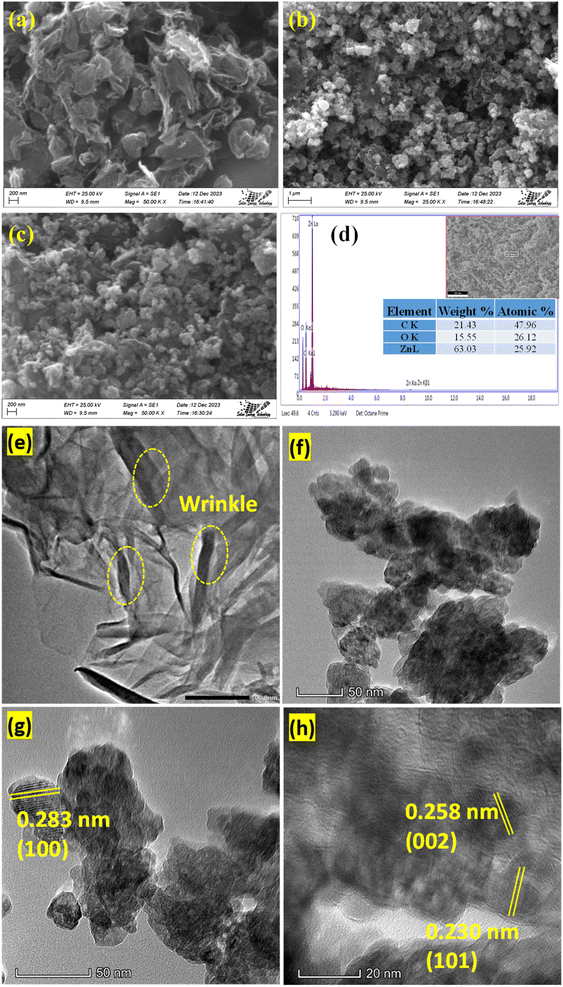 | ||
| Fig. 1 SEM images of (a) rGO and (b and c) rGO/ZnO. (d) EDX spectrum of rGO/ZnO; TEM images of (e) rGO and (f–h) rGO/ZnO at different magnifications. | ||
To obtain further insights into the nanostructure morphology, ZnO particle size, dispersion, and lattice structure, and TEM images were analyzed. TEM images in Fig. 1e–h depict the unique surface characteristics of rGO and rGO/ZnO.40,45 Fig. 1e illustrates the layered planar structure with a wrinkled surface of rGO as indicated by a yellow-colored circle, consistent with SEM images and previous study.43 Fig. 1f–h shows the TEM images of rGO/ZnO at different magnifications. The TEM images revealed that the ZnO nanoparticles were well integrated into the rGO nanosheet with minimal agglomeration. The average diameter of the ZnO nanoparticle was estimated to be ca. 35 nm analyzed by ImageJ software (64 bit). Furthermore, the lattice fringes of rGO and ZnO with the spacings of 0.283, 0.258 and 0.230 nm correspond to the (100), (002) and (101) crystal planes, respectively, of ZnO, which were visible in the TEM images (Fig. 1g and h).43,46–50 The presence of these planes was also supported by the XRD pattern (Fig. 2b).
![[double bond, length as m-dash]](https://www.rsc.org/images/entities/char_e001.gif) O) to methylene (–CH2–) groups. Specifically, this transition reflects the change from the stretching frequency of the carbonyl group, typically observed around 1700–1750 cm−1, to the stretching frequency of the methylene group, which appears around 2850–2950 cm−1. The appearance of the peak at 2937 cm−1 indicates the successful reduction of C
O) to methylene (–CH2–) groups. Specifically, this transition reflects the change from the stretching frequency of the carbonyl group, typically observed around 1700–1750 cm−1, to the stretching frequency of the methylene group, which appears around 2850–2950 cm−1. The appearance of the peak at 2937 cm−1 indicates the successful reduction of C![[double bond, length as m-dash]](https://www.rsc.org/images/entities/char_e001.gif) O groups, characteristic of the carbonyl compounds, to –CH2– groups, a key step in the reduction process. Peaks observed around 3405 and 1620 cm−1 in rGO correspond to –OH groups on the basal plane of graphene sheets and C
O groups, characteristic of the carbonyl compounds, to –CH2– groups, a key step in the reduction process. Peaks observed around 3405 and 1620 cm−1 in rGO correspond to –OH groups on the basal plane of graphene sheets and C![[double bond, length as m-dash]](https://www.rsc.org/images/entities/char_e001.gif) C aromatic bonds, respectively.43 The FTIR spectrum of rGO/ZnO as shown in Fig. 2a displays distinct peaks associated with rGO as mentioned and the peaks corresponding to ZnO, where the peaks at 875 and 435 cm−1 are attributed to the bending and stretching of the Zn–O bond, respectively, within ZnONPs.46,47,51–54 This observation provides compelling evidence for the successful formation of ZnONPs. Furthermore, peaks at 3405 and 1615 cm−1 confirm the presence of –OH groups on the surface of ZnONPs.52 The confirmation of ZnONP formation was also substantiated through XRD analysis (Section 3.1.3) and morphological and elemental analyses (Section 3.1.1). The presence of peaks associated with both rGO and ZnO in the FTIR spectrum of rGO/ZnO further supports the successful formation of the rGO/ZnO nanohybrid.
C aromatic bonds, respectively.43 The FTIR spectrum of rGO/ZnO as shown in Fig. 2a displays distinct peaks associated with rGO as mentioned and the peaks corresponding to ZnO, where the peaks at 875 and 435 cm−1 are attributed to the bending and stretching of the Zn–O bond, respectively, within ZnONPs.46,47,51–54 This observation provides compelling evidence for the successful formation of ZnONPs. Furthermore, peaks at 3405 and 1615 cm−1 confirm the presence of –OH groups on the surface of ZnONPs.52 The confirmation of ZnONP formation was also substantiated through XRD analysis (Section 3.1.3) and morphological and elemental analyses (Section 3.1.1). The presence of peaks associated with both rGO and ZnO in the FTIR spectrum of rGO/ZnO further supports the successful formation of the rGO/ZnO nanohybrid.
 | (3) |
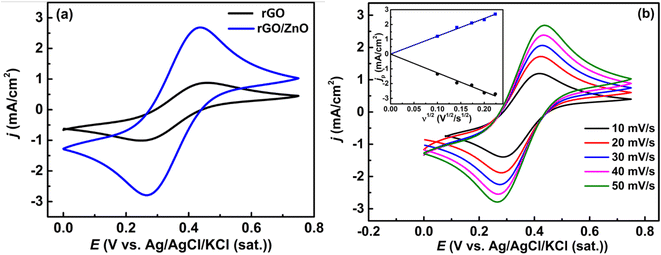
The electrochemically active surface area of the rGO/ZnO nanohybrid modified GCE was determined by calculating the slope of the ip vs. v1/2 plot, depicted in the inset of Fig. 3b, and employing the Randles–Sevcik eqn (4).
 | (4) |
![[thin space (1/6-em)]](https://www.rsc.org/images/entities/char_2009.gif) 485.339 C mol−1), R = universal gas constant (8.31447 J K−1 mol−1), T = absolute temperature (298 K), A = surface area of electrode (cm2), C = molar concentration of redox-active species (5 mmol L−1), and D = diffusion coefficient (0.06 cm2 s−1). The surface area of rGO/ZnO nanohybrid modified GCE was measured at ca. 0.103 cm2, representing a 45% increase compared to that of the bare GCE (0.071 cm2). This finding implies a notable augmentation in the surface area, attributable to the presence of the rGO/ZnO nanohybrid. The improved electrocatalytic activity and high surface area will greatly benefit the electrochemical sensing of BPA in aqueous media.38,40,43
485.339 C mol−1), R = universal gas constant (8.31447 J K−1 mol−1), T = absolute temperature (298 K), A = surface area of electrode (cm2), C = molar concentration of redox-active species (5 mmol L−1), and D = diffusion coefficient (0.06 cm2 s−1). The surface area of rGO/ZnO nanohybrid modified GCE was measured at ca. 0.103 cm2, representing a 45% increase compared to that of the bare GCE (0.071 cm2). This finding implies a notable augmentation in the surface area, attributable to the presence of the rGO/ZnO nanohybrid. The improved electrocatalytic activity and high surface area will greatly benefit the electrochemical sensing of BPA in aqueous media.38,40,43
3.2 BPA sensing application
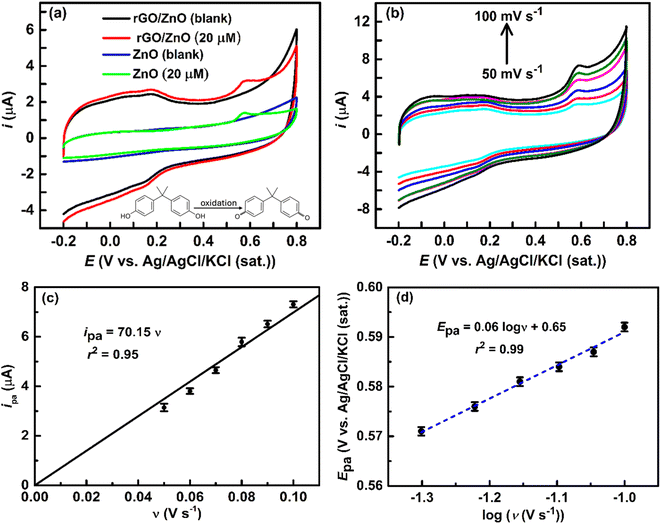
![[thin space (1/6-em)]](https://www.rsc.org/images/entities/char_2009.gif) ν) as shown in Fig. 4d, and expressed by the eqn (5).
ν) as shown in Fig. 4d, and expressed by the eqn (5).
Epa = 0.06![[thin space (1/6-em)]](https://www.rsc.org/images/entities/char_2009.gif) log log![[thin space (1/6-em)]](https://www.rsc.org/images/entities/char_2009.gif) ν + 0.65 ν + 0.65
| (5) |
For an irreversible faradaic process, the Epa is related to the log![[thin space (1/6-em)]](https://www.rsc.org/images/entities/char_2009.gif) ν following eqn (6).63
ν following eqn (6).63
 | (6) |
The pH of the solution is a critical factor influencing the electrochemical oxidation of BPA, impacting both Epa and ipa. Generally, the Epa shifts towards more positive and negative directions with lower and higher pH, respectively.3,56,59
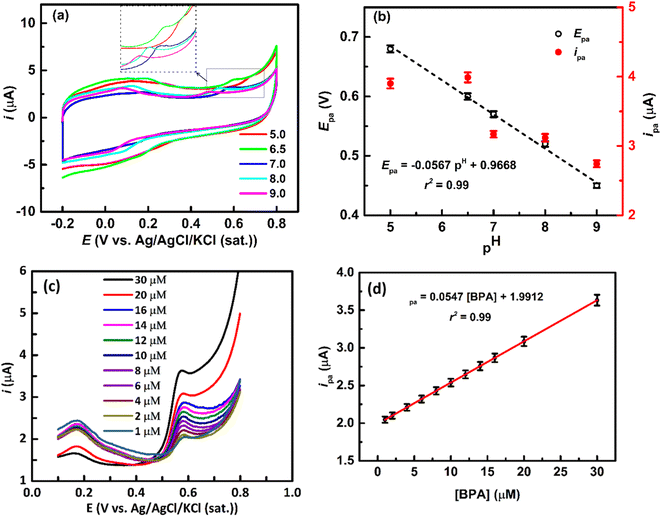
Fig. 5a shows that CVs at the rGO/ZnO-modified GCE in a 20 μM BPA solution of various pH, revealing a negative shift in Epa with increasing pH, coupled with an increase in ipa at lower pH (Fig. 5b). These observations align with previous reports3,56 and can be rationalized by considering the pH-dependent ionization state of BPA and its adsorption interactions with the surface of rGO/ZnO. The phenolic –OH groups of BPA undergo pH-dependent ionization; in acidic conditions, they become fully protonated (BPA + 2H+ → BPAH2+), while in basic conditions, they become fully deprotonated (BPA → BPA2− + 2H+). These ionization states such as BPAH2+, BPA0 and BPAH2−, influence the redox properties of BPA, affecting its electrochemical Epa. Additionally, the pH of the solution affects the ionization of functional groups on the rGO/ZnO surface, altering the nature of the surface charge. Changes in pH can thus modify electrostatic interactions between charged surface groups of rGO and BPA.2,57 Even, at higher pH, metal ions on metal oxide may form hydroxide complexes, potentially influencing BPA adsorption.59 Therefore, the decrease in ipa at higher pH values may be attributed to electrostatic repulsion between negatively charged BPA2− and the rGO/ZnO surface. However, a linear relationship (r2 = 0.99) is observed between Epa and the pH as shown in Fig. 5b following the eqn (7).
| Epa = −0.0567pH + 0.9919 | (7) |
The ratio of proton to electron transfer in the oxidation of BPA can be calculated by comparing eqn (7) and (8).
 | (8) |
It has been observed that there is no significant increase in the ipa, even after a 30 minute of the accumulation time, during the oxidation of BPA (data not provided) and BPA is a non-polar organic compound, therefore, its accumulation would not be affected by applying a potential (known as accumulation potential).3 The lack of a need for accumulation time can be ascribed to the ultrafast adsorption64 capability of rGO/ZnO towards BPA.65 This indicates a rapid sensing process for BPA in aqueous media employing rGO/ZnO-modified electrodes, which is crucial for practical applications.
| Electrode | Method | Sensitivity μA μM−1 | LOD μM | Reference |
|---|---|---|---|---|
| a BMO: barium oxide/molybdenum oxide; CTAB: cetyltrimethylammonium bromide; DPV: differential pulse voltammetry; ErGO: electrochemically reduced graphene oxide; MCPE: modified carbon paste electrode; MOF: metal organic framework; MXene: Ti3C2; NDC: 1,4-naphthalenedicarboxylate; SWV: square-wave voltammetry; UiO-66: Zr(IV) dicarboxylate; *: μA (log nM)−1 cm−2; **: μA (log μM)−1 cm−2. | ||||
| CTAB/Au/ZnO/rGO | DPV | — | 0.00495 | 8 |
| NiO/ZnO/rGO | DPV | — | 0.004 | 11 |
| ZnO/GO/MCPE | Voltammetric | — | 2.760 | 19 |
| Gd@ZnO-MWCNTs | DPV | 0.02633 | 0.2 | 9 |
| UiO-66-NDC/GO | DPV | — | 0.025 | 20 |
| Pt@SWCNTs-Mxene-rGO | 0.0028 | 12 | ||
| Ag@Fe3O4-rGO | DPV | — | 0.028 | 10 |
| BMO/rGO | DPV | — | 0.004 | 7 |
| ZnO/ZnCo2O4 | DPV | — | 0.01 | 24 |
| MWCNTs/Ag–ZnO | Voltammetric | — | 0.006 | 18 |
| ZnO/BC | DPV | 0.092 | 0.1 | 13 |
| CuO/GO | DPV | 0.093 | 14 | |
| rGO/MoO3NPs | DPV | 13.96* | 0.00012 | 27 |
| Ce-MOF-ErGO | 0.0019 | 15 | ||
| TiN-rGO | 0.00019 | 23 | ||
| AgNPs/rGO | 2.56** | 0.14 | 16 | |
| I-rGO | DPV | — | 0.02 | 17 |
| rGO/ZnO | Voltammetric | 0.055 | 0.00098 | Present study |
| Sample no. | Concentration of BPA (μM) | Recovery (%) | |
|---|---|---|---|
| Added | Found | ||
| 1 | 0.50 | 0.53 ± 0.02 | 106 |
| 2 | 1.00 | 1.03 ± 0.02 | 103 |
| 3 | 1.50 | 1.42 ± 0.01 | 95 |
| 4 | 2.50 | 2.68 ± 0.03 | 107 |
| 5 | 5.00 | 4.90 ± 0.02 | 98 |
4 Conclusions
A cheaper method is unveiled for the synthesis of ZnO nanoparticles using metallic Zn shells collected from the waste dry cells via the precipitation method. A simple, low-cost and sensitive electrode material for the electrochemical detection of BPA based on rGO/ZnO nanohybrid was fabricated. The fabricated electrode demonstrated excellent electrochemical sensing performance towards the detection of BPA with a limit of detection of 0.98 nM and sensitivity of 0.055 μA μM−1 in water, which is below the predicted-no-effect-concentration in water for aquatic organisms. Furthermore, the suggested sensor has the ability to detect BPA in real water samples. The oxidation of BPA at the electrode surface followed one electron reaction with enhanced sensitivity due to the highly effective surface area and enhanced interaction of the BPA molecules with the rGO/ZnO electrode. The low cost of the precursors for the synthesized rGO/ZnO nanohybrid, derived from discarded dry cell batteries, makes it a feasible solution for detecting BPA in economically challenged and resource-limited regions, while also contributing to the environmentally sustainable management of e-waste.Data availability
Data will be made available on request.Conflicts of interest
The authors declare no competing interest.Acknowledgements
The authors are grateful to the Bangladesh Council of Scientific and Industrial Research for financial support (R&D ref. no. 39.02.0000.011.14.169.2023/877, date: 17.09.2023) and facilities. The assistance from IERD, CARF, and BAEC F&PRD to perform SEM, XRD, TEM, and FTIR is appreciated.References
- F. Liguori, C. Moreno-Marrodan and P. Barbaro, Chem. Soc. Rev., 2020, 49, 6329–6363 RSC.
- J. Xu, L. Wang and Y. Zhu, Langmuir, 2012, 28, 8418–8425 CrossRef CAS PubMed.
- A. U. Alam and M. J. Deen, Anal. Chem., 2020, 92, 5532–5539 CrossRef CAS.
- S. Almeida, A. Raposo, M. Almeida-González and C. Carrascosa, Compr. Rev. Food Sci. Food Saf., 2018, 17, 1503–1517 CrossRef PubMed.
- K. V. Ragavan, N. K. Rastogi and M. S. Thakur, TrAC, Trends Anal. Chem., 2013, 52, 248–260 CrossRef CAS.
- F. Sun, L. Kang, X. Xiang, H. Li, X. Luo, R. Luo, C. Lu and X. Peng, Anal. Bioanal. Chem., 2016, 408, 6913–6927 CrossRef CAS PubMed.
- R. Sundaresan, V. Mariyappan, T.-W. Chen, S.-M. Chen, M. Akilarasan, M. A. Alsaigh, M. A. Ali, M. S. Elshikh and J. Yu, Mater. Today Chem., 2023, 30, 101602 CrossRef CAS.
- A.-Y. Zha, Q.-B. Zha, Z. Li, H.-M. Zhang, X.-F. Ma, W. Xie and M.-S. Zhu, Rare Met., 2023, 42, 1274–1282 CrossRef CAS.
- S. Agrahari, A. K. Singh, R. K. Gautam and I. Tiwari, J. Appl. Electrochem., 2023, 53, 345–358 CrossRef CAS.
- M. Shen, W. Li, F. Chen, L. Chen, Y. Chen, S. Chen, S. Ren and D. Han, Microchem. J., 2023, 186, 108315 CrossRef CAS.
- J. A. Buledi, H. Shaikh, A. R. Solangi, A. Mallah, Z.-H. Shah, M. M. Khan, A. L. Sanati, H. Karimi-Maleh, C. Karaman, M. B. Camarada and D. E. Niculina, Ind. Eng. Chem. Res., 2023, 62, 4754–4764 CrossRef CAS.
- G. Qu, Y. Zhang, J. Zhou, H. Tang, W. Ji, Z. Yan, K. Pan and P. Ning, Chemosphere, 2023, 337, 139315 CrossRef CAS PubMed.
- J. Hu, D. Mao, P. Duan, K. Li, Y. Lin, X. Wang and Y. Piao, Chemosensors, 2022, 10, 163 CrossRef CAS.
- F. Ebrahimi-Tazangi, H. Beitollahi, H. Hekmatara and J. Seyed-Yazdi, J. Iran. Chem. Soc., 2021, 18, 191–199 CrossRef CAS.
- X. Wang, Y. Shi, J. Shan, H. Zhou and M. Li, Ionics, 2020, 26, 3135–3146 CrossRef CAS.
- D. Verma, T. K. Dhiman, M. D. Mukherjee and P. R. Solanki, J. Electrochem. Soc., 2021, 168, 097504 CrossRef CAS.
- K.-P. Wang, J.-M. Hu and X. Zhang, Microchem. J., 2022, 173, 107047 CrossRef CAS.
- K. Kunene, M. Sabela, S. Kanchi and K. Bisetty, Waste Biomass Valorization, 2020, 11, 1085–1096 CrossRef CAS.
- L. S. Manjunatha, B. E. K. Swamy, S. C. Sharma and C. Krithika, Mater. Today Commun., 2024, 38, 108012 CrossRef.
- T. S. Sunil Kumar Naik, S. Singh, P. N, R. Varshney, B. Uppara, J. Singh, N. A. Khan, L. Singh, M. Zulqarnain Arshad and P. C. Ramamurthy, Chemosphere, 2023, 311, 137104 CrossRef CAS PubMed.
- S. Yasmin, M. H. Kabir, N. Roy and S. Jeon, ECS Adv., 2023, 2, 024504 CrossRef CAS.
- S. Yasmin, N. Roy, M. H. Kabir and S. Jeon, Appl. Surf. Sci. Adv., 2022, 9, 100235 CrossRef.
- W. Xu, Y. Zhang, X. Yin, L. Zhang, Y. Cao, X. Ni and W. Huang, Anal. Bioanal. Chem., 2021, 413, 1081–1090 CrossRef CAS PubMed.
- M. Amiri and H. Mahmoudi-Moghaddam, Microchem. J., 2021, 160, 105663 CrossRef CAS.
- A. K. Mohiuddin, S. Yasmin and S. Jeon, Sens. Actuators, A, 2023, 355, 114314 CrossRef CAS.
- S. Yasmin, M. S. Ahmed and S. Jeon, J. Electrochem. Soc., 2015, 162, B363 CrossRef CAS.
- D. Verma, A. K. Yadav, M. D. Mukherjee and P. R. Solanki, J. Environ. Chem. Eng., 2021, 9, 105504 CrossRef CAS.
- N. Roy, S. Yasmin and S. Jeon, Microchem. J., 2020, 153, 104501 CrossRef CAS.
- Md. F. Ehsan, H. R. Barai, Md. M. Islam, Md. A. Bin Hasan Susan, S. W. Joo and M. S. Miran, Mater. Today Commun., 2023, 36, 106563 CrossRef CAS.
- M. Y. Pabel, M. F. Ehsan, M. S. Miran and M. M. Islam, Emerging Applications of Nanomaterials, 2023, vol. 141, pp. 101–123 Search PubMed.
- D. K. Sharma, S. Shukla, K. K. Sharma and V. Kumar, Mater. Today: Proc., 2022, 49, 3028–3035 CAS.
- Y.-H. Chiu, K.-D. Chang and Y.-J. Hsu, J. Mater. Chem. A, 2018, 6, 4286–4296 RSC.
- K. O. Sodeinde, S. O. Olusanya, O. S. Lawal, M. Sriariyanun and A. A. Adediran, Sci. Rep., 2022, 12, 17054 CrossRef CAS.
- S. Z. Hussain, M. Ihrar, S. B. Hussain, W. C. Oh and K. Ullah, SN Appl. Sci., 2020, 2, 764 CrossRef CAS.
- M. M. Islam, M. Y. A. Mollah, M. A. B. H. Susan and M. M. Islam, RSC adv., 2020, 10, 44884–44891 RSC.
- M. Galib, M. M. Hosen, J. K. Saha, Md. M. Islam, S. H. Firoz and Md. A. Rahman, J. Mol. Model., 2020, 26, 251 CrossRef CAS PubMed.
- A. Musa, M. M. Islam, M. A. B. H. Susan and M. M. Islam, ECS J. Solid State Sci. Technol., 2023, 12, 061005 CrossRef CAS.
- S. Yasmin, M. S. Ahmed, D. Park and S. Jeon, J. Electrochem. Soc., 2016, 163, B491 CrossRef CAS.
- S. Yasmin, M. S. Ahmed and S. Jeon, J. Nanosci. Nanotechnol., 2017, 17, 3959–3966 CrossRef CAS.
- S. Yasmin, Y. Joo and S. Jeon, Appl. Surf. Sci., 2017, 406, 226–234 CrossRef CAS.
- N. Roy, S. Yasmin, A. Ejaz, H. Soon Han and S. Jeon, Appl. Surf. Sci., 2020, 533, 147500 CrossRef CAS.
- Md. G. Azam, M. H. Kabir, Md. A. A. Shaikh, S. Ahmed, M. Mahmud and S. Yasmin, J. Water Process Eng., 2022, 46, 102597 CrossRef.
- Md. Yeasin Pabel, S. Yasmin, M. A. A. Shaikh and M. H. Kabir, Sens. Actuators, A, 2024, 366, 115028 CrossRef CAS.
- B. P. Upoma, S. Yasmin, Md. A. Ali Shaikh, T. Jahan, Md. A. Haque, M. Moniruzzaman and M. H. Kabir, ACS Omega, 2022, 7, 29655–29665 CrossRef CAS.
- S. Yasmin, S. Cho and S. Jeon, Appl. Surf. Sci., 2018, 434, 905–912 CrossRef CAS.
- S. Faisal, H. Jan, S. A. Shah, S. Shah, A. Khan, M. T. Akbar, M. Rizwan, F. Jan, Wajidullah, N. Akhtar, A. Khattak and S. Syed, ACS Omega, 2021, 6, 9709–9722 CrossRef CAS PubMed.
- Z. Wang, M. R. Bockstaller and K. Matyjaszewski, ACS mater. lett., 2021, 3, 599–621 CrossRef CAS.
- M. Zare, K. Namratha, S. Ilyas, A. Sultana, A. Hezam, S. L, M. A. Surmeneva, R. A. Surmenev, M. B. Nayan, S. Ramakrishna, S. Mathur and K. Byrappa, ACS Food Sci. Technol., 2022, 2, 763–781 CrossRef CAS.
- C. R. Mendes, G. Dilarri, C. F. Forsan, V. de, M. R. Sapata, P. R. M. Lopes, P. B. de Moraes, R. N. Montagnolli, H. Ferreira and E. D. Bidoia, Sci. Rep., 2022, 12, 2658 CrossRef CAS.
- Y. Khan, B. Singh, R. Ullah, M. Shoeb, A. Naqvi and S. Abidi, PLoS One, 2015, 10(7), e0133086 CrossRef.
- F. Yousefimehr, S. Jafarirad, R. Salehi and M. S. Zakerhamidi, Sci. Rep., 2021, 11, 11900 CrossRef CAS PubMed.
- F. A. Alharthi, A. A. Alsyahi, S. G. Alshammari, H. A. AL-Abdulkarim, A. AlFawaz and A. Alsalme, ACS Omega, 2022, 7, 2786–2797 CrossRef CAS PubMed.
- G. M. Abdelghani, A. B. Ahmed and A. B. Al-Zubaidi, Sci. Rep., 2022, 12, 20016 CrossRef CAS.
- S. Al-Ariki, N. A. A. Yahya, S. A. Al-A’nsi, M. H. H. Jumali, A. N. Jannah and R. Abd-Shukor, Sci. Rep., 2021, 11, 11948 CrossRef CAS.
- S. Yasmin, M. Shamsuddin Ahmed and S. Jeon, Int. J. Hydrogen Energy, 2017, 42, 1075–1084 CrossRef CAS.
- J. Huang, T. Zhang, G. Dong, S. Zhu, F. Yan and J. Liu, Front. Chem., 2022, 10, 900282 CrossRef CAS PubMed.
- Y. Wang, X. Wei, Y. Qi and H. Huang, Chemosphere, 2021, 263, 127563 CrossRef CAS PubMed.
- A. Qurashi, J. A. Rather, K. D. Wael, B. Merzougui, N. Tabet and M. Faiz, Analyst, 2013, 138, 4764–4768 RSC.
- D.-N. Pei, A.-Y. Zhang, X.-Q. Pan, Y. Si and H.-Q. Yu, Anal. Chem., 2018, 90, 3165–3173 CrossRef CAS PubMed.
- R. Shi, J. Liang, Z. Zhao, A. Liu and Y. Tian, Talanta, 2017, 169, 37–43 CrossRef CAS PubMed.
- J. Yan, Z. Fan, T. Wei, W. Qian, M. Zhang and F. Wei, Carbon, 2010, 48, 3825–3833 CrossRef CAS.
- A. J. Bard, L. R. Faulkner and H. S. White, Electrochemical Methods: Fundamentals and Applications, 3rd edn, https://books.wiley.com/titles/9781119334064/, accessed January 25, 2024 Search PubMed.
- R. S. Nicholson and I. Shain, Anal. Chem., 1964, 36, 706–723 CrossRef CAS.
- M. Sohag Hossain, M. Humayun Kabir, M. A. A. Shaikh, M. Anamul Haque and S. Yasmin, RSC Adv., 2024, 14, 1431–1444 RSC.
- T. Dong, C. Ling, L. Fu, Y. Xue, Y. Pan, Y. Zhang and C. Zhu, J. Hazard. Mater., 2023, 445, 130562 CrossRef CAS.
| This journal is © The Royal Society of Chemistry 2024 |

