DOI:
10.1039/D4RA04059G
(Paper)
RSC Adv., 2024,
14, 36507-36516
Synergistic removal mechanism of tetracycline by ethylenediamine modified magnetic chitosan based Fenton-like catalyst†
Received
3rd June 2024
, Accepted 7th November 2024
First published on 15th November 2024
Abstract
Modified magnetic chitosan nanoparticles (EMMCS-G), used as a Fenton-like catalyst, were successfully prepared and modified with glutaraldehyde and ethylenediamine. EMMCS-G has strong magnetization, good reusability, stability, environmental friendliness, and high efficiency. In the Fenton-like system, the synergistic effect of adsorption and advanced oxidation significantly enhances the removal effect of tetracycline (TC). The optimal concentration of persulfate was found to be 20 mmol L−1, and at a pH of 3, the removal efficiency of TC reached 95.6% after 6 hours. The oxidation system demonstrated excellent pH adaptability, achieving a TC removal rate of 94% within 6 hours across a pH range of 3 to 8. Hydroxyl (˙OH) and sulfate (SO4−˙ ) radicals were present in the reaction system, with ˙OH playing an important role in the oxidation process of TC. The attack sites of tetracycline were identified using density functional theory (DFT), and five degradation pathways for TC were proposed based on LS-MS experiments. Finally, quantitative structure–activity relationship (QSAR) analysis was employed to assess the toxicity of the intermediates. Overall, toxicity gradually decreased, indicating that the Fenton reaction system effectively reduced the toxicity and mutagenicity of TC. This study suggests EMMCS-G as a potential catalyst for enhanced Fenton-like degradation with excellent efficiency observed for the degradation of tetracycline for environmental remediation.
1. Introduction
In recent years, pharmaceuticals and personal care products (PPCPs) have played a vital role in our daily life, with usage volumes having increased rapidly. This surge has led to a significant presence of PPCPs in the environment, which has drawn increasing concerns due to their possible threats to the aquatic environment and human health. Tetracycline (TC) is a broad-spectrum antibiotic widely used to prevent infectious diseases and promote animal growth.1 Antibiotic residues can be generated during usage and excreted via metabolites. These residues could be detected in the effluents of sewage treatment plants and in surface water, and may be toxic to both humans and animals. Therefore, the removal of tetracycline is particularly important.
Advanced oxidation,2 bio-degradation3 and adsorption4 have been extensively employed for the removal of pharmaceuticals. Among these methods, advanced oxidation processes (AOPs) are thought to be an effective technology to remove tetracycline.5–8 And as one of the AOPs, Fenton oxidation has attracted more and more attention.9 The homogeneous Fenton reaction can be conducted by adding soluble Fe2+ and H2O2, demonstrating several advantages such as rapid degradation, low cost, and low toxicity of the reagents used. However, the pH of the oxidation reaction must be maintained within a low range. Additionally, the poor utilization rate of hydrogen peroxide resultes in decreased degradation of pollutants, and a large amount of iron ions after the reaction needs to be further treated, leading to secondary pollution. To overcome these drawbacks, heterogeneous Fenton catalysts have been utilized in numerous studies.10–13 Metal ions and oxides such as FeNi3@SiO2@TiO2,14 CuFe2O4,15 MnFe2O4,16 MoS2 (ref. 17) and Fe0 (ref. 18) have been developed for Fenton-like reactions. Fe3O4 nanoparticles are a common Fe-based catalyst that can activate oxidants to generate free radicals and show excellent biocompatibility, chemical stability and strong magnetic property.19 However, the agglomeration of Fe3O4 nanoparticles might have an influence on catalytic performance. An effective solution to this problem is to load Fe3O4 nanoparticles onto ESI† such as multi-walled carbon nanotubes,20 biochar21 to enhance dispersion.
Chitosan is a natural polymer derived from the alkaline deacetylation of chitin. Compared to other polymer materials, chitosan is biodegradable, biocompatible, non-toxic and antibacterial. It is also characterized by its renewability and low cost, making it suitable for a wide range of applications in medicine, food, chemicals and other fields. The presence of numerous amino and hydroxyl groups in chitosan molecules allows for chemical modification reactions based on complexation, flocculation and electrostatic adsorption. Furthermore, the nitrogen in chitosan can effectively coordinate with metals, enhancing the stability of catalysts.22 Therefore, chitosan is a promising adsorbent for tetracycline.23 However, chitosan has some disadvantages such as instability, limited separation, low mechanical strength and poor adsorption capacity in acidic solution, which limit its practical application. So, it is necessary to conduct some modifications. Laus et al.24 prepared cross-linked chitosan beads with epichlorohydrin and triphosphoric acid, which was used to adsorb copper ions, cadmium ions and lead ions. Zhang et al.25 used brushed magnetic chitosan to increase cationic groups in chitosan and improve the adsorption capacity of diclofenac and TC.
In this study, magnetic chitosan was prepared by the modification of glutaraldehyde and ethylenediamine to enhance the stability and adsorption capacity of the catalyst. The resulting catalyst demonstrated excellent adsorption performance, cycle stability and catalytic efficiency. The properties of the catalyst were evaluated, and the degradation performance of TC was analysed through a series of key experimental parameters, including the initial concentration of persulfate (PS), initial concentration of TC, pH value and catalyst dosage. Moreover, the radicals generated from the oxidation system were detected based on the effect of scavengers and EPR analysis. Based on the identification of intermediates by LC-MS and density functional theory (DFT), potential degradation pathways and mechanisms were proposed.
2. Materials and methods
2.1. Materials
All chemicals and materials are provided in the text S1.†
2.2. Preparation of ethylenediamine-modified magnetic chitosan (EMMCS-G)
The chitosan powder was dissolved in an acetic acid solution, mixed with FeCl3·6H2O and FeSO4·7H2O and stirred for 2 hours, then the mixture was dropped into NaOH/ethanol solution and stirred for 3 hours. Magnetic chitosan was prepared. The magnetic chitosan was then suspended in a glutaraldehyde solution and agitated. After adjusting the pH to 9.5, epichlorohydrin was added and the mixture was heated at 60 °C for 5.5 hours. Following this, 7 mL of ethylenediamine was added, and the reaction continued at 60 °C for 3 hours after washing and pH adjustment. The ethylenediamine-modified magnetic chitosan (EMMCS-G) was obtained through washing and drying. The synthetic pathway of the material is shown in Fig. S1.†
2.3. Batch experiment
The experiments for the removal of TC were carried out by EMMCS-G at a temperature of 25 °C. A specific amount of catalyst and persulfate were added to TC aqueous solution and shaken for several hours. Various experimental factors such as initial concentration of PS, initial concentration of TC, pH and catalyst dosage were also examined. Details of the experiment can be found in the text S3.†
2.4. Regeneration and recycling experiment of catalyst
150 mg of EMMCS-G was added to a TC solution with a concentration of 50 mg L−1, and the pH of the solution was adjusted to 3 using 0.1 mol L−1 H2SO4. Subsequently, PS with a concentration of 20 mmol L−1 was added. The mixture was placed in a shaker for 12 hours at 200 rpm and 25 °C. Afterward, the concentration of TC in the residual solution was measured to evaluate the performance of the catalyst. EMMCS-G was then separated from the solution with a magnet and washed with deionized water. Finally, the catalyst was placed in a vacuum drying oven at 60 °C for 8 hours in preparation for the next cycle. This experiment was repeated four times.
3. Results and discussion
3.1. Characterization of EMMCS-G
3.1.1. SEM analysis. Fig. 1(a) and (b) show the SEM images of chitosan and EMMCS-G. The results indicate that the surface of chitosan is smooth, while that of the EMMCS-G is rough, loose, and spherical, with many pores on the surface.26 The SEM analysis indicates the presence of pores. In our previous study, the BET specific surface areas of chitosan and EMMCS-G were measured to be 0.73 m2 g−1 and 37.68 m2 g−1, respectively. The synthesized EMMCS-G is mainly composed of mesoporous structures, and the average pore size of BJH is 6.47 nm, which is advantageous for mass transfer and the adsorption of adsorbate molecules.27 In addition, ImagerJ was used to quantify the porosity of the modified chitosan at 36.50%. This porous structure in EMMCS-G can better enable it to adsorb organic pollutants and increase the active sites, improving catalytic activity.
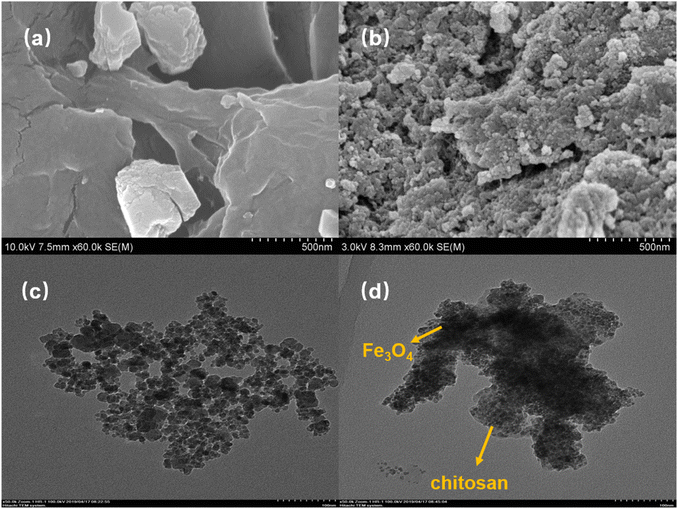 |
| | Fig. 1 (a) SEM images of chitosan and (b) EMMCS-G. (c) TEM images of Fe3O4 and (d) EMMCS-G. | |
3.1.2. TEM analysis. TEM images of Fe3O4 and EMMCS-G are shown in Fig. 1(c) and (d). The results indicated that Fe3O4 particles have been successfully coated with chitosan and are evenly distributed in the chitosan cross-linking. EMMCS-G is basically monodisperse, with a random distribution of particle sizes ranging from 5 nm to 20 nm,28 which is consistent with the SEM results.29,30 Compared with Fe3O4, the aggregation of the adsorbent is reduced, which is considered beneficial for the sufficient contact between the sorbent and adsorbates.
3.1.3. XRD analysis. The XRD patterns of pure Fe3O4 and EMMCS-G are shown in Fig. 2(d). Six diffraction peaks (2θ = 30.1°, 35.5°, 43.1°, 53.5°, 57.1°, 62.7°) could be observed in both samples, distributed in Fe3O4(220), (311), (400), (422), (511), and (440) faces (JCPDS No. 88-0315). The results showed that Fe3O4 was successfully coated with chitosan,31 and the crystallinity of Fe3O4 in magnetic chitosan remained stable. Compared with Fe3O4, the peak value of EMMCS-G is slightly less sharp, which may be due to the presence of chitosan. The crystalline structure of Fe3O4 in the modified magnetic chitosan did not change, and it still had good magnetic properties.
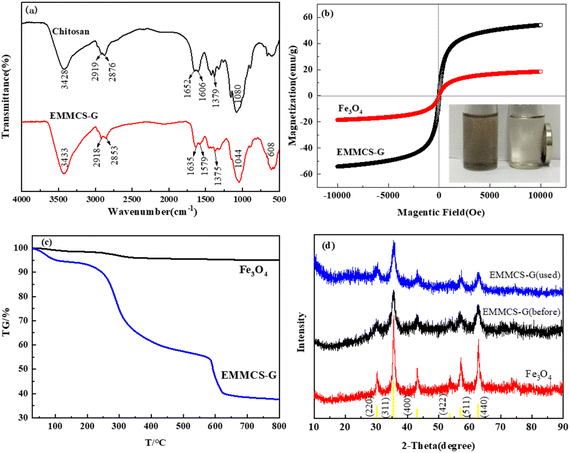 |
| | Fig. 2 (a) FTIR spectra of chitosan and EMMCS-G. (b) Magnetic hysteresis loops of Fe3O4 and EMMCS-G. (c) TGA curves of Fe3O4 and EMMCS-G. (d) XRD patterns of Fe3O4 and EMMCS-G before and after reaction in EMMCS-G/PS system. | |
3.1.4. FTIR analysis. Fig. 2(a) shows the FTIR spectra of chitosan and EMMCS-G. The peak near 3428 cm−1 of chitosan corresponds to the stretching vibration of N–H and O–H bonds, the peaks at 2919 cm−1 and 2876 cm−1 are attributed to the stretching vibration of C–H bonds,32 and the adsorption band of primary amine on the deformation vibration of N–H can be observed at 1606 cm−1. In addition, the peak at 1080 cm−1 is related to the joint action of C–O stretching vibration of alcohol and C–N stretching vibration of primary amine.33 Compared with the spectra of chitosan, it is clear that similar peaks occur in EMMCS-G, despite slight shifts in some characteristic peaks. At the same time, the new peak near 608 cm−1 corresponds to the vibration of Fe–O bond, and the significant adsorption peak of 1635 cm−1 corresponds to C![[double bond, length as m-dash]](https://www.rsc.org/images/entities/char_e001.gif) N bond, indicating that chitosan reacts with glutaraldehyde to form shift base.30 The FTIR spectral intensity of EMMCS-G at 3433 cm−1 increased, indicating that the amino group in EMMCS-G increased, confirming the successful cross-linking of chitosan and ethylenediamine.34
N bond, indicating that chitosan reacts with glutaraldehyde to form shift base.30 The FTIR spectral intensity of EMMCS-G at 3433 cm−1 increased, indicating that the amino group in EMMCS-G increased, confirming the successful cross-linking of chitosan and ethylenediamine.34
3.1.5. VSM analysis. The magnetic properties of the material were assessed through VSM. The magnetic curve is shown in Fig. 2(b). The saturation magnetization of Fe3O4 and EMMCS-G are 54.1 emu g−1 and 18.5 emu g−1, respectively. The weak magnetization of EMMCS-G may be due to the low content of Fe3O4 in magnetic chitosan. However, EMMCS-G still has strong magnetization and can be separated by an external magnetic field.35
3.1.6. TGA analysis. The thermodynamic stability of EMMCS-G and Fe3O4 after heating at a rate of 10 °C min−1 in a nitrogen atmosphere is described in Fig. 2(c). As can be seen, the weight of Fe3O4 gradually decreased by 5% over the entire range of temperatures with the increase in temperature. The weight reduction of EMMCS-G can be divided into four stages. At the first stage, when the temperature was less than 150 °C, the mass decreased slightly (5.9%), which may be due to the evaporation of residual water. Then, during the second temperature range of 150 °C to 500 °C, the high weight loss of about 36.8% may be ascribed to the depolymerization and degradation of chitosan during the heating process.36 At the third stage, the weight reduction of about 18.9% occurred between 500 °C and 700 °C, which was mainly attributed to the decomposition of organic matter in EMMCS-G. When the temperature exceeds 700 °C, the weight of EMMCS-G remains basically unchanged, indicating that only Fe3O4 exists in the catalyst at this time and the content of Fe3O4 in EMMCS-G is about 38%.37
3.2. TC removal performance evaluation
To investigate the activity of EMMCS-G, three materials (EMMCS-G, PS, and EMMCS-G/PS) were used to assess the efficiency of TC removal. As shown in Fig. 3, the EMMCS-G/PS system basically reached equilibrium after a reaction for 6 h. The removal rates of EMMCS-G and PS were 23.2% and 69.8% within 6 h respectively, while the TC removal rate reached 95.6% in the EMMCS-G/PS system. The results showed that the removal rate of TC in the EMMCS-G-PS-TC system was higher than that in the PS-TC system and EMMCS-G-TC system. In the EMMCS-G-TC system, it is mainly the adsorption of the catalyst to remove TC. In the PS-TC system, it is mainly the advanced oxidation of persulfate to remove TC. In the EMMCS-G-PS-TC system, EMMCS-G and PS have a synergistic effect, and PS can be activated by EMMCS-G to produce free radicals. While the EMMCS-G exerts an adsorption effect, the combined action of Fe3O4 and PS on the chitosan forms a heterogeneous Fenton system. The oxidation rate of TC is much higher than that of a single persulfate system, which greatly improves the removal effect of TC. Advanced oxidation technology and adsorption enhance the removal effect of TC.
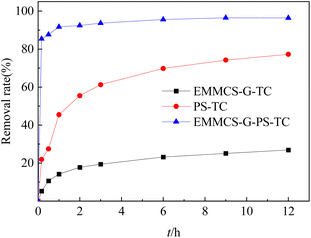 |
| | Fig. 3 The comparison of TC removal in different systems (TC concentration: 50 mg L−1; T = 25 °C; pH = 3; EMMCS-G: 15 mg). | |
3.3. Influence factors of the tetracycline removal
3.3.1. Effect of the initial TC concentration. The removal efficiency of TC at different concentrations of 50 mg L−1 to 200 mg L−1 was investigated at pH = 3, PS = 20 mM and EMMCS-G = 15 mg. From Fig. 4(a), the lower the initial concentration of TC, the better the effect of TC removal. One reason is that TC molecules in the solution compete with PS for the active sites on chitosan. Additionally, the TC molecules adsorbed on the surface of chitosan may hinder the contact between PS and Fe3O4 on the magnetic chitosan, causing a reduction in the number of SO4−˙ free radicals. During the degradation process, the intermediates may compete with TC molecules for radicals, resulting in a decrease in the TC removal rate. Another reason may be that the ratio of the number of TC molecules to the catalyst is large, and the adsorption and catalytic capacity per unit mass of the catalyst is limited. Therefore, as the TC concentration increases, the removal rate decreases.
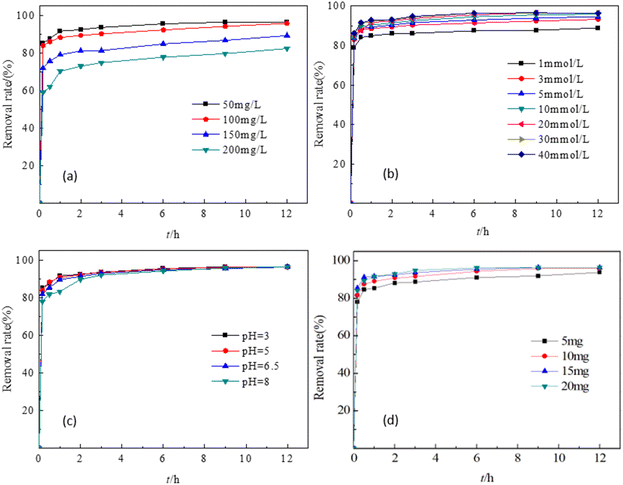 |
| | Fig. 4 Effects of different factors on the degradation of TC. (a) TC concentration, (b) PS concentration, (c) pH, (d) EMMCS-G dosage. | |
3.3.2. Effect of the initial persulfate concentration. According to Fig. 4(b), the removal rate of TC increased from 87.5% to 95.6% after 6 h as the concentration of PS increased from 1 mM to 20 mM (TC concentration, 50 mg L−1; T = 25 °C; pH = 3; EMMCS-G: 15 mg). When the PS concentration was increased to 40 mM, the removal effect no longer improved. This may be due to the limited number of SO4−˙ free radicals produced by catalysis at low concentrations of PS, resulting in low oxidation efficiency. As the concentration of PS increased, more radicals were generated and reacted with Fe2+ on EMMCS-G to enhance the removal capability of TC. However, according to eqn (1) and (2), the excess radicals recombined or reacted with S2O82− to reduce active radicals, resulting in the removal effect no longer increased.37 Therefore, the optimal concentration of PS is 20 mM in this study.| | |
SO4−˙ + SO4−˙ → S2O82−
| (1) |
| | |
SO4−˙ + S2O82−→ S2O8−˙ + SO42−
| (2) |
3.3.3. Effect of solution pH. Fig. 4(c) showed that as the pH value increased from 3 to 6.5, the TC removal rate decreased slightly, and the removal rate reached 94% under all pH values used in this study after a reaction for 6 h, indicating that the change in pH had little effect on TC removal (TC concentration, 50 mg L−1; T = 25 °C; PS = 20 mM; EMMCS-G: 15 mg). Therefore, this reaction system can be used in a wide range of pH. The excellent pH adaptability may be attributed to the simultaneous involvement of adsorption and catalysis, though the higher pH value was unfavorable for the oxidation process.38 When the pH of the solution increased from 3 to 6.5, the adsorption amount first increased and then remained stable, while the adsorption dose gradually decreased after continuing to increase, as shown in Fig. 5. At the pH range of 5–8, EMMCS-G demonstrated a good ability for TC adsorption. Consequently, EMMCS-G shows high catalytic capacity in the presence of PS.
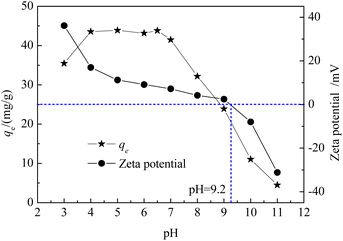 |
| | Fig. 5 Zeta potential of EMMCS-G and effect of pH on the TC adsorption onto EMMCS-G. | |
3.3.4. Effect of catalyst dosage. The effect of catalyst dose in the range of 5 mg to 20 mg on the TC removal using EMMCS-G/PS is shown in Fig. 4(d) (TC concentration, 50 mg L−1; T = 25 °C; pH = 3; PS: 20 mM). When the catalyst dosage increased from 5 mg to 15 mg, the removal rate of TC increased from 91% to 95.6% after 6 hours. This may be due to the increase of active sites for TC adsorption and catalysis. When the dosage of catalyst was further increased to 20 mg, excess SO4−˙ was generated and will self-combined to form S2O8−˙ (eqn (1)). Additionally, excess catalysts containing more Fe2+ will scavenge the radicals in solution,39 which inhibits the degradation process of tetracycline (eqn (3)). Hence, the removal performance no longer increased. In this study, 20 mM was set as the optimal concentration of PS for the following experiments.| | |
Fe2+ + SO4−˙ → Fe3+ + SO42−
| (3) |
3.4. Reusability and stability of catalyst
The stability and reusability of EMMCS-G were evaluated in the study. In Fig. 6, the removal efficiency of TC by EMMCS-G remained above 89% after four cycles in the Fenton-like system. The decrease in removal efficiency of TC may be due to the occupation of activated sites on the catalyst by intermediate products during the degradation process and the loss of the catalyst.40 However, the maximum reduction rate was only reduced by 7.3%, which indicated that TC molecules adsorbed on the catalyst surface can be degraded by heterogeneous Fenton-like catalysis to achieve the regeneration of EMMCS-G, and improved EMMCS-G possesses good reusability and catalytic performance.21 The XRD diagram (Fig. 2(d)) showed that the peak of EMMCS-G is almost unchanged before and after use; only the peak value at the (440) surface has a slight decrease after use, which indicates that the crystal structure of Fe3O4 in EMMCS-G before and after degradation had not changed significantly, indicating that the catalyst has high stability.41
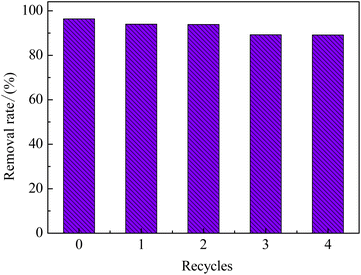 |
| | Fig. 6 TC and TOC removal in different recycles. (TC concentration: 50 mg L−1; T = 25 °C; PS concentration, 20 mM; pH = 3). | |
3.5. Degradation mechanism analysis
To verify the radical species of TC degradation, radical capture experiments were used to study the radicals generated in the EMMCS-G/PS system.42 tert-Butanol (TBA) can restrain the appearance of the ˙OH radical (k˙OH = 5.2 × 10⁸ M−1 S−1, kSO4−˙ = 8.4 × 10⁵ M−1 S−1); the ˙OH and SO4−˙ were both scavenged by methanol (k˙OH = 1 × 10⁹ M−1 S−1, kSO4−˙ = 2.5 × 10⁷ M−1 S−1). As shown in Fig. 7(a), after the addition of TBA and methanol, the removal percentage of TC declined from 95.7% to 80.9% and 77.2% within 6 h, respectively. The TC removal rate in the system with methanol was lower than that with TBA. All of the above indicated the simultaneous presence of SO4−˙ and ˙OH in the heterogeneous Fenton-like process. Especially, ˙OH played an important role in the EMMCS-G/PS catalytic system.43
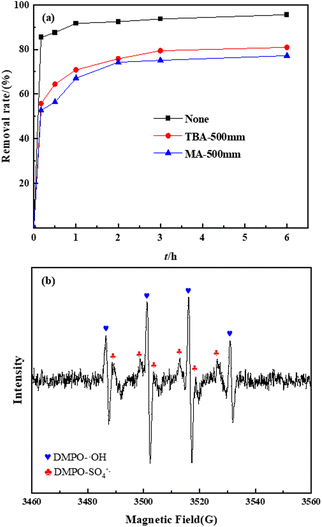 |
| | Fig. 7 (a) Effect of radical scarvengers on the TC removal. (b) EPR pattern of SO4−˙ and ˙OH. | |
ESR was applied to further assess the ROS in the removal process. As shown in Fig. 7(b), two sets of characteristic signals that can be attributed to DMPO-SO4−˙ and DMPO-˙OH were observed, confirming the production of SO4−˙ and ˙OH in the process. It can be seen from the EPR spectrum that the concentration of ˙OH is higher than that of SO4−˙, indicating that ˙OH plays a leading role in the Fenton-like system, which is consistent with the results of radical capture experiments.
A possible TC degradation mechanism was proposed and described in an EMMCS-G/PS system, as shown in Fig. 8. First, the electrostatic attraction between EMMCS-G and TC is used to adsorb TC molecules. Due to the high activity and porosity enriched in the internal material after adding PS, S2O82− in EMMCS-G is activated by Fe3O4, forming a SO4−˙ and ˙OH free network structure of EMMCS-G microspheres. PS could rapidly generate radicals to attack TC molecules. Finally, the adsorbed TC is degraded into intermediates. The high adsorption capacity of TC on EMMCS-G accelerates the contact between free radicals and TC molecules, thus improving the oxidation rate efficiency of TC. In addition, the strong electrical conductivity of mesoporous EMMCS-G not only promotes electron transfer between Fe2+ and Fe3+, but also provides more active sites for Fenton-like processes. The reaction equation is as follows:
| | |
EMMCS-G – Fe2+ + S2O82− → EMMCS-G – Fe3+ + SO4−˙ + SO42−
| (4) |
| | |
EMMCS-G – Fe3+ + S2O82− → EMMCS-G – Fe2+ + S2O8−˙
| (5) |
| | |
SO4−˙ + H2O → ˙OH + HSO4−
| (6) |
| | |
SO4−˙ + TC → intermediates
| (7) |
| | |
˙OH + TC → intermediates
| (8) |
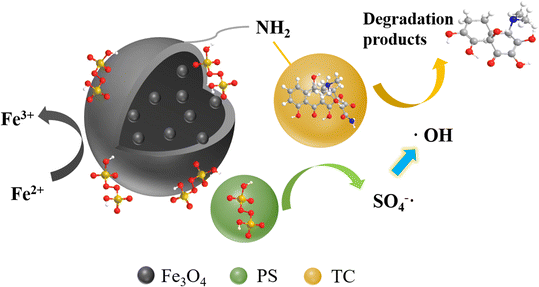 |
| | Fig. 8 The mechanism of TC degradation in Fenton-like system. | |
3.6. Possible degradation pathways of TC
In order to reveal the degradation pathway of TC, a method combining liquid chromatography-mass spectrometry (LC-MS) and theoretical calculation was used. For this Fenton reaction, ˙OH is the main active substance, and according to the frontier electron density, ˙OH tends to attack sites with higher charge density. The HOMO is shown here (Fig. 9(a)). It can be found that the HOMO is mainly distributed near the atoms 1C, 2C, 3C, 5C, 22C, 17C, and 28O (the labels of each atom are shown in Fig. S3†), and these atoms have relatively high electron density and are prone to oxidation reactions. In addition, the corresponding LUMO was performed to infer the reduction process (Fig. 9(b)). The Fukui index (f0) of charge distribution based on natural population analysis (NPA) of tetracycline molecules was calculated, as shown in Fig. 9(c) and Table S1.† In general, the larger the f0 value, the more vulnerable it is to attack.
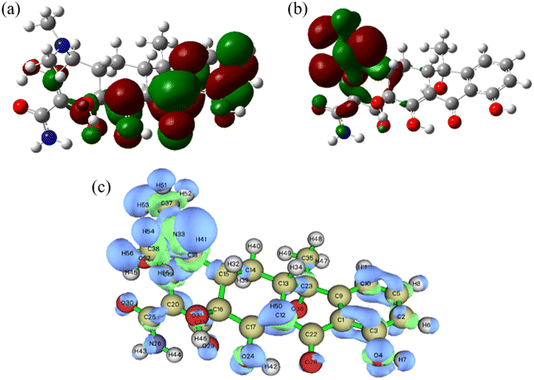 |
| | Fig. 9 (a) HOMO, (b) LUMO. (c) Fukui function. | |
Therefore, the main mechanism of TC degradation was explained based on intermediate identification (Fig. 10) and attack site prediction (Fig. 9(c)). First, due to the high f0 (0.04207266), ˙OH at the 5C atom attacked to form the hydroxylation product B5. At the same time, the 33 N atom with high f0 (0.06183594) could be attacked to form a de-n-alkylation reaction of B5. Subsequently, 28 O atoms with high f0 (0.04722783) were attacked to form hydroxylation products, causing B6 to convert to B11 and B15. In a further ring cleavage reaction, higher f0 levels were 2C (0.02782512), 3C (0.02490674), 17C (0.02703682), 19C (0.0250955), 22C (0.03610227), 24O (0.03435004), 29O (0.03615504), 30O (0.02696717) is further attacked in subsequent reactions to produce the expected product (Fig. 10). Eventually, all the intermediates are broken down into H2O and CO2. Then, these intermediates of TC degradation were measured and analyzed by HPLC-MS analysis. Fifteen compounds, including m/z = 431, 475, 498, 427, 453, 391, 382, 301, 369, 402, 374, 351, 340, and 274 were found and listed in the Table S2.†
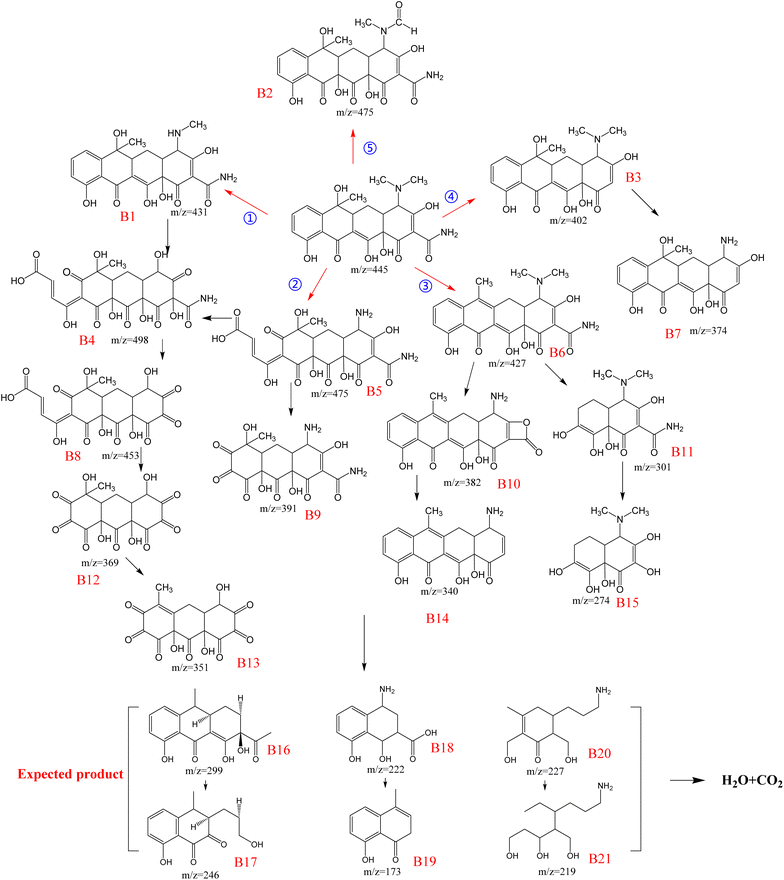 |
| | Fig. 10 TC degradation pathway in EMMCS-G/PS system. | |
Based on the DFT calculations and ROS analysis, the degradation pathways are shown in Fig. 10. The degradation of tetracycline was mainly conducted by ring opening, breaking of doubles bond and loss of functional groups in the EMMCS-G/PS Fenton-like system, which occurred in five ways. In pathway I, the methyl group of the dimethylamino group on C4 was lost to form the product B1 (m/z = 432). Then B1 was decomposed to B4 (m/z = 498) through the breaking of the C–N bond with the hydroxyl substitution reaction, the ring opening reaction at the C7–C8 bond, and the breaking of the C2–C3 bond and C11a–C12 double bonds. The loss of the amide group resulted in the formation of B8 (m/z = 453). B12 (m/z = 369) was obtained by the breaking of the C10–C20a double bonds in B8 and finally degraded into B13 (m/z = 351) through a dehydration reaction. In pathway II, B5 (m/z = 475) was formed by the C7–C8 bond ring-opening reaction, C4 dedimethylation, and C11a–C12 double bond breaking, and B9 was formed by C10–C10a bond breaking. The third pathway began with the dehydration reaction at C6 to form B6 (m/z = 427), then B10 (m/z = 382) due to the loss of the amino group and dedimethylation, and finally B14 (m/z = 340) through the loss of CO2. B11 was formed by B6 losing two rings (m/z = 301), which was converted to the product B15 (m/z = 274) due to the removal of the amide group. In route IV, B3 (m/z = 402) was formed by removing the amide group, which was then converted to B7 (m/z = 374) due to the loss of dimethyl. In the last pathway, TC was broken by the C11a–C12 double bond, and the methyl group on the dimethylamino group was converted to an aldehyde group, which was decomposed into a B2 intermediate (m/z = 475).44 The oxidation system mainly oxidizes TC into other small molecule substances to achieve the removal of TC. In the above five ways, the greater the f0 value of the Fukui index, the more vulnerable it is to attack. The 33N (0.06183594) atom with the highest f0 in pathways I, II, and V is attacked first, so these three pathways are more likely to occur. Secondly, 28O (0.04722783) and 5C (0.04207266) on TC are easy to be attacked; the 5C atom from TC to B5 in the first step of pathway II is attacked, and 5C from B1 to B4 in the second step of pathway I is attacked. Therefore, we can infer that pathway II is the most likely path to occur. According to the molecular structure of the product and previous studies on TC degradation, we predicted some small molecule substances that TC may form,45 as shown in Fig. 8. Eventually, all intermediates were further mineralized into CO2 and H2O.
3.7. Toxicity analysis of intermediates
The toxicity of TC and its degradation intermediates during the EMMCS-G/PS system was estimated through the quantitative structure–activity relationship (QSAR) using the toxicity estimation software tool (TEST). The specific values are shown in Table S3.† The developmental toxicity and mutagenicity of TC and its intermediates were studied by the LC50 of Fathead minmow, the LC50 of Daphnia minnow, and the LD50 of Oral rat. B8 (0.0231 mg L−1), B9 (0.0191 mg L−1), B12 (0.0242 mg L−1) and B14 (0.13 mg L−1) had lower LC50 values for Fathead minmow than that of TC (0.25 mg L−1) as the degradation process continued. The resulting small molecule products were gradually transformed into a non-toxic state. The LC50 value of TC in Daphnia minnow was 5.44 mg L−1, and those of B1 (6.99 mg L−1), B6 (1.26 mg L−1), B10 (4.17 mg L−1), B3 (8.67 mg L−1), B7 (5.82 mg L−1), and B14 (2.1 mg L−1) showed toxicity. The remaining intermediates were transformed into non-toxic states, and toxicity was greatly reduced. The LD50 value of oral TC in rats was 1524.24 mg kg−1, and the LD50 values of other intermediates were higher than those of TC, except for B12 (458.55 mg kg−1) and B13 (856.48 mg kg−1). TC had developmental toxicity (0.86) and mutagenicity (0.60), while some intermediates exhibited low mutagenicity. The TEST results show that although some intermediates are still toxic, the toxicity can be reduced by extending the reaction time, and the Fenton reaction degradation of TC in this system has a positive effect on reducing the toxicity and mutagenicity of TC. Finally, the toxicity of the expected small molecule was predicted in Table S3,† and after a long degradation reaction, the product was transformed into a completely non-harmful and non-toxic state.
4. Conclusions
Ethylenediamine-modified magnetic chitosan (EMMCS-G) was synthesized using a co-precipitation method, and its adsorption and catalytic properties for TC were investigated. EMMCS-G has high stability, strong magnetism for separation, environmental compatibility, good pH adaptability and reusability. Compared to previous studies, the pH adaptability of the reaction system has been enhanced, indicating a more effective synergistic effect on the adsorption and degradation of TC. In the EMMCS-G/PS system, the removal rate of TC can reach 95.6% due to the synergistic effect of adsorption and catalytic oxidation. EMMCS-G/PS system oxidizes TC through the circulation of iron ions to produce SO4−˙ and ˙OH, in which ˙OH plays a key role. Twenty-one intermediates were analyzed and predicted by LCMS, and five degradation pathways were proposed by DFT analysis and free radical oxidation mechanisms. EMMCS-G is an efficient and environmentally friendly catalyst, demonstrating significant practical implications for water treatment applications.
Data availability
All datas included in this study are available upon request by contact with the corresponding author.
Conflicts of interest
There is no conflicts of interest.
References
- A. Balakrishnan, M. Chinthala, R. K. Polagani and D. N. Vo, Environ. Res., 2023, 216, 114660 CrossRef CAS.
- K. Divyarani, S. Sreenivasa, T. M. C. Rao, W. Nabgan, F. A. Alharthi, B.-H. Jeon and L. Parashuram, Colloids Surf., A, 2023, 671, 131606 CrossRef CAS.
- X. Chen, Y. Yang, Y. Ke, C. Chen and S. Xie, Sci. Total Environ., 2022, 814, 152852 CrossRef CAS.
- L. Yan, X. Song, J. Miao, Y. Ma, T. Zhao and M. Yin, J. Water Process Eng., 2024, 60, 105215 CrossRef.
- S. Liu, C. Lai, X. Zhou, C. Zhang, L. Chen, H. Yan, L. Qin, D. Huang, H. Ye, W. Chen, L. Li, M. Zhang, L. Tang, F. Xu and D. Ma, Water Res., 2022, 221, 118797 CrossRef CAS PubMed.
- B. Zhang, Y. Jin, X. Huang, S. Tang, H. Chen, Y. Su, X. Yu, S. Chen and G. Chen, Chem. Eng. J., 2022, 450, 138264 CrossRef CAS.
- B. Yang, H. Liu and J. Zhang, Chem. Eng. J., 2023, 460, 141796 CrossRef CAS.
- J. Chen, C. Bao, M. Chen, Y. Wang, X. Xu, T. Yang, C. Shang and Q. Zhang, Chem. Eng. J., 2023, 464, 142526 CrossRef CAS.
- J.-Y. Li, X.-Y. Wang, J. Tian, X.-L. Zhang and F. Shi, Rare Met., 2023, 42, 1877–1887 CrossRef CAS.
- M.-J. Zhou, W.-T. Zhang, Z. Li, T. Feng, S. Lan, Z. Peng and S.-Q. Chen, Rare Met., 2023, 42, 3443–3454 CrossRef CAS.
- A. Adachi, F. El Ouadrhiri, E. Abdu Musad Saleh, F. Moussaoui, R. H. Althomali, S. El Bourachdi, K. Husain, A. Faris, I. Hassan, K. Azzaoui, B. Hammouti and A. Lahkimi, Arabian J. Chem., 2024, 17, 105862 CrossRef CAS.
- Y. Song, Y. Feng, T. Wu, R. Yang, Q. Shi, Z. Yi, Z. Li and W. Zhu, Sep. Purif. Technol., 2025, 354, 128587 CrossRef CAS.
- Z. Liu, Y. Zhang, J. Lee and L. Xing, J. Environ. Chem. Eng., 2024, 12, 112152 CrossRef CAS.
- M. Khodadadi, M. H. Ehrampoush, M. T. Ghaneian, A. Allahresani and A. H. Mahvi, J. Mol. Liq., 2018, 255, 224–232 CrossRef CAS.
- L. Liu, R. Yu, S. Zhao, X. Cao, X. Zhang and S. Bai, J. Environ. Manage., 2023, 335, 117576 CrossRef CAS PubMed.
- W. Zhao and B. Yang, J. Colloid Interface Sci., 2024, 658, 997–1008 CrossRef CAS PubMed.
- G. Qin, X. Song, Q. Chen, W. He, J. Yang, Y. Li, Y. Zhang, J. Wang and D. D. Dionysiou, Appl. Catal., B, 2024, 344, 123640 CrossRef CAS.
- S. I. Othman, H. E. Alfassam, H. A. Alqhtani, M. A. Al-Waili, A. A. Allam and M. R. Abukhadra, Int. J. Biol. Macromol., 2024, 130615, DOI:10.1016/j.ijbiomac.2024.130615.
- J. Lu, Y. Qiu, L. Zhang, J. Wang, C. Li, P. Wang and L. Ren, J. Hazard. Mater., 2024, 467, 133689 CrossRef CAS PubMed.
- M. Hamelian, K. Varmira and H. Veisi, Inorg. Chem. Commun., 2023, 158, 111566 CrossRef CAS.
- J. Peng, Z. Zhang, Z. Wang, F. Zhou, J. Yu, R. Chi and C. Xiao, J. Taiwan Inst. Chem. Eng., 2024, 156, 105363 CrossRef CAS.
- Z. Zeng, Y. Chen, X. Zhu and L. Yu, Chin. Chem. Lett., 2023, 34, 107728 CrossRef CAS.
- K. Mohan, D. Karthick Rajan, J. Rajarajeswaran, D. Divya and A. Ramu Ganesan, Curr. Opin. Environ. Sci. Health., 2023, 33, 100473 CrossRef.
- R. Laus, T. G. Costa, B. Szpoganicz and V. T. Favere, J. Hazard. Mater., 2010, 183, 233–241 CrossRef CAS PubMed.
- S. Zhang, Y. Dong, Z. Yang, W. Yang, J. Wu and C. Dong, Chem. Eng. J., 2016, 304, 325–334 CrossRef CAS.
- X. J. Hu, J. S. Wang, Y. G. Liu, X. Li, G. M. Zeng, Z. L. Bao, X. X. Zeng, A. W. Chen and F. Long, J. Hazard. Mater., 2011, 185, 306–314 CrossRef CAS PubMed.
- Y. Liu, X. Zhang and L. Zhao, Water Cycle, 2023, 4, 179–191 CrossRef.
- T. K. Trinh and L. S. Kang, Chem. Eng. Res. Des., 2011, 89, 1126–1135 CrossRef CAS.
- L. Zhou, J. Xu, X. Liang and Z. Liu, J. Hazard. Mater., 2010, 182, 518–524 CrossRef CAS.
- L. Zhou, J. Jin, Z. Liu, X. Liang and C. Shang, J. Hazard. Mater., 2011, 185, 1045–1052 CrossRef CAS PubMed.
- M. Monier and D. A. Abdel-Latif, J. Hazard. Mater., 2012, 209–210, 240–249 CrossRef CAS PubMed.
- S. P. Kuang, Z. Z. Wang, J. Liu and Z. C. Wu, J. Hazard. Mater., 2013, 260, 210–219 CrossRef CAS PubMed.
- L. Zhou, Z. Liu, J. Liu and Q. Huang, Desalination, 2010, 258, 41–47 CrossRef CAS.
- X.-Y. Huang, J.-P. Bin, H.-T. Bu, G.-B. Jiang and M.-H. Zeng, Carbohydr. Polym., 2011, 84, 1350–1356 CrossRef CAS.
- X. Deng, Z. Zhao, C. Wang, R. Chen, J. Du, W. Shi and F. Cui, Appl. Catal., B, 2022, 316, 121653 CrossRef CAS.
- C. Liu, H. Dai, C. Tan, Q. Pan, F. Hu and X. Peng, Appl. Catal., B, 2022, 310, 121326 CrossRef CAS.
- A. L. Caroni, C. R. de Lima, M. R. Pereira and J. L. Fonseca, Colloids Surf., B, 2012, 100, 222–228 CrossRef CAS PubMed.
- A. Jonidi Jafari, B. Kakavandi, N. Jaafarzadeh, R. Rezaei Kalantary, M. Ahmadi and A. Akbar Babaei, J. Ind. Eng. Chem., 2017, 45, 323–333 CrossRef CAS.
- E. E. Mitsika, C. Christophoridis and K. Fytianos, Chemosphere, 2013, 93, 1818–1825 CrossRef CAS PubMed.
- M. Khodadadi, A. Hossein Panahi, T. J. Al-Musawi, M. H. Ehrampoush and A. H. Mahvi, J. Water Process Eng., 2019, 32, 100943 CrossRef.
- Z. Pi, X. Li, D. Wang, Q. Xu, Z. Tao, X. Huang, F. Yao, Y. Wu, L. He and Q. Yang, J. Cleaner Prod., 2019, 235, 1103–1115 CrossRef CAS.
- W. Li, F. Wang, Y. Shi and L. Yu, Chin. Chem. Lett., 2023, 34, 107505 CrossRef CAS.
- Y. Chen, C. Chen, Y. Liu and L. Yu, Chin. Chem. Lett., 2023, 34, 108489 CrossRef CAS.
- X. Li, K. Cui, Z. Guo, T. Yang, Y. Cao, Y. Xiang, H. Chen and M. Xi, Chem. Eng. J., 2020, 379, 122324 CrossRef CAS.
- H. Xie, M. Mu, G. Lu and Y. Zhang, Int. J. Biol. Macromol., 2024, 261, 129699 CrossRef CAS.
|
| This journal is © The Royal Society of Chemistry 2024 |
Click here to see how this site uses Cookies. View our privacy policy here.  Open Access Article
 *a,
Xiaotian Guoa,
Liyuan Zhaoa,
Wenqi Duanb,
Yeqian Huang*c and
Xiaojuan Wanga
![[double bond, length as m-dash]](https://www.rsc.org/images/entities/char_e001.gif) N bond, indicating that chitosan reacts with glutaraldehyde to form shift base.30 The FTIR spectral intensity of EMMCS-G at 3433 cm−1 increased, indicating that the amino group in EMMCS-G increased, confirming the successful cross-linking of chitosan and ethylenediamine.34
N bond, indicating that chitosan reacts with glutaraldehyde to form shift base.30 The FTIR spectral intensity of EMMCS-G at 3433 cm−1 increased, indicating that the amino group in EMMCS-G increased, confirming the successful cross-linking of chitosan and ethylenediamine.34


