DOI:
10.1039/D4RA04148H
(Paper)
RSC Adv., 2024,
14, 26694-26702
Polydopamine functionalized FeTiO3 nanohexagons for selective and simultaneous electrochemical determination of dopamine and uric acid
Received
6th June 2024
, Accepted 22nd July 2024
First published on 22nd August 2024
Abstract
Herein we report the simultaneous detection of dopamine (DA) and uric acid (UA) using polydopamine (PDA) functionalized FeTiO3 nanohexagons. The nanohexagons were hydrothermally synthesized and subsequently functionalized with PDA in a Tris-buffer solution. The PDA functionalized nanostructure was characterized using X-ray diffraction (XRD), scanning electron microscopy (SEM), transmission electron microscopy (TEM), X-ray photoelectron spectroscopy (XPS), and Fourier transform infrared (FTIR), respectively. The SEM and TEM investigations revealed the presence of FeTiO3 nanohexagons along with a peripheral coating of PDA over the nanostructures. The XRD pattern confirmed the formation of the ilmenite structure, while the chemical structure was investigated through XPS and FTIR respectively. Using cyclic voltammetry (CV) the efficacy of FeTiO3-PDA electrode was evaluated toward DA oxidation. The enhanced activity of the functionalized electrode in DA oxidation, as compared to the untreated FeTiO3, may be attributed to the significant presence of hydroxyl, amine, and imine functional groups over the polymer layer. Differential pulse voltammetry (DPV) was utilized for the detection of DA and UA. With a linear range of 50 μM to 250 μM, the detection limits of 0.30 μM and 4.61 μM were determined for DA and UA, respectively. The peak separation of 263 mV between DA and UA demonstrates the sensor's remarkable selectivity. In addition, the study displayed the ability to detect both DA and UA simultaneously, and the validity of the sensor was evaluated in serum samples, respectively.
1. Introduction
Neurotransmitters are endogenous chemical transmitters that function by transmitting signals across the nerve cells. Dopamine (DA) is one such catecholamine-based neurotransmitter that regulates the brain and motor processes.1 DA is synthesized in the substantia nigra, a vital region of the brain involved in the regulation of pleasure, memory, and muscle contractions. Most of the body movements are controlled depending upon the concentration of DA in the basal ganglia. The depletion of DA leads to uncontrolled body movements such as tremors of the hands, shuffling gait, muscle rigidity, etc, leading to Parkinson's disease. Similarly, disorders such as Schizophrenia and Alzheimer's disease are also due to degenerative levels of DA.2 It is known that DA is present in the sub-micromolar range (10−6 M to 10−8 M) in the human body.3,4 Therefore, the assessment of DA levels is crucial for accurate diagnosis and early treatment of these disorders. Chromatography,5 fluorescence spectroscopy,6 and colorimetry7 are some of the methods reported in the literature for DA detection. However, electrochemical methods are versatile, simple with rapid response time, and less expensive. Generally, the quantification of DA is performed by the electro-oxidation of DA to dopamine quinone, which is a two-electron coupled two-proton transfer process. The oxidation of DA on bare electrodes causes surface fouling effects, ultimately affecting the sensor performance.8 It is also found that DA in real conditions co-exists along with other molecules such as uric acid (UA) etc. Hence developing a sensitive and selective sensor for detecting DA is necessary. This challenge can be overcome by using nanomaterials-based modified electrodes, which provide high surface area, good conductivity and facilitate the rapid adsorption/desorption of reactant intermediates and products.
Several modified electrodes based on metal nanoparticles,9 metal oxide,10,11 polymers,12 nanocomposites,13 carbon-based nanostructures,14 spinels,15 etc., have been employed for the detection of DA. Among them, perovskites are a class of compounds that have received great attention in recent years. Perovskites are compounds with ABO3 crystal structure where rare earth/transition metal ions are designated as A and B, A ions located in the octahedral sites and B ions in the tetrahedral sites.16 Perovskites have extensive applications in the field of batteries,17 solar cells,18 fuel cells,19 etc. Recently perovskites have been explored extensively for sensor applications.20–24 Shafi et al.25 revealed an investigation in 2021 discussing the process of synthesizing LaMnO3 nanoparticles for the detection of DA. The sensor provided a long linear range, and a detection limit of 32 nm was achieved. Similarly, Ponpandian et al. reported the detection of DA and UA using LaCoO3 26 and LaMnO3.27 However, the preparation of material and electrode fabrication is a laborious and time-consuming process. Among various perovskites, FeTiO3 is a semiconductor with a wide band gap ranging from 2.58 eV to 2.90 eV.28 FeTiO3 is a natural mineral commonly known as ilmenite and found as a part of kimberlites. The presence of transition metals with multiple oxidation states and the formation of oxygen vacancies can significantly improve catalytic performance.
Conducting polymers (CP) are a class of compounds having immense potential in the field of flexible electronics, drug delivery, corrosion-resistant coatings, and biosensing applications.29 Superior mechanical strength, electrical conductivity, thermal stability, and chemical and mechanical stability are just a few of the unique qualities that CPs have to offer. In addition, they can be prepared and processed very easily. CP combined with other nanomaterials offers several advantages in biosensors by enhancing the sensitivity, stability, and biocompatibility of the sensor. For instance, CPs like polyaniline and polypyrrole have been employed for the detection of glucose,30 cholesterol,31 etc. Further, several CPs were also employed for selective and simultaneous detection of DA. Martí et al.32 synthesized poly(N-methylpyrrole) (PNMPy) hollow particles using a layer-by-layer (LbL) self-assembly technique over the Au NPs. A stable DA with a detection limit of 1.5 μM was reported. In addition, a nanocomposite of polyaniline-WO3 was used to detect DA. The measured detection limit was 0.13 μM, and the range of precise readings was from 20 to 300 μM.33 Similarly, a plasma-assisted MnO2-polyaniline nanocomposite was reported by Cogal et al.34 wherein a detection level of 2.4 μM and linear range of 12.4–185.2 μM was achieved. Among CP, polydopamine (PDA) has drew great interset for its remarkable physiochemical properties. PDA is a biopolymer, typically produced by autooxidation of DA, and is a synthetic analogue of melanin.35 PDA is rich with the presence of hydroxyl, amine, and imine functionalities and is considered a versatile material in biosensors. Various PDA-based nanocomposite was employed for the detection of tryptophan,36 ecstacy components,37 hydrazine,38 etc. Salgado et al.39 reported a Pt-modified polyethylene dioxythiophene (PEDOT)/PDA electrode for the detection of DA. The inclusion of PDA has been shown to improve the sensor's sensitivity, obtaining an average range of 1.5 to 50 μM and an admissible limit of 0.65 μM. Although PDA-based nanocomposite has been studied for biosensing applications. The synergistic effect of PDA functionalized over perovskites towards DA detection has not been explored much. In this paper, FeTiO3-based perovskite oxide will be functionalized with PDA, and its efficacy in DA detection will be analysed. The sensor's ability to selectively detect DA and UA will be evaluated, and the sensor's validity will be examined in serum samples.
2. Materials and methods
2.1. Synthesis of FeTiO3
To synthesize FeTiO3, titanium isopropoxide (Sisco Chemicals) (1.20 mL) was introduced into a solution containing 20 mL of deionized water and 10% urea (Merck), stirred for 30 minutes. Subsequently, FeSO4·7H2O (1.11 g) (Merck) was added, and a 1 M KOH (Merck) solution was used to adjust the pH to 14. The solution was transferred to a 100 mL autoclave and was heated at 200 °C for 10 h. Subsequently, the precipitate produced was subjected to centrifugation, washed with water and ethanol, and dried at 80 °C.
2.2. Preparation of PDA-FeTiO3
For the synthesis of PDA functionalized FeTiO3, 200 mg of FeTiO3 powders and 50 mg of dopamine hydrochloride were mixed in 10 mL of 10 mM Tris-buffer solution. After stirring for 2 h at room temperature, the solution was centrifuged, washed with distilled water twice, and dried at 80 °C overnight.
2.3. Material characterization
The morphological characterization was conducted using a JEOL JEM 2100 transmission electron microscope (TEM) from Japan and a Zeiss field emission scanning electron microscope (FESEM) from Germany. The Bruker D8 device (XRD) was employed to examine the crystalline structure and the materials were examined for their chemical composition using the Shimadzu IRAffinity-1S infrared spectrometer (FTIR). The chemical composition was determined via X-ray photoelectron spectroscopy (XPS) with PHI Versa II, FEI, Inc., and XPS spectra were deconvoluted using peak fit software.
2.4. Electrochemical studies
A three-electrode cell configuration was employed to carry out the electrochemical investigations, where a glassy carbon electrode (GCE) was employed as the working electrode. The counter electrode was made of Pt wire, while the reference electrode consisted of Ag/AgCl (3 M KCl). The GCE electrode was subjected to cleaning using alumina powder followed by sonication for 15 min. Subsequently, a stock solution of 1 mg mL−1 PDA-FeTiO3 solution was prepared in ethanol. Approximately 10 μL of this solution was then dropcasted onto the pre-cleaned GCE surface using the drop-casting method followed by drying.40 The PDA-FeTiO3 modified GCE constitutes the working electrode. Cyclic voltammetry (CV) was performed on PDA-FeTiO3/GCE within a potential range of −0.2 V to +0.8 V using a solution containing 0.1 mM DA and 0.1 M PBS. Detection was similarly performed using DPV within the potential range of −0.2 V to +0.5 V, using a 0.1 M PBS solution. Stock solutions with a concentration of 5 mM of DA and UA were prepared. Electrochemical impedance spectroscopy (EIS) studies were studied in a solution containing 5 mM K4[Fe(CN)6] and 0.1 M PBS at open circuit voltage (OCV) in the frequency range of 106 Hz to 0.01 Hz.
2.5. Analysis of serum sample
The serum samples were prepared by adding 100 μL of serum in 0.1 M PBS. A serum sample was collected from healthy student volunteers with informed consent from student volunteers and PSG Institute of Medical Science and Research (IMSR) Hospital. A range of DA and UA concentrations were introduced by using the standard addition method. The amount of each DA and UA was calculated from the resultant peak currents and compared with the previously constructed calibration curve.
3. Results
3.1. Characterization of PDA-FeTiO3
The formation of polydopamine (PDA) from dopamine is an auto-oxidation process and occurs without the addition of any oxidizing agents. However, the mechanism of formation is still under debate as the process depends on various parameters such as pH, temperature, amount of DA, etc. As a result, several mechanisms are being proposed, but the consensus is the formation of dopamine quinone from dopamine via the formation of intermediates such as 5,6-dihydroxy indole.41 Herein, for the preparation PDA-FeTiO3, the priorly synthesized FeTiO3 powders were added to the solution containing dopamine in Tris-buffer. Triggered by auto oxidation, dopamine polymerizes to PDA and is coated over the material through electrostatic attraction which can possibly occur between the functional groups of PDA and oxide ions of FeTiO3. The surface morphology of FeTiO3 and PDA-FeTiO3 were analysed using FESEM. Fig. 1(a–d) shows the FESEM images of FeTiO3 and PDA-FeTiO3 respectively. Fig. 1(a and b) shows the FESEM image of FeTiO3 obtained at different magnifications, which indicates the presence of nano hexagons stacked over each other. Fig. 1(c and d) show the FESEM images of PDA-FeTiO3. It is observed that no significant change in the morphology has occurred because of due to the functionalization, however, a coating over the nanohexagons was observed. Elemental mapping of the FESEM images revealed the presence of O, Ti, Fe, N, and C in the nanocomposite. Fig. 2a shows the elemental mapping of PDA-FeTiO3, and Fig. 2(b–f) shows the presence of individual elements Fe, Ti, O, C, and N in their respective colours. Further, Fig. 3 illustrates the TEM images of PDA-FeTiO3 taken at various magnifications. Perfect hexagon structure was observed for FeTiO3 (Fig. 3(a and b)). A thin coating of PDA was observed over the nano hexagons, as shown in Fig. 3(c and d) respectively. Also, the selected area electron diffraction (SAED) pattern indicates the crystalline nature of FeTiO3 as given in Fig. 3e. The pattern confirms the crystalline characteristic of the polymer nanocomposite and the EDX spectrum shown in Fig. 3f shows the presence of constituent elements in the composite.
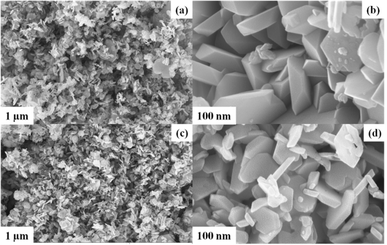 |
| | Fig. 1 Represents FESEM images of FeTiO3 recorded at different magnifications (a and b) and FESEM images of PDA-FeTiO3 captured at various magnifications (c and d). | |
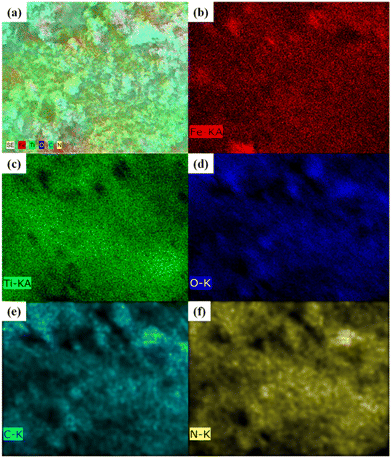 |
| | Fig. 2 (a) Elemental map showing the distribution of different elements in PDA-FeTiO3 nanocomposite; (b–f) elemental maps showing individual elements Fe, Ti, N, C and O, respectively. | |
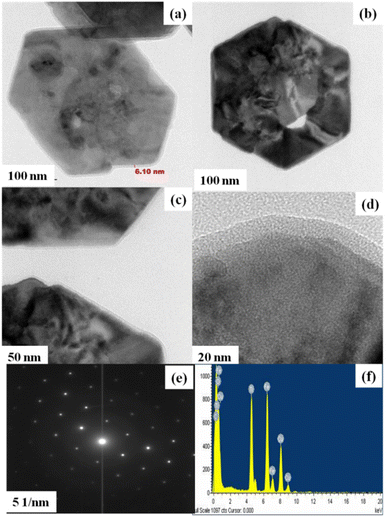 |
| | Fig. 3 Displays TEM micrographs of PDA-FeTiO3 at various magnifications (a–d). The associated SAED pattern (e), and the energy-dispersive X-ray spectroscopy (EDX) image (f). | |
Fig. 4a shows the XRD patterns of FeTiO3 and PDA-FeTiO3 nanostructures. The diffraction peak of FeTiO3 corresponds to the ilmenite structure and is in accordance with JCPDS reference no. 29-0733. The peaks at 23.8°, 32.7°, 35.4°, 40.5°, 49.1°, 53.4°, 62.0°, and 63.9° are indexed to (012), (104), (110), (113), (024), (116), (214) and (300) planes respectively. Further the PDA-FeTiO3 showed an additional broad peak around 15.0° corresponding to the amorphous PDA layer. The results were consistent with the earlier reports in the literature.42 The FTIR spectrum for FeTiO3 and PDA-FeTiO3 is shown in Fig. 4b. For FeTiO3, peaks at 3362 cm−1 and 2899 cm−1 correspond to the stretching vibrations of –OH and C–H groups, respectively. The O–C![[double bond, length as m-dash]](https://www.rsc.org/images/entities/char_e001.gif) O bond's asymmetrical and symmetrical stretching vibrations are represented by the peaks seen at 1542 cm−1 and 1357 cm−1, respectively. At 554 cm−1, the peak was attributed to Fe–O stretching vibration. The FTIR spectrum of PDA-FeTiO3 shows similar peaks at 3331 cm−1 and 2869 cm−1, which corresponds to stretching vibrations of –OH and C–H respectively. However, the –OH peak is comparatively broad, which might be linked to the stretching vibration of –NH groups from the PDA layer. These results confirm the PDA coating over the FeTiO3 nanostructure.
O bond's asymmetrical and symmetrical stretching vibrations are represented by the peaks seen at 1542 cm−1 and 1357 cm−1, respectively. At 554 cm−1, the peak was attributed to Fe–O stretching vibration. The FTIR spectrum of PDA-FeTiO3 shows similar peaks at 3331 cm−1 and 2869 cm−1, which corresponds to stretching vibrations of –OH and C–H respectively. However, the –OH peak is comparatively broad, which might be linked to the stretching vibration of –NH groups from the PDA layer. These results confirm the PDA coating over the FeTiO3 nanostructure.
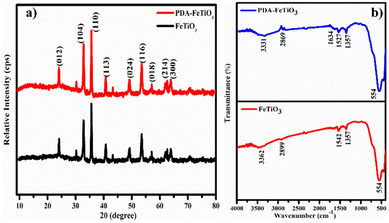 |
| | Fig. 4 (a and b) XRD pattern and FTIR spectrum of FeTiO3 and PDA-FeTiO3 nanocomposite, respectively. | |
The XPS spectrum of the PDA-FeTiO3 nanostructure is shown in Fig. 5. Fig. 5a shows the survey spectrum wherein the presence of all elements such as Fe 2p, Ti 2p, O 1s, C 1s, and N 1s were inferred. Fig. 5b shows the XPS peaks of Fe2+ wherein two major peaks were noticed at 724.54 eV and 710.57 eV, which corresponds to Fe 2p1/2 and Fe 2p3/2 states, respectively. In addition, a small hump at 712.81 eV showed the presence of Fe3+ ions. In the case of Ti, two deconvoluted peaks (Fig. 5c) at 463.99 eV and 458.21 eV, respectively, correspond to Ti 2p3/2 and Ti 2p1/2. The binding energy values indicate the presence of Ti3+ and Ti4+ states. The deconvoluted O 1s spectrum is shown in Fig. 5d. Two peaks at 529.91 eV and 531.79 eV correspond to lattice oxygen and adsorbed oxygen, respectively. Also, in the case of C 1s, peaks at 284.76 eV (C![[double bond, length as m-dash]](https://www.rsc.org/images/entities/char_e001.gif) C) and 286.12 eV (C
C) and 286.12 eV (C![[double bond, length as m-dash]](https://www.rsc.org/images/entities/char_e001.gif) O) were noted (Fig. 5e). The presence of N 1s was confirmed from the peak obtained at 399.94 eV (Fig. 5f).
O) were noted (Fig. 5e). The presence of N 1s was confirmed from the peak obtained at 399.94 eV (Fig. 5f).
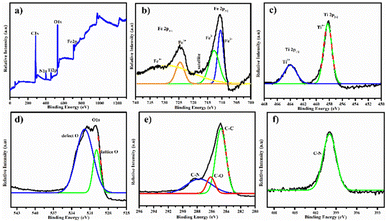 |
| | Fig. 5 Illustrates the XPS spectrum of PDA-FeTiO3, including (a) survey spectrum and detailed spectra for (b) Fe 2p, (c) Ti 2P, (d) O 1s, (e) C 1s and (f) N 1s, respectively. | |
The FeTiO3-PDA modified GCE was characterized using EIS. Nyquist plots for both electrodes were recorded at their OCV within the frequency range of 106 Hz to 1 Hz, as illustrated in Fig. 6. The Nyquist graph displays a semicircle, in the high frequency region and avertical spike in the low frequency region, which is associated with the Warburg diffusion. The diameter of the semicircle corresponds to the charge transfer resistance (Rct). The Rct values of 7105.00 Ω for FeTiO3/GCE and 23![[thin space (1/6-em)]](https://www.rsc.org/images/entities/char_2009.gif) 089.00 Ω for PDA-FeTiO3/GCE was noted. The high Rct value of PDA-FeTiO3 may be possibly due to the polymer coating over the FeTiO3 nanohexagons. The equivalent circuit that corresponds to the Nyquist plot is shown in the inset of Fig. 6.
089.00 Ω for PDA-FeTiO3/GCE was noted. The high Rct value of PDA-FeTiO3 may be possibly due to the polymer coating over the FeTiO3 nanohexagons. The equivalent circuit that corresponds to the Nyquist plot is shown in the inset of Fig. 6.
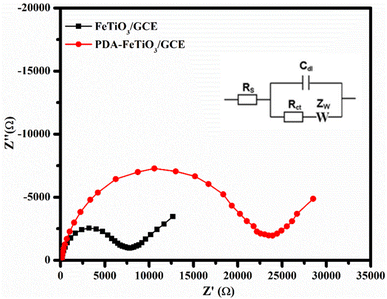 |
| | Fig. 6 Shows the Nyquist plot for FeTiO3/GCE and PDA-FeTiO3/GCE. The data was collected from a solution consisting of 0.1 M PBS and 5 mM K4[Fe(CN)6]. The frequency range used was from 105 Hz to 0.01 Hz. | |
3.2. Electrocatalytic activity of PDA-FeTiO3/GCE
To demonstrate the electrocatalytic activity of PDA-FeTiO3/GCE compared to FeTiO3/GCE, CV curves were recorded in the potential range of −0.2 V to +0.8 V. Fig. 7 shows the CV curves for PDA-FeTiO3/GCE and FeTiO3/GCE at a scan rate of 100 mV s−1 in an electrolyte solution containing 0.1 mM DA and 0.1 M PBS. The CV response of the modified electrode without the addition of DA is also shown in Fig. 7. No significant peak response was observed. FeTiO3/GCE showed an oxidation current of 2.80 μA and a reduction current of 0.95 μA, whereas the PDA-FeTiO3/GCE exhibited an oxidation current of 3.80 μA and a reduction current of 2.43 μA. The peak currents were comparatively higher for PDA-FeTiO3/GCE compared to FeTiO3/GCE. Also, the peaks are well-defined in the case of the electrode modified with PDA-FeTiO3. Although PDA-FeTiO3 nanocomposite showed high Rct compared to FeTiO3, they exhibited good catalytic performance, which corresponds to their high surface area, presence of functional groups on PDA, and easy ion accessibility of the composite. The increased functionality of the system is due to the functional groups that facilitate DA adsorption on the electrode surface and the transition elements with variable oxidation states that promote facile electron transfer.
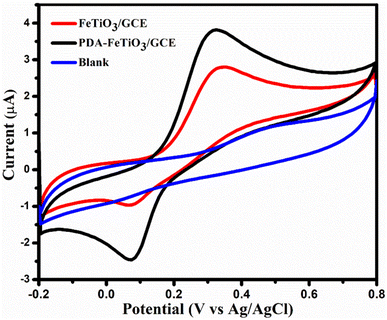 |
| | Fig. 7 Depicts the cyclic voltammogram, which demonstrates the effect of dopamine on FeTiO3/GCE and PDA-FeTiO3/GCE. The image was acquired at a scan rate of 100 mV s−1 from a solution consisting of 0.1 M PBS and 0.1 mM DA. The CV response of PDA-FeTiO3/GCE without addition of DA (blank) is shown in blue colour. | |
Further, the effect of scan rate was studied on PDA-FeTiO3/GCE as shown in Fig. 8a. The CV profile were recorded at scan rates ranging from 100 mV s−1 to 1000 mV s−1 in 0.1 mM DA and 0.1 M PBS. The redox couple of DA showed an increase in peak current with an increase in scan rate, and a linear calibration plot between peak current and scan rate was shown in Fig. 8b. This suggests that the oxidation of DA is monitored by adsorption and the resulting linear regression equation is as follows
| | |
Ipa = 0.002ν (mV s−1) + 3.56 (R2 = 0.9839)
| (1) |
| | |
Ipc = −0.004ν (mV s−1) + 2.33 (R2 = 0.9881)
| (2) |
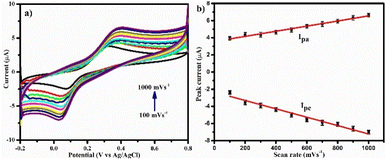 |
| | Fig. 8 (a) Illustrated the cyclic voltammetry response of PDA-FeTiO3/GCE for 0.1 mM DA at various scan rates, while the image presented in (b) represented the calibration graph. | |
The number of electrons transferred (n) during the reaction was determined using Laviron's equation,43,44 resulting in an estimated value of 1.62. The n value approximately equals 2, which indicates that the oxidation of dopamine involves two electron transfer process. The equation used is given below.
In this context,
Ip signifies the anodic peak current (A),
Q corresponding to oxidation (C),
ν denotes the scan rate,
R denotes the gas constant (8.314 J K
−1 mol
−1), and
T is the temperature (K).
3.3. pH study
Typically, the pH of the electrolyte, is a key factor in the oxidation of DA. To evaluate this, CV studies were carried out for the oxidation of DA at different pH ranging from 3 to 11 on PDA-FeTiO3/GCE. Fig. 9a shows the CV response at a pH of 3–11. The oxidation peak potential shifts negatively as the pH increses. Fig. 9b shows the variation of peak current with anodic peak potential (Epa) and anodic peak current (Ipa). It is seen that the high oxidation current is achieved at a pH 7, and the linear regression equation was given as| | |
EPa (V) = 0.796 − 0.052pH (R2 = 0.8270)
| (4) |
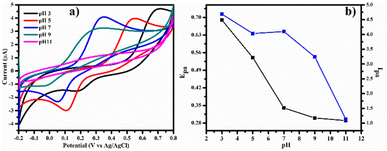 |
| | Fig. 9 Illustrates (a) cyclic voltammetry curves for 0.1 mM dopamine on PDA-FeTiO3/GCE with a pH range of 3 to 11, obtained from a 0.1 M PBS solution and (b) the corresponding variation of peak potential (Epa) and peak current (Ipa) with respect to pH. | |
The slope of the graph was found to be 52 mV per pH, which is close to the theoretical value of 59 mV per pH. This suggests the oxidation of DA is a two-proton coupled two-electron process.
3.4. Sensing of DA and UA
DPV is a sensitive electrochemical technique employed for the detection of DA. The DPV curves were recorded on PDA-FeTiO3/GCE for numerous dosage of DA ranging within 50 μM to 250 μM as shown in Fig. 10a, and their calibration plot is given in Fig. 10b. A linear plot for peak current vs. their corresponding concentration was obtained. The peak currents increased linearly with the concentration of DA. Similarly, the detection of UA was also performed on PDA-FeTiO3/GCE at different concentrations, as shown in Fig. 10(c and d) displays the linear calibration plot with the corresponding linear regression equations:| | |
Ipa = 0.003(CDA) + 0.18 (R2 = 0.9841)
| (5) |
| | |
Ipa = 0.002(CUA) + 0.21 (R2 = 0.9978)
| (6) |
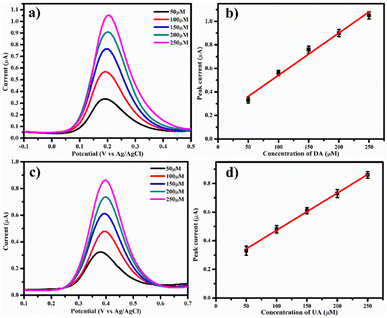 |
| | Fig. 10 Presents the differential pulse voltammetry (DPV) curves for (a) dopamine (50 μM to 250 μM) and (c) uric acid (50 μM to 250 μM) on PDA-FeTiO3/GCE from a solution of 0.1 M PBS, with (b) and (d) displaying the associated calibration plot, respectively. | |
From the DPV curves, the limit of detection (LOD) and linear concentration ranges were calculated. LOD of 0.30 μM and 4.61 μM were obtained for DA and UA, respectively, and the linear ranges from 50 μM to 250 μM for both DA and UA were estimated. The sensitivity was determined by measuring the slope of the calibration plot and was found to be 0.051 μA μM−1 cm−2 for DA and 0.037 μA μM−1 cm−2 for UA respectively. A comparison of the performance of the proposed sensor with different polymer-based DA biosensors is given in Table 1. It was found that the sensor performance showed excellent efficiency compared to other modified electrodes, such as LaFeO3![[thin space (1/6-em)]](https://www.rsc.org/images/entities/char_2009.gif) 46 and PTGCE.48
46 and PTGCE.48
Table 1 A comparative performance of various polymer and metal oxide based DA biosensorsa
| S. No |
Electrode |
Linear range (μM) |
Limit of detection (μM) |
Peak separation (DA-UA) (mv) |
Ref. |
| rGO-reduced graphene oxide, PTGCE-, PANI-polyaniline, Pdop-polydopamine, GR-graphene MWCNT-multiwalled carbon nanotube. |
| 1 |
PANI/Fe2O3–SnO2/rGO |
0.1–20 |
0.15 |
180 |
45 |
| 2 |
LaMnO3 |
5–50 |
6.22 |
162 |
28 |
| 3 |
LaFeO3 |
10–100 |
0.01 |
130 |
46 |
| 4 |
NdFeO3 |
0.5–100, 150–400 |
0.27 |
150 |
47 |
| 5 |
PTGCE |
0.70–53.30 |
0.64 |
130 |
48 |
| 6 |
PDA@GR/MWCNTS |
7.0–297 |
1.0 |
150 |
49 |
| 7 |
GCE/Cu2+@PDA-MWCNTs |
4.0–125 |
0.45 |
— |
50 |
| 8 |
PDA-FeTiO3 |
50–250 |
0.30 |
263 |
This work |
3.5. Selective and simultaneous detection of DA and UA
As mentioned earlier, UA coexists with DA in biological fluids and also oxidizes at a potential similar to that of DA. Hence, the selectivity of PDA-FeTiO3/GCE was carried out in the presence of UA. Herein, the UA concentration was maintained at 50 μM, and while dosage of DA varies 100 μM to 500 μM. Fig. 11a shows the DPV curves recorded on PDA-FeTiO3/GCE, and the calibration plot between DA concentration and the peak current is shown in Fig. 11b. The DA and UA show well-defined peaks with a separation of 263 mV. Fig. 11c illustrates the DPV curves obtained using PDA-FeTiO3/GCE electrode for DA and UA concentrations ranging from 100 μM to 500 μM, with a fixed value of 50 μM. The presence of two distinct peaks for DA and UA indicates that the sensor selectively detects DA in the presence of UA. The corresponding calibration plot is depicted in Fig. 11d. The linear regression equations for DA and UA are| | |
Ipa = 0.002(CDA) + 0.277 (R2 = 0.9823)
| (7) |
| | |
Ipa = 0.002(CUA) + 0.203 (R2 = 0.9910)
| (8) |
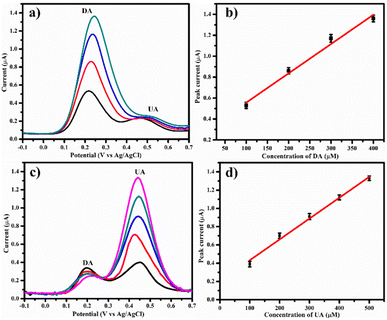 |
| | Fig. 11 (a) DPV responses on PDA-FeTiO3/GCE in 0.1 M PBS at different concentrations of (a) DA (100 μM to 500 μM), (c) UA (100 μM to 500 μM) and (b and d) their corresponding calibration curves. | |
To further demonstrate simultaneous detection, DA and UA were gradually introduced into 0.1 M PBS electrolyte at equal concentration. The DPV analysis was performed on PDA-FeTiO3/GCE to detect dopamine and uric acid. The concentrations were varied from 50 μM to 250 μM, as shown in Fig. 12a. Their calibration plots are given in Fig. 12(b and c), respectively with the linear regression equations as
| | |
Ipa = 0.003(CDA) + 0.23 (R2 = 0.9832)
| (9) |
| | |
Ipa = 0.003(CUA) + 0.06 (R2 = 0.9950)
| (10) |
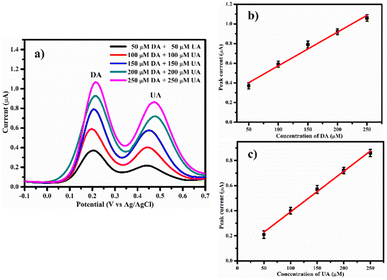 |
| | Fig. 12 Displays (a) the DPV response demonstrating the concurrent detection of dopamine and uric acid at varied concentrations on PDA-FeTiO3/GCE in 0.1 M PBS. The corresponding calibration for these substances is presented in (b) and (c). | |
A detailed interference study with several other interferents such as glucose, urea, KNO3, KCl, (NH4)2SO4, FeSO4, hydroxylamine, and CuCl2 was also studied using DPV on FeTiO3/GCE and PDA-FeTiO3/GCE, and a bar plot showing the peak currents of the interferents is given in Fig. 13. No significant change in the peak current of DA was observed in the presence of interfering agents. Also, the current response of DA in the presence of interfering agents is high for PDA-FeTiO3/GCE compared to bare FeTiO3/GCE. The stability of PDA-FeTiO3/GCE was assessed through successive measurements of the DA oxidation peak current in a solution of 0.1 mM DA. The sensor was stored in PBS buffer solution and tested for three weeks in an interval of two days. The sensor maintained 84% of its initial current after 3 weeks, which indicates good stability of the electrode.
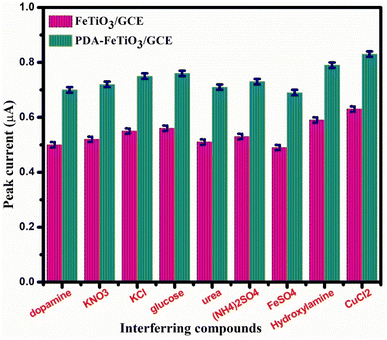 |
| | Fig. 13 Displays a bar plot that demonstrates the changes in peak current observed during dopamine detection in the presence of various interfering agents on FeTiO3/GCE and PDA-FeTiO3/GCE. | |
3.6. Real sample analysis
An investigation was conducted to estimate the levels of dopamine and uric acid in serum samples. The electrolyte solution consisted of 0.1 M PBS containing 100 μM serum. Determined doses of DA and UA were introduced into the electrolyte, and the resulting oxidation current obtained was compared with the calibration plot displayed in Fig. 10b. The following formula was utilized to calculate the recovery percentage.| | |
% of recovery = Cpredicted/Cadded × 100
| (11) |
The recovery values obtained were satisfactory, ranging from 80% to 91% for DA in serum samples with a very low standard deviation. The recovery values for DA and UA in the serum sample are provided in Table 2.
Table 2 Dopamine and uric acid estimation in human biological samples using PDA-FeTiO3/GCE
| |
Amount of DA added (μM) |
Amount of DA predicted (μM) |
% of recovery |
Amount of UA added (μM) |
Amount of UA predicted (μM) |
% of recovery |
| Serum |
80 |
64.38 |
80.47 ± 1 |
80 |
60.47 |
75.58 ± 2 |
| 160 |
145.74 |
91.08 ± 3 |
160 |
134 |
83.75 ± 1 |
| 240 |
214.77 |
89.48 ± 2 |
240 |
195.46 |
81.44 ± 1 |
4. Conclusions
The PDA-coated FeTiO3 nanohexagons were synthesized by a simple procedure and characterized, revealing their unique properties. The CV study revealed the a superior electro-oxidation activity of DA on the PDA-FeTiO3/GCE sensor. The detection of DA and UA was carried out using DPV which showed a low detection limit of 0.30 μM for DA, with no interference from UA, highlighting the sensor's excellent selectivity of the sensor towards DA. The stability test showed that the sensor retained 84% of its initial value, further confirming its reliability. Finally, the sensor was successfully validated in a biological human serum sample, underscoring its potential in terms of selectivity, sensitivity, and stability.
Data availability
No new data were referred or analysed as part of this manuscript.
Author contributions
TK Aparna – conceptualization, methodology, formal analysis, original draft preparation; Swathi Tharani .D – draft preparation, validation of result; R. Sivasubramanian – funding acquisition, writing – review and editing; Gul – review and editing, Mushtaq Ahmad Dar – funding acquisition, supervision, review and editing.
Conflicts of interest
There are no conflicts to declare.
Acknowledgements
This project was funded by Researchers Supporting Project number (RSPD2024R1045), King Saud University, Riyadh, Saudi Arabia. The authors also thank the financial support provided by the UGC DAE CSR (CRS/2023-24/1306) India.
References
- W. Dalley and J. P. Roiser, Neuroscience, 2012, 215, 42 CrossRef PubMed.
- J. J. Weinstein, M. O. Chohan, M. Slifstein, L. S. Kegeles, H. Moore and A. AbiDargham, Biol. Psychiatry, 2017, 81, 31 CrossRef CAS PubMed.
- Q. He, J. Liu, X. Liu, G. Li, D. Chen, P. Deng and J. Liang, Nanomater, 2018, 8, 194 CrossRef PubMed.
- B. Channer, S. M. Matt, E. A. Nickoloff-Bybel, V. Pappa, Y. Agarwal, J. Wickman and P. J. Gaskill, Pharmacol. Rev., 2023, 75, 62–158 CrossRef CAS PubMed.
- C. L. Guan, J. Ouyang, Q. L. Li, B. H. Liu and W. R. G. Baeyens, Talanta, 2000, 50, 1197 CrossRef CAS PubMed.
- J. Wang, H. Chen, F. Ru, Z. Zhang, X. Mao, D. Shan, J. Chen and X. Lu, Chem.–Eur. J., 2018, 24, 3499 CrossRef CAS PubMed.
- S. Zhang, D. Zhang, X. Zhang, D. Shang, Z. Xue, D. Shan and X. Lu, Anal. Chem., 2017, 89, 3538 CrossRef CAS PubMed.
- E. Peltola, S. Sainio, K. B. Holt, T. Palomäki, J. Koskinen and T. Laurila, Anal. Chem., 2018, 90, 1408 CrossRef CAS PubMed.
- C. Xue, Q. Han, Y. Wang, J. Wu, T. Wen, R. Wang, J. Hong, X. Zhou and H. Jiang, Biosens. Bioelectron., 2013, 49, 199 CrossRef CAS PubMed.
- T. K. Aparna, R. Sivasubramanian and M. A. Dar, J. Alloys Compd., 2018, 741, 1130 CrossRef CAS.
- D. S. Tharani and R. Sivasubramanian, J. Chem. Sci., 2023, 135, 93 CrossRef CAS.
- R. Suresh, K. Giribabu, R. Manigandan, S. P. Kumar, S. Munusamy, S. Muthamizh and V. Narayanan, Synth. Met., 2014, 196, 151 CrossRef CAS.
- V. N. Palakollu and R. Karpoormath, Synth. Met., 2018, 245, 87 CrossRef CAS.
- G. Jiang, T. Jiang, H. Zhou, J. Yao and X. Kong, RSC Adv., 2015, 5, 9064 RSC.
- J. Salamon, Y. Sathishkumar, K. Ramachandran, Y. S. Lee, D. J. Yoo and A. R. Kim, Biosens. Bioelectron., 2015, 64, 269 CrossRef CAS PubMed.
- C. Li, K. C. K. Soh and P. Wu, J. Alloys Compd., 2004, 372, 40 CrossRef CAS.
- D. U. Lee, H. W. Park, M. G. Park, V. Ismayilov and Z. Chen, ACS Appl. Mater. Interfaces, 2015, 7, 902 CrossRef CAS PubMed.
- S. A. Bretschneider, J. Weickert, J. A. Dorman and L. Schmidt-Mende, APL Mater., 2014, 2, 040701 CrossRef.
- N. Bonanos, K. S. Knight and B. Ellis, Solid State Ionics, 1995, 79, 161 CrossRef CAS.
- F. F. Jia, H. Zhong, W. G. Zhang, X. R. Li, G. Y. Wang, J. Song, Z. P. Cheng, J. Z. Yin and L. P. Guo, Sens. Actuators, B, 2015, 212, 174 CrossRef CAS.
- Z. Zhang, S. Gu, Y. Ding and J. Jin, Anal. Chim. Acta, 2012, 745, 112 CrossRef CAS PubMed.
- Z. Zhang, S. Gu, Y. Ding, F. Zhang and J. Jin, Microchim. Acta, 2013, 180, 1043–F CrossRef CAS.
- H. Ekram, A. Galal and N. F. Atta, J. Electroanal. Chem., 2015, 749, 42 CrossRef.
- B. Wang, S. Gu, Y. Ding, Y. Chu, Z. Zhang, X. Ba, Q. Zhang and X. Li, Analyst, 2013, 138, 362 RSC.
- P. M. Shafi, N. Joseph, R. Karthik, J. Shim, A. C. Bose and V. Ganesh, Microchem. J., 2021, 164, 105945 CrossRef CAS.
- S. Priyadharshini, A. Tamilselvan, C. Vishwanathan and N. Ponpandian, J. Electrochem. Soc., 2017, 164, B152 CrossRef.
- S. Priyadharshini, M. Divagar, C. Vishwanathan, D. Mangalaraj and N. Ponpandian, J. Electrochem. Soc., 2016, 163, B460 CrossRef.
- T. K. Aparna and R. Sivasubramanian, Mater. Chem. Phys., 2019, 233, 319–328 CrossRef CAS.
- R. Ramya, R. Sivasubramanian and M. V. Sangaranarayanan, Electrochim. Acta, 2013, 101, 109–129 CrossRef CAS.
- N. German, A. Ramanaviciene and A. Ramanavicius, Polymers, 2020, 12, 3026 CrossRef CAS PubMed.
- M. Alagappan, S. Immanuel, R. Sivasubramanian and A. Kandaswamy, Arabian J. Chem., 2020, 13, 2001–2010 CrossRef CAS.
- M. Martí, G. Fabregat, F. Estrany, C. Alemán and E. J. Armelin, Mater. Chem., 2010, 20, 10652 RSC.
- C. Vanitha, A. Sanmugam, A. Yogananth, M. Rajasekar, P. G. Kuppusamy and G. Devasaga-yam, Mater. Lett., 2022, 328, 133149 CrossRef CAS.
- S. Cogal, G. Celik Cogal and U. Oksuz, Chem. Pap., 2021, 75, 163–171 Search PubMed.
- A. Prabhu, R. D. Crapnell, K. Eersels, B. van Grinsven, A. K. Kunhiraman, P. Singla, J. McClements, C. E. Banks, K. Novakovic and M. Peeters, Curr. Opin. Electrochem., 2022, 1, 100885 CrossRef.
- J. Gao, H. Li, M. Li, G. Wang, Y. Long, P. Li, C. Li and B. Yang, Anal. Chim. Acta, 2021, 1145, 103–113 CrossRef CAS PubMed.
- C. Li, D. Han, Z. Wu, Z. Liang, F. Han, K. Chen, W. Fu, D. Han, Y. Wang and L. Niu, Analyst, 2022, 147, 3291 RSC.
- J. Y. Lee, T. L. Nguyen, J. H. Park and B. K. Kim, Sensors, 2016, 16, 647 CrossRef PubMed.
- R. Salgado, R. Del Rio, M. A. Del Valle and F. J. Armijo, Electroanal. Chem., 2013, 704, 130 CrossRef CAS.
- N. S. Anuar, W. J. Basirun and Md. Shalauddin, RSC Adv., 2020, 10, 17336 RSC.
- S. Gao, D. Zhang, M. Pedrero, Z. Guo, J. M. Pingarron, S. Campuzano and X. Zou, Coord. Chem. Rev., 2024, 501, 215564 CrossRef CAS.
- H. Yue, T. Du, Q. Wang, Z. Shi, H. Dong, Z. Cao, Y. Qiao, Y. Yin, R. Xing and S. Yang, ACS Omega, 2018, 3, 2699 CrossRef CAS PubMed.
- E. Laviron, J. Electroanal. Chem. Interfacial Electrochem., 1974, 52, 355 CrossRef CAS.
- E. Laviron, J. Electroanal. Chem. Interfacial Electrochem., 1979, 101, 19 CrossRef CAS.
- D. Minta, A. Moyseowicz, S. Gryglewicz and G. Gryglewicz, Molecules, 2020, 25, 5869 CrossRef CAS PubMed.
- T. Vijayaraghavan, R. Sivasubramanian, S. Hussain and A. Ashok, ChemistrySelect, 2017, 2, 5570–5577 CrossRef CAS.
- Z. Anajafi, M. Naseri, S. Marini, C. Espro, D. Iannazzo, S. G. Leonardi and G. Neri, Anal. Bioanal. Chem., 2019, 11, 7681–7688 CrossRef PubMed.
- S. E. Elugoke, O. E. Fayemi, A. S. Adekunle, F. A. Adesanya and E. E. Ebenso, ChemElectroChem, 2024, 11, 7 Search PubMed.
- C. Wang, J. Li, K. Shi, Q. Wang, X. Zhao, Z. Xiong, X. Zou and Y. Wang, J. Electroanal. Chem., 2016, 770, 56 CrossRef CAS.
- M. Shahbakhsh and M. Noroozifar, J. Solid State Electrochem., 2018, 22, 3049 CrossRef CAS.
|
| This journal is © The Royal Society of Chemistry 2024 |
Click here to see how this site uses Cookies. View our privacy policy here.  Open Access Article
 *e
*e


![[double bond, length as m-dash]](https://www.rsc.org/images/entities/char_e001.gif) O bond's asymmetrical and symmetrical stretching vibrations are represented by the peaks seen at 1542 cm−1 and 1357 cm−1, respectively. At 554 cm−1, the peak was attributed to Fe–O stretching vibration. The FTIR spectrum of PDA-FeTiO3 shows similar peaks at 3331 cm−1 and 2869 cm−1, which corresponds to stretching vibrations of –OH and C–H respectively. However, the –OH peak is comparatively broad, which might be linked to the stretching vibration of –NH groups from the PDA layer. These results confirm the PDA coating over the FeTiO3 nanostructure.
O bond's asymmetrical and symmetrical stretching vibrations are represented by the peaks seen at 1542 cm−1 and 1357 cm−1, respectively. At 554 cm−1, the peak was attributed to Fe–O stretching vibration. The FTIR spectrum of PDA-FeTiO3 shows similar peaks at 3331 cm−1 and 2869 cm−1, which corresponds to stretching vibrations of –OH and C–H respectively. However, the –OH peak is comparatively broad, which might be linked to the stretching vibration of –NH groups from the PDA layer. These results confirm the PDA coating over the FeTiO3 nanostructure.
![[double bond, length as m-dash]](https://www.rsc.org/images/entities/char_e001.gif) C) and 286.12 eV (C
C) and 286.12 eV (C![[double bond, length as m-dash]](https://www.rsc.org/images/entities/char_e001.gif) O) were noted (Fig. 5e). The presence of N 1s was confirmed from the peak obtained at 399.94 eV (Fig. 5f).
O) were noted (Fig. 5e). The presence of N 1s was confirmed from the peak obtained at 399.94 eV (Fig. 5f).
![[thin space (1/6-em)]](https://www.rsc.org/images/entities/char_2009.gif) 089.00 Ω for PDA-FeTiO3/GCE was noted. The high Rct value of PDA-FeTiO3 may be possibly due to the polymer coating over the FeTiO3 nanohexagons. The equivalent circuit that corresponds to the Nyquist plot is shown in the inset of Fig. 6.
089.00 Ω for PDA-FeTiO3/GCE was noted. The high Rct value of PDA-FeTiO3 may be possibly due to the polymer coating over the FeTiO3 nanohexagons. The equivalent circuit that corresponds to the Nyquist plot is shown in the inset of Fig. 6.
![[thin space (1/6-em)]](https://www.rsc.org/images/entities/char_2009.gif) 46 and PTGCE.48
46 and PTGCE.48


