 Open Access Article
Oyster shell powder-loaded cellulose gel beads as a high-efficiency adsorbent for phosphorus recovery: preparation, kinetics, isotherms and thermodynamic studies†
Pingguo Wu ,
Jiyan Zhong,
Naisi Liang,
Chanyan Li,
Qingyue Cao,
Mingjuan Zhao,
Yong Li,
Mingneng Liao* and
Chuanming Yu
 *
*
Faculty of Chemistry and Environmental Science, Guangdong Ocean University, Zhanjiang, 524088, P. R. China. E-mail: liaomn@gdou.edu.cn; yucm@gdou.edu.cn
First published on 29th August 2024
Abstract
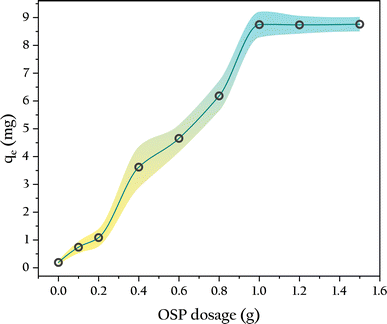
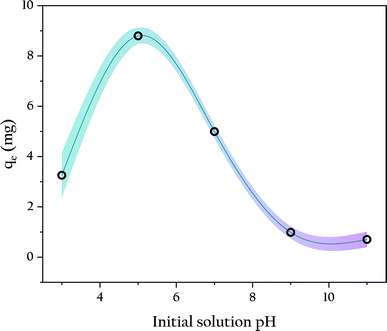
Given the critical importance, resource limination and environmental toxicity of phosphorus, the study of phosphorus recovery and utilization is extremely urgent. This paper utilized unmodified oyster shell powder (OSP) and cotton fibers as raw materials to prepare OSP-loaded cellulose gel beads (OSP@Gel) through the fiber-dissolving capability of LiBr·3H2O molten salt, for phosphate recovery from water. The surface microstructure and chemical properties of OSP@Gel were characterized by using Fourier transform infrared spectroscopy (FT-IR), scanning electron microscopy (SEM) and X-ray photoelectron spectroscopy (XPS), confirming the loading of OSP onto the gel matrix. The phosphorus adsorption capacity of a single OSP@Gel bead could reach up to 8.80 ± 0.32 mg at the optimal OSP doping amount of 1.0 g and optimal pH of 5.0. Kinetic and isotherm analyses revealed that the experimental data fit the PSO model and the Langmuir model. Thermodynamic analysis suggested that the phosphate adsorption was endothermic. Combined results from SEM and XPS analyses indicated that the adsorption of phosphate by OSP@Gel was chemical, with adsorption rate controlled by both liquid film diffusion and intraparticle diffusion. The high phosphate adsorption capacity, good mechanical stability in water, and easy degradability in plant soil provide OSP@Gel beads with great potential for phosphate recovery.
1. Introduction
Phosphorus stands as the fundamental constituent of all life forms, and is also one of the three principal elements in fertilizers alongside nitrogen and potassium. Presently, phosphorus in industrial fertilizers is primarily derived from phosphate ores. Economic reserves of phosphate rock may deplete within the next 50 to 100 years,1 with a handful of countries such as Morocco, China, and the USA controlling a significant portion of these reserves.2 However, Morocco almost monopolizes phosphate reserves, and political instability in the region may impinge upon the international trade of phosphorus, potentially adversely affecting food production in importing nations. Conversely, phosphorus also constitutes a pollutant in waterways, triggering rampant algal proliferation and substantial depletion of dissolved oxygen, thereby inducing degradation of aquatic ecosystems.3,4Presently, wastewater treatment facilities predominantly rely on extensive usage of aluminum, calcium, and iron salts to mitigate this eutrophication, albeit at the cost of heightened sludge generation.5 These dual driving forces, scarcity and pollution of phosphorus, underscore the imperative for innovating novel phosphorus recovery methodologies. Phosphorus recovery has emerged as a potential solution to meet the burgeoning global demand for phosphorus while curbing its dispersion, which otherwise exacerbates eutrophication. Several phosphorus removal/recovery techniques have been assessed, including crystallization, ion exchange, precipitation, adsorption, and biological phosphorus removal.6–8
The chemical precipitation method proves to be an efficacious approach, yet its high cost stems from the consumption of chemical substances. Moreover, this method yields copious amounts of sludge, containing pathogens, heavy metals, and micropollutants, thereby engendering novel environmental challenges in sludge management.9 Biochemical methods employing microorganisms for liquid phosphorus removal offer a comparatively lower operational cost and obviate the need for chemicals,10 but requiring precise control over microbial growth conditions and exhibiting lengthier processing times. Utilizing hydroxyapatite (Ca5(PO4)3OH) and struvite (MgNH4PO4) for crystallization presents numerous advantages over chemical precipitation, including reduced overall costs and diminished sludge production.11,12 Both hydroxyapatite and struvite serve as slow-release fertilizers, representing potential alternatives to industrial fertilizers derived from phosphate ores. Furthermore, their low solubility in water contributes to better and more efficient phosphorus utilization, mitigating eutrophication in receiving water.13 The utilization of metal salt-modified biochar for phosphate adsorption stands as a current focal point in phosphorus recovery research.14,15 The porous structure of biochar serves as a carrier for phosphorus,16 while also acting as a soil conditioner to enhance water retention and carbon sequestration capabilities, simultaneously fostering plant growth.17,18 However, the primary challenge faced by biochar-based phosphorus recovery materials today lies in the efficient separation from wastewater, thus directly impeding their practical application.
Since 1950, global oyster production has been rapidly increasing. Presently, oyster farming is predominantly led by China, with Chinese oyster production accounting for 86% of the global output by weight.19 Every year, shellfish farming generates millions of tons of shellfish waste, much of which is handled in landfills.20 This disposal method not only squanders resources but also exacerbates coastal environmental burdens. An ideal solution involves transforming discarded oyster shells (OS) into beneficial and economically viable products. Hyok-Bo Kwon et al. have developed a method to convert discarded oyster shells into materials capable of removing phosphates from wastewater through thermal treatment, achieving a phosphorus removal rate of up to 98%.21 Currently, calcium phosphate crystallization is regareded as a promising method for phosphorus recovery, as calcium phosphate is an effective component of phosphate rock.22
Currently, research on the adsorption of phosphorus from water by oyster shell powder (OSP) has reached a mature stage. However, there are still significant limitations to its application. The primary reason is that OSP has a small particle size, which can easily lead to filter clogging, making its recovery challenging. According to reported literatures, modifications of OSP could be categorized into three main types: thermal modification, metal compound modification, and clay modification.23 Thermal and metal compound modifications do not completely address the filter clogging issue caused by the small particle size. Materials made from clay typically exhibit good mechanical properties, but clay's adsorption performance is relatively poor.24 Hence, there is an urgent need for a carrier with excellent performance to make OSP an easily recoverable phosphorus removal material.
Several studies have attempted to immobilise these adsorbent materials on polymeric carriers such as polyvinyl alcohol (PVA).25 However, PVA is a synthetic polymer, which is not environmentally friendly. Opting for a naturally occurring polymer could be a more environmentally friendly option. Recently, a starch-based cryogel composite incorporating calcium silicate hydrate (CSH) was created, showcasing notable efficiency in phosphate removal.26 However, it's worth noting that the resulting material still relies on synthesized CSH. Therefore, utilizing natural polymers such as chitosan,27 starch,28 and cellulose29–31 as carriers to construct adsorptive materials is an environmentally friendly and ideal choice. We have observed that A. Choodum et al. created a starch-based monolithic cryogel on which calcium-rich calcined oyster shell is immobilized, resulting in a green tablet (Cry-Ca-COS) capable of efficiently recovering phosphate from water.28 However, we have yet to find any studies using cellulose as a carrier to load oyster shell powder for use as a phosphorus adsorbent material.
In this paper, OSP was directly added to a cellulose-LiBr·3H2O solutions at 150 °C without any chemical modification. After uniform dispersion, the mixture was cooled and cross-linked to produce gel beads. The obtained gel beads were characterized through specific apparatus. The phosphate adsorption experiments were operated to acquire the influence of contact time, phosphorate concentration, solution pH, OSP dosages and the competition of other anions on phosphorus adsorption efficacy. Kinetic, isotherm, and thermodynamic analyses were carried out to elucidate the potential mechanisms for phosphorate adsorption onto OSP@Gel bead. The stability of OSP@Gel bead in water and soil was explored to prove their significance for agricultural usage. And finally, more applications of the gel beads were discussed through structural design.
2. Experimental
2.1 Materials
The oyster shells were harvested from the beach of Techeng Island in Zhanjiang, Guangdong. Lithium bromide, ascorbic acid, ammonium molybdate tetrahydrate, potassium antimony tartrate, potassium dihydrogen phosphate were purchased from Macklin Inc. All the reagents were of analytical grade and directly used without prior treatment. Distilled water was obtained by using a commercial water purification system.2.2 Preparation of OSP
The collected oyster shells have been naturally washed by seawater, appearing clean and free from impurities, exhibiting a white color. These oyster shells required no further extensive treatment and were directly fed into a grinder for pulverization. After passing through a 100-mesh sieve, experimental-grade OSP was obtained.2.3 Preparation of OSP@Gel
In a 100 mL beaker containing 40 mL of water, 60 g of LiBr was added and dissolved. Then, the beaker was placed in a 150 °C oil bath and 0.5 g of defatted cotton fiber was added into the beaker. Stirring was continued until the cotton fiber was completely dissolved, after which a certain quality of OSP was added, and stirred until a viscous gel-like substance was formed. The gel-like substance was rapidly injected into spherical silicone molds by using a syringe and allowed to cool for 12 hours until fully solidified. The solidified material was then removed and immersed in deionized water, with the water being changed every 4 to 8 hours. Silver nitrate solution was added dropwise to the discarded water until no precipitation occurred, the OSP-doped hydrogel was generated and denoted as OSPx@Gel, where x represents the mass of added OSP in grams.2.4 Characterization
Microstructure of OSP and OSP@Gel beads was explored by field emission scanning electron microscope (FESEM, JEOL JEM-7500F) under 5 kV acceleration voltage, the gel bead was cut into cut into pieces, then freeze-dried, and sputter-coated with gold powders before the test. To investigate the chemical structure of the OSP and OSP@Gel beads, Fourier transform infrared spectroscopy (FTIR) with a ranging from 500 cm−1 to 4000 cm−1 was obtained by Thermo Fisher Nicolet 460 spectrometer. The zeta potential of OSP was measured by a Zeta Phase Analysis Light Scattering (NanoBrook ZetaPALS, Brookhaven Instruments Corporation, USA). The thermal stability of OSP was measured by thermogravimetric analyzer (TG, NETZSCH STA449F3) with the temperature ranging from 30 °C to 800 °C at the rate of 10 °C min−1 in air. X-ray photoelectron spectroscopy (XPS) of freeze-dried gel beads on copper tape was conducted with Escalab 250Xi (Thermo Fisher, USA) using Al Kα irradiation. The binding energies were calibrated at C 1s 284.8 eV.2.5 Selection of OSP@Gel with highest efficiency in phosphate adsorption
The obtained OSPx@Gel samples were detected for P removal in a bath adsorption experience to access the effect of OSP dosage. Three specimens of OSPx@Gel (x = 0, 0.1, 0.2, 0.4, 0.6, 0.8, 1.0, 1.2, 1.5) were placed in 150 mL conical flasks. To each flask, 50 mL of 400 mg L−1 phosphorus solution was added. The flasks were securely capped and placed in a 100 rpm shaking incubator under for 48 hours under 25 °C. After filtration through a hydrophilic filter membrane, the phosphorus concentrations were tested. Three parallel sets were conducted, and the material with the highest phosphate adsorption capacity was selected for characterization and subsequent adsorption studies.2.6 Phosphate adsorption experiments
Phosphorus solutions with different concentrations were prepared by using KH2PO4 solution with a certain concentration of 1.000 g L−1 (calculated in terms of elemental P). All adsorption experiments were conducted in conical flasks, performed in triplicate, and the average values were calculated. Impurities were separated by using 0.45 µm aqueous filtration membranes, and the phosphorus concentration in the filtrate was determined by the molybdenum blue spectrophotometric method32 with a UV-visible spectrophotometer (V-1000D).The adsorption capacity and removal efficiency were calculated according to eqn (1) and (2) respectively:
 | (1) |
 | (2) |
To elucidate the experimental kinetics data and gain deeper insights into the reaction pathway, Pseudo-first order (PFO), Pseudo-second order (PSO), Elovich, intra-particle diffusion (IPD), and Boyd models were applied to explicate the results.
| qt = qe(1 − e−ktt) | (3) |
 | (4) |
 | (5) |
| qt = kit0.5 + Ci | (6) |
 | (7) |
 | (8) |
 | (9) |
| qe = qmexp(−KDRε2) | (10) |
 | (11) |
 | (12) |
 | (13) |
ΔG = −RT![[thin space (1/6-em)]](https://www.rsc.org/images/entities/char_2009.gif) ln ln![[thin space (1/6-em)]](https://www.rsc.org/images/entities/char_2009.gif) Kd Kd
| (14) |
 | (15) |
2.7 Stability of OSP@Gel
To investigate the stability of the gel beads in water, eight similarly shaped gel beads were selected, wiped with filter paper to remove surface moisture, and then weighed. The gel beads were then placed in distilled water and stored in a sealed container. At regular intervals, the beads were taken out, dried with filter paper, and weighed again.To explore the stability of the gel beads in soil, six gel beads were buried 5 cm deep in the soil. Every two days, the beads were carefully retrieved, washed with running water to remove soil from the surface, dried with filter paper to remove surface moisture, and weighed until the gel beads completely degraded. Two types of soil were used: outdoor grassland and indoor soil without grass. The outdoor grassland was a landscaped lawn in the Guangdong Ocean University campus (pH: 6.7 ± 0.2, temperature: 18–35 °C). The indoor soil (pH: 6.8 ± 0.2, temperature: 16–22 °C) was obtained from the same landscaped lawn but underwent the following treatment: after removing the grass, the soil was spread flat on a concrete floor, dried, crushed, and sieved with an 40-mesh sieve to remove stones and plant debris. The treated soil was then collected into square plastic containers, with a small amount of water added to maintain a slightly moist state.
3. Results and discussion
3.1 Characterization of OSP
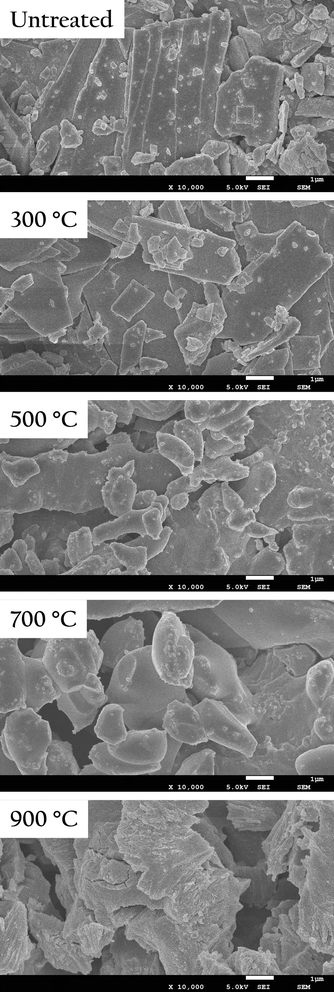
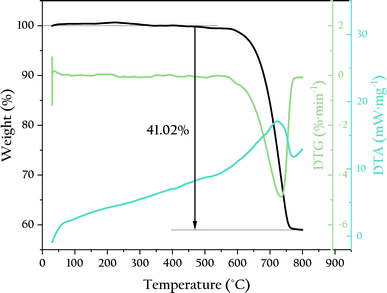
OS and OSP uesd in this work were displayed in Fig. S1.† To investigate the effect of different treatment temperatures on the properties of OSP, this experiment conducted thermal treatment of the powder in an air atmosphere for 2 hours at 300 °C, 500 °C, 700 °C, and 900 °C respectively. The microstructure of OSP was observed by using a scanning electron microscope, as shown in Fig. 1. Prior to thermal treatment, the OSP exhibited prismatic shapes of varying sizes, characteristic of the calcite structure of oyster shell. After thermal treatment at 300 °C, the powders maintained its original morphology. At 500 °C, the OSP began to agglomerate, with its shape transforming from prismatic to ellipsoidal. As the temperature increased to 700 °C, the agglomeration became more pronounced, with the ellipsoids growing larger and small particles merging into the surface of larger ones. At 900 °C, the OSP underwent severe decomposition, causing the aggregated ellipsoids to crack and form angular block-like structures.To verify the thermal stability of OSP, thermogravimetric analysis was used to test its thermal weight loss, as shown in Fig. 2. The OSP began to lose weight at 550 °C. The temperature at which the weight loss rate was the highest was 734 °C. The final weight loss was achieved at around 760 °C, with a equilibrium weight loss of 41.02%, which is very close to the mass fraction of CO2 in CaCO3 (43.07%). This indicates that the main component of OSP is CaCO3, and its thermal stability is comparable to that of CaCO3. Typically, oyster shells contain a small amount of organic matter, which decomposes significantly at 400 °C, causing weight loss. However, no such weight loss was observed in this experiment, indicating that the OSP used was very clean with minimal organic impurities. This cleanliness prevents the decline in adsorption capacity caused by organic matter, allowing the OSP to fully utilize its adsorption potential.
In the preliminary work, we attempted to investigate the effect of different thermal treatment temperatures on the phosphorus removal efficiency of OSP, as shown in Fig. S2.† Results indicated that OSP calcined at 1200 °C exhibited higher adsorption capacity and adsorption rate compared to non-thermally treated OSP. However, we ultimately use non-thermally treated OSP as the adsorbent to be loaded onto the gel because thermally treated OSP cannot be loaded onto the cellulose-based gel. The thermal-treated OSP was converted to CaO, which can be easily dissolved in the aqueous solution during the gelation process, to form the strong base Ca(OH)2, preventing the formation of gel bead. Therefore, we chose untreated OSP as the raw adsorbent. This choice not only facilitates the construction of a stable gel material but also avoids the additional energy consumption during material preparation.
When dispersed in deionized water, the zeta potential of OSP was measured to be +0.536 ± 0.015 mV. This positive charge is favorable for the adsorption of the anionic H2PO4−.
3.2 Preparation of OSP@Gel
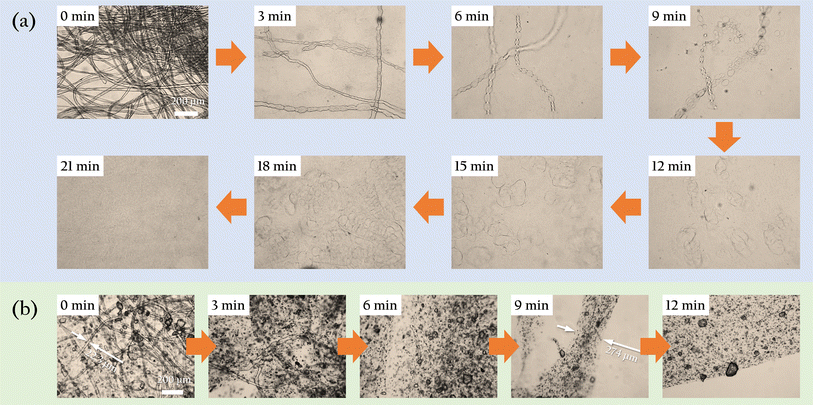
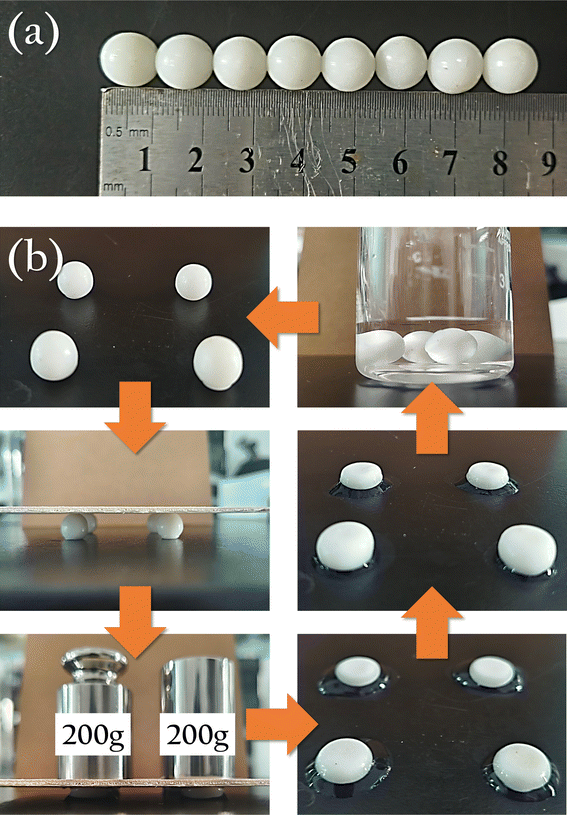
To investigate the morphological changes of degreased cotton fibers during the gelation process, we conducted observations based on the experiment in Section 2.3. Every 3 minutes, we extracted 200 µL of the sample and placed it on a glass slide for observation under an optical microscope. The results were shown in Fig. 3(a). Before adding to the hot LiBr solution, the fibers maintained an intact morphology with clear boundaries and uniform diameters. After 3 minutes, localized swelling was evident, and the fibers diameter became uneven. At 6 minutes, the swelling was more pronounced, and the fibers began to resemble a string of pearls. By 9 minutes, the “necklace” broke, dispersing these “pearls” into the solution. At 12 minutes, the swelling continued, with the “pearls” increasing in size and number in the solution. By the 18th minute, the swollen “pearls” became very soft, coalescing and allowing the polysaccharide molecules to interpenetrate, forming a uniform, viscous gel solution. Pouring this gel solution into molds and allowing it to cool resulted in gel beads that possessed both strength and flexibility, as shown in Fig. 4. The gel beads used in this work have a diameter of 1.0 ± 0.1 cm. Four gel beads can withstand the compression of a 400 g weight without breaking. Upon removing the weight and the wooden board, the gel beads were observed to flatten and release some water around them. After standing for 1 minute, the gel beads reabsorbed the surrounding water and expanded in volume. When directly immersed in water, the gel beads fully restored their original spherical shape within approximately 1 minute.To further investigate the dispersion process of oyster shell powder in the gel, we conducted an experiment where both OSP and degreased cotton fibers were added simultaneously, and their dispersion in the hot LiBr solution was observed, as shown in Fig. 3(b). As expected, the changes in the cotton fibers were similar to those in Fig. 3(a), but the gelation process was obviously faster. By 6 minutes, almost no intact fibers were observable. Only a few scattered fiber fragments could be found upon careful examination. By 9 minutes, these fiber fragments had also disappeared, with all fibers fully swollen. The diameter of the swollen fiber was more than ten times their original size, and numerous tiny OSP particles were dispersed within the swollen fiber. By 12 minutes, all the fibers had crosslinked, forming a complete milky white film on the glass slide. At the air interface, the film's edge was clearly visible, along with the uniformly dispersed OSP within the film.
During the gelation process of the fibers, LiBr plays a crucial role. Li+, as the smallest metal ion, has excellent diffusion and penetration capabilities, especially in hot aqueous solutions. As a charged particle, Li+ moves vigorously in the solution, causing the hydrogen bonds between polysaccharide chains to break. This allows water molecules to diffuse in, leading to the swelling of the cotton fibers. As the fibers continue to swell, they become softer and softer. Under external mechanical forces or driven by Brownian motion, the OSP diffused into the polymer chains of the fibers. This diffusion of solid particles would accelerate the gelation of the fibers.
3.3 Characterization of OSP@Gel
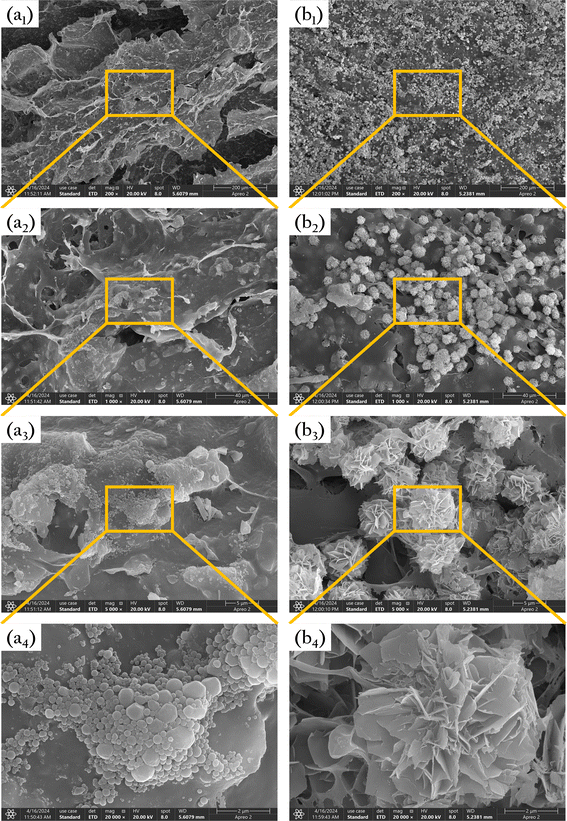
The gel beads were sliced and freeze-dried, and their surface microstructure was observed, the results were displayed in Fig. 5(a). After gelation, the cellulose exhibited a fibrous, layered structure. Irregular gaps existed between these layers, and numerous micron-sized pores were distributed on the layers. These gaps and pores are expected to serve as channels for phosphate diffusion into the gel. The magnified SEM images revealed a large number of OSP particles embedded on the surface of the gel layers. The uniformly dispersed OSP will provide numerous adsorption sites for phosphate, facilitating its efficient removal.Fig. 5(b) shows the microstructure of the gel surface after phosphate adsorption. The images reveal numerous flower-shaped crystals attached to the gel surface, which are primarily precipitated phosphates formed after freeze-drying. These results indicate that OSP@Gel possesses excellent phosphate adsorption capabilities.
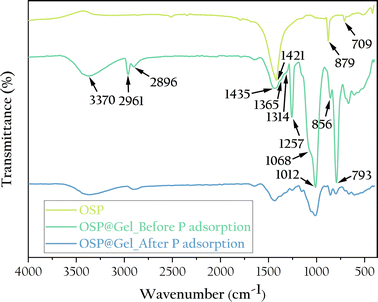
To further understand the chemical structure of the OSP@Gel surface, we characterized it through infrared spectroscopy, as shown in Fig. 6. For the OSP, the absorption peaks at 1421, 879, and 709 cm−1 are characteristics of calcite-type calcium carbonate, corresponding to the antisymmetric stretching vibration of C–O in calcium carbonate, the out-of-plane bending vibration of CO32−, and the in-plane bending vibration of O–C–O, respectively. These absorption peaks seem appear in the OSP@Gel samples. For OSP@Gel before phosphate adsorption, the broad peak at 3370 cm−1 is attributed to the valence vibration of hydrogen-bonded OH groups on the polysaccharide rings of cellulose. The peaks at 2961 cm−1 and 2896 cm−1 correspond to the stretching vibrations of saturated C–H in polysaccharides,38 while the peak at 1435 cm−1 is assigned to CH2 scissor vibrations.39 The peak at 1365 cm−1 is attributed to the bending deformation vibration of C–H in cellulose and hemicellulose, and the peak at 1314 cm−1 corresponds to CH2 rocking vibrations. The peak at 1257 cm−1 is assigned to the C–O–C stretching vibration in lignin. The peak at 1068 cm−1 is due to the asymmetric vibration of the glucose ring, and the peak at 1012 cm−1 corresponds to the C–O–C pyranose ring skeletal vibration.40 A small sharp peak at 856 cm−1 s assigned to the glycosidic C1–H deformation with ring vibration contribution, which is characteristic of β-glycosidic linkages between glucose units in cellulose.39 The peak at 793 cm−1 is assigned to pyran vibration. After phosphate adsorption, the spectrum of OSP@Gel remains largely unchanged, though all peaks are less intense, likely because the surface of the sample is partially covered by phosphate. Unfortunately, no distinct peaks characteristic of phosphate were observed in the infrared spectrum.
To further determine the changes in the chemical composition of the gel bead surfaces before and after phosphorus adsorption, XPS analysis was operated and the result was shown in Fig. 7. Before phosphorus adsorption, the sample surface primarily contained elements such as C, N, O, Ca, and Si, mainly originating from cellulose, OSP, and organic matter and dust adsorbed on their surface. The intensity of these elemental peaks was consistent with their estimated content in the sample. The Ca 2p peak showed a clear spin–orbit splitting, with an energy difference of 3.5 eV, characteristic of carbonates. No significant P absorption peak was observed on the material surface before adsorption.
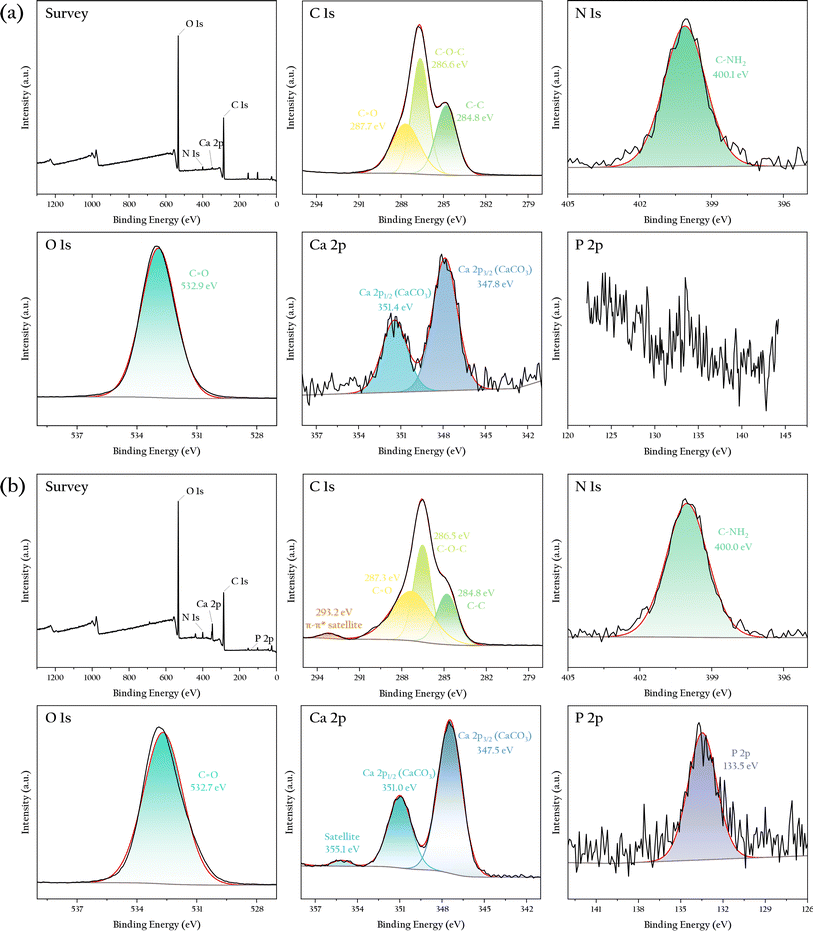 | ||
| Fig. 7 XPS spectra of the OSP@Gel sample: (a) before phosphate adsorption; (b) after phosphate adsorption. | ||
After phosphorus adsorption, the overall peak pattern of the sample remained similar to that before adsorption, indicating that the elemental composition of the material did not significantly change. However, there were notable differences in the high-resolution spectra of elements such as C, Ca, and P. A prominent peak for P appeared at 133.5 eV, characteristic of phosphates, confirming effective phosphate adsorption on the material surface, consistent with the SEM results. Additionally, a π–π* satellite loss feature appeared for C at 293.2 eV, likely due to interactions between phosphates and the cellulose surface. Similarly, a satellite loss feature for Ca was observed at 355.1 eV, possibly resulting from interactions between trace amounts of calcium carbonate in OSP and H2PO4−. These findings suggest that both cellulose and OSP may contribute to phosphate adsorption, but further adsorption experiments are needed to determine the dominant process.
3.4 Factors influencing phosphate adsorption
3.5 Kinetics of phosphate adsorption
The adsorption of phosphate by OSP@Gel beads occurs in two distinct stages, as illustrated in Fig. 11(a). During the initial stage (0–12 h), the adsorption capacity increases significantly due to the abundance of available active sites on the OSP@Gel surface. In the subsequent stage (after 12 h), the adsorption capacity grows slowly, approaching equilibrium around 24 h. Extending the contact time beyond this period does not significantly enhance phosphate adsorption capacity.48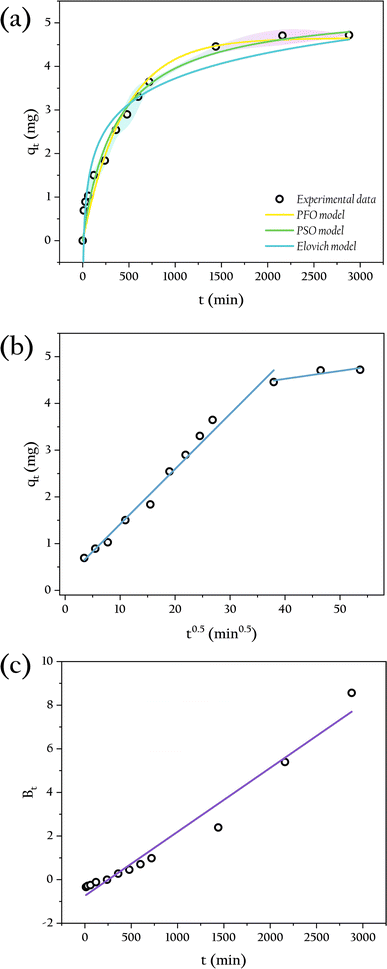 | ||
| Fig. 11 The kinetics analysis in different models: (a) PFO, PSO and Elovich models; (b) IPD model; (c) Boyd model. | ||
To acess the adsorption kinetic behavior of OSP@Gel, the PFO, PSO and Elovich models were employed to fit the kinetic data, with the fitting results shown in Fig. 11(a). The corresponding kinetics data are presented in Table 1. The results indicate that the PSO model (R2 = 0.973) fits better than the PFO model (R2 = 0.962) and the Elovich model (R2 = 0.939), suggesting that the adsorption of phosphate by OSP@Gel is primarily a chemisorption process. This finding is consistent with previous discussions on zeta potential and XPS analysis, and aligns with the results reported in the literature for phosphate adsorbents modified with metal ions.45,48,49
| Adsorption kinetics | Parameters | Values | R2 |
|---|---|---|---|
| Experimental | qe (mg) | 4.72 | |
| PFO model | k1 (min−1) | 2.25 × 10⁻³ | 0.962 |
| qe (mg) | 4.65 | ||
| PSO model | k2 (mg min−1) | 5.05 × 10⁻⁵ | 0.973 |
| qe (mg) | 5.40 | ||
| Elovich model | α (mg min−1) | 0.0687 | 0.939 |
| β (mg) | 1.18 | ||
| IPD model | ki1 (mg−1 min−0.5) | 0.118 | 0.982 |
| C1 (mg) | 0.240 | ||
| ki2 (mg−1 min−0.5) | 0.0170 | 0.649 | |
| C2 (mg) | 3.84 | ||
| Boyd model | 0.962 |
To further understand the diffusion mechanism, the IPD model was plotted and the result was shown in Fig. 11(b), with the relevant parameters listed in Table 1. The fitted line closely approaches the origin point, indicating that intra-particle diffusion is the primary rate-controlling step, though it is not the sole process involved in adsorption. Typically, the adsorption process is initially governed by membrane diffusion, followed by intraparticle diffusion. In intraparticle diffusion process, phosphate ions penetrate the material through the gaps or pores on gel layer.50 This observation aligns with the SEM images. Additionally, we employed the Boyd model to investigate the driving force of liquid film diffusion, as depicted in Fig. 11(c), with relevant parameters also listed in Table 1. The fitted line does not pass through the origin point, indicating that the concentration difference of phosphate between the solution and the gel surface drives the outer film diffusion. Consequently, the external mass transfer of phosphate in the solution serves as the initial driving force for the entire adsorption process.51
3.6 Isotherm of phosphate adsorption
The adsorption performance of OSP@Gel for phosphate can be evaluated by examining the distribution of solutes between the solid and liquid phases during adsorption equilibrium. While isotherm simulations are common methods to acess this adsorption behavior and mechanism. Therefore, the equilibrium parameters were fitted by using the Freundlich, Langmuir and Dubinin–Radushkevich isotherm models. The nonlinear fitting results are presented in Fig. 12, and the related parameters are listed in Table 2.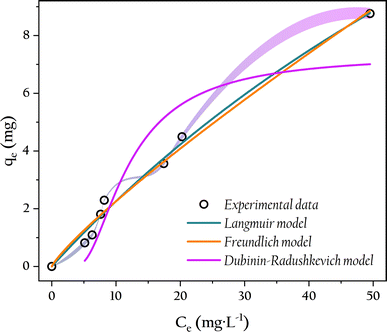 | ||
| Fig. 12 Adsorption isotherm of phosphate onto OSP@Gel and non-linear adjustments by Freundlich, Langmuir and Dubinin–Radushkevich models. | ||
| Adsorption isothern | Parameters | Values | R2 |
|---|---|---|---|
| Langmuir | qm (mg) | 32.6 | 0.991 |
| KL (L mg−1) | 7.46 × 10⁻³ | ||
| Freundlich | n (mg) | 1.17 | 0.988 |
| KF (L mg−1) | 0.316 | ||
| Dubinin–Radushkevich | qm (mg) | 7.33 | 0.850 |
| KDR (mol2 kJ−2) | 1.86 × 10⁻³ | ||
| E (kJ mol−1) | 16.4 |
From the isotherm parameters, it is evident that the Langmuir model (R2 = 0.991) outperforms the Freundlich model (R2 = 0.988), indicating a preference for monolayer adsorption of phosphate onto the OSP@Gel surface. The feasibility of the adsorption process can be assessed by using the Langmuir separation factor RL. The adsorption could be classified as unfavorable (RL > 1), linear (RL = 1), favorable (0 < RL < 1), or irreversible (RL = 0).52 In this work, RL values ranged from 0.730 to 0.963, indicating favorable adsorption of phosphate within the experimental concentration range. The maximum monolayer adsorption capacity of a single gel bead for phosphorus was 32.6 mg. Given that 0.5 g of fiber and 1.0 g of OSP could produce 12 gel beads in this work, the theoretical adsorption capacity of OSP@Gel for phosphorus can reach up to 260.8 mg g−1. Compared with other phosphorus adsorbents as shown in Table 3, OSP@Gel demonstrates substantial potential for this pollutant.
| Adsorbent | Form of adsorbent | Removal capacity | Reference |
|---|---|---|---|
| Eggshell ash | Powder | 121 mg g−1 | 53 |
| Palygorskite | Powder | 4 mg g−1 | 54 |
| Red seaweed | Powder | 60 mg g−1 | 37 |
 |
Powder | 64.6 mg g−1 | 43 |
| Cry-Ca-COS | Tablet | 10 mg g−1 | 23 |
| Clay-oyster shell composite | Pellet | 88 mg g−1 | 28 |
| OSP | Powder | 94.9 mg g−1 | Supplement |
| OSP@Gel | Pellet | 8.80 mg per pellet, or 70.4 mg g−1 | This work |
The Dubinin–Radushkevich model, which assumes a Gaussian distribution of energies on a heterogeneous surface, provides an empirical explanation of the adsorption mechanism.55 The mean adsorption energy E is a crucial parameter, with E less than 8 kJ mol−1 indicating physical adsorption, and E greater than 8 kJ mol−1 indicating chemical adsorption.56 In this work, an E value of 16.4 kJ mol−1 suggests that the adsorption of phosphate by OSP@Gel is predominantly chemical.
3.7 Thermodynamics of phosphate adsorption
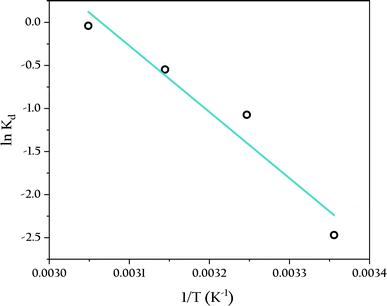
Table 4 illustrates the effect of temperature on the adsorption of phosphate by OSP@Gel within the range of 25 to 55 °C. The adsorption capacity gradually increases with rising temperature, reaching an equilibrium adsorption capacity of 7.31 mg onto single gel bead at 55 °C. The thermodynamic parameters, which can be calculated from the variation in the solute distribution coefficient, are also presented in Table 4. The enthalpy (ΔH) and entropy (ΔS) were obtained from the slope and intercept of the van't Hoff plot shown in Fig. 13.| Temperature (K) | qm (mg) | Kd (L) | ΔG (kJ mol−1) | ΔH (kJ mol−1) | ΔS (J K−1 mol−1) |
|---|---|---|---|---|---|
| 298 | 5.79 | 0.0846 | 6.12 | 63.9 | 196 |
| 308 | 6.99 | 0.342 | 2.66 | ||
| 318 | 7.19 | 0.578 | 1.36 | ||
| 328 | 7.31 | 0.961 | 0.0975 |
As shown in Table 4, the positive ΔG indicates that the reaction is non-spontaneous at the experimental temperatures. The decrease in ΔG with increasing temperature suggests that higher temperatures favor the reaction.57 This is because the concentration difference of the solute between the solid and liquid phases drives the initial adsorption reaction, and higher temperatures enhance the liquid-film diffusion of the solutes, thereby facilitating the adsorption process. Furthermore, the positive ΔH (63.9 kJ mol−1) signifies that the adsorption process is endothermic, indicating a chemical adsorption mechanism, as physical adsorption is typically exothermic.58 The positive ΔS (196 J K−1 mol−1) implies an increase in randomness at the solid–liquid interface during adsorption, enhancing the freedom of phosphate anions.52
3.8 Stability and application potential
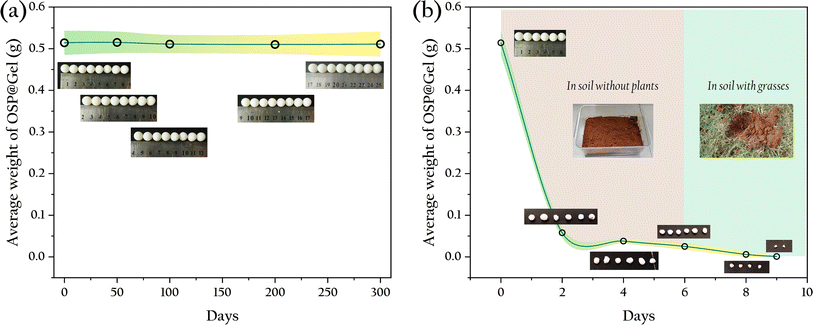
Particle-type adsorbents consistently demonstrate excellent decontamination performance, yet their practical application in production is hindered by the difficulty in recovering these particles. Incorporating functional particles into hydrogels presents a promising solution to this problem. However, the stability of the gel is a crucial factor that cannot be overlooked in practical applications. For example, commonly used sodium alginate gel-based adsorbent materials exhibit poor strength and tend to disintegrate in water, rendering them unrecoverable. In this study, OSP@Gel was soaked in water to observe its morphological changes, and it was found that after 300 days of immersion, the material's morphology remained intact, as shown in Fig. 14(a), indicating good stability in aqueous environments. This result is consistent with compression tests.For phosphate, adsorption to prevent environmental damage is merely the first step in phosphorus recovery. The subsequent utilization of phosphate is another critical task. A common method is to release the adsorbed phosphate back into water to serve as a nutrient source for crops or aquatic plants. Here, we propose an alternative strategy: using the adsorbent directly as a soil fertilizer. The material was introduced into soil to assess its degradation which is a key indicator of its potential use as a soil fertilizer. The results are shown in Fig. 14(b).
In soil without plants, the degradation rate of the gel beads was slow, with a weight loss of 95.1% over six days. Most of the mass loss was likely due to water loss, as the gel beads merely shrank in size without obvious signs of disintegration. When the gel beads were transferred into grassland, they completely degraded within three days. This accelerated degradation could be attributed to the richer and more diverse microbial population in the soil with plants. This result suggests that the phosphate adsorbent material shows great promise as a soil fertilizer. Not only can it release phosphate into the soil as a nutrient source for crops upon degradation, but it also consists solely of OSP and cellulose, ensuring no secondary environmental impact post-degradation.
To enhance the material's adsorption performance and broaden its application scenarios, we propose three ideas. First, creating hollow OSP@Gel to reduce its density, allowing the gel beads to float on water for easier recovery. Additionally, these gel beads can be strung together or woven into a mesh for convenient application and retrieval. In this study, the beads were strung on a rope to distribute them at different water depths, ensuring uniform adsorption. Second, injecting polyphosphate-accumulating bacteria into the hollow gel beads to combine adsorption with microbial action for enhanced phosphate removal. However, the potential destructive effect of these microbes on the gel beads must not be overlooked. Third, after phosphate adsorption, other high-concentration nutrient salts could be injected into the hollow gel beads. When these beads are reintroduced into water, the slow release of multiple nutrient salts could achieve balanced nutrition, improving the efficiency of soilless cultivation of crops.
4. Conclusion
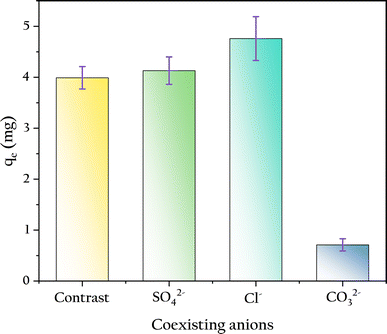
In this study, discarded oyster shells were used as raw materials to create gel beads capable of phosphate removal through a simple crushing and gelation process. This OSP@Gel bead exhibits good mechanical strength and can efficiently and conveniently adsorb phosphate from water, with minimal impact from coexisting anions. Its ease of degradation in soil paves the way for its usage as a soil fertilizer. In summary, the phosphate-adsorbing gel bead prepared in this work is a promising environmental treatment material with various potential applications in agriculture.Data availability
Data for this article are available at DOI: https://doi.org/10.1039/d4ra04189e.Author contributions
Pingguo Wu: investigation, data curation, formal analysis, writing – original draft. Jiyan Zhong: investigation. Naisi Liang: conceptualization. Chanyan Li: investigation. Qingyue Cao: investigation. Mingjuan Zhao: investigation. Yong Li: funding acquisition, resources. Mingneng Liao: conceptualization, resources. Chuanming Yu: conceptualization, funding acquisition, writing – review and editing, project administration.Conflicts of interest
There are no conflicts to declare.Acknowledgements
This work was financially supported by the Science and Technology Program of Zhanjiang City (2022A01064), Scientifc Research Start-up Funds of Guangdong Ocean University (R18018), Postgraduate Education Innovation Project of Guangdong Ocean University (202329), Innovation and Entrepreneurship Training Programme of Guangdong Ocean University (S202310566060), Innovation Team Project of Guangdong Ocean University (CXTD2024016).References
- C. C. Zhang, A. Guisasola and J. A. Baeza, Water Res., 2022, 212, 118102, DOI:10.1016/j.watres.2022.118102.
- D. Cordell, J. O. Drangert and S. White, Glob. Environ. Change, 2009, 19, 292, DOI:10.1016/j.gloenvcha.2008.10.009.
- S. J. Yang, P. K. Jin, X. C. Wang, Q. H. Zhang and X. T. Chen, Chem. Eng. J., 2016, 292, 246, DOI:10.1016/j.cej.2016.02.006.
- M. O. Usman, G. Aturagaba, M. Ntale and G. W. Nyakairu, Water Sci. Technol., 2022, 86, 3113, DOI:10.2166/wst.2022.382.
- L. E. de-Bashan and Y. Bashan, Water Res., 2004, 38, 4222, DOI:10.1016/j.watres.2004.07.014.
- B. E. Rittmann, B. Mayer, P. Westerhoff and M. Edwards, Chemosphere, 2011, 84, 846, DOI:10.1016/j.chemosphere.2011.02.001.
- Y. Zhang, E. Desmidt, A. Van Looveren, L. Pinoy, B. Meesschaert and B. Van der Bruggen, Environ. Sci. Technol., 2013, 47, 5888, DOI:10.1021/es4004476.
- S. Hukari, L. Hermann and A. Nättorp, Sci. Total Environ., 2016, 542, 1127, DOI:10.1016/j.scitotenv.2015.09.064.
- C. Fang, T. Zhang, P. Li, R. F. Jiang, S. B. Wu, H. Y. Nie and Y. C. Wang, J. Environ. Sci., 2015, 29, 106, DOI:10.1016/j.jes.2014.08.019.
- A. Oehmen, P. C. Lemos, G. Carvalho, Z. G. Yuan, J. Keller, L. L. Blackall and M. A. M. Reis, Water Res., 2007, 41, 2271, DOI:10.1016/j.watres.2007.02.030.
- L. Shu, P. Schneider, V. Jegatheesan and J. Johnson, Bioresour. Technol., 2006, 97, 2211, DOI:10.1016/j.biortech.2005.11.005.
- H. L. Dai, X. W. Lu, Y. H. Peng, H. M. Zou and J. Shi, Chemosphere, 2016, 165, 211, DOI:10.1016/j.chemosphere.2016.09.001.
- S. Kataki, H. West, M. Clarke and D. C. Baruah, Waste Manage., 2016, 49, 437, DOI:10.1016/j.wasman.2016.01.003.
- M. Zhang and B. Gao, Chem. Eng. J., 2013, 226, 286, DOI:10.1016/j.cej.2013.04.077.
- M. Zhang, B. Gao, Y. Yao, Y. W. Xue and M. Inyang, Chem. Eng. J., 2012, 210, 26, DOI:10.1016/j.cej.2012.08.052.
- M. Ahmad, A. U. Rajapaksha, J. E. Lim, M. Zhang, N. Bolan, D. Mohan, M. Vithanage, S. S. Lee and Y. S. Ok, Chemosphere, 2014, 99, 19, DOI:10.1016/j.chemosphere.2013.10.071.
- S. P. Galinato, J. K. Yoder and D. Granatstein, Energy Policy, 2011, 39, 6344, DOI:10.1016/j.enpol.2011.07.035.
- J. L. Field, C. M. Keske, G. L. Birch, M. W. DeFoort and M. F. Cotrufo, GBC Bioenergy, 2013, 5, 177, DOI:10.1111/gcbb.12032.
- R. L. Naylor, R. W. Hardy, A. H. Buschmann, S. R. Bush, L. Cao, D. H. Klinger, D. C. Little, J. Lubcheno, S. E. Shumway and M. Troell, Nature, 2021, 595, E36, DOI:10.1038/s41586-021-03736-4.
- J. S. Lu, Z. Y. Lu, X. B. Li, H. T. Xu and X. Y. Li, J. Cleaner Prod., 2015, 92, 223, DOI:10.1016/j.jclepro.2014.12.093.
- H. B. Kwon, C. W. Lee, B. S. Jun, J. D. Yun, S. Y. Weon and B. Koopman, Resour., Conserv. Recycl., 2004, 41, 75, DOI:10.1016/j.resconrec.2003.08.005.
- Y. H. Song, P. G. Weidler, U. Berg, R. Nüesch and D. Donnert, Chemosphere, 2006, 63, 236, DOI:10.1016/j.chemosphere.2005.08.021.
- Z. J. Zhou, Q. L. Xu, Z. J. Wu, X. T. Fang, Q. L. Zhong, J. L. Yang, J. Yan and Q. G. Li, Sustainable Chem. Pharm., 2023, 32, 101023, DOI:10.1016/j.scp.2023.101023.
- Z. J. Zhou, J. Yan, X. X. Du, Q. L Xu, Z. J. Wu, J. L. Yang, X. T. Fang, Q. L. Zhong and Q. G. Li, J. Renewable Mater., 2023, 11, 3501, DOI:10.32604/jrm.2023.027852.
- S. L. Ding, D. X. Fang, Z. S. Pang, B. Luo, L. Kuang, H. Wang, Q. Zhang, Q. S. Shen and F. Y. Ji, Sci. Total Environ., 2018, 645, 937–945, DOI:10.1016/j.scitotenv.2018.07.197.
- T. Taweekarn, W. Wongniramaikul and A. Choodum, J. Environ. Manage., 2022, 301, 113923, DOI:10.1016/j.jenvman.2021.113923.
- T. G. Ambaye, M. Vaccari, S. Prasad, E. D. van Hullebusch and S. Rtimi, J. Environ. Manage., 2022, 301, 113850, DOI:10.1016/j.jenvman.2021.113850.
- S. Kaewnoo, W. Wongniramaikul, C. Boonkanon, T. Taweekarn, B. Kleangklao, S. Limwongsakorn, C. Phawachalotorn, D. S. Aga and A. Choodum, Colloids Surf., A, 2024, 691, 133857, DOI:10.1016/j.colsurfa.2024.133857.
- L. Y. Ee, S. Y. R. Chia, K. Xue, S. Y. Chin, C. A. H. Cho, X. Y. Tan and S. F. Y. Li, Chem. Eng. J., 2023, 454, 140218, DOI:10.1016/j.cej.2022.140218.
- L. Y. Ee and S. F. Y. Li, Nanoscale Adv., 2021, 3, 1167, 10.1039/d0na00408a.
- O. J. Ajala, A. Khadir, J. O. Ighalo and G. C. Umenweke, Nano-Biosorbents for Decontamination of Water, Air, and Soil Pollution, Elsevier, Amsterdam, 2022, DOI:10.1016/B978-0-323-90912-9.00017-4.
- M. D. E. Eufrásio Pinto, D. D. da Silva, A. L. A. Gomes, R. M. M. dos Santos, R. A. A. de Couto, R. F. de Novais, V. R. L. Constantino, J. Tronto and F. G. Pinto, J. Cleaner Prod., 2019, 222, 36, DOI:10.1016/j.jclepro.2019.03.012.
- R. M. M. Santos, J. Tronto, V. Briois V and C. V. Santilli, J. Mater. Chem. A, 2017, 5, 9998, 10.1039/c7ta00834a.
- I. Langmuir, J. Am. Chem. Soc., 1917, 40, 1361, DOI:10.1021/ja02242a004.
- H. Freundlich, Z. Phys. Chem., 1907, 57, 385, DOI:10.1515/zpch-1907-5723.
- L. Saya, D. Gautam, S. Hooda, G. Gambhir and S. Kumar, Comprehensive Materials Processing, Elsevier, Amsterdam, 2024, DOI:10.1016/B978-0-323-96020-5.00019-4.
- M. Rathod, K. Mody and S. Basha, J. Cleaner Prod., 2014, 84, 484, DOI:10.1016/j.jclepro.2014.03.064.
- Z. X. Gao, M. L. Ma, X. L. Zhai, M. Zhang, D. L. Zang and C. Y. Wang, RSC Adv., 2015, 5, 63978, 10.1039/C5RA04000K.
- Y. Jiao, C. C. Wan, T. G. Qiang and J. Li, Appl. Phys. A: Mater., 2016, 122, 686, DOI:10.1007/s00339-016-0194-5.
- R. C. Sun and S. Hughes, Carbohydr. Polym., 1998, 36, 293, DOI:10.1016/S0144-8617(97)00255-5.
- Z. H. Wang, D. K. Shen, F. Shen and T. Y. Li, Chemosphere, 2016, 150, 1, DOI:10.1016/j.chemosphere.2016.02.004.
- R. Nazarian, R. J. Desch and S. W. Thiel, Colloids Surf., A, 2021, 624, 126813, DOI:10.1016/j.colsurfa.2021.126813.
- X. M. Kong, R. Y. Bai, S. L. Wang, B. Wu, R. Z. Zhang and H. D. Li, Chem. Phys. Lett., 2022, 787, 139234, DOI:10.1016/j.cplett.2021.139234.
- C. Fan, C. L. Guo, W. Chen, L. Tao, Q. Yao, G. N. Lu, Y. Shen and Z. Dang, Colloids Surf., A, 2023, 658, 130691, DOI:10.1016/j.colsurfa.2022.130691.
- A. Alhujaily, Y. Z. Mao, J. L. Zhang, J. Ifthikar, X. Y. Zhang and F. Y. Ma, J. Taiwan Inst. Chem. Eng., 2020, 117, 75, DOI:10.1016/j.jtice.2020.11.034.
- S. R. Chowdhury and E. K. Yanful, J. Environ. Manage., 2010, 91, 2238, DOI:10.1016/j.jenvman.2010.06.003.
- Y. Yao, B. Gao, M. Inyang, A. R. Zimmerman, X. D. Cao, P. Pullammanappallil and L. Y. Yang, J. Hazard. Mater., 2011, 190, 501, DOI:10.1016/j.jhazmat.2011.03.083.
- H. Y. Luo, Y. J. Wang, X. Q. Wen, S. L. Cheng, J. Li and Q. T. Lin, Sci. Total Environ., 2020, 766, 142618, DOI:10.1016/j.scitotenv.2020.142618.
- T. W. Liao, T. Li, X. D. Su, X. Yu, H. Y. Song, Y. Zhu and Y. M. Zhang, Bioresour. Technol., 2018, 263, 207, DOI:10.1016/j.biortech.2018.04.108.
- S. B. Liu, X. F. Tan, Y. G. Liu, Y. L. Gu, G. M. Zeng, X. J. Hu, H. Wang, L. Zhou, L. H. Jiang and B. B. Zhao, RSC Adv., 2016, 6, 5871, 10.1039/c5ra22142k.
- H. J. Sheng, F. Wang, C. G. Gu, R. Stedtfeld, Y. R. Bian, G. X. Liu, W. Wei and X. Jiang, RSC Adv., 2018, 8, 9364, 10.1039/c7ra10421a.
- P. D. Pathak and S. A. Mandavgane, J. Environ. Chem. Eng., 2015, 3, 2435, DOI:10.1016/j.jece.2015.08.023.
- J. Torit and D. Phihusut, Environ. Sci. Pollut. Res., 2019, 26, 34101, DOI:10.1007/s11356-018-3305-3.
- H. P. Ye, F. Z. Chen, Y. Q. Sheng, G. Y. Sheng and J. M. Fu, Sep. Purif. Technol., 2006, 50, 283, DOI:10.1016/j.seppur.2005.12.004.
- K. Y. Foo and B. H. Hameed, Chem. Eng. J., 2010, 156, 2, DOI:10.1016/j.cej.2009.09.013.
- O. Pezoti, A. L. Cazetta, K. C. Bedin, L. S. Souza, A. C. Martins, T. L. Silva, O. O. Santos Júnior, J. V. Visentainer and V. C. Almeida, Chem. Eng. J., 2016, 288, 778, DOI:10.1016/j.cej.2015.12.042.
- J. W. Fu, Z. H. Chen, M. H. Wang, S. J. Liu, J. H. Zhang, J. N. Zhang, R. P. Han and Q. Xu, Chem. Eng. J., 2015, 259, 53, DOI:10.1016/j.cej.2014.07.101.
- M. Rathod, S. Haldar and S. Basha, Ecol. Eng., 2015, 84, 240, DOI:10.1016/j.ecoleng.2015.09.031.
Footnote |
| † Electronic supplementary information (ESI) available. See DOI: https://doi.org/10.1039/d4ra04189e |
| This journal is © The Royal Society of Chemistry 2024 |

