 Open Access Article
Creative Commons Attribution 3.0 Unported Licence
Graphene-wrapped yolk–shell of silica-cobalt oxide as high-performing anode for lithium-ion batteries†
Jingjing Ma *ab,
Jiawei Yongb,
Xiangnan Lia,
Huishuang Zhanga,
Yuanchao Li
 b,
Hongying Niu
 b,
Shuting Yang
 *a,
Yu-Shi He
 c and
Zi-Feng Ma
 c
c
aPostdoctoral Research Base, School of Chemistry and Chemical Engineering, Henan Normal University, Xinxiang, Henan 453007, PR China. E-mail: jingjingma_xx@163.com; shutingyang@foxmail.com; Fax: +86-0373-3040148
bPostdoctoral Station, School of Chemistry and Chemical Engineering, Henan Institute of Science and Technology, Xinxiang, Henan 453003, PR China
cShanghai Electrochemical Energy Devices Research Center, School of Chemistry and Chemical Engineering, Shanghai Jiao Tong University, Shanghai 200240, China
First published on 23rd September 2024
Abstract
Silica (SiO2) shows promise as anode material for lithium-ion batteries due to its low cost, comparable lithium storage discharge potential and high theoretical capacity (approximately 1961 mA h g−1). However, it is plagued by issues of low electrochemical activity, low conductivity and severe volume expansion. To address these challenges, we initially coat SiO2 with CoO, followed by introducing SiO2@CoO into graphene sheets to fabricate an anode composite material (SiO2@CoO/GS) with uniformly dispersed particles and a 3D graphene wrapped yolk–shell structure. The coating of CoO on SiO2 converted the negative surface charge of SiO2 to positive, enabling effective electrostatic interactions between SiO2@CoO and graphene oxide sheets, which provided essential prerequisites for synthesizing composite materials with uniformly dispersed particles and good coating effects. Furthermore, the Co-metal formed during the charge–discharge process can act as a catalyst and electron transfer medium, activating the lithium storage activity of SiO2 and enhancing the conductivity of the electrode, conclusively achieving a higher lithium storage capacity. Ultimately, due to the activation of SiO2 by Co-metal during cycling and the excellent synergistic effect between SiO2@CoO and graphene, SiO2@CoO/GS delivers a high reversible capacity of 738 mA h g−1 after 500 cycles at 200 mA g−1. The product also demonstrates excellent rate performance with a reversible capacity of 206 mA h g−1 at a high specific current of 12.8 A g−1. The outstanding rate performance of SiO2@CoO/GS may be ascribed to the pseudo-capacitive contribution at high specific current upon cycling.
1 Introduction
Lithium-ion batteries (LIBs) have gained significant attraction in portable electronic devices and compact electric vehicles owing to their high energy density, long lifespan and absence of memory effect.1 Nonetheless, the prevailing energy density of commercial LIBs (∼250 W h kg−1) falls short of satisfying the heightened specific energy demands of electric vehicles and expansive energy storage installations.2–5 The primary approach to surmounting these challenges unquestionably revolves around the development of electrode materials with superior specific energy for advanced LIBs.Silicon-based materials are considered as promising candidates to replace graphite for the next generation anode materials of LIBs due to their low lithium insertion potential, high capacity, high safety and abundant sources. Silicon anode materials, in particular, possess an ultra-high theoretical specific capacity of 4200 mA h g−1.6 However, they are costly to manufacture and have stringent production requirements.7 Additionally, during the lithiation process, silicon undergoes a volume expansion of more than 300% and significant mechanical stress, leading to particle fragmentation and continual breakdown and regeneration of the solid electrolyte interface (SEI), resulting in severe capacity degradation and poor rate performance.8,9 As a result, it is challenging to apply silicon in practical production processes. Although the theoretical specific capacity of SiO2 (1965 mA h g−1) is lower than that of silicon,10 it is still a viable alternative due to its simple preparation method, widespread availability and lower volume change during charge/discharge processes.
However, the performance of SiO2 in actual charge/discharge processes is limited by its high binding energy of Si–O bonds, making it difficult to fracture and activate SiO2, resulting in poor lithium storage reaction activity.11 Research has demonstrated that metals or metal oxides can catalyze and activate the lithium storage reactions of SiO2, thereby significantly enhancing its lithium storage capacity.12 Moreover, SiO2-based anodes suffer from low conductivity, slow lithium ion diffusion and severe volume expansion during charge/discharge processes.13 To resolve the issues, SiO2 can be designed and prepared into various nanostructured materials (such as nanoparticles, nanowires,14,15 nanorods, nanotubes,16,17 nanoporous structures,18,19 etc.). This helps to mitigate the volume changes of SiO2 during reactions and shorten the paths for lithium ion and electron transport.20,21 Alternatively, superior carbon coating structures can be designed to further improve the volume expansion issues of SiO2 and enhance its conductivity.22
Graphene is a preferred carbon material to design composite due to its high conductivity, flexibility and strong malleability. By effectively designing methods and processes, combining SiO2 with graphene to create silica/graphene composites with graphene-wrapped structures can effectively mitigate the volume effects of SiO2 and enhance material conductivity, thereby significantly enhancing the electrochemical performance of silica-based anodes.22–24 The dispersion of particles, graphene wrapping and pore size distribution in graphene/silica-based composites significantly impact their electrochemical performance. However, the high specific surface energy causes significant agglomeration of nano-SiO2 in composites. Furthermore, the electronegative nature of both SiO2 and graphene oxide (GO) surfaces presents a challenge in fabricating nano-SiO2/graphene composites with effective graphene-wrapped structures and highly dispersed SiO2 using simple methods.25,26 To address this obstacle, it is necessary to alter the surface charge properties of SiO2 to establish effective electrostatic interactions between SiO2 and GO.24
Based on this, this study proposes a novel preparation method by first modifying the surface of SiO2 with metal oxide coating to impart positive charge and then combining it with negatively charged graphene oxide. In colloid science,27 metal oxides dispersed in media tend to selectively adsorb cations and exhibit positive charge,28,29 contrary to the electronegative surfaces of graphene oxide. Thus, SiO2 modified with metal oxide coating (SiO2@CoO) can initially disperse and adsorb on the surface of graphene oxide through electrostatic interactions, ultimately obtaining uniformly dispersed silica particles individually wrapped by graphene. This effectively controls the volume expansion of SiO2 during lithium insertion/extraction and enhances the conductivity of electrode. Furthermore, CoO not only participates in lithium storage reactions but also the Co metal formed during charge/discharge processes can act as a catalyst and electron transfer medium, activating the lithium storage activity of SiO2 and enhancing its conductivity, thereby achieving a higher lithium storage capacity. The study ultimately produced a composite material, SiO2@CoO/GS, with a 3D graphene wrapped yolk–shell structure, exhibiting a capacity of 738 mA h g−1 after 500 cycles at a current density of 200 mA g−1. Additionally, it demonstrates excellent rate performance, retaining a specific capacity of 206 mA h g−1 at a high current density of 12.8 A g−1.
2 Experimental section
2.1 Synthesis of SiO2@CoO composite
SiO2 was prepared using the Stöber solution-gelation process and see the detailed process in the ESI.†A mixture containing Co(NO3)2·6H2O (0.8 g), cetyltrimethylammonium bromide (CTAB) (0.2 g), SiO2 (0.8 g) and isopropanol (6 mL) was mixed with 24 mL of deionized water using magnetic stirring for 2 hours to create a homogeneous suspension. The mixture was then transferred to a Teflon-lined autoclave and maintained at 180 °C for 20 hours. Following the cooling process to room temperature (20–25 °C), the SiO2@CoO precursor was obtained following washing and drying.
2.2 Synthesis of SiO2@CoO/GS and SiO2/GS composites
GO was prepared using a modified Hummers' method, which was described in detail in the ESI.† GO (40 mg) and SiO2@CoO (80 mg, 300 nm) were mixed in 40 mL of absolute ethanol by magnetic stirring for 2 hours and sonication lasting 1 hour to create a uniform suspension. The solution was then placed in a Teflon-lined autoclave and kept at 200 °C for 12 hours. The resulting sample was washed with deionized water to remove ethanol before undergoing freeze-drying to obtain the SiO2@CoO/GS composite.For comparison, SiO2/GS was directly synthesized through a solvothermal process following the thorough dispersion of graphene and SiO2 nanoparticles in an absolute ethanol suspension.
2.3 Material characterization
X-ray diffraction (XRD) patterns were acquired on a Bruker X-ray diffractometer (D8 Advance A25) with Cu-Kα radiation. The surface area was determined by a nitrogen adsorption/desorption analyzer (Micromeritics ASAP2460) and Brunauer–Emmett–Teller (BET) method. Fourier transform infrared spectra (FTIR) were obtained by a TENSOR 27 instrument. X-ray photoelectron spectroscopy (XPS) was employed to investigate the surface chemistry of the samples using a Kratos Axis Ultra DLD spectrometer. Transmission electron microscopy (TEM) and scanning TEM (STEM) analyses were conducted using a JEM-2100F instrument with integrated energy-dispersive X-ray spectroscopy (EDS). The contents of Si and Co elements in samples were determined by an inductively coupled plasma optical emission spectrometer (ICP-OES, 725 ES).2.4 Electrochemical measurements
The working electrode slurry was prepared by blending active materials, Super-P and polyacrylic acid (PAA) with mass ratio of 6![[thin space (1/6-em)]](https://www.rsc.org/images/entities/char_2009.gif) :
:![[thin space (1/6-em)]](https://www.rsc.org/images/entities/char_2009.gif) 2
2![[thin space (1/6-em)]](https://www.rsc.org/images/entities/char_2009.gif) :
:![[thin space (1/6-em)]](https://www.rsc.org/images/entities/char_2009.gif) 2 using N-methyl-2-pyrrolidinone (NMP) as solvent. The resulting slurry was applied onto copper foil, dried in vacuum at 60 °C for 12 hours and assembled to form the working electrode with an active material loading of approximately 1.2 mg cm−2. Coin cells (CR2016) were assembled in an argon-filled glove box using Li foil as the counter electrode, a microporous polyethylene membrane as the separator and 1.0 mol L−1 LiPF6 in a mixture of ethylene carbonate (EC) and dimethyl carbonate (DMC) (v/v, 1
2 using N-methyl-2-pyrrolidinone (NMP) as solvent. The resulting slurry was applied onto copper foil, dried in vacuum at 60 °C for 12 hours and assembled to form the working electrode with an active material loading of approximately 1.2 mg cm−2. Coin cells (CR2016) were assembled in an argon-filled glove box using Li foil as the counter electrode, a microporous polyethylene membrane as the separator and 1.0 mol L−1 LiPF6 in a mixture of ethylene carbonate (EC) and dimethyl carbonate (DMC) (v/v, 1![[thin space (1/6-em)]](https://www.rsc.org/images/entities/char_2009.gif) :
:![[thin space (1/6-em)]](https://www.rsc.org/images/entities/char_2009.gif) 1) with 10 vol% fluoroethylene carbonate (FEC) as electrolyte.
1) with 10 vol% fluoroethylene carbonate (FEC) as electrolyte.
Electrochemical experiments for the half-cells were performed using battery test system (NEWARE BTS7.6.0) within voltage window of 0.005–3 V (vs. Li/Li+) at room temperature. Charge/discharge capacities were normalized based on the weight of active materials in the electrodes. Cyclic voltammetry (CV) measurements were conducted using a CHI 604E electrochemical workstation (Shanghai Chenhua Instrument Co.) at scan rate of 0.1 mV s−1. Electrochemical impedance spectroscopy (EIS) was carried out using the same workstation over a frequency range spanning from 100 kHz to 0.1 Hz.
3 Discussion
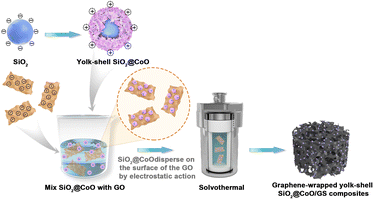
The preparation process of the SiO2@CoO/GS composite material is illustrated in Fig. 1 In the first step, SiO2, CTAB and Co(NO3)2·6H2O were mixed in a mass ratio of 4![[thin space (1/6-em)]](https://www.rsc.org/images/entities/char_2009.gif) :
:![[thin space (1/6-em)]](https://www.rsc.org/images/entities/char_2009.gif) 1
1![[thin space (1/6-em)]](https://www.rsc.org/images/entities/char_2009.gif) :
:![[thin space (1/6-em)]](https://www.rsc.org/images/entities/char_2009.gif) 4. Through hydrothermal reaction and the action of CTAB, sheet-like CoO grew and crystallized on the surface of SiO2, forming the precursor SiO2@CoO with a yolk–shell structure. With the modification of CoO, the surface of SiO2 particles shifted from electronegative to electropositive. In the second step, SiO2@CoO was mixed with graphene oxide (GO) in a mass ratio of 2
4. Through hydrothermal reaction and the action of CTAB, sheet-like CoO grew and crystallized on the surface of SiO2, forming the precursor SiO2@CoO with a yolk–shell structure. With the modification of CoO, the surface of SiO2 particles shifted from electronegative to electropositive. In the second step, SiO2@CoO was mixed with graphene oxide (GO) in a mass ratio of 2![[thin space (1/6-em)]](https://www.rsc.org/images/entities/char_2009.gif) :
:![[thin space (1/6-em)]](https://www.rsc.org/images/entities/char_2009.gif) 1, allowing the electropositive SiO2@CoO particles to be uniformly dispersed and adsorbed onto the electronegative surface of GO through electrostatic attraction. Subsequently, during solvothermal reaction, GO was gradually reduced to graphene (GS). Through π–π bonding, GS contracted and cross-linked to form a three-dimensional porous network structure, encapsulating SiO2@CoO particles, ultimately producing the 3D graphene-wrapped SiO2@CoO composite material SiO2@CoO/GS.
1, allowing the electropositive SiO2@CoO particles to be uniformly dispersed and adsorbed onto the electronegative surface of GO through electrostatic attraction. Subsequently, during solvothermal reaction, GO was gradually reduced to graphene (GS). Through π–π bonding, GS contracted and cross-linked to form a three-dimensional porous network structure, encapsulating SiO2@CoO particles, ultimately producing the 3D graphene-wrapped SiO2@CoO composite material SiO2@CoO/GS.
The synthesized samples were firstly analyzed by XRD, as shown in Fig. 2a. The self-made SiO2 exhibits a broad peak at 22°, matching well with the standard peak of SiO2 (JCPDS 27-0605), corresponding to the (111) crystal plane of amorphous SiO2. Both SiO2@CoO and SiO2@CoO/GS show diffraction peaks at 36°, 42° and 62°, which are attributed to the planes of (111), (200) and (220) of CoO (JCPDS 48-1719), respectively. No characteristic peaks of graphene oxide or graphene can be observed in the SiO2@CoO/GS composite at 11° and 22–28°,27 indicating the successful reduction of graphene oxide during the solvent thermal process and the prevention of interlayer stacking of graphene by embedding SiO2@CoO particles.30
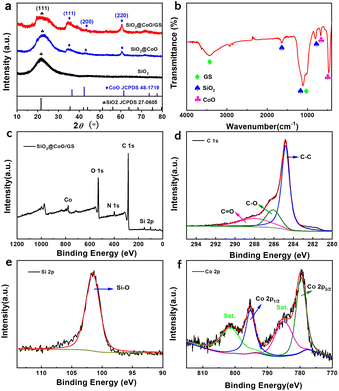 | ||
| Fig. 2 (a) XRD patterns of SiO2, SiO2@CoO and SiO2@CoO/GS; (b) FT-IR spectrum of SiO2@CoO/GS; (c) XPS spectrum of SiO2@CoO/GS composite; (d) C 1s, (e) Si 2p and (f) Co 2p XPS spectra. | ||
Fig. 2b depicts the FTIR spectrum of SiO2@CoO/GS. The strong peak at 476 cm−1 is attributed to the combined action of Si–O and Co–O bonds. The peak at 675 cm−1 can be attributed to the stretching vibration of Co–O bonds.31 The peak at 804 cm−1 is associated with Si–O bond vibrations. The peak at 1112 cm−1 corresponds to the anti-symmetric stretching vibration of Si–O–Si and C–O bonds in graphene, while the broad peak at 3430 cm−1 represents the bending vibration of the –OH group in graphene.32,33
X-ray photoelectron spectroscopy (XPS) analysis was further conducted. As shown in Fig. 2c, the elements Co, O, C and Si were detected. In the C 1s spectrum (Fig. 2d), the peaks at 284.8 eV, 286.2 eV and 288 eV correspond to C–C, C–O and C![[double bond, length as m-dash]](https://www.rsc.org/images/entities/char_e001.gif) O bonds, respectively.34 The high intensity of the C–C bond in C 1s indicates that the GO in SiO2@CoO/GS was reduced to graphene. The peak at 101.7 eV in the Si 2p3/2 spectrum (Fig. 2e) is attributed to the characteristic peak of Si4+.19,20 The Co 2p spectrum (Fig. 2f) shows two representative peaks at 795.7 eV and 780.4 eV, corresponding to Co 2p1/2 and Co 2p3/2 of Co2+.17,18 The results of XPS analysis are consistent with XRD and FT-IR, confirming the successful synthesis of SiO2@CoO/GS. As shown in Fig. S1,† the N 1s absorption peak at 401.35 eV corresponds to the C–NH and (–N + (CH3)2–/–N + (CH3)3) functional groups derived from CTAB.35,36 The surface characteristics of SiO2@CoO may be modified by these functional groups through electrostatic interactions or chemical bonding, which could enhance its interaction with GO and potentially improve the material's electrochemical performance.37,38
O bonds, respectively.34 The high intensity of the C–C bond in C 1s indicates that the GO in SiO2@CoO/GS was reduced to graphene. The peak at 101.7 eV in the Si 2p3/2 spectrum (Fig. 2e) is attributed to the characteristic peak of Si4+.19,20 The Co 2p spectrum (Fig. 2f) shows two representative peaks at 795.7 eV and 780.4 eV, corresponding to Co 2p1/2 and Co 2p3/2 of Co2+.17,18 The results of XPS analysis are consistent with XRD and FT-IR, confirming the successful synthesis of SiO2@CoO/GS. As shown in Fig. S1,† the N 1s absorption peak at 401.35 eV corresponds to the C–NH and (–N + (CH3)2–/–N + (CH3)3) functional groups derived from CTAB.35,36 The surface characteristics of SiO2@CoO may be modified by these functional groups through electrostatic interactions or chemical bonding, which could enhance its interaction with GO and potentially improve the material's electrochemical performance.37,38
To further determine the proportion of each component in SiO2@CoO/GS samples, ICP-OES was employed. As displayed in Table S1,† the mass percentage (wt%) of Si and Co in SiO2@CoO/GS are 28% and 13.954%, respectively. According to that, the content of SiO2, CoO and GS in SiO2@CoO/GS can be calculated to be 60 wt%, 17.7 wt%, 22.3 wt%, respectively.
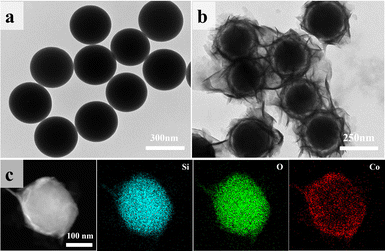
Microscopic morphology and elemental distribution of the materials were analyzed using SEM and TEM. Fig. 3a and S2(a)† show the TEM and SEM images of the self-made SiO2, revealing smooth and uniformly sized (∼250 nm) spherical particles. After CoO encapsulation, the surface smoothness of the particles decreased (Fig. S2b†). In Fig. 3b, ring-shaped gaps between CoO and SiO2 are clearly observed, indicating the growth of lamellar CoO on the surface of SiO2, eventually forming a yolk–shell structure. Fig. 3c presents the STEM elemental mapping of SiO2@CoO, showing uniform distribution of Si, Co and O elements on the surface of SiO2, indicating successful preparation of CoO-coated SiO2 material.
Table 1 presents the zeta potentials for pure SiO2, SiO2@CoO and GO. It can be observed that the surface of self-made SiO2 exhibits negative charge (−5.69), which changes to +214.53 after being encapsulated by CoO. The coating structure of CoO not only successfully changes the surface charge of SiO2 from negative to positive, but also provides sufficient buffer space for the volume effect of SiO2 through the formation of ring-shaped gaps. Furthermore, the ring-shaped gaps also facilities the insertion and extraction of lithium ions.
| Samples | SiO2 | SiO2@CoO | GS |
|---|---|---|---|
| Zeta potential (mV) | −5.69 | 214.53 | −44.5 ± 9.08 |
Fig. 4 displays SEM and TEM images of SiO2@CoO/GS. The graphene sheets form a three-dimensional porous network structure through interlayer cross-linking, proving multi-dimensional channels for rapid electrons and lithium ions transport (Fig. 4a). The CoO-coated SiO2 particles (SiO2@CoO) with a yolk–shell structure are uniformly distributed between the graphene layers and completely enveloped by graphene (Fig. 4b–d). Fig. 4e displays the sheet-like CoO on the surface of SiO2 in SiO2@CoO/GS. The diffraction stripes in Fig. 4f belong to the 200 and 220 crystal planes of CoO. Fig. 4g presents regular diffraction rings attributed to CoO (220, 200 and 110 crystal planes), SiO2 (111 crystal plane) and GS (002 crystal plane).
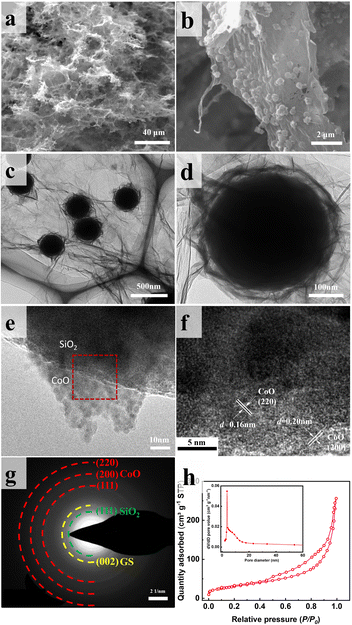 | ||
| Fig. 4 (a and b) SEM images, (c–e) TEM images, (f) HRTEM image, (g) SAED pattern and (h) BET image of SiO2@CoO/GS. | ||
Fig. S3† presents the EDS mapping images of SiO2@CoO/GS, showing the uniform distribution of carbon elements on the surface of SiO2@CoO, indicating the successful preparation of composite with graphene cladding. The pleated graphene cladding not only enhances interface electrical contact but also prevents particle agglomeration and provides effective cushioning space to alleviate stress and strain induced by volume changes in the electrode material during cycling.24
As a comparison, SiO2/GS was also prepared using self-made SiO2 and GO as raw materials via a similar method. As shown in Fig. S4,† SiO2 particles were completely agglomerated and do not form a graphene cladding structure. This clearly demonstrates that the surface coating of CoO on SiO2 plays a crucial role in modifying its surface properties and in the synthesis of composite materials with excellent structural characteristics.
The N2 adsorption–desorption isotherm of SiO2@CoO/GS is presented in Fig. 4h. The presence of mesoporous structures is indicated by the obvious hysteresis in the high relative pressure region.39 The Barrett–Joyner–Halenda (BJH) pore size of these pores ranges from approximately 2 to 10 nm (insert in Fig. 4h), mainly originating from the mesoporous structures present in the ring-shaped gaps between CoO and SiO2. Furthermore, a BET surface area of 107.86 m2 g−1 and a cumulative pore volume of 0.40 cm3 g−1 for SiO2@CoO/GS were determined. The mesoporous structure of SiO2@CoO/GS facilitates ions transfer and provides sufficient buffer space for the volume changes of SiO2.
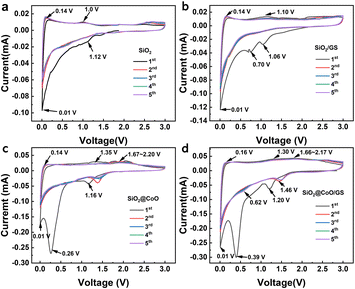
Fig. 5 presents the cyclic voltammetry (CV) curves of SiO2, SiO2@CoO, SiO2/GS and SiO2@CoO/GS at a scanning rate of 0.1 mV s−1. According to previous studies, the electrochemical reactions of CoO, SiO2 and GS with lithium can be described as follows:12,24,40–42
| SiO2 + 4Li+ + 4e− → 2Li2O + Si | (1) |
| 5SiO2 + 4Li+ + 4e− ↔ 2Li2Si2O5 + Si | (2) |
| 2SiO2 + 4Li+ + 4e− → Li4SiO4 + Si | (3) |
| Si + xLi+ + xe− ↔ LixSi | (4) |
| CoO + 2Li+ + 2e− ↔ Co + Li2O | (5) |
| 6C + Li+ + e− ↔ LiC6 | (6) |
For pure SiO2, the peak at 1.12 V is associated with the reduction of amorphous SiO2 to Si and the formation of Li2O, Li4SiO4 and Li2Si2O5 (eqn (1)–(3)). A weak peak observed at ∼0.01 V corresponds to the alloy reaction of Si (eqn (4)). In the charge process, a small peak at ∼0.14 V corresponds to the de-alloying of Li–Si and an oxidation peak around 1.0 V may be attributed to the reversible conversion reaction between Li2Si2O5 and SiO2 (eqn (2)).
SiO2/GS (Fig. 5b) exhibits similar oxidation-reduction peak positions to pure SiO2, with an additional reduction peak around 0.70 V attributed to the formation of a solid-electrolyte interphase (SEI) film on the surface of the graphene.
SiO2@CoO/GS (Fig. 5d) and SiO2@CoO (Fig. 5c) display similar peak positions. The reduction peak at ∼1.20 V in the first scan corresponds to the conversion reaction between SiO2 and Si (eqn (1)–(3)). From the second cycle onwards, the irreversible reactions disappear and the peak at 1.20 V shifts to around 0.62 V, corresponding to the reversible reaction in eqn (2). The peak at 0.39 V is attributed to the reduction of CoO to Co and the formation of the SEI film.12,41,43,44 This peak disappears in subsequent cycles and the conversion peak from CoO to Co shifts to 1.46 V.24,45 The peak around 0.01 V corresponds to the alloy reaction of Si. During charging, the weak peak at 0.16 V corresponds to the de-alloying of Li–Si, while the peak at 1.30 V corresponds to the reversible conversion reaction between Li2Si2O5 and SiO2. The peaks from 1.66 to 2.17 V indicate the oxidation of Co metal during de-lithiation.24,44 Compared with SiO2 and SiO2/GS, the intensity of the main reduction peak (∼0.01 V) corresponding to the lithiation reactions of Si in SiO2@CoO and SiO2@CoO/GS are significantly higher and their integrated area of the cyclic voltammetry curves are larger (Fig S5†), indicating that the materials with CoO have higher reactivity and lithium storage capacity. This may be related to the catalysis effect of Co metal which reduced from CoO. The generated Co not only activate SiO2 by breaking the Si–O bonds, thereby promoting the conversion reaction of SiO2 to Si, but also catalyze the lithiation reaction of Si.11,24,45 In addition, Co metal can also collaborate with graphene to provide fast electron transfer channels for materials, thereby further enhancing their lithium storage performance.
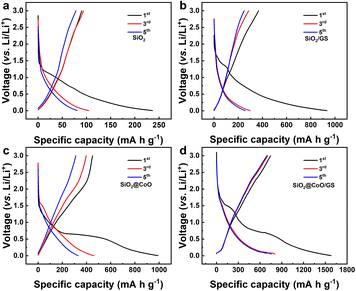
Fig. 6 shows the charge/discharge voltage profiles of pure SiO2, SiO2/GS, SiO2@CoO and SiO2@CoO/GS for the 1st, 3rd and 5th cycles at a current density of 50 mA g−1. The slopes and plateaus in the charge/discharge of these materials correspond closely to the peak positions in respective CV curves. In the first discharge process of SiO2@CoO/GS (Fig. 6d), the discharge plateau around 1.48 V corresponds to the lithiation reaction of SiO2, while the plateau around ∼0.6 V mainly due to the lithiation of CoO and the formation of the SEI film. The irreversible phases formed during the first cycle, such as Li2O and Li4SiO4, along with the generation of the SEI film, consume significant amount of lithium, leading to the low initial coulomb efficiency.46,47 The plateau around ∼0.1 V in the charge process is mainly attributed the conversion reaction of Si to LixSi, which is the main source of reversible capacity. The first discharge capacity of SiO2@CoO/GS can reach 1579 mA h g−1 with a charge capacity of 746 mA h g−1 and coulombic efficiency of 47.2%. The first discharge/charge capacities/coulombic efficiencies of SiO2 (Fig. 6a), SiO2/GS (Fig. 6b) and SiO2@CoO (Fig. 6c) are 236 mA h g−1/89 mA h g−1/37%, 933 mA h g−1/368 mA h g−1/39.4% and 992 mA h g−1/449 mA h g−1/45.2%, respectively.
It can be concluded that SiO2@CoO/GS exhibits higher capacity and coulombic efficiency, mainly due to two reasons: (1) catalytic activation effect of Co metal on SiO2 effectively increases the revers of the reactions, enhancing the coulombic efficiency; (2) the graphene-coated structure enhances the dispersion and conductivity of the material, increases the effective active surface area and thus improves the storage capacity of lithium.
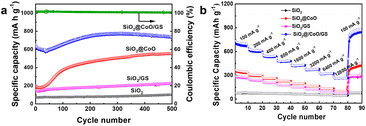
Fig. 7a illustrates the cycling performance of SiO2@CoO/GS, SiO2@CoO, SiO2/GS and SiO2. All cells underwent an activation process at 50 mA g−1 for 5 cycles before each test. SiO2@CoO/GS demonstrates the best cycling stability among the electrode materials, maintaining a specific capacity of 738 mA h g−1 after 500 cycles at a current density of 200 mA g−1, far surpassing SiO2@CoO (558 mA h g−1), SiO2/GS (223 mA h g−1) and SiO2 (103 mA h g−1). The capacity increase observed with cycling for all four materials is a common phenomenon in silicon-based materials, attributed to the activation process and gradual pulverization of larger particles into smaller ones during cycling.12,26,42,47,48 A notable observation is the significant capacity increase for SiO2@CoO/GS and SiO2@CoO further confirm the catalytic activation effect of the Co metal on SiO2. Compared to SiO2@CoO, SiO2@CoO/GS has a smoother capacity increase curve, which is mainly attributed to the graphene-wrapped structure. It effectively suppresses the excessive expansion of SiO2@CoO particles, resulting in more stable cycling performance.
To assess electrode kinetics, the rate capabilities of SiO2@CoO/GS, SiO2@CoO, SiO2/GS and SiO2 anodes were examined at different current densities ranging from 100 to 12![[thin space (1/6-em)]](https://www.rsc.org/images/entities/char_2009.gif) 800 mA g−1 in Fig. 7b. All cells were activated at 50 mA g−1 for 5 cycles prior to the rate tests. The SiO2@CoO/GS anode exhibits discharge capacities of 707, 617, 543, 480, 426, 374, 322 and 264 mA h g−1 at current densities of 100, 200, 400, 800, 1600, 3200, 6400 and 12
800 mA g−1 in Fig. 7b. All cells were activated at 50 mA g−1 for 5 cycles prior to the rate tests. The SiO2@CoO/GS anode exhibits discharge capacities of 707, 617, 543, 480, 426, 374, 322 and 264 mA h g−1 at current densities of 100, 200, 400, 800, 1600, 3200, 6400 and 12![[thin space (1/6-em)]](https://www.rsc.org/images/entities/char_2009.gif) 800 mA g−1, respectively. Furthermore, upon reverting the current density back to 100 mA g−1, the reversible capacity can recover to 866 mA h g−1, showcasing the exceptional rate capability of the SiO2@CoO/GS anode. The cycling and rate performance of the SiO2@CoO/GS synthesized in this work have been compared with those of other silicon-based composites reported in the literature, and the results are summarized in Table S2.† Compared to other silicon-based composites, the SiO2@CoO/GS prepared in this study demonstrates superior cycling stability and rate capability.
800 mA g−1, respectively. Furthermore, upon reverting the current density back to 100 mA g−1, the reversible capacity can recover to 866 mA h g−1, showcasing the exceptional rate capability of the SiO2@CoO/GS anode. The cycling and rate performance of the SiO2@CoO/GS synthesized in this work have been compared with those of other silicon-based composites reported in the literature, and the results are summarized in Table S2.† Compared to other silicon-based composites, the SiO2@CoO/GS prepared in this study demonstrates superior cycling stability and rate capability.
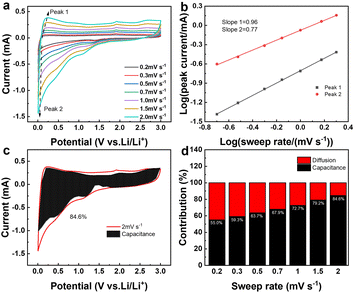
Fig. 8a presents the cyclic voltammetry (CV) curves of SiO2@CoO/GS at scan rates of 0.2, 0.3, 0.5, 0.7, 1.0, 1.5 and 2.0 mV s−1. Based on the equation of Ip = avb,49 the correlation between peak current (Ip) and scan rate (v) is determined to ascertain the b value for the anodic and cathodic peaks of SiO2@CoO/GS, as shown in Fig. 8b. The slope b for the anode and cathode peaks of the SiO2@CoO/GS composite are found to be 0.96 and 0.77, respectively, indicating the coexistence of diffusion-controlled and capacitance processes.50 The ratio of capacitive contribution to diffusion-controlled contribution can be calculated using the equation I = K1v + K2v1/2.49 Fig. 8c demonstrates that the capacitive-dominated contribution rate reaches 84.6% for the SiO2@CoO/GS composite at a scan rate of 2.0 mV s−1. Furthermore, the capacitive-dominated rate of SiO2@CoO/GS increases with the scan rate ranging from 0.2 to 2.0 mV s−1, as illustrated in Fig. 8d. The exceptional rate performance of SiO2@CoO/GS can be attributed to the pseudo capacitance-dominated storage mechanism.34,51 The presence of this mechanism contributes significantly to the battery's outstanding rate capability.
The electrodes after 40 cycles were further investigated using TEM to explore the structural stability of SiO2@CoO/GS. As shown in Fig. S6a and b,† the particle size of pure SiO2 sphere and SiO2 in SiO2/GS composite show little changes, indicating low reactivity of SiO2 with Li+ ions. Only a small percentage of surface SiO2 participates in reactions without activation, resulting in very low capacity. In contrast, SiO2@CoO electrode material exhibits significant volume changes after cycling due to the catalytic and activation effects of CoO, leading to more SiO2 participating in lithiation/delithiation reactions and causing larger volume changes. When SiO2@CoO is further coated with graphene sheets (GS), the volume changes of the particles are effectively controlled, benefiting from the encapsulation effect of GS. This is the primary reason why SiO2@CoO/GS exhibits relatively stable cycling performance when compared to SiO2@CoO material.
4 Conclusion
In summary, SiO2@CoO/GS with a 3D cross-linked graphene-wrapped yolk–shell structure was successfully fabricated by implementing surface modification and a solvothermal electrostatic self-assembly process. Coating CoO onto the surface of SiO2 serves two main purposes: Firstly, it modifies the negatively charged SiO2 surface to a positively charged one, establishing effective electrostatic interactions between SiO2@CoO and GO for the preparation of composites with uniformly dispersed particles and well-formed graphene-encapsulated structure. Secondly, the Co metal formed during charge/discharge processes can act as a catalyst and electron transfer mediator, positively affecting the lithiation activity of SiO2 and enhancing its conductivity, thus improving the lithium storage capacity of SiO2. Subsequently, through the solvothermal process, positively modified SiO2@CoO particles are introduced into the 3D graphene, resulting in an anode material, SiO2@CoO/GS, with uniform particle dispersion and a 3D cross-linked graphene-wrapped yolk–shell structure. The 3D network structure of graphene provides multiple transfer channels for electrons and ions, while the graphene-wrapped yolk–shell structure effectively mitigates the volume effects of SiO2. Therefore, under the dual effects of Co catalytic activation and graphene-encapsulated structure, the SiO2@CoO/GS composite exhibits excellent electrochemical performance, with an initial discharge capacity of up to 1579 mA h g−1 and a specific capacity of 739 mA h g−1 after approximately 500 cycles at a current density of 200 mA g−1. Additionally, it demonstrates outstanding rate capability, maintaining a capacity of 206 mA h g−1 at a high current density of 12.8 A g−1.Data availability
The original contributions presented in the study are included in the article/ESI;† further inquiries can be directed to the corresponding author/s.Author contributions
J. J. Ma and S. T. Yang conceived the project. J. J. Ma and J. W. Yong designed the research scheme. J. W. Yong conducted the material synthesis, electrochemical tests, and material characterization. J. J. Ma and J. W. Yong wrote the original manuscript and analyzed most of the experimental data with the help of H. Y. Niu, Y. C. Li, and H. S. Zhang. X. N. Li performed the STEM test. S. T. Yang, Y. S. He, and Z. F. Ma reviewed the manuscript and provided the major revisions. All authors discussed the results and commented on the manuscript.Conflicts of interest
There are no conflicts to declare.Acknowledgements
We are grateful for the financial support from the National Natural Science Foundation of China (21703057, 82271027), the Henan Postdoctoral Science Foundation (1902040), the Foundation of the Programs for Science and Technology Development of Henan province (242102241006, 242102241004).Notes and references
- N. Xu, T. Qian, X. Liu, J. Liu, Y. Chen and C. Yan, Nano Lett., 2017, 17, 538–543 CrossRef PubMed.
- L. Li, Y. Deng, K. Hu, B. Xu, N. Wang, Z. Bai, X. Xu and J. Yang, Prog. Nat. Sci.: Mater. Int., 2023, 33, 16–36 CrossRef.
- H. Lund, Energy, 2007, 32, 912–919 CrossRef.
- Y. Jin, S. Li, A. Kushima, X. Zheng, Y. Sun, J. Xie, J. Sun, W. Xue, G. Zhou, J. Wu, F. Shi, R. Zhang, Z. Zhu, K. So, Y. Cui and J. Li, Energy Environ. Sci., 2017, 10, 580–592 RSC.
- G. Lee, S. Kim, S. Kim and J. Choi, Adv. Funct. Mater., 2017, 27, 1703538 CrossRef.
- U. Kasavajjula, C. Wang and A. J. Appleby, J. Power Sources, 2007, 163, 1003–1039 CrossRef.
- Y. Liu, S.-X. Jing, S.-H. Luo and S.-H. Li, Nat. Prod. Rep., 2019, 36, 626–665 RSC.
- X. Jiao, J. Yin, X. Xu, J. Wang, Y. Liu, S. Xiong, Q. Zhang and J. Song, Adv. Funct. Mater., 2021, 31, 2005699 CrossRef.
- H. Wu and Y. Cui, Nano Today, 2012, 7, 414–429 CrossRef.
- W.-S. Chang, C.-M. Park, J.-H. Kim, Y.-U. Kim, G. Jeong and H.-J. Sohn, Energy Environ. Sci., 2012, 5, 6895 RSC.
- C. Tang, Y. Liu, C. Xu, J. Zhu, X. Wei, L. Zhou, L. He, W. Yang and L. Mai, Adv. Funct. Mater., 2018, 28, 1704561 CrossRef.
- S. Hou, M. Liao, Y. Guo, T. Liu, L. Wang, J. Li, C. Mei, W. Fu and L. Zhao, Appl. Surf. Sci., 2020, 530, 147223 CrossRef.
- Y. Zhang, Y. Li, Z. Wang and K. Zhao, Nano Lett., 2014, 14, 7161–7170 CrossRef PubMed.
- Y. An, H. Fei, G. Zeng, L. Ci, S. Xiong, J. Feng and Y. Qian, ACS Nano, 2018, 12, 4993–5002 CrossRef PubMed.
- N. Liu, L. Hu, M. T. McDowell, A. Jackson and Y. Cui, ACS Nano, 2011, 5, 6487–6493 CrossRef PubMed.
- J. Ryu, S. Choi, T. Bok and S. Park, Nanoscale, 2015, 7, 6126–6135 RSC.
- J. Yoo, J. Kim, Y. S. Jung and K. Kang, Adv. Mater., 2012, 24, 5452–5456 CrossRef PubMed.
- Z. Luo, Q. Xiao, G. Lei, Z. Li and C. Tang, Carbon, 2016, 98, 373–380 CrossRef CAS.
- H. Jia, J. Zheng, J. Song, L. Luo, R. Yi, L. Estevez, W. Zhao, R. Patel, X. Li and J.-G. Zhang, Nano Energy, 2018, 50, 589–597 CrossRef CAS.
- H. Zhang, L. Zhou, O. Noonan, D. J. Martin, A. K. Whittaker and C. Yu, Adv. Funct. Mater., 2014, 24, 4337–4342 CrossRef CAS.
- L. Zhang, K. Zhao, W. Xu, Y. Dong, R. Xia, F. Liu, L. He, Q. Wei, M. Yan and L. Mai, Phys. Chem. Chem. Phys., 2015, 17, 7619–7623 RSC.
- S. Mohapatra, S. V. Nair, D. Santhanagopalan and A. K. Rai, Electrochim. Acta, 2016, 206, 217–225 CrossRef CAS.
- J. Meng, Y. Cao, Y. Suo, Y. Liu, J. Zhang and X. Zheng, Electrochim. Acta, 2015, 176, 1001–1009 CrossRef.
- Q. An, X. Sun, Y. Na, S. Cai and C. Zheng, Chin. Chem. Lett., 2023, 34, 107305 CrossRef.
- X. Zhou, Y. Yin, L. Wan and Y. Guo, Adv. Energy Mater., 2012, 2, 1086–1090 CrossRef.
- J. Ma, H. Zhang, R. Liu, W. Zhang, S. Han, J. Han, G. Xu, L. Li, Y.-S. He and Z.-F. Ma, Sci. China Mater., 2023, 66, 493–504 CrossRef.
- G.-W. Zhou, J. Wang, P. Gao, X. Yang, Y.-S. He, X.-Z. Liao, J. Yang and Z.-F. Ma, Ind. Eng. Chem. Res., 2013, 52, 1197–1204 CrossRef.
- R. Wang, C. Xu, J. Sun, L. Gao and H. Yao, ACS Appl. Mater. Interfaces, 2014, 6, 3427–3436 CrossRef PubMed.
- R. Wang, C. Xu, M. Du, J. Sun, L. Gao, P. Zhang, H. Yao and C. Lin, Small, 2014, 10, 2260–2269 CrossRef PubMed.
- Y. Sun, X. Hu, W. Luo and Y. Huang, J. Phys. Chem. C, 2012, 116, 20794–20799 CrossRef.
- Y. Qi, H. Zhang, N. Du and D. Yang, J. Mater. Chem. A, 2013, 1, 2337 RSC.
- Y. Yang, E. Shi, P. Li, D. Wu, S. Wu, Y. Shang, W. Xu, A. Cao and Q. Yuan, Nanoscale, 2014, 6, 3585 RSC.
- M. Jae Kwon, H. Jung and J. Hoon Park, J. Phys. Chem. Solids, 2012, 73, 1448–1451 CrossRef.
- J. Ma, H. Zhang, Y. Li, L. Hu, Q. Wang, W. Zhang, L. Yang, G.-R. Xu, Y.-S. He, T. Lou and Z.-F. Ma, Green Chem. Eng., 2021, 2, 327–335 CrossRef.
- N. A. Mahat, N. S. M. Nor and S. A. Shamsudin, J. Inorg. Organomet. Polym., 2022, 32, 2428–2440 CrossRef CAS.
- C. Zhao, L. Wu, X. Wang, S. Weng, Z. Ruan, Q. Liu, L. Lin and X. Lin, Carbon, 2020, 163, 70–84 CrossRef CAS.
- X. Yuan, L. Li, Z. Ma, X. Yu, X. Wen, Z.-F. Ma, L. Zhang, D. P. Wilkinson and J. Zhang, Sci. Rep., 2016, 6, 20005 CrossRef CAS PubMed.
- Y. Zhang, L. Sun, Y. Li, Y. Shi, J. Gu, L. Zhang, X. Li, H. Si, C. Sun and Y. Zhang, J. Electroanal. Chem., 2020, 873, 114441 CrossRef CAS.
- G. Wang, Z. Wen, Y.-E. Yang, J. Yin, W. Kong, S. Li, J. Sun and S. Ji, J. Mater. Chem. A, 2018, 6, 7557–7565 RSC.
- D. Shen, C. Huang, L. Gan, J. Liu, Z. Gong and M. Long, ACS Appl. Mater. Interfaces, 2018, 10, 7946–7954 CrossRef CAS.
- W. Zhang, S. Mao, J. Xu, Q. Xu, M. Zhang, J. Zhou, L. Song, R. Guan and L. Yue, Electrochim. Acta, 2018, 291, 206–215 CrossRef CAS.
- R. Yu, R. Jiang and Z. Zhou, J. Alloys Compd., 2023, 937, 168324 CrossRef CAS.
- S. Wang, J. Teng, Y. Xie, Z.-W. Wei, Y. Fan, J.-J. Jiang, H.-P. Wang, H. Liu, D. Wang and C.-Y. Su, J. Mater. Chem. A, 2019, 7, 4036–4046 RSC.
- J. Ma, J. Wang, Y.-S. He, X.-Z. Liao, J. Chen, J.-Z. Wang, T. Yuan and Z.-F. Ma, J. Mater. Chem. A, 2014, 2, 9200–9207 RSC.
- Y. Shen, Z. Cao, Y. Wu, Y. Cheng, H. Xue, Y. Zou, G. Liu, D. Yin, L. Cavallo, L. Wang and J. Ming, J. Mater. Chem. A, 2020, 8, 12306–12313 RSC.
- N. Yan, F. Wang, H. Zhong, Y. Li, Y. Wang, L. Hu and Q. Chen, Sci. Rep., 2013, 3, 1568 CrossRef.
- X. Ma, Z. Wei, H. Han, X. Wang, K. Cui and L. Yang, Chem. Eng. J., 2017, 323, 252–259 CrossRef.
- K. Wang, X. Zhu, Y. Hu, S. Qiu, L. Gu, C. Wang and P. Zuo, Carbon, 2020, 167, 835–842 CrossRef.
- G. A. Muller, J. B. Cook, H.-S. Kim, S. H. Tolbert and B. Dunn, Nano Lett., 2015, 15, 1911–1917 CrossRef PubMed.
- K. Ma, H. Jiang, Y. Hu and C. Li, Adv. Funct. Mater., 2018, 28, 1804306 CrossRef.
- J. Ma, H. Zhang, Y. Xin, S. Liu, Y. Li, L. Yang, G. Xu, T. Lou, H. Niu and S. Yang, Dalton Trans., 2021, 50, 1703–1711 RSC.
Footnote |
| † Electronic supplementary information (ESI) available. See DOI: https://doi.org/10.1039/d4ra04236k |
| This journal is © The Royal Society of Chemistry 2024 |

