DOI:
10.1039/D4RA04313H
(Paper)
RSC Adv., 2024,
14, 26016-26031
High performance B2O3/MWCNTs and TiB/MWCNTs nano-adsorbents for the co-sorption of cyanide and phenol from refinery wastewater†
Received
12th June 2024
, Accepted 29th June 2024
First published on 19th August 2024
Abstract
The refinery industry has witnessed tremendous activity aimed at producing petrochemicals for the benefit of the teeming populace. These activities are accompanied by the discharge of wastewater containing chemical substances and elements that have negative impacts on the ecosystem. The presence of phenol and cyanide contaminants in refinery wastewater poses serious health hazards to humans, necessitating their removal. In this study, boron oxide-doped multi-walled carbon nanotubes (B2O3/MWCNTs) and titanium boride-doped MWCNT (TiB/MWCNTs) nanoadsorbents were prepared via a wet impregnation method and characterized using High-Resolution Transmission Electron Microscopy (HR-TEM), X-Ray Diffraction (XRD), and X-ray Photoelectron Spectroscopy (XPS). HR-TEM images depict the nanostructure of the nanoadsorbent, the presence of doped materials, and the internal, external, and wall thickness of B2O3/MWCNTs and TiB/MWCNTs nanoadsorbents. XRD results indicate that the nanomaterials were monocrystalline with average crystallite sizes of 22.75 nm and 16.79 nm for B2O3/MWCNTs and TiB/MWCNTs, respectively. The formation of B2O3 and TiB was observable in the results obtained from the XPS at the binding energy of 192 and 193.1 eV, respectively. The application of the produced B2O3/MWCNTs and TiB/MWCNTs nanoadsorbents for the removal of phenol and cyanide from refinery wastewater was explored in a batch adsorption system. The effects of contact time, adsorbent dosage, and adsorption temperature were investigated. To the best of our knowledge, the incorporation of B2O3 and TiB in MWCNTs resulted in the highest adsorption capacities for phenol and cyanide from aqueous solutions. The highest percentage removal of 100% for phenol and 99.06% for cyanide was observed for the TiB/MWCNTs nanoadsorbent at a residence time of 70 minutes, a temperature of 60 °C, and 0.3 g of adsorbent. The isotherm models show that cyanide and phenol removal obeyed the Langmuir isotherm, indicating monolayer adsorption over B2O3/MWCNTs nanoadsorbent. Furthermore, cyanide and phenol removal depict multilayer adsorption on the TiB/MWCNT nanoadsorbent. The research shows that B2O3/MWCNTs are proficient in cyanide sorption, while TiB/MWCNT favors phenol sorption due to their respective adsorption capacities.
1. Introduction
Water is one of the most essential commodities upon which living organisms depend and the search for potable water for man, animals and for agricultural activities is on the increase.1,2 Industrial activities among other channels of water pollution have led to the deterioration of water quality due to the discharge of toxic pollutants into the water bodies and the surrounding land use thereby, rendering the water unfit for use.3,4 Petrochemical industries are one of the sources which contribute to the discharge of pollutants such as phenol and cyanide into the environment.5,6 These pollutants are hazardous to human health causing death even at a minute concentration of inhalation. Phenol and cyanide are considered to be rather toxic to humans through oral exposure from contaminated water.7 The long-time exposure of humans to phenol has been characterized by weight loss, salivation, diarrhoea, and anorexia while chronic exposure has been linked to liver and blood effects in humans.8 According to ref. 9, weakness, muscle pain, high levels of liver enzymes and increased liver were observed after inhalation of phenol. Therefore, there is a need to develop an efficient wastewater purification system that favours the removal of cyanide and phenol from wastewater before discharging it into the surrounding ecosystem.
Recently, water purification has attracted enormous attention from researchers and environmental scientists towards devising efficient and effective water purification techniques.10,11 Various techniques for the removal of phenol and cyanide from wastewater have been reported however the application of adsorption process has attracted wider interest. This is due to its effectiveness, efficiency, reduced cost of production, operation and maintenance, and requires little expertise to manage.12 Adsorption technique for water purification requires the development of adsorbents with tailored characteristics and properties for the removal of the intended pollutants from wastewater. The use of nano-adsorbents for pollutants removal from wastewater has proven to be more efficient and effective due to its remarkable properties such as high surface area, and ability to form complexes with sorbates.13,14
Several adsorbents such as ZnO, MgO, activated carbon, zeolites, kaolin, and chitosan have been widely employed for wastewater treatment.10–15 Nano-sized materials have attracted the interest of many researchers owing to their improved adsorption behaviour coupled with the enormously swift adsorption towards the removal of impurities.15 Nthunya et al.16 studied the removal of phenol onto electro spin chitosan based nanofibers developed by fibre electrospinning methods and tested towards the sorption of 3-methyl-4-nitrophenol from aqueous solutions in a batch adsorption process. The result showed that 90% of the sorbent was removed at the optimum pH of 5–7, an adsorbent dose of 350 mg, and 150 min contact time, in the first cycle of the adsorption. Also, the application of activated supported clay composite beads was reported for the adsorptive removal of phenol from wastewater.17 From the report of the research, highest absorption capacity of 132.28 mg g−1 of phenol was obtained over the developed activated carbon at the temperature of 650 °C. The effective performance of the activated carbon at the reported optimum condition could be associated with the improved surface area, pore volume and the reduced average pore diameter of 1669.9 m2 g−1, 0.991 cm3 g−1 and 2.28 nm respectively. The need to produce an effective adsorbent with improved functional groups towards the simultaneous removal of phenol and cyanide is necessary.
Carbon nanotubes (CNTs), a group of carbon nanomaterials with tubular structures with hexagonal carbon atoms bonded covalently have shown higher efficiencies in the removal of oil and toxic organic compounds from wastewater.18 CNTs due to their high specific surface area, easy functionalization, and chemical stability have attracted a great deal of attention in wastewater treatment.19 The functionalization of carbon nanotubes has been reported to improve the sorption properties during adsorption process.20,21 Multiwalled carbon nanotubes/titanium oxide nanocomposites have been employed for the removal of cyanide and phenol from wastewater.22 The use of sponge-like light-weight MWCNTs has been reported for the effective cleaning of oil-spill water by Gui et al.23 The result presented indicated that, the adsorbent adsorbed 180 times of its initial weight. Although, the quantity of cyanide and phenol adsorbed were not reported. The application of boron and TiB modified carbon nanotubes has not been reported so far for their potency for improved refinery wastewater purification towards the removal of phenol and cyanide as far as literature is concern. To leverage on the presented qualities of boron-doped carbon nanotubes for oxygen reduction reaction as reported by Cheng et al.,24 the need to channel the defect nature of CNTs's walls due to boron doping for enhanced sorption of phenol and cyanide require further studies.
In the present research, MWCNTs were modified through the incorporation of B2O3 and TiB into the bulk of the material to improve its surface properties towards increased adsorption behaviour via the wet impregnation method. The formed nanocomposite B2O3/MWCNTs and TiB/MWCNTs were applied as adsorbents for the simultaneous sorption of phenol and cyanide from refinery wastewater in a batch adsorption system. The effects of contact time, mass of adsorbents and temperature were performed while the data obtained were subjected to different kinetic and isotherms model and thermodynamic studies. The application of the developed B2O3/MWCNTs and TiB/MWCNTs for the simultaneous sorption of phenol and cyanide were also investigated.
2. Methodology
2.1 Materials
All the chemicals used in this study were of analytical grade. Such chemicals include boric acid from Sigma Aldrich (99.5% purity) and distilled water. The synthesis and properties of the MWCNTs and TiO2 used in this present study have been presented elsewhere.22
2.2 Development of B2O3/MWCNTs nanoparticles
A 10 wt% of boric acid was dissolved in 50 mL distilled water. To the solution formed, 90 wt% of MWCNTs was impregnated, stirred constantly at 800 rpm using a magnetic stirrer. The formed mixture was dried at 110 °C for a period of 10 h in an oven. The obtained powdered was grinded, sieved via 150 μm sieve then analysed for its surface properties.
2.3 Synthesis of TiB/MWCNTs nanoparticles
In the synthesis process, a known weight ratio of 90![[thin space (1/6-em)]](https://www.rsc.org/images/entities/char_2009.gif) :10 wt% (g g−1) of the MWCNTs/TiO2 to boric acid was mixed in 50 mL of distilled water and stirred constantly at 800 rpm using a magnetic stirrer. The resulting mixture was dried at 110 °C for 10 h. The produced TiB/MWCNTs adsorbent was grounded, sieved through a 150 μm sieve size and characterized before application.
:10 wt% (g g−1) of the MWCNTs/TiO2 to boric acid was mixed in 50 mL of distilled water and stirred constantly at 800 rpm using a magnetic stirrer. The resulting mixture was dried at 110 °C for 10 h. The produced TiB/MWCNTs adsorbent was grounded, sieved through a 150 μm sieve size and characterized before application.
2.4 Collection of wastewater sample/phenol and cyanide content determination
The wastewater used in this study was sourced at the discharge point of the refinery plant. The sample was collected at three different points then, mixed together to ensure homogeneity and to aid the overall representation of the population and kept in amber bottle in a freezer prior to use. The initial concentration of cyanide and phenol in the collected wastewater was analysed via titrimetric method and UV-spectroscopy, respectively. The total bacterial counts (cfu mL−1) was determined using spread plate technique, where a serial dilution was carried out in the folds of 10 mL and 0.1 mL was removed and spread over the surfaces of agar. The formation of colony due to the dispersed cells were observed and counted following the incubation period. The counted colonies on the surface of the agar are then multiplied with the dilution factor to give the total number of bacterial counts (cfu mL−1).
2.5 Determination of cyanide content in the refinery wastewater
The EPA (1994) and APHA (1998) approved methods for the determination of total cyanide in wastewater was adopted. Distillation was first carried out followed by the addition of pyridine–barbituric acid to give a red-blue coloured complex and the absorbance was measured in a UV spectrophotometer at 578 nm.25
2.6 Determination of phenol content in the refinery wastewater
A total of 10 mL of the wastewater was drawn into a volumetric flask and then mixed with 10 mL distilled water and 1.5 mL of Folin–Ciocalteu (F–C) reagent. A solution of 4 mL of 20% (w/v) sodium carbonate was added after 5 minutes and the volume was made up to 25 mL using double distilled water. The absorbance was recorded at 765 nm, after 30 minutes. The percentage of total phenol was estimated from the calibration curve of gallic acid plotted using the same procedure and the concentration of phenol was expressed.26
2.7 Adsorption studies
2.7.1 Adsorption of cyanide and phenol from the wastewater. The synthesized nano-hybrid B2O3/MWCNTs and TiB/MWCNTs were employed as adsorbents for the sorption of phenol and cyanide from refinery wastewater. The effects of contact time (10–80 min), adsorbent dosage (0.05–0.35 g) and temperature (30–80 °C) in 50 mL refinery wastewater corked conical flask were studied to determine the removal efficiencies and adsorption capacity of the sorbents developed. The obtained results in all the effects studied were used in the kinetic, thermodynamics and isotherm studies.
2.7.2 Effects of adsorption parameters on the sorption of phenol and cyanide. The effects of the adsorption parameters were studied on the percentage removal of phenol and cyanide from the refinery wastewater by varying the contact time, temperature and the mass of adsorbent used. The data obtained were used for kinetic, thermodynamic and isotherm studies respectively.
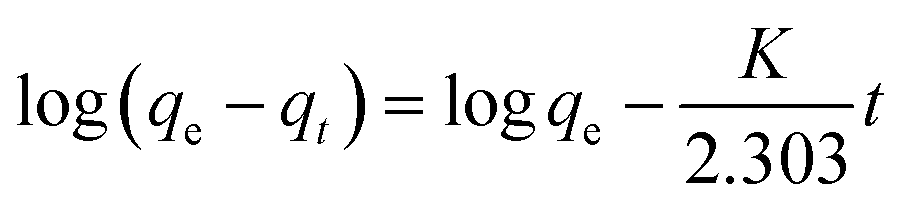
2.8 Kinetic study of adsorption process
2.8.2 Pseudo-second order kinetics model. In determining the pseudo-second-order kinetics of the sorption process, eqn (4) was applied.| |
 | (4) |
Eqn (4) is further reduced to eqn (5) by considering boundary conditions (t = 0 to t = t and qt = 0 to qt = qt) into a linearized form.
| |
 | (5) |
Through rearrangement, eqn (5) gives eqn (6).
| |
 | (6) |
The initial sorption rate at qt equals zero could be assigned to h (mg g−1 min−1). Hence,
| |
 | (7) |
2.8.3 Elovich model. The Elovich model is depicted with the eqn (8).| |
 | (8) |
where the qt depicts the initial rate of the sorbate in mg min−1 as dqt/qt approaches βe when the qt=0. βe is related to the activation energy degree and the surface coverage for a chemisorption process (g mg−1). From previous studies, the Elovich model is related to the pseudo-second order kinetic by assuming that the surfaces of the sorbent are heterogeneous. The Elovich parameters such as the β and α are obtained from the intercept and the slope of the plot of qt on the vertical axis against the ln t on the horizontal axis.
2.9 Isotherm study
2.9.1 Freundlich isotherm model. The Freundlich isotherm models could either be linear or non-linear models. The non-linear Freundlich isotherm is expressed in eqn (9) while the linear form is shown in eqn (10).| |
 | (10) |
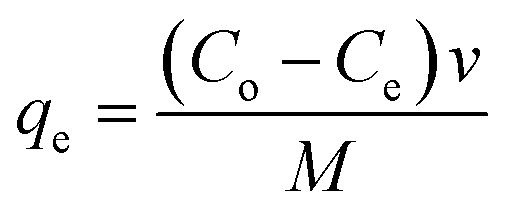
where qe represents the equilibrium quantity that exists between the solid phase ion concentrations in the process (mg L−1) and Ce is the equilibrium concentration in the liquid phase ion concentration (mg L−1). The plot of logqe against logCe gives a very important information with the slope and intercept used to determine the constants of the Freudlich model.
2.9.2 Langmuir isotherm model. The non-linear form of Langmuir isotherm model is expressed in eqn (11).| |
 | (11) |
Eqn (11) gives eqn (12) after linearizing.
| |
 | (12) |
The plot of 1/qe against 1/Ce depicts the representation of the model. The slope and the intercept of the curve give the kL and aL. respectively.
2.10 Thermodynamics study
The thermodynamic study depicts the spontaneous nature of the sorption process using the quantities such as the change in the enthalpy (ΔH°), change in Gibb's free energy (ΔG°) and change in the entropy (ΔS°) of the sorption system.| |
 | (13) |
where Kc implies the equilibrium constant, R represents the gas constant (8.314 J mol−1 K−1) and T is the absolute temperature in K.
3. Results and discussion
3.1 Characterization of B2O3/MWCNTs and TiB/MWCNTs nanoadsorbent
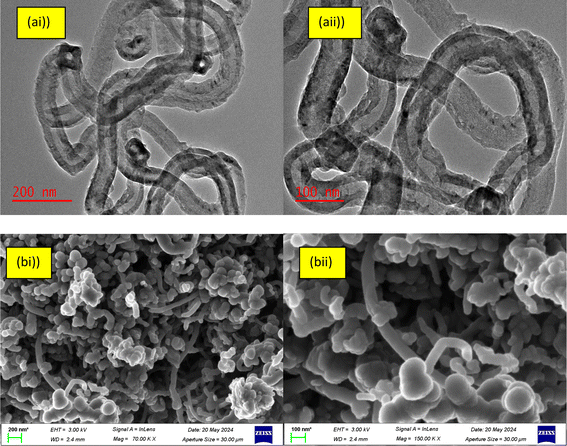
Fig. 1 shows the microstructure and surface morphology of the developed TiB/MWCNTs adsorbent examined using HRTEM and HRSEM.
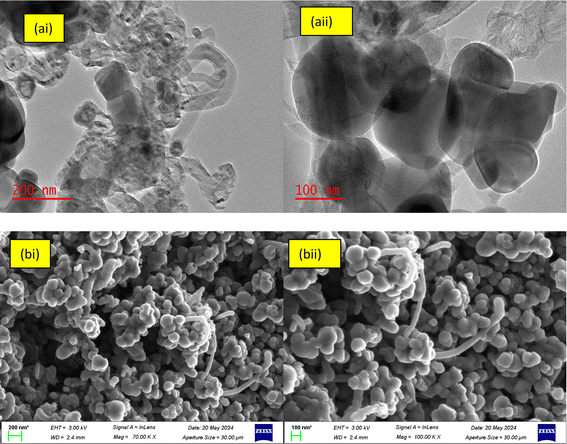 |
| | Fig. 1 HRTEM (ai and aii) and HRSEM (bi and bii) micrographs of the developed TiB/MWCNTs nanosorbent at different magnification (a) and (b). | |
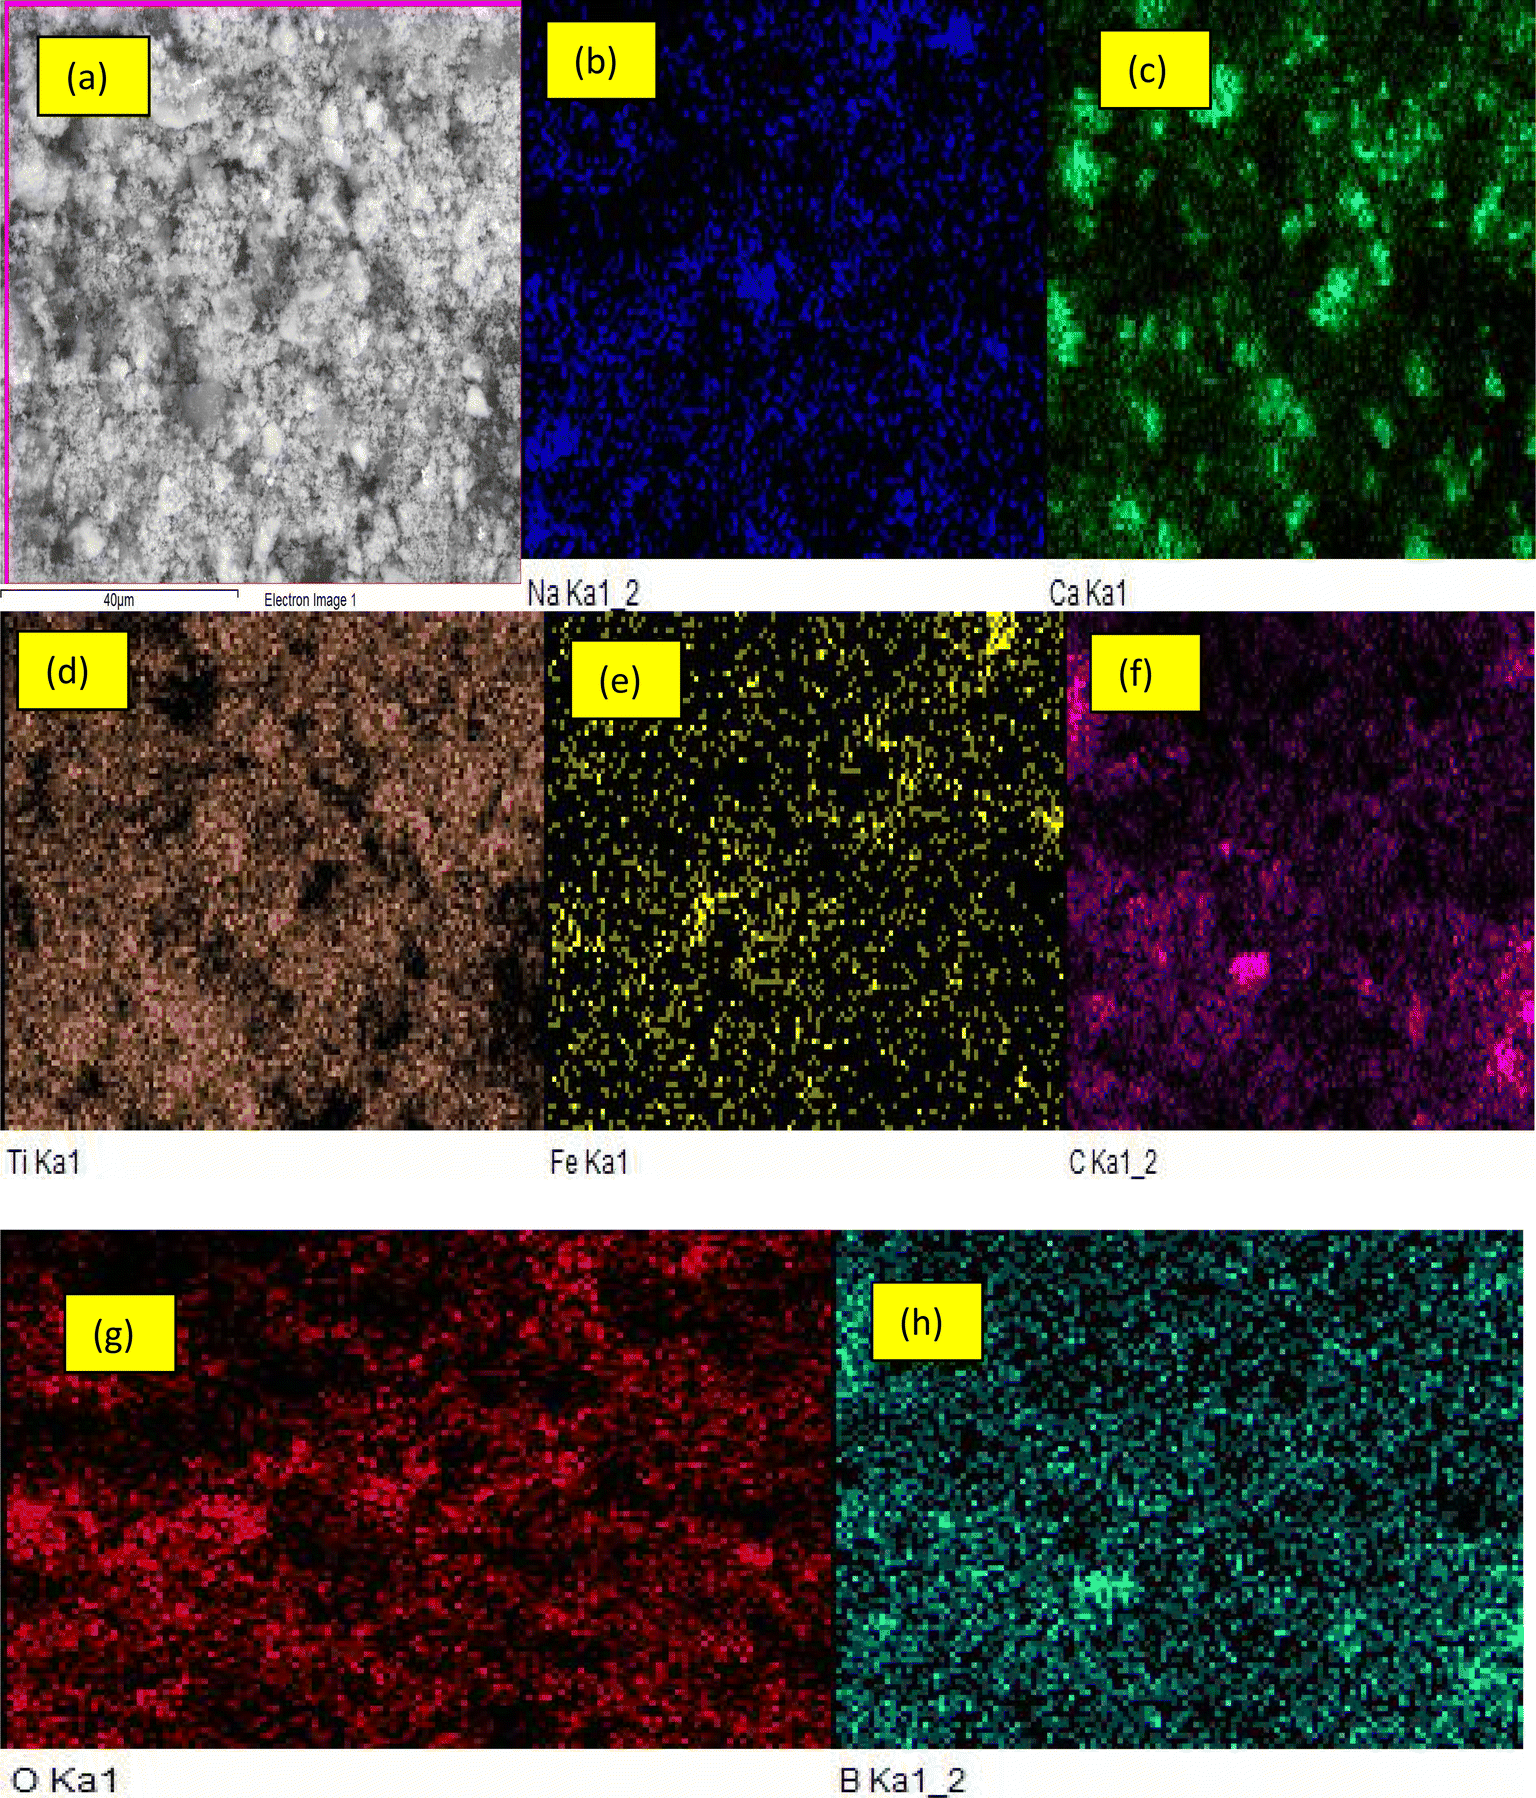
From Fig. 1(ai), spherical shaped TiO2 nanoparticles and the boron-particles were deposited, dispersed and distributed on both the surface and the inner pores of the MWCNTs-based materials. Boron with smaller ionic radius (85 pm) diffuse easily on the inner pores of the carbonaceous material with ionic radius of 170 pm. While particles of titanium with higher ionic radius (187 pm) were deposited at the outer layer of multi-walled carbon nanotubes. It's noteworthy mentioning that the deposition of the TiO2 and the boron-containing compound are mostly observed on the surfaces of the MWCNTs and noticeable in the pore of CNTs. The observation is in accordance with the report of Mombeshora et al.28 Functionalization of MWCNTs has been reported to have taken place on the defect walls of MWCNTs including the surfaces. The wall thickness, the internal diameter and the outer diameter were determined via the use of ImageJ software. The wall thickness of the MWCNTs was found in the range of 3.55–4.92 nm, the internal diameter 6.07–7.75 nm and the external diameter to be 10.50–16.48 nm. The determined diameters show that the developed nanomaterial falls within the nanometre range. Also, from Fig. 1(c), the TiB/MWCNTs nanoparticles formed were of varying diameters. The dissimilarity in the diameter of the tube could be linked to the variation observed in the sizes of the catalyst used for the carbon nanotubes as contained in the referenced literature including the report of Ahmed et al.29 The elemental mapping analysis showing the quantities of each element is shown in Fig. 2. The dominant elements such as Ti, B and C are present in significant amount when compared with other elements.
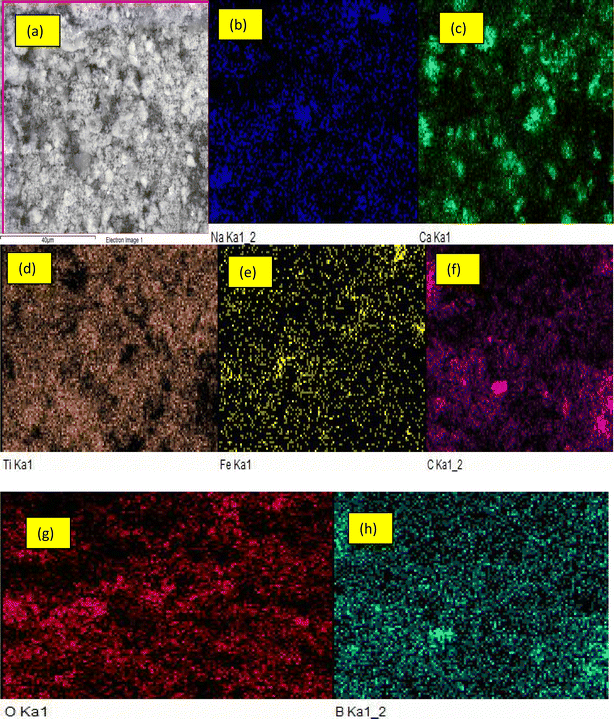 |
| | Fig. 2 Elemental mapping analysis of TiB/MWCNTs (a) full scan of the material (b) sodium (c) calcium (d) titanium (e) iron (f) carbon (g) oxygen (h) boron. | |
The internal structure of the B2O3/MWCNTs was also determined and the result is shown in Fig. 3. The depicted results displayed the nano-structural characterization of the produced material for its possible use as an adsorbent for water purification.
 |
| | Fig. 3 (a) HRTEM of B2O3/MWCNTs nanoadsorbents (b)HRSEM of B2O3/MWCNTS nanoadsorbents at different magnifications. | |
Fig. 3(a and b) depict the internal structure and surface morphology of the produced B2O3/MWCNTs at varied magnifications. From Fig. 3(a and b)(i & ii), the presence of B2O3 particles were observed on the surfaces of the MWCNTs and the spaghetti-like nature of the MWCNTs were also observed. The deposition of B2O3 on the MWCNTs' only observed on the inner and outer tube's walls and defects walls based on ionic radius difference mechanism. The dimensional make-up of the tubes was also determined and the results were shown in Fig. 3(b). From Fig. 3(a)(i and ii), the MWCNTs' internal diameter, external diameter and wall thickness were obtained to be 22.19 nm, 33.02 nm and 5.57 nm respectively. The result as presented in Fig. 3(b)(i & ii) show that the adopted doping process did not affect the structural make-up of the starting material. The d-spacing as estimated from Fig. 3(aii) was found to be 0.37 nm which is higher compared to the starting MWCNTs. The reason for this could be attributed to the contribution of the sorption of physiosorbed H2O into the MWCNTs pores and B2O3 which was applied for the doping rocess. The results of elemental mapping analysis of B2O3/MWCNTs are shown in Fig. 4. It can be seen that the dopant element boron is present in the composite materials while other elements are also present in different amount.
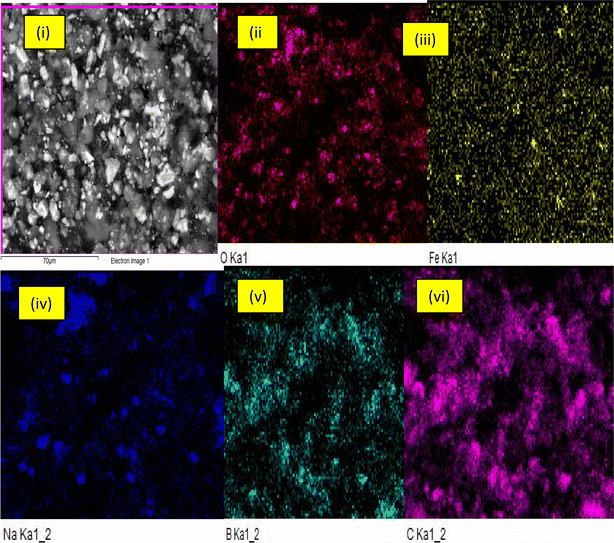 |
| | Fig. 4 (i) Elemental mapping analysis of (i) full scan B2O3/MWCNTs nanocomposite (ii) oxygen(III) iron (IV) sodium (V) boron (VI) carbon. | |
3.2 Elemental composition of the synthesized adsorbents
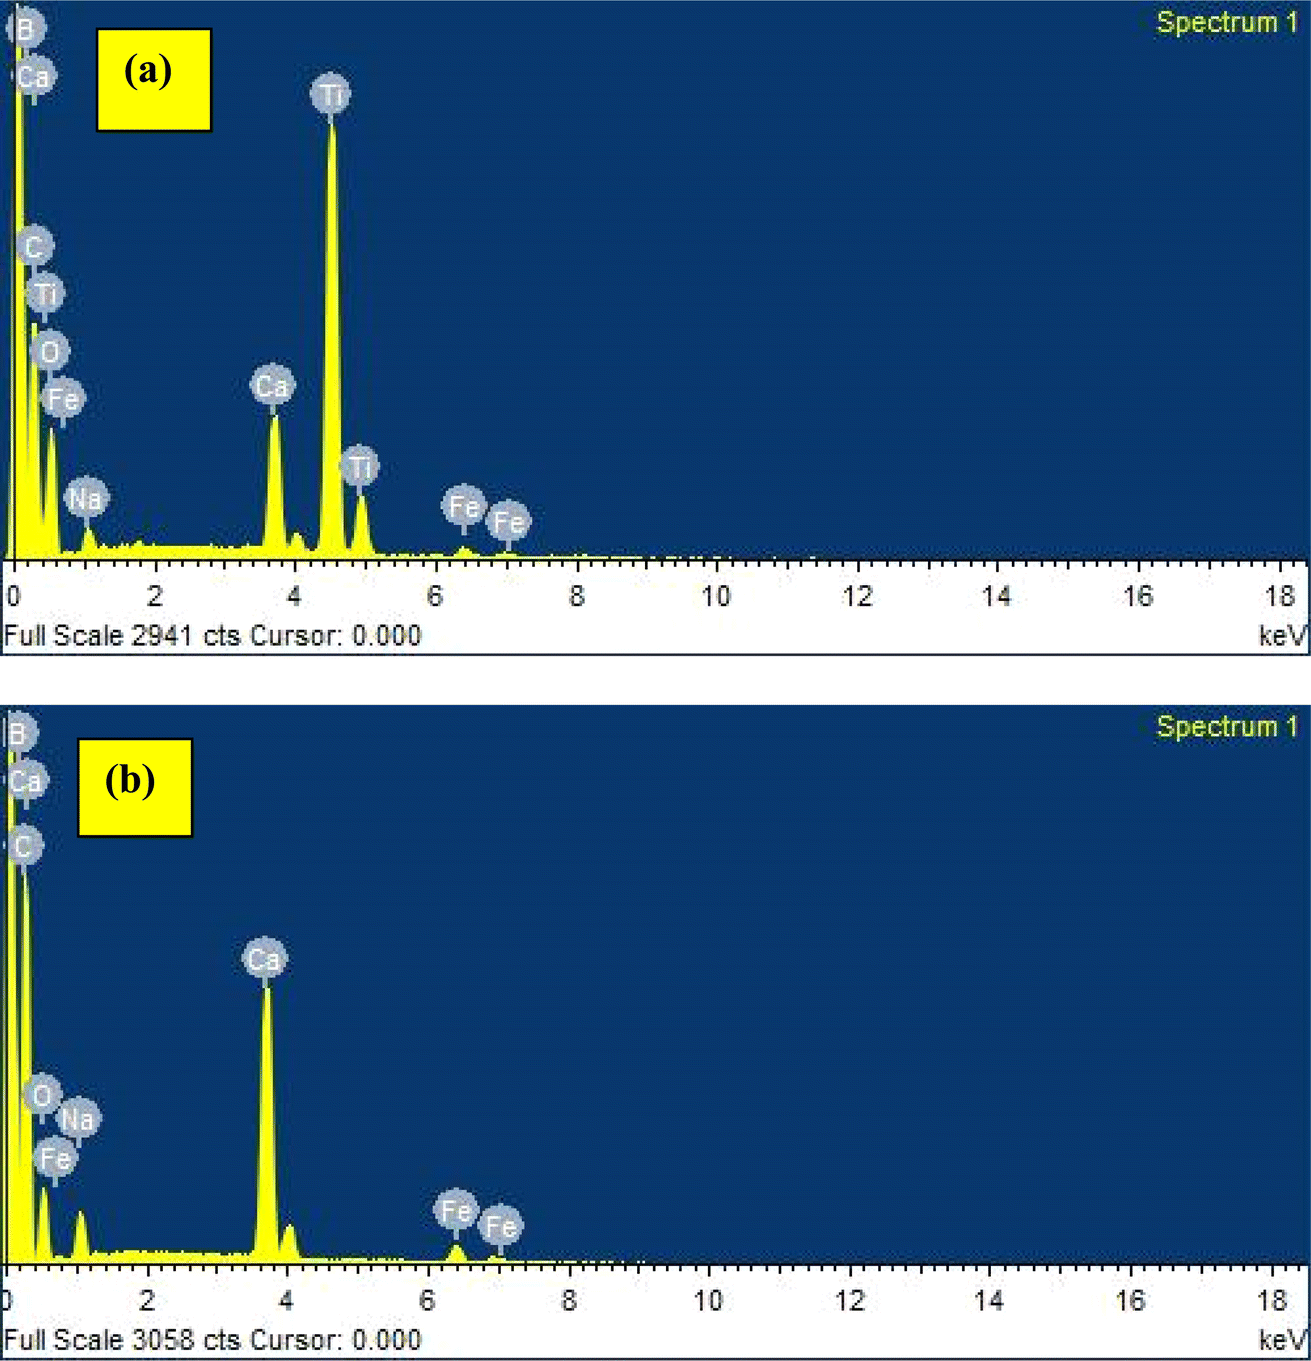
The elemental composition of the developed TiB/MWCNTs and B2O3/MWCNTs nanoadsorbent was determined via the use of energy dispersion X-ray spectroscopy. The result of the analysis is shown in Fig. 5(a and b).
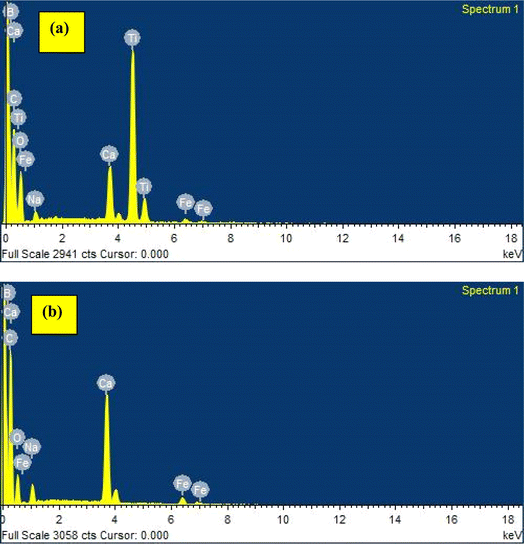 |
| | Fig. 5 (a) Elemental composition of the developed TiB/MWCNTs and (b) elemental composition of the developed B2O3/MWCNTs. | |
Fig. 5(a) depicts the energy level of the elements contained in the developed TiB/MWCNTs nano-adsorbent. It was shown that Ca, C, Ti, B, Fe, O, and Na were present in varied energy levels though some exist at different energy levels due to the properties exhibited as a result of their transition state. The presence of Fe and Ca may be linked to the iron nitrate salt and calcium carbonate used in the preparation of multi-walled carbon nanotubes. Na emanated from sodium hydroxide used to adjust the pH of the multi-walled carbon nanotubes during washing. The presence of Ti and B in the EDS spectra of TiB/MWCNTs (Fig. 3(a)) further confirmed that Ti and B particles were deposited on the outer and inner layer of MWCNTs while the detection of B in Fig. 5(b), indicate successful entrapment of boron particles by MWCNTs based on ionic radius mechanism. The result shows that C has the highest percentage composition of 84.07% in B2O3/MWCNTs; an indication of its highest composition in the bulk of the material.
3.3 X-ray diffraction of the developed TiB/MWCNTs and B2O3/MWCNTs nanoadsorbent
The crystalline nature of the developed TiB/MWCNTs and the B2O3/MWCNTs nanoadsorbents were investigated by the use of the XRD technique and the result is shown in Fig. 6. The diffraction angles at the 2 theta equals 25.48° (001) and 43.25° (004) are peaks representing the crystals of a graphitic carbon. The peaks at 2 theta values of 32.02°, 35.05°, 37.66°, 57.38°, 66.37° and 68.12° are characteristics peaks showing the presence of rutile form of titanium dioxide nanoparticles phase with miler indexes of (110), (101), (101), (211) and (112) respectively. These peaks identification was in accordance with the report of Abassi et al. (2013) who worked on the decoration and filling of MWCNTs with TiO2 nanoparticles via the wet chemical method. Comparing the peak intensity of the two adsorbents, the peaks observed in Fig. 6(b) were of high intensity as compared to Fig. 6(a).
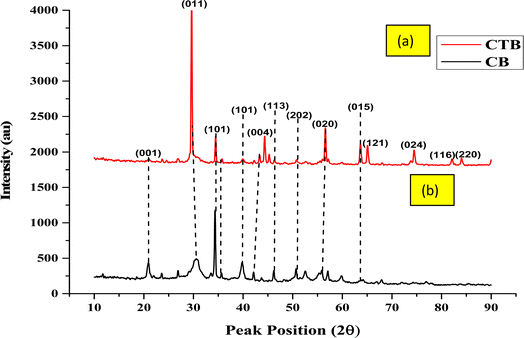 |
| | Fig. 6 XRD spectral of the developed (a) (CTB) TiB/MWCNTs and (b) (CB) B2O3/MWCNTs nano-adsorbent. | |
The crystallite size distribution of the developed nanoadsorbents was shown in Fig. S1(a and b) (ESI†). The crystallite sizes of the developed TiB/MWCNTs nanoadsorbents range from 5.75–28.51 nm while the average crystallite size was estimated to be 16.79 nm. The estimated average crystallite size of the synthesized B2O3/MWCNTs was 22.75 nm. Also, the crystallite particle sizes of TiB/MWCNTs were estimated to range from 1.85 to 85.03 nm.
3.3.1 XRD crystallinity index. Generally, the mean crystallite size of a material is a direct function of the peak breath of a specific phase of the bulk of the material. The crystallinity index relationship is presented in eqn (15).| |
 | (15) |
where I represent the XRD-crystallinity index of the materials (unit less). The diameters of the particles from the XRD were obtained from the Scherrer equation. For both the B2O3/MWCNTs and TiB/MWCNTs nanoadsorbents, the XRD-crystallinity indexes are shown in Table 1.
Table 1 The XRD-crystallinity indexes of the developed B2O3/MWCNTs and TiB/MWCNTs nanoadsorbents
| S/N |
Sample |
D (TEM) |
D (XRD) |
I (unitless) |
Nature of particles |
| 1 |
B2O3/MWCNTs |
33.02 |
22.75 |
1.4514 |
Monocrystalline |
| 2 |
TiB/MWCNTs |
17.37 |
16.79 |
1.0345 |
Monocrystalline |
From Table 1, the obtained value for the XRD-crystallinity indexes for both the B2O3/MWCNTs and TiB/MWCNTs were 1.4514 and 1.0345 respectively. These values were closer to 1 and hence, the nanoadsorbents produced were monocrystalline in nature.
3.4 SAED pattern of the developed TiB/MWCNTs and B2O3/MWCNTs nanoadsorbent
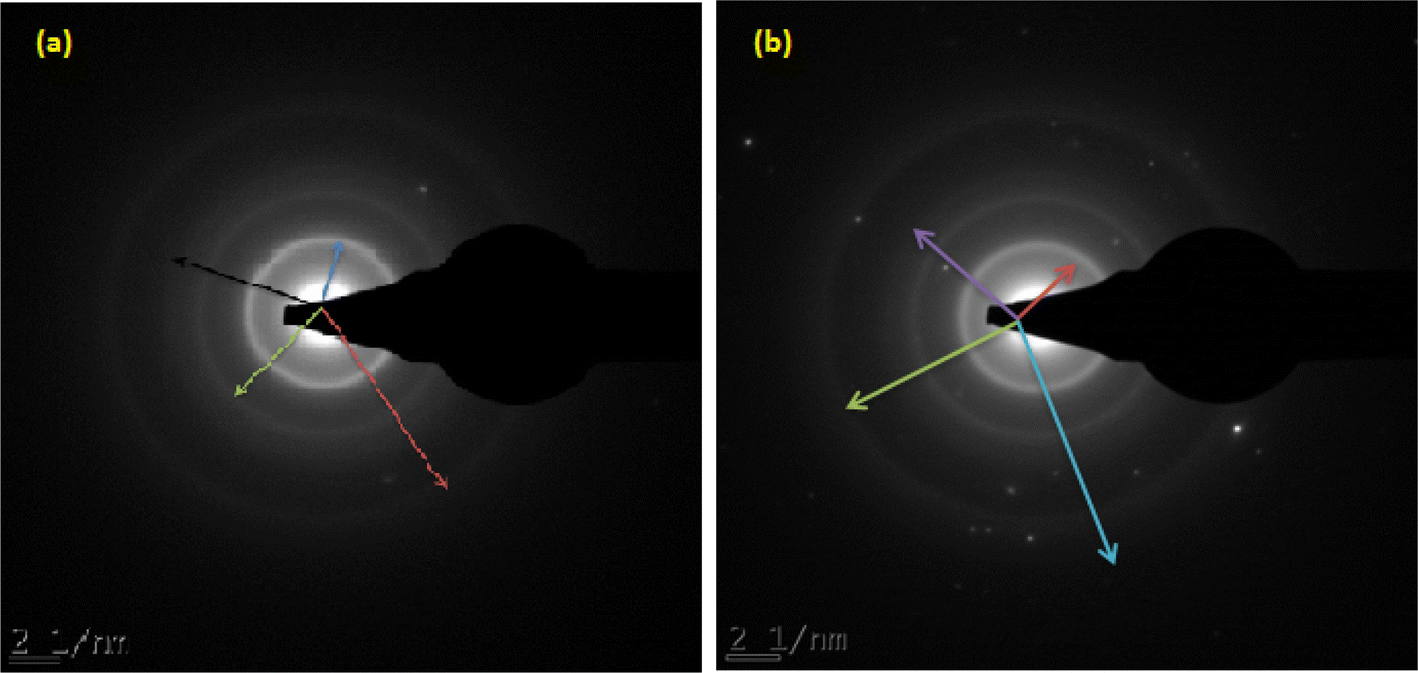
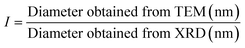
The selected area electron diffraction technique was used to determine the crystals lattice as well as the d-spacing of the inter-particles present in the bulk of the developed TiB/MWCNTs and B2O3/MWCNTs nanoadsorbent. The results of the SAED Patterns are as presented in Fig. 7(a and b).
 |
| | Fig. 7 SAED pattern of the developed (a) TiB/MWCNTs and (b) B2O3/MWCNTs nanoadsorbent. | |
The selected area electron diffraction (SAED) analysis depicts the d-spacing and the indexing of the crystallite lattice of TiB/MWCNTs and B2O3/MWCNTs nanoadsorbent. The SAED pattern allows for proper material indexing and symmetry for easy estimation of inter-planner distance (d-spacing). The single pattern of a SAED as depicted in Fig. 7 is made up of several components of symmetrical crystals that formed the ring. The distance between the rings to the centre of the SAED pattern gives the crystal radii as depicted in Table 1S (ESI†).
3.5 BET results of the developed TiB/MWCNTs and B2O3/MWCNTs nanoadsorbent
The BET surface area, pore volume and pore diameter of the developed TiB/MWCNTs nanoadsorbent was observed to be 302.95 m2 g−1, 0.2032 cc g−1 and 2.131 nm respectively. The introduction of a boron-containing compound led to the decrease in the surface area of the developed material when compared to the BET surface area of the B2O3/MWCNTs of 310.32 m2 g−1. It was observed that the introduction of B2O3 into the MWCNTs resulted to a higher surface area as compared to when TiB was employed. This reduction in surface area in the case of TiB could be as result of deposition of Ti on the lattice layer of MWCNTs as supported by the TEM images depicted in Fig. 3(a). The introduction of surface defects due to B2O3 has been reported by Cheng et al. (2014). This defect is capable of enhancing the sorption capacity of the nanoadsorbents during the adsorption process.
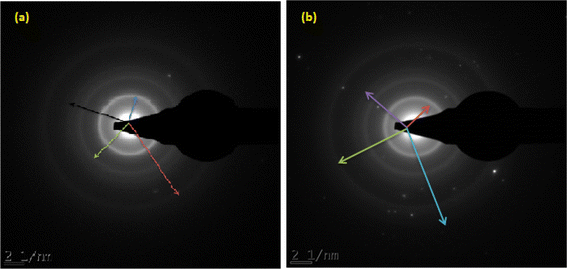
3.6 X-ray photoelectron spectroscopy of the developed materials (XPS)
The oxidation states and the corresponding binding energy of the developed materials were examined using X-ray photoelectron spectroscopy and the result is shown in Fig. 8(a and b).
 |
| | Fig. 8 (a) XPS survey of the developed nanoadsorbent (b) detailed XPS spectrum of TiB/MWCNTs and B2O3/MWCNTs nanoadsorbent. | |
From Fig. 8(a), the presence of Ti was observed at varied oxidation states of +3 and +4 respectively. Carbon possessed the highest intensity in the developed material. The observation of carbon in titanium oxide nanoparticle materials could be linked to the carbon in the plant extract used as the capping agent during the titanium oxide synthesis. The peaks at the binding energy of 192 and 193.1 eV could be linked to the formation of B2O3 and titanium diboride respectively. The presence of boron oxide and titanium diboride, active materials could result in appreciable adsorption behaviour during the removal of phenol and cyanide from wastewater during the sorption process.
3.7 Physiochemical properties of the wastewater
The characterised adsorbents were employed for the removal of cyanide and phenolic compounds from refinery wastewater via a batch adsorption process. The effects of contact time, adsorbent dosage and temperature were studied on the efficiency of the developed adsorbents. The physiochemical properties of the wastewater and that of the treated effluents were compared with Standard Organisation of Nigeria (SON) and World Health Organisation (WHO) standards. From Table 2, the removal efficiency of the developed TiB/MWCNTs nanoadsorbent on the refinery wastewater was compared to the available standards (SON, WHO/EPA). The removal of phenol and the cyanide were found to be below the allowable limit; hence, the adsorbent has potential for application in the sorption of phenol and cyanide from refinery effluent.
Table 2 Physiochemical properties of the wastewater, purified wastewater and the standard
| Parameters |
Untreated wastewater |
Present work |
SON standard |
W.H.O/EPA |
| pH |
7.00 |
7.00 |
6.5–8.5 |
5.5–8.5 |
| TDS (mg L−1) |
379 |
121 |
500 |
600 |
| Conductivity (μS cm−1) |
566 |
217 |
1000 |
1000 |
| Total alkalinity (mg L−1) |
192 |
134 |
— |
— |
| Nitrates (mg L−1) |
98.30 |
32.4 |
50 |
50 |
| Ammonium (mg L−1) |
0.00 |
0.00 |
— |
1.5/0.5 |
| Chloride (mg L−1) |
225 |
120 |
250 |
250 |
| Phosphate (mg L−1) |
1.99 |
0.12 |
— |
0.5 |
| Cyanide (mg L−1) |
108 |
0.01 |
0.01 |
0.05 |
| Fluoride (mg L−1) |
0.18 |
0.04 |
1.5 |
1.5/1 |
| Sulphate (mg L−1) |
51.30 |
10.32 |
100 |
250/200 |
| COD (mg L−1) |
32.00 |
98.00 |
— |
40 |
| BOD5 (mg L−1) |
7.15 |
0.03 |
— |
10/5–7 |
| Carbonate (mg L−1) |
0.00 |
0.00 |
150 |
— |
| Nitrite (mg L−1) |
0.40 |
0.11 |
0.20 |
3/0.05 |
| Phenol |
87.00 |
0.00 |
0.001 |
— |
| Total bacteria count (cfu mL−1) |
244 |
0.00 |
10 |
— |
3.8 Adsorption studies
3.8.1 Effect of contact time on the removal of cyanide and phenol. The effect of contact time on the percentage removal of phenol and cyanide was determined at varied contact times from 10 to 80 minutes. The percentage adsorbed was observed to be 72.22 and 87.04% for cyanide removal by B2O3/MWCNTs and TiB/MWCNTs respectively and 68.97 and 88.51% removal of phenol onto the B2O3/MWCNTs and TiB/MWCNTs respectively. The observable increase in the percentage adsorbed of both cyanide and phenol was due to the presence of active pores and effective surface functional groups on the sorbents. The adsorbent reached a plateau at the contact time of 70 minutes as shown in Fig. 9(a) while a plateau was observed at 60 minutes in Fig. 9(b). At plateau, the adsorbents attain equilibrium where no adsorbates were sorbed onto the sorbents. The time at this point is termed the equilibrium time. At the equilibrium time, 95.35 and 99.79% removal of cyanide onto B2O3/MWCNTs and TiB/MWCNTs respectively were observed while 98.8.10 and 99.89% removal of phenol by B2O3/MWCNTs and TiB/MWCNTs were obtained.
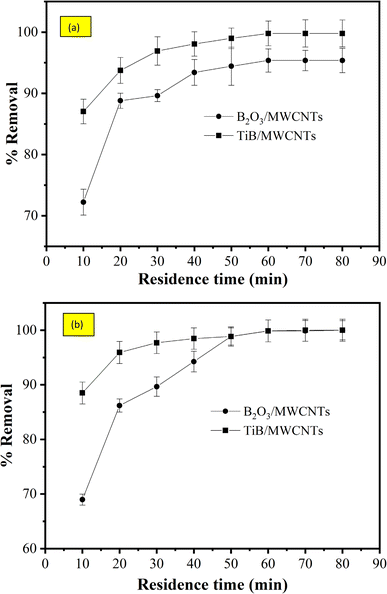 |
| | Fig. 9 Effects of contact time on the removal of (a) cyanide and (b) phenol onto TiB/MWCNTs and B2O3/MWCNTs nanoadsorbents. | |
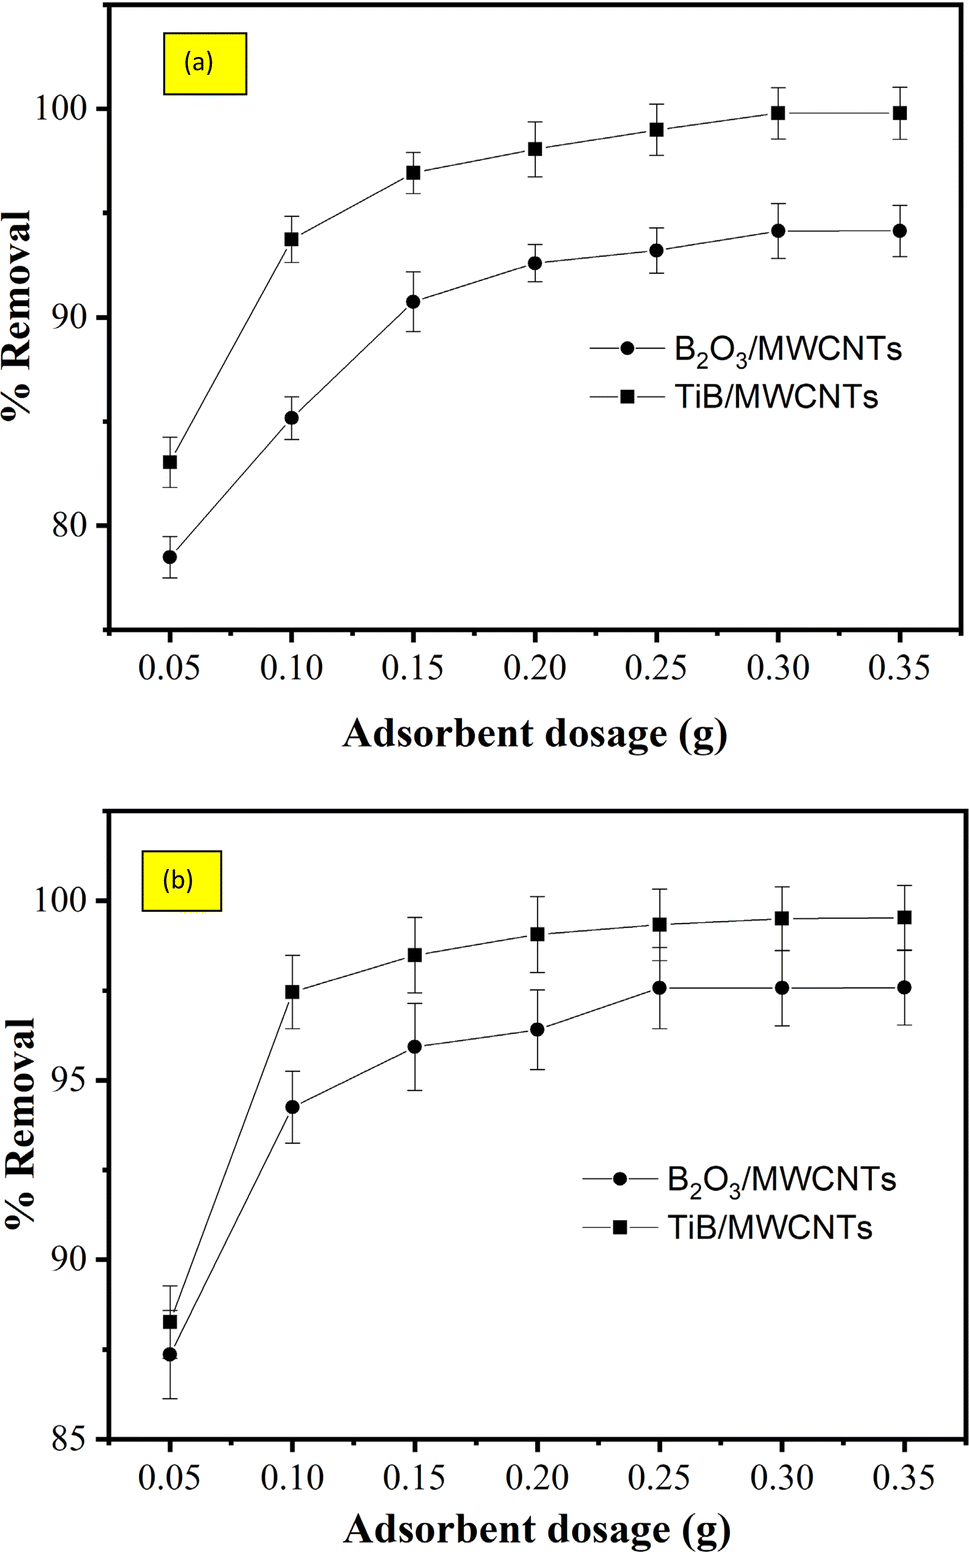
3.8.2 Effect of adsorbent dosage on the removal of cyanide and phenol. The effect of adsorbent dosage on the percentage removal of cyanide and phenol onto TiB/MWCNTs and B2O3/MWCNTs nanoadsorbents is shown in Fig. 10(a and b). The percentage removal of both the cyanide and phenol was observed to increase progressively on the two adsorbents. According to the report of Ugurlu et al.,30 an increase in the adsorbent dosage at a plateau resulted in a corresponding decrease in the removal efficiency due to overlapping and aggregation of active pores and surfaces of the adsorbent.
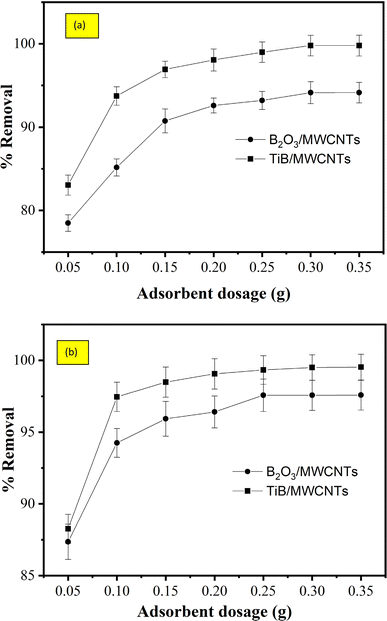 |
| | Fig. 10 Effect of adsorbent dosage on the percentage removal of (a) cyanide and (b) phenol onto TiB/MWCNTs and B2O3/MWCNTs nanoadsorbents. | |
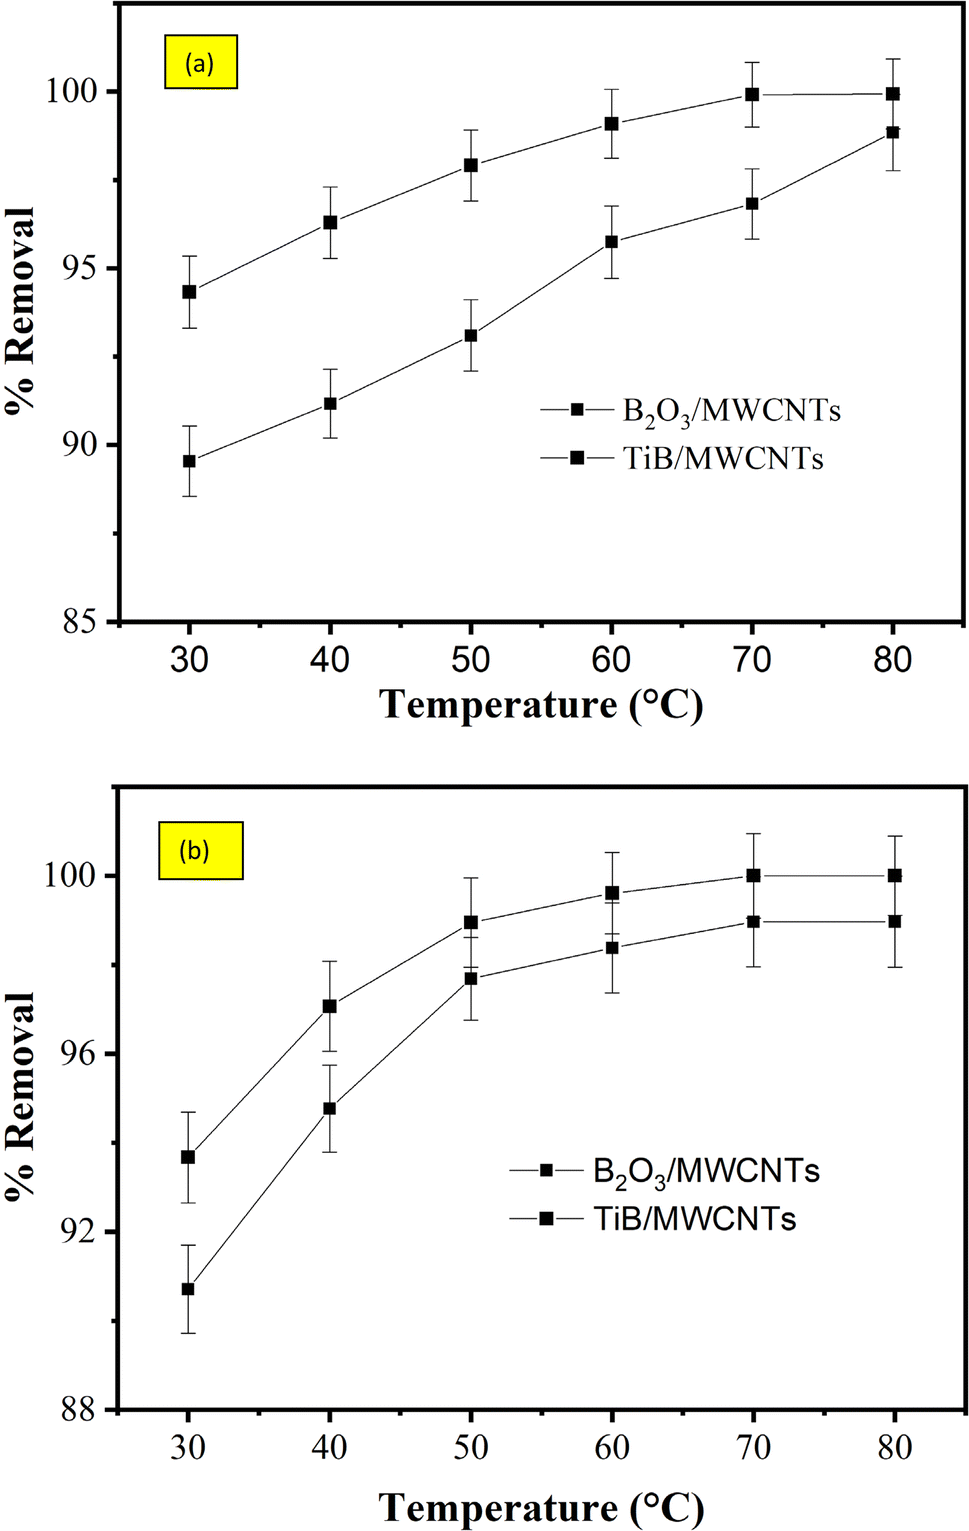
3.8.3 Effect of temperature on the adsorption of cyanide and phenol. It could be observed that there was total removal of phenol from the refinery wastewater by the TiB/MWCNTs adsorbent as shown in Fig. 11(b) at 70 °C. The reason for this could be based on the effective surface modification process on the surfaces of MWCNTs by TiB. At a temperature above 70 °C, there were no observable changes in the percentage removal for both the cyanide and phenol as depicted in Fig. 11(a and b). Fig. 10(a) shows that the B2O3/MWCNTs adsorbent has the lowest adsorption efficiency for the removal of cyanide and phenol while TiB/MWCNTs have the highest removal efficiency. This appreciable increase in the percentage removal could be linked to the improved surface structure of the composites and the enhanced surface properties of the nanoadsorbent. As the temperature of the adsorption process increases, the intraparticle diffusion increases which led to the creation of more adsorption sites that aid the adsorption phenomenon.
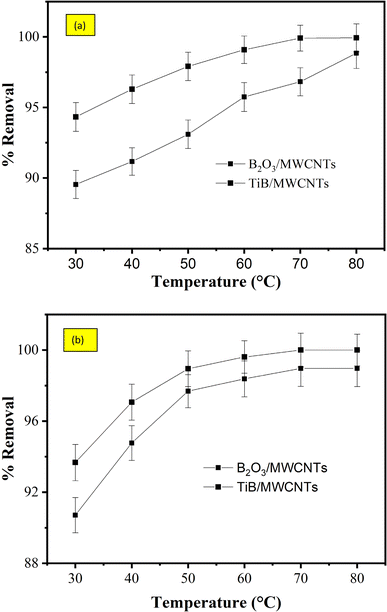 |
| | Fig. 11 Effect of temperature on the percentage removal of (a) cyanide and (b) phenol onto TiB/MWCNTs and B2O3/MWCNTs nanoadsorbents. | |
3.9 Isotherm studies
The data obtained from the effect of adsorbent dosage on the percentage removal of phenol and cyanide was fitted for both Langmuir and Freundlich models and the results obtained were shown in Table 3. The separation factor indicates the types of isotherm which an adsorbate exhibits on the surface of an adsorbent. The obtained separation factor, RL were all found to be below 1 throughout. The adsorption process was said to be favourable at 0 > RL < 1 and unfavourable when RL > 1. Therefore, the value of RL obtained indicated that the operating conditions adopted for the removal of cyanide and phenol from refinery wastewater favours the adsorption process. From the Langmuir isotherm model, the maximum adsorption capacities, Qo of the adsorbents were obtained. Qo of 222.222 mg g−1 of sorbate was observed to be the highest amount of cyanide removed per grams of B2O3/MWCNTs nanoadsorbent. The R2 value for the cyanide and phenol were 0.95610 and 0.97910 for the Langmuir isotherm model and 0.8610 and 0.6110 for the Freundlich isotherm model respectively. The closeness of the R2 value of the Langmuir models to unity indicates that the adsorption processes leading to the removal of cyanide and phenol from the refinery wastewater onto the developed B2O3/MWCNTs are monolayer in nature. The R2 value for the cyanide and phenol were 0.7430 and 0.9887 for Langmuir isotherm model while that for Freundlich isotherm model were 0.8924 and 0.9639 respectively. The closeness of the R2 value of Freundlich to unity indicates that the removal of cyanide favours Freundlich isotherm with multilayer adsorption of the adsorbate onto TiB/MWCNTs adsorbent. On the contrary, the adsorption of phenol to the surface of the TiB/MWCNTs adsorbent obeys the Langmuir isotherm model due to the high value of R2 of 0.9881 which is closer to unity than that of Freundlich; an indication of its monolayer adsorption. The highest maximum adsorption capacity was observed on phenol removal with a Qo of 108.696 mg g−1 while the lower value was observed for the cyanide removal with Qo of 40.4858 mg g−1 onto the TiB/MWCNTs nanoadsorbent. This result shows that phenol has a higher uptake than cyanide onto the active sites and surfaces of the TiB/MWCNTs adsorbent from the refinery effluent. The n-value from the Freundlich isotherm model indicates that the adsorption process for cyanide and phenol removal was favourable.31
Table 3 Isotherm parameters for cyanide and phenol removal from refinery effluent using TiB/MWCNTs and B2O3/MWCNTs nanoadsorbents
| Isotherm parameter |
B2O3/MWCNTs |
TiB/MWCNTs |
| Cyanide |
Phenol |
Cyanide |
Phenol |
| Langmuir |
| KL (L mg−1) |
0.02242 |
0.08170 |
2.8721 |
0.2636 |
| aL (L mg−1) |
4.98256 |
7.85546 |
116.279 |
28.6533 |
| Qo (mg g−1) |
222.222 |
96.1538 |
40.4858 |
108.696 |
| R2 |
0.95610 |
0.97910 |
0.7430 |
0.9887 |
| SSE |
1.65 × 10⁻¹ |
2.76 × 10⁻¹ |
5.09 × 10⁻¹ |
12.12 × 10⁻¹ |
| RL |
0.29227 |
0.12334 |
0.00321 |
0.04178 |
|
| Freundlich |
| Kf |
1.0661 |
0.1838 |
4.0633 |
3.7852 |
| I/n |
1.0310 |
0.3020 |
0.3800 |
0.6064 |
| N |
0.9699 |
3.3113 |
2.6316 |
1.6491 |
| R2 |
0.8610 |
0.6110 |
0.8924 |
0.9639 |
| SSE |
2.980 × 10⁻¹ |
3.58 × 10⁻¹ |
2.76 × 10⁻¹ |
29.32 × 10⁻¹ |
3.10 Kinetic study
Table 4 shows the kinetic parameters for the removal of cyanide and phenol onto TiB/MWCNTs and B2O3/MWCNTs nanoadsorbents. The adsorption data were fitted for both pseudo-first order, pseudo-second-order and Elovic models. The obtained results depict that the R2 values for the pseudo-second-order kinetic for both cyanide and phenol were higher than those of the first order and Elovic model. This indicated that the sorption of phenol and cyanide on the B2O3/MWCNTs and TiB/MWCNTs is chemisorption. The agreement of the experimental data to pseudo-second-order kinetic indicates that two reactions occurred during the sorption process; the first occurring at a faster rate and quickly attaining equilibrium while the second reaction occurred at a much slower rate and proceeded for a longer time before attaining equilibrium. The pseudo-second-order rate constant, k2 in g mg−1 min−1 was determined as shown in Table 3. The highest value of k2 was observed on the phenol removal on B2O3/MWCNTs adsorbent with 0.084 g mg−1 min−1. This implies that phenol moves at a shortest period as compared to cyanide to the adsorption sites of the adsorbents.32–35
Table 4 Kinetic parameters for the removal of cyanide and phenol onto TiB/MWCNTs and B2O3/MWCNTs nanoadsorbents
| Pollutants |
Kinetics |
Parameters |
Adsorbents |
| B2O3/MWCNTs TiB/MWCNTs |
| Phenol |
Pseudo-first order kinetic |
qe,exp (mg g−1) |
423.45 |
434.45 |
| qe,cal (mg g−1) |
338.22 |
62.9506 |
| k (g mg−1 min−1) |
0.084 |
0.0502 |
| R2 |
0.985 |
0.9391 |
| Pseudo-second order kinetic |
qe,exp (mg g−1) |
423.45 |
434.45 |
| qe,cal (mg g−1) |
439.65 |
434.783 |
| k (g mg−1 min−1) |
0.000464 |
0.000176 |
| R2 |
0.9996 |
1.000 |
| Elovic model |
β |
0.0172 |
0.045 |
| α |
1424.866 |
1.13 × 10⁶ |
| R2 |
0.9058 |
0.8775 |
| Cyanide |
Pseudo-first order kinetic |
qe,exp (mg g−1) |
515.51 |
538.85 |
| qe,cal (mg g−1) |
154.454 |
110.066 |
| k2 (g mg−1 min−1) |
0.0646 |
0.0576 |
| R2 |
0.8783 |
0.9507 |
| Pseudo-second order kinetic |
qe,exp (mg g−1) |
515.51 |
538.85 |
| qe,cal (mg g−1) |
526.315 |
555.556 |
| k2 (g mg−1 min−1) |
0.000633 |
0.00105 |
| R2 |
0.9960 |
1.000 |
| Elovic model |
β |
0.0186 |
0.0305 |
| α |
954.116 |
7.18 × 10⁶ |
| R2 |
0.8535 |
0.9261 |
3.11 Thermodynamic studies
The thermodynamic parameters of the adsorption process are as shown in Table 5. The degree of disorderliness exhibited by the sorbate at the solid–liquid boundary of the adsorption site during the removal of cyanide and phenol is a function of the degree of entropy, ΔS°. The ΔS° values obtained were all positive which shows that the process leading to the removal of cyanide and phenol is endothermic in nature. The highest value of ΔS° of 97.8641 kJ mol−1 observed on phenol removal onto B2O3/MWCNTs nanoadsorbent implies the adsorbent has more affinity for phenol intake than cyanide from the aqueous solution. Also, the negative values of ΔG° at varied adsorption temperature of cyanide and phenol on to the surfaces of TiB/MWCNTs and B2O3/MWCNTs adsorbents indicated the spontaneous and feasible nature of the adsorption process thermodynamically. The value of ΔH° which falls between −40 to −80 kJ mol−1 for the removal of cyanide and phenol on to the nanoadsorbents indicate that the adsorption process is physisorption. Furthermore, the negative values of the ΔH° depicts the exothermic nature of the adsorption process leading to the removal of cyanide and phenol on to the active adsorption sites of the nanoadsorbents used. Table 2S (ESI†) shows the comparison of batch adsorption parameters, maximum adsorption capacity, isotherm and kinetic model for phenol and cyanide removal by different nanoadsorbents in the literature.
Table 5 Thermodynamic parameters of cyanide and phenol removal from refinery wastewater on to TiB/MWCNTs and B2O3/MWCNTs nanoadsorbents
| Sorbent/sorbate |
Temp (°C) |
(ΔH)° (kJ mol−1) |
(ΔS)° (kJ mol−1 K−1) |
(ΔG)° (kJ mol−1) |
| B2O3/MWCNTs |
303 |
−24.1472 |
49.682 |
−39.2008 |
| Cyanide |
313 |
|
|
−39.6976 |
| |
323 |
|
|
−40.1945 |
| |
333 |
|
|
−40.6913 |
| |
343 |
|
|
−41.1881 |
| |
353 |
|
|
−41.6849 |
| Phenol |
303 |
−42.2019 |
97.8641 |
−71.8547 |
| |
313 |
|
|
−72.8333 |
| |
323 |
|
|
−73.8120 |
| |
333 |
|
|
−74.7960 |
| |
343 |
|
|
−75.7692 |
| |
353 |
|
|
−76.7479 |
| TiB/MWCNTs/TiO2 |
303 |
−86.6153 |
224.5778 |
−15.4662 |
| Cyanide |
313 |
|
|
−15.6908 |
| |
323 |
|
|
−15.9154 |
| |
333 |
|
|
−16.1400 |
| |
343 |
|
|
−16.3645 |
| |
353 |
|
|
−16.5891 |
| Phenol |
303 |
−83.2148 |
212.2897 |
−14.7539 |
| |
313 |
|
|
−14.9661 |
| |
323 |
|
|
−15.1784 |
| |
333 |
|
|
−15.3907 |
| |
343 |
|
|
−15.6030 |
| |
353 |
|
|
−15.8153 |
4. Conclusions
An effective and efficient doping technique has been adopted for the development of nanoadsorbents used for the removal of phenol and cyanide from refinery wastewater. The B2O3/MWCNTs and TiB/MWCNTs nanoadsorbents were observed to contain 95.41% and 84.07% of carbon and crystallite particle sizes of 22.75 nm and 16.79 nm respectively. The reduction in carbon content in TiB/MWCNTs resulted in the decrease in the exposed defect area hence, resulted in a reduced Qo in cyanide uptake. The findings show that the removal of cyanide and phenol were both surface and functional group dependent while temperature, contact time and adsorbent dosage were found to have an impact on the removal of phenol and cyanide from wastewater. The highest percentage removal of phenol and cyanide of 100% and 99.06% respectively were obtained over the TiB/MWCNTs at a temperature of 60 °C, residence time of 70 minutes and 0.3 g adsorbent dosage. Furthermore, sorption of phenol and cyanide on the B2O3/MWCNTs and TiB/MWCNTs are chemisorption and the data obey the pseudo-second-order kinetic in both cases. The thermodynamic parameters depict that the removal of cyanide and phenol onto both B2O3/MWCNTs and TiB/MWCNTs are endothermic and thermodynamically spontaneous. The developed TiB/MWCNTs and B2O3/MWCNTs nanoadsorbents are effective and efficient nano-adsorbent for the removal of phenol and cyanide from refinery wastewater.
Data availability
The authors confirm that the data supporting this study's conclusions are included in the publication.
Credit author statement
Ishaq Kariim: conceptualization, methodology, data curation, funding acquisition, investigation, writing – original draft, writing – review & editing. Usman M. O.: writing – review & editing. Isa R. O.: writing – review & editing. Tijani J. O.: conceptualization, funding acquisition, writing – review & editing, supervision. Abubakre O. K.: conceptualization, funding acquisition, writing – review & editing, supervision. Abdulkareem A. S.: conceptualization, funding acquisition, writing – review & editing, supervision. Ezzat A. O.: funding acquisition, writing – review & editing. Al-Lohedan H. A.: funding acquisition, writing – review & editing. Sayed S. R. M.: funding acquisition, analysis, writing – review & editing. Egbosiuba T. C.: writing – review & editing.
Conflicts of interest
The authors declare no conflict of interest.
Acknowledgements
The financial support from the Senate Research-Based Fund of the Federal University of Technology, Minna with grant number (SENATE/FUTMINNA/2015/06) and TETFund/FUTMINNA/2017/10 are much appreciated. The authors extend their appreciation to the Researchers Supporting Project number (RSPD2024R743), King Saud University, Riyadh, Saudi Arabia.
References
- G. O. Obiechina and J. R. Rimande, Water Pollution and Environmental Challenges in Nigeria, Educ. Res. Int., 2018, 7, 109–117 Search PubMed.
- M. Salehi, Global water shortage and potable water safety; today's concern and tomorrow's crisis, Environ. Int., 2022, 158, 106936 CrossRef PubMed.
- D. Dutta, S. Arya and S. Kumar, Industrial wastewater treatment: current trends, bottlenecks, and best practices, Chemosphere, 2021, 131245 CrossRef CAS PubMed.
- O. I. Nwachukwu, L. E. Odoemelam and C. O. Muoneke, Contaminants in selected industrial effluents and their effect on groundwater quality near factories in two cities of South East Nigeria, Int. J. Adv. Res., 2015, 3(9), 326–333 CAS.
- T. V. Otokunefor and C. Obiukwu, Impact of refinery effluent on the physicochemical properties of a water body in the Niger delta, Appl. Ecol. Environ. Res., 2005, 3(1), 61–72 CrossRef.
- M. P. Cutchin, K. R. Martin, S. V. Owen and J. S. Goodwin, Concern about petrochemical health risk before and after a refinery explosion, Risk Anal., 2008, 28(3), 589–601 CrossRef.
- A. Gupta and C. Balomajumder, Simultaneous removal of Cr (VI) and phenol from binary solution using Bacillus sp. immobilized onto tea waste biomass, J. Water Process. Eng, 2015, 6, 1–10 CrossRef CAS.
- U.S. Environmental Protection Agency, Integrated Risk Information System (IRIS) on Phenol, National Center for Environmental Assessment, Office of Research and Development, Washington, DC, 1999 Search PubMed.
- Agency for Toxic Substances and Disease Registry (ATSDR), Toxicological Profile for Phenol, Public Health Service, U.S. Department of Health and Human Services, Atlanta, GA, 1998 Search PubMed.
- N. Abdullah, N. Yusof, W. J. Lau, J. Jaafar and A. F. Ismail, Recent trends of heavy metal removal from water/wastewater by membrane technologies, J. Ind. Eng. Chem., 2019, 76, 17–38 CrossRef CAS.
- A. T. Gbajabiamila, I. Kariim and B. O. Ighobesuo, Optimization approach for the removal of Pb2+ ions from water contaminated from oil well drilling point on to MWCNTs. Nanotechnology Applications in Africa: Opportunities and Constraints, Mater. Sci. Eng., 2020, 805, 012013 CAS.
- A. H. Sulaymon, A. A. Mohammed and T. J. Al-Musawi, Competitive Biosorption of Lead, Cadmium, Copper, and Arsenic Ions Using Algae, Environ. Sci. Pollut. Res., 2013, 20, 3011–3023 CrossRef CAS.
- N. B. Singh, G. Nagpal, S. Agrawal and A. R. Rachna, Water purification by using adsorbents: a review, Environ. Technol. Innovation, 2018, 11, 187–240 CrossRef.
- H. A. Maitlo, K. H. Kim, V. Kumar, S. Kim and J. W. Park, Nanomaterials-based treatment options for chromium in aqueous environments, Environ. Int., 2019, 130, 104748 CrossRef CAS.
- M. J. Uddin and Y. K. Jeong, Adsorptive removal of pollutants from water using magnesium ferrite nanoadsorbent: a promising future material for water purification, Environ. Sci. Pollut. Res., 2022, 29, 9422–9447 CrossRef CAS PubMed.
- L. N. Nthunya, M. L. Masheane, S. P. Malinga, E. N. Nxumalo and S. D. Mhlanga, Electrospun chitosan-based nanobres for removal of phenols from drinking water, Water S.A., 2018, 44(3), 377–386 CAS.
- B. Kunwar, S. Mondal, V. K. Saini, K. D. Bahukhandi and A. Kumar, Utilization of barks of Araucaria columnaris: Preparation of activated carbon/clay composite beads and adsorptive treatment of phenolic wastewater, Ind. Crops Prod., 2023, 197, 116534 CrossRef CAS.
- T. A. Abdullah, T. Juzsakova, S. A. Hafad, R. T. Rasheed, N. Al-Jammal and M. A. Mallah, Functionalized multi-walled carbon nanotubes for oil spill clean-up from water, Clean Technol. Environ. Policy, 2022, 24(2), 519–541 CrossRef CAS.
- O. C. Al-Anzi BS Siang, Recent developments of carbon based nanomaterials and membranes for oily wastewater treatment, RSC Adv., 2017, 7(34), 20981–20994 RSC.
- M. Anjum, R. Miandad, M. Waqas, F. Gehany and M. A. Barakat, Remediation of wastewater using various nano-materials, Arabian J. Chem., 2016, 2016, 10.004 Search PubMed.
- Y. Wang, C. Pan, W. Chu, A. Vipin and L. Sun, Environmental Remediation Applications of Carbon Nanotubes and Graphene Oxide: Adsorption and Catalysis, Nanomaterials, 2019, 9(3), 439 CrossRef CAS.
- I. Kariim, A. S. Abdulkareem, J. O. Tijani and O. K. Abubakre, Development of MWCNTs/TiO2 nanoadsorbent for Simultaneous removal of phenol and cyanide from refinery wastewater, Sci. Afr., 2020, 10, e00593 Search PubMed.
- X. Gui, A. Cao, J. Wei, H. Li, Y. Jia, Z. Li and D. Wu, Soft, Highly Conductive Nanotube Sponges and Composites with Controlled Compressibility, ACS Nano, 2010,(4), 2320–2326 CrossRef CAS PubMed.
- Y. Cheng, Y. Tian, X. Fan, J. Liu and C. Yan, Boron Doped Multi-Walled Carbon Nanotubes as Catalysts for Oxygen Reduction Reaction and Oxygen Evolution Reaction in Alkaline Media, Electrochim. Acta, 2014, 143, 291–296 CrossRef CAS.
- M. T. Osobamiro, Determination of the concentration of total cyanide in waste water of a tobacco company in southwestern Nigeria, J. Appl. Sci. Environ. Manage., 2012, 16(1), 61–63 CAS.
- A. E. Hegazy and M. I. Ibrahim, Antioxidant activities of orange peels extracts, World Appl. Sci. J., 2012, 48(5), 684–688 Search PubMed.
- Z. Yun, Z. Zhiqiang, Z. Jiao and X. Siqing, New insight into adsorption characteristics and mechanisms of the biosorbent from waste activated sludge for heavy metals, J. Environ. Sci., 2016, 23, 432–443 Search PubMed.
- E. T. Mombeshora, R. Simoyi, V. O. Nyamori and S. Ndungu, Multiwalled Carbon Nanotube-titania Nanocomposites: Understanding Nano-Structural Parameters and Functionality in Dye-sensitized Solar Cells, S. Afr. J. Chem., 2015, 68, 153–164 CrossRef CAS.
- S. Ahmad, Y. Liao, A. Hussain, Q. Zhang, E. X. Ding, H. Jiang and E. I. Kauppinen, Systematic investigation of the catalyst composition effects on single-walled carbon nanotubes synthesis in floating-catalyst CVD, Carbon, 2019, 318–327 CrossRef CAS.
- M. Ugurlu, A. Gurses and M. Acikyildiz, Comparison of textile dyeing effluent adsorption on commercial activated carbon and activated carbon prepared from olive stone by ZnCl2 activation, Microporous Mesoporous Mater., 2008, 111(1–3), 228–235 CrossRef CAS.
- H. Zhang, Z. Niu and Z. Liu, Equilibrium, kinetic and thermodynamic studies of adsorption of Th(IV) from aqueous solution onto kaolin, J. Radioanal. Nucl. Chem., 2015, 303, 87–97 CrossRef CAS.
- R. F. Fard, M. E. K. Sar, M. Fahiminia, N. Mirzaei, N. Yousefi, H. J. Mansoorian, N. Khanjani, S. Rezaei and S. K. Ghadiri, Efficiency of Multi Walled Carbon Nanotubes for Removing Direct Blue 71 from Aqueous Solutions, Eurasian J. Anal. Chem., 2018, 13(2), em Search PubMed.
- M. N. Mubarak, N. Sazila, S. Nizamuddin, E. C. Abdullah and J. N. Sahu, Adsorptive Removal of Phenol from Aqueous Solution by Using Carbon Nanotubes and Magnetic Bio Char, NanoWorld J., 2017, 3(2), 32–37 CrossRef.
- C. E. El shafiee, M. O. Abdel-salam, S. M. N. Moalla, H. R. Ali, D. I. Osman, R. I. Abdallah and Y. M. Moustafa, Carbon Nanotubes as Superior Sorbent for Removal of Phenol from Industrial Wastewater, Egypt. J. Chem., 2018, 61(1), 75–84 Search PubMed.
- O. A. Bin-Dahman and T. A. Saleh, Synthesis of carbon nanotubes grafted with PEG and its efficiency for the removal of phenol from industrial wastewater, Environ. Nanotechnol., Monit. Manage., 2020, 13, 100286 Search PubMed.
|
| This journal is © The Royal Society of Chemistry 2024 |
Click here to see how this site uses Cookies. View our privacy policy here. 
 Open Access Article
 This Open Access Article is licensed under a Creative Commons Attribution-Non Commercial 3.0 Unported Licence
 g,
H. A. Al-Lohedang,
S. R. M. Sayedh and
T. C. Egbosiubai
g,
H. A. Al-Lohedang,
S. R. M. Sayedh and
T. C. Egbosiubai