 Open Access Article
Fabrication of rare-earth cerium-doped nickel–copper ferrite as a promising photo-catalyst for congo red-containing wastewater treatment
Morsheda Akhter,
Md. Khairul Amin,
Palash Kumar Dhar,
Shishir Kumar Dey,
Muhammad Sarwar Hossain and
Sagar Kumar Dutta
 *
*
Chemistry Discipline, Khulna University, Khulna 9208, Bangladesh. E-mail: sagar@chem.ku.ac.bdmailto:khairul.che@ku.ac.bd
First published on 13th September 2024
Abstract
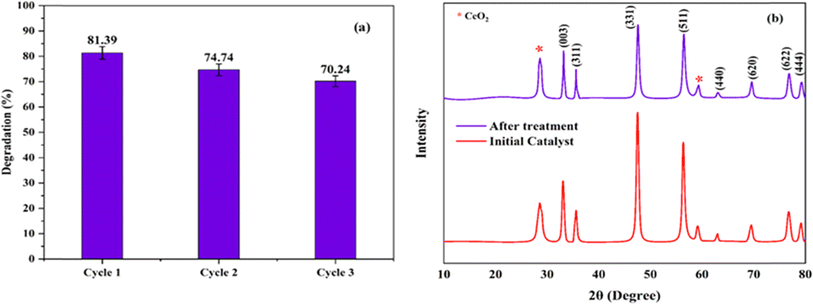
Synthetic organic dyes are becoming the major class of water pollutants leading to malignant detriments to the ecology. Consequently, this research focuses on remediating this circumstance utilizing a novel catalytic material, namely, cerium-doped spinel ferrite Ni0.6Cu0.4CexFe2−xO4 (x = 0.0, 0.5, 1.0, 1.5), developed using the chemical coprecipitation technique and characterized using FTIR, XRD, FE-SEM, EDX and VSM analysis. The particles have shown band gap values ranging from 4.29 to 2.01 eV. The as-synthesized nano-sized particles were employed as a photocatalyst to degrade the complex structure of congo red (CR) dye. About 91% of the dye was degraded with 60 mg of the catalyst under visible light irradiation with the highest cerium-doping (x = 1.5) at a pH below 6.8, which was the zero-surface charge pH for the particle. Batch studies were performed to optimize all the conditions, including the dose, concentration, pH, and different light energy sources. Recyclability of the catalyst was also investigated, which was supported by the higher stability of the recovered particles through XRD analysis. Reaction kinetics for this system were evaluated along with three isotherm models. Moreover, the scavenging test indicated that the major active species leading to this degradation was hole (h+), and a schematic degradation mechanism is presented. Following that, this model can successfully be used for wastewater treatment.
1. Introduction
Heterogeneous photocatalysis serves as an adaptable treatment approach for an extensive array of pollutants in water. Nanomaterials are popular as heterogeneous catalysts for the degradation of organic dyes, which are one of the major classes of organic pollutants in water sources.1 These nanomaterials possess a considerably high surface area, making them exceptionally efficient for photocatalysis, and they are economical in terms of catalyst recovery after treatment.2 The oxidative degradation of large organic dye molecules, commonly referred to as advanced oxidation processes (AOPs), utilizes heterogeneous nano-catalysts to produce smaller molecules (such as CO2, H2O, etc.) with the assistance of external light energy. This protocol presents a promising and fascinating approach to wastewater treatment in contemporary times.3 AOP with photocatalysts works through the process of electronic transition from the valence band to the conduction band, leading to the generation of electron–hole (e−/h+) pairs on the catalyst surface, which actively participate in the degradation of organic compounds.4Azo dyes are considered as both the oldest class and largest type of synthetic dyes, owing to their compatibility for various substrate materials. Congo red (CR) is a diazo dye that is widely used in textile industries owing to its greater adherence for cellulose fibers. It is also used in the diagnosis of amyloidosis and as a pH indicator.5 It has been proven to be carcinogenic to humans, even at low concentrations, impairing aquatic system homeostasis. Its short-term effects in humans include diarrhea, vomiting, and nausea, while long-term exposure can lead to mutagenic and genotoxic effects.6 Various approaches have been adopted for the removal of CR from wastewater, including adsorption, biological treatment, physiochemical treatment, coagulation/flocculation, ozonation, photocatalytic degradation, biodegradation, and catalytic reduction.7 Among them, photocatalysis using nanomaterials has attained greater acceptance due to its excellent degradation efficiency, easy and convenient methods, and production of non-toxic metabolites after degradation.8,9
Spinel ferrite is a class of composite material that is gaining special attention because of its prominent features, including its application as a magnetic material in devices, such as recording disks, electrical motors, microphones, and sensors.10,11 Ferrites can exist in the form of a single-phase spinel (AFe2O4) or doped spinel [(AxBy) Fe2O4], and the spinel structure can even be doped with various rare earth ions to alter the lattice's physical characteristics. Moreover, spinel ferrites fabricated with nickel and copper ions have demonstrated their excellent physicochemical properties.12,13 Rare-earth cerium, in its simple oxide form, exhibits very effective catalytic performance. However, it is challenging to insert the cerium ion (Ce3+) with its larger ionic radius into the crystal structure of ferrite by replacing Fe3+ ions, which have a comparatively smaller ionic radius.14 Nevertheless, the successful insertion of Ce3+ can impart excellent properties, such as reduced crystallite size because of its hindrance to crystal growth. Moreover, Ce3+ tends to the octahedral voids of the spinel ferrite lattice.15 This octahedral site occupancy, along with the smaller crystallite size and high surface-to-volume ratio, can significantly enhance the catalytic performance of the ferrite, as the octahedral sites are the catalytically active parts.16 The synthesis methods play an important role in producing high-quality ferrite materials in terms of morphology, purity, stability, and surface area. Currently, various synthesis methods are used for the preparation of ferrite materials, such as chemical co-precipitation,17 hydrothermal,18 and sol–gel,19 each of which has its own advantages and disadvantages. The chemical coprecipitation method is particularly attractive owing to its simplicity, shorter reaction time, lower cost, mild reaction conditions, and high activity.20,21
Few works have been reported with cerium-doping in spinel ferrite for use as a photocatalyst to degrade organic dye. Following that, this research aims to develop a spinel ferrite catalyst by incorporating rare-earth Ce3+ ion, Ni0.6Cu0.4CexFe2−xO4 (x = 0.0, 0.5, 1.0, 1.5) using the chemical co-precipitation method. Analytical methods, including FT-IR, XRD, FE-SEM, EDX, and VSM, were used to evaluate the successful fabrication of the material, which was studied as an exemplar framework catalyst for the photo-degradation of organic congo red (CR) dye in aqueous solutions. Along with different parameters, such as pH, concentration of the dye solution, dose of the catalyst, and different light sources, the mechanism of this degradation process was investigated using the scavenging test.
2. Experimental
2.1. Materials
Analytical grade reagents (purity 99%), including cerium nitrate hexahydrate (Ce(NO3)3·6H2O), nickel nitrate hexahydrate (Ni(NO3)2·6H2O), copper nitrate trihydrate (Cu(NO3)2·3H2O), ferric nitrate nonahydrate (Fe(NO3)3·9H2O), ammonia solution (NH4OH), ethanol (C2H5OH), congo red (C32H22N6Na2O6S2), sodium chloride (NaCl), disodium EDTA (C10H16N2Na2O8), isopropyl alcohol (C3H8O), and potassium dichromate (K2Cr2O7) were purchased from Merck, India, and used without any further purification. Deionized water (WGH201 ion exchange) was used throughout the experiment.2.2. Synthesis of Ni0.6Cu0.4CexFe2−xO4
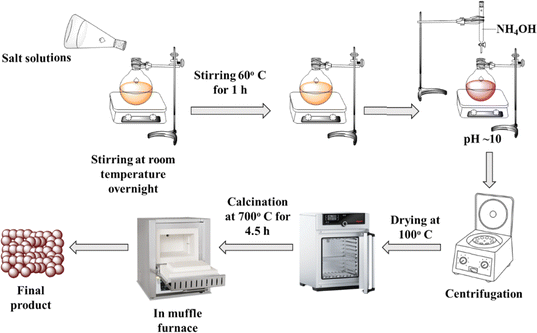
The synthesis of Ni0.6Cu0.4CexFe2−xO4 (x = 0.0, 0.5, 1.0, 1.5) was performed using the co-precipitation method, as described in the literature,22–25 and is schematically represented in Fig. 1. Stoichiometric amounts of Ni(NO3)2·6H2O, Cu(NO3)2·3H2O, Ce(NO3)3·6H2O, and Fe(NO3)3·9H2O were dissolved in 50 mL of water. The solutions were then mixed together and stirred overnight using a magnetic stirrer. Afterward, 25% of NH3 solution was added dropwise to the mixture as a precipitating agent at 60 °C, initiating particle formation. The pH of the mixture was adjusted to about 10. The mixture was then kept under stirring at 60 °C for 1 h to complete the reaction. The resulting precipitate was left overnight, and then washed several times with water and ethanol to adjust the pH to near 7. The particles were subsequently dried in an oven at 100 °C, and finally calcined in a muffle furnace at 700 °C for 4.5 h.The reactions that take place during the process can be represented as follows:
| 0.6 [(Ni(NO3)2·6H2O)] + 0.4 [Cu(NO3)2·3H2O] + x [Ce(NO3)3·6H2O] + 2−x [(Fe (NO3)3·9H2O)] + NH4OH + Δ → Ni0.6Cu0.4CexFe2−xO4 + H2O + volatiles | (1) |
2.3. Characterization
The formation of metal–oxygen bonds within the crystal lattice of the ferrite samples was analyzed using Fourier transform infrared (FT-IR) spectroscopy within the range of 300–4000 cm−1 using the SHIMADZU IR Sprit Fourier transform infrared spectrometer. X-ray diffraction (XRD) measurements were conducted at the Material Science Division of Atomic Energy Center, Dhaka, Bangladesh, using a Philips X'pert PRO X-ray diffractometer with CuKα radiation (1.5418 Å) to confirm the phase formation of the crystal. Surface morphology and elemental analysis were performed using field-emission scanning electron microscopy (FE-SEM) and energy dispersive X-ray (EDX) spectroscopy (JEOL JSM-7600F). The magnetic properties of the samples were analyzed using a Microsense vibrating sample magnetometer (VSM) model EV7 at the Atomic Energy Center, Dhaka, Bangladesh. The point of zero charge (pHPZC) study was performed using the pH drift method, as reported previously with slight modifications.262.4. Photocatalytic degradability test
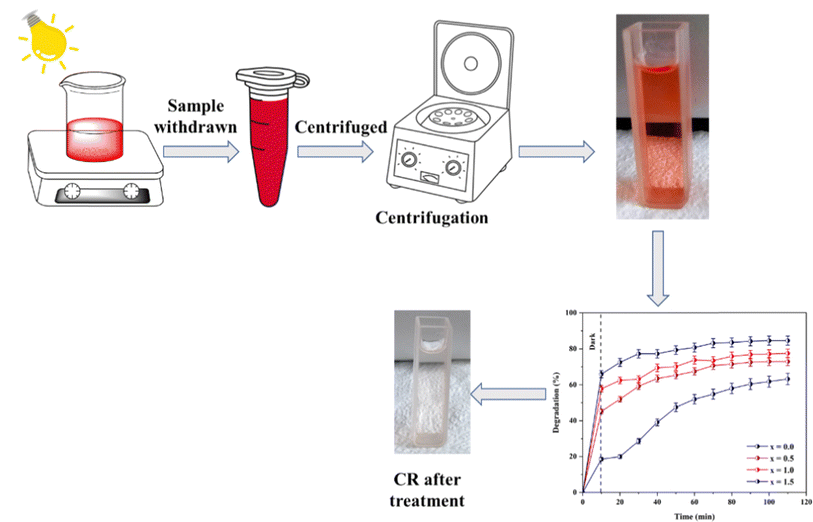
In this study, the photocatalytic degradation process of CR was analyzed using the synthesized Ni0.6Cu0.4CexFe2−xO4 material. In an optimized case, 50 mL of a 40 ppm CR dye solution was stirred with 60 mg of catalyst for 10 min in a dark system to obtain the adsorption–desorption equilibrium between the catalyst surface and dye molecules. Subsequently, the mixture was irradiated with a light energy source. At intervals of 10 min, aliquots of the sample solution were taken, and particles were separated by centrifugation. The absorbance of the solution was measured using a UV-visible spectrophotometer (SHIMADZU UV-1900i). CR dye exhibits absorbance maxima at a wavelength (λmax) of 498 nm. At each time point, the absorbance value at 498 nm was recorded, and the remaining concentration of the CR solution was calculated using the calibration curve technique. The percent degradation of the CR dye by the catalyst was calculated using the formula below:27
 | (2) |
The batch studies were carried out to optimize all degradation conditions, including the catalyst dose, CR solution concentration, pH, and light source variation. Catalyst dose variations of 30, 40, 50, 60, and 70 mg were tested in 50 mL of CR solution with concentration variations of 20, 30, 40, and 50 ppm at different pH values (4, 5, 6.5, 7, 8, and 9). The overall process is schematically represented in Fig. 2.
2.5. Analysis of scavenging effect on degradation
To investigate the photocatalytic activity mechanism of the photocatalyst, identifying the main reactive species is very crucial. The possible reactive species participating in the degradation could be h+, e−, HO˙, or O2−. Then, the radical scavenging test in the photodegradation was performed using 5 mM EDTA (for h+ scavenging), K2Cr2O7 (for e− scavenging) and isopropyl alcohol (for HO˙ scavenging) individually. The degradation efficiency after 100 min was measured with 50 mL 40 ppm CR solution loaded with 60 mg of catalyst.28–313. Results and discussions
3.1. Fourier transform-infrared (FT-IR) spectroscopy
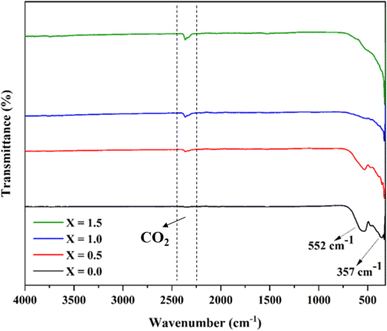
The FTIR spectrum (Fig. 3) exhibited two characteristic peaks at 552 and 357 cm−1, which are indicative of metal–oxygen bonds. Specifically, the vibration at 552 cm−1 indicates the tetrahedral sites, while the signal at 357 cm−1 represents the octahedral sites. These findings align with previous research identifying the signals as indicative of MFe2O4 type spinel ferrite, suggesting the formation of a spinel ferrite composite without additional bonding.32 It is worth noting that the intensity of the tetrahedral stretching vibration decreases with an increase in the Ce3+ ion concentration. Therefore, it can be predicted that with an increase of cerium content in the composition, the metal ions predominately orient into the octahedral voids of the crystal lattice. Consequently, this shift enhances the composite's catalytic properties, as the octahedral sites of the spinel ferrites are primarily responsible for their catalytic properties.33 A characteristic peak near 2500 cm−1 is obtained for CO2. Similar spectral patterns for cerium-doped ferrites have been reported by Zakir et al. (2021).343.2. X-ray diffraction (XRD)
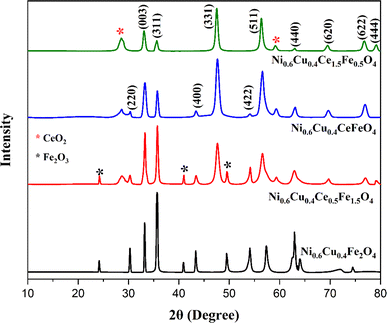
The XRD spectrum of Ni0.6Cu0.4CexFe2−xO4 (x = 0.0, 0.5, 1.0, 1.5) shows well-defined and high intensity peaks (Fig. 4). In the figure, the sharp peaks correspond to the (220), (003), (311), (400), (331), (422), (511), (440), (533), (622), and (444) planes, in accordance with JCPDS cards (011-6755) and (22-1086), confirming the successful formation of spinel ferrite.35,36 Additionally, there are peaks at 2θ = 24.1°, 40.85°, and 49.46°, corresponding to the α-Fe2O3 phase. An additional peak appears at 56.29° that corresponds to CeO2, which is possibly due to insufficient reaction. A similar XRD pattern was also reported.35The crystallite size was calculated by the Scherrer formula using the full width at half maxima (FWHM) values of each corresponding peaks.
 | (3) |
The lattice parameter, which is the edge length of the unit cell in three different axes, was calculated using the formula for a cubic spinel where the lengths of the three edges are equal:
 | (4) |
The d-spacing (dhkl) is calculated from Bragg's law.
2dhkl![[thin space (1/6-em)]](https://www.rsc.org/images/entities/char_2009.gif) sin sin![[thin space (1/6-em)]](https://www.rsc.org/images/entities/char_2009.gif) θ=λ θ=λ |
 | (5) |
The values of the lattice parameter closely match those reported in the literature.35,38
The X-ray density (ρx) was calculated using the formula:
 | (6) |
Since Ce3+ has larger ionic radii compared to Fe3+, it may expect to increase the crystallite size of the ferrite with gradual insertion of cerium (Table 1). Nevertheless, from x = 0.0 to x = 1.0, the crystallite size was decreased as the Ce3+ concentration increased because the crystallite size of the ferrite was influenced mostly by the cationic distribution rather than the ionic radii. Certainly, this larger ionic size imparted a positive effect on the crystallite size by hindering the crystal growth of the ferrite.15 However, at x = 1.5, the crystallite size slightly increased. This can be attributed to the different concentrations. At lower concentrations, crystal growth is controlled and hindered. Conversely, at higher Ce3+ concentration, it favors crystal formation near the nucleation center, resulting in increased crystallite size.39 The X-ray density also increased with the increase in Ce3+ content. This is because the molecular weight and density of the Ce3+ ion are higher than those of the Fe3+ ion.
| Cerium content (X) | Average crystallite size, D (nm) | Average lattice parameter, a (Å) | X-ray density, p (g cm−3) |
|---|---|---|---|
| X = 0.0 | 38.19 | 8.310 | 5.47 |
| X = 0.5 | 19.48 | 8.308 | 6.45 |
| X = 1.0 | 16.15 | 8.302 | 7.44 |
| X = 1.5 | 18.83 | 8.158 | 8.87 |
3.3. Surface morphology and elemental analysis
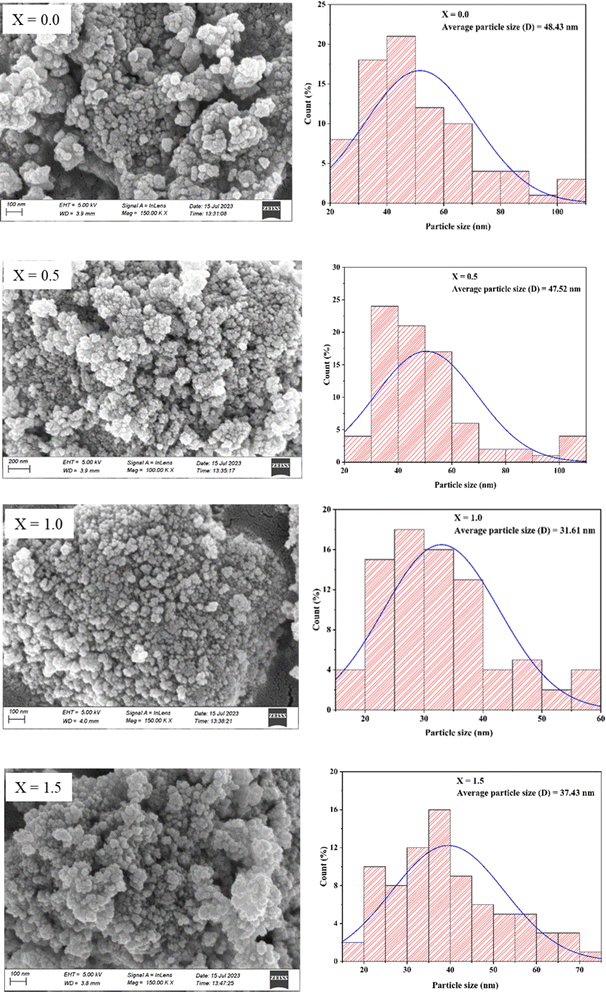
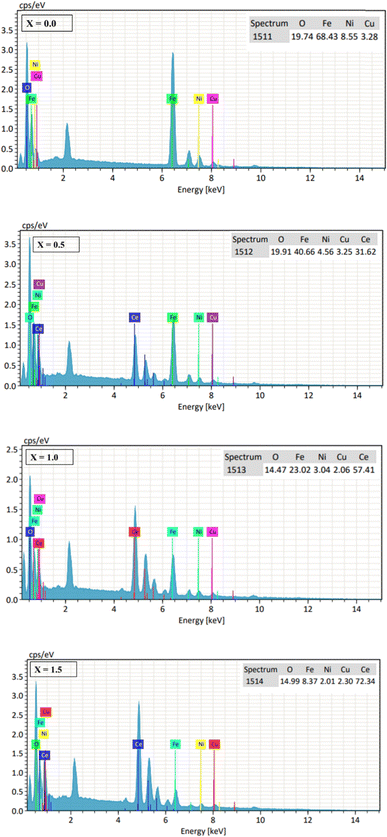
Surface morphology analysis of the synthesized materials was performed using field-emission scanning electron microscopy (FE-SEM), where the well-distributed particles were observed. The analysis was performed using ImageJ to determine the average particle size by the distribution histogram to the log-normal distribution function, as reported (Fig. 5).40
 | (7) |
3.4. Band gap
The band gap energy of ferrites plays a crucial role in their photocatalytic performance. Materials with a higher band gap value have limited photocatalytic performance due to their ability to exploit lesser amount of photon energy for their electronic excitation and transition.42 Lowering the band gap indicates that the electronic transition from the valence band (VB) to the conduction band (CB) requires less energy, thus promoting the formation of an electron–hole pair (e−/h+) and consequently enhancing the photocatalytic performance of the catalyst (Fig. 8a). The band gap values of the catalysts were calculated using the Tauc equation:| (αhν)n = β(hν − Eg) | (8) |
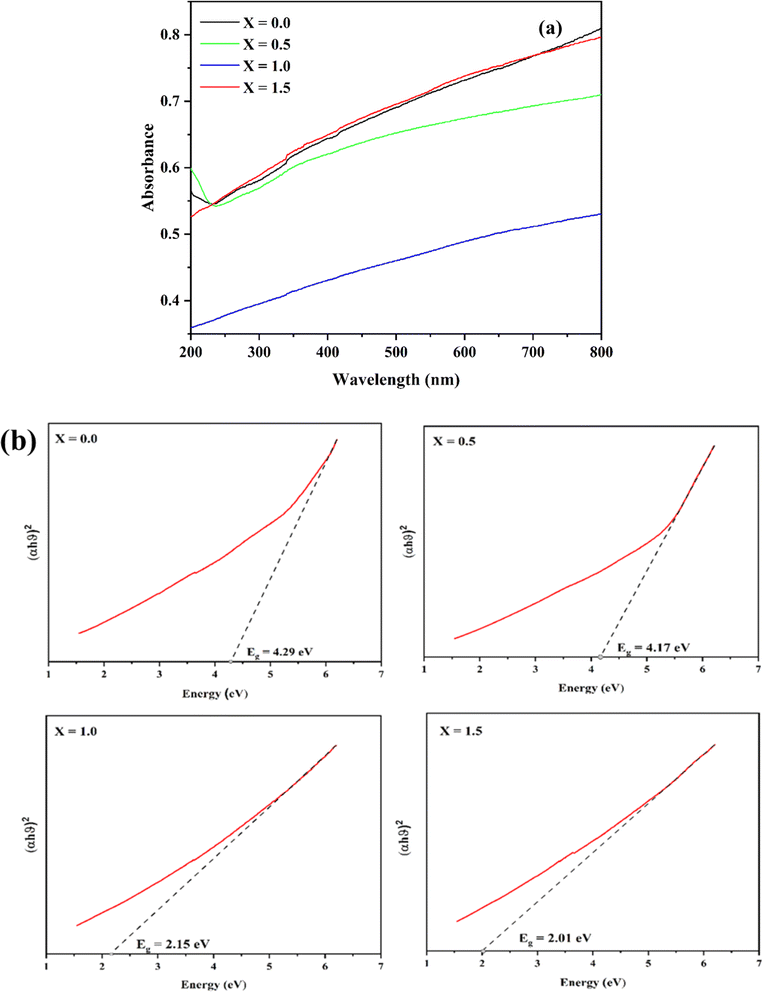 | ||
| Fig. 8 (a) UV-visible spectra and (b) Tauc plot for band gap analysis of Ni0.6Cu0.4CexFe2−xO4 (x = 0.0, 0.5, 1.0, 1.5). | ||
3.5. Vibrating sample magnetometer (VSM) analysis
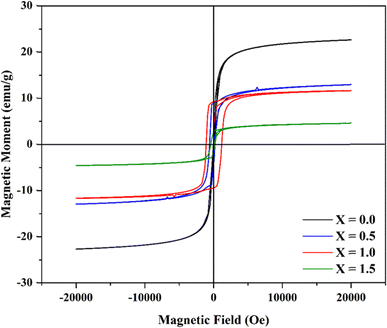
The VSM data were used to analyze the magnetic hysteresis loop. The loop was plotted with the magnetic moment (emu g−1) versus the applied magnetic field, H (Oe) data obtained at 300 K (Fig. 9). The hysteresis curve shows a slightly narrower loop with moderately smaller values of saturation magnetization (MS) and magnetic remanence (MR), which indicates the material as a soft magnetic ferrite.44,45The values of the magnetic remanence (MR) and coercivity (HC) increased with the increase of Ce3+ up to x = 1.0, while the values then decreased for x = 1.5 (Table 2). The highest coercivity has been observed for Ni0.6Cu0.4CeFeO4, with a comparatively wider hysteresis loop. This reveals that it is the harder magnet with a greater value of cerium-doped spinel ferrites obtained by the coprecipitation method reported earlier.38
| Content | MS (emu g−1) | MR (emu g−1) | HC (Oe) |
|---|---|---|---|
| X = 0.0 | 22.61 | 0.63 | 29.02 |
| X = 0.5 | 12.94 | 8.99 | 594.93 |
| X = 1.0 | 11.64 | 9.22 | 1094.39 |
| X = 1.5 | 4.57 | 2.67 | 428.01 |
3.6. Photocatalytic degradability
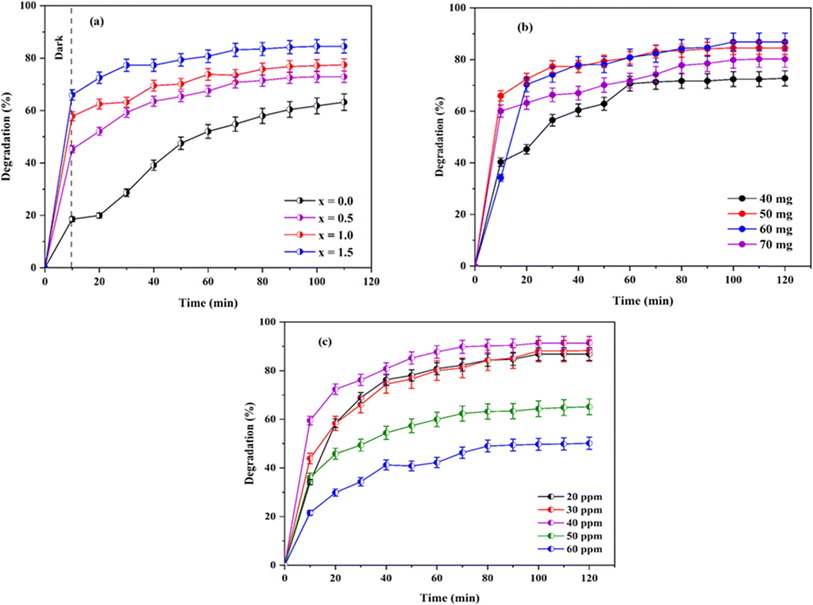 | ||
| Fig. 10 (a) Efficiency of the catalyst, (b) effect of the dosage, and (c) effect of the concentration on the degradation. | ||
The photocatalytic activity of undoped Ni0.6Cu0.4FeO4 (x = 0.0) was only 63.18% with the above-applied condition, which has gradually increased with the increase in the amount of Ce3+ in the catalyst. The activity has increased to 72.88% with the increase of Ce3+ (x = 0.5). The further increase of Ce3+ (x = 1.0) has shown 77.45% of degradation, while the highest activity (84.51%) has been observed with the maximum Ce3+ concentration (x = 1.5). The activity series of the catalyst can be written as Ni0.6Cu0.4FeO4 < Ni0.6Cu0.4Ce0.5Fe1.5O4 < Ni0.6Cu0.4CeFeO4 < Ni0.6Cu0.4Ce1.5Fe0.5O4. The obtained result can be explained based on XRD, SEM, band gap and FTIR analysis. In the XRD and SEM analysis, Ni0.6Cu0.4Ce1.5Fe0.5O4 (X = 1.5) has a larger particle size than Ni0.6Cu0.4CeFeO4 (X = 1.0), with a reduced band gap value, as shown from the FTIR analysis of the catalyst. X = 1.5 exhibits enhanced cationic occupation in the octahedral void of the crystal structure, which contributed to the improved catalytic performance.
Therefore, it can be concluded that the doping of Ce3+ into the Ni0.6Cu0.4FeO4 spinel ferrite has a positive influence on the photocatalytic degradation of CR.
Following that, an experiment was carried out to optimize the concentration of CR to get the best catalyst performance using 60 mg of Ni0.6Cu0.4Ce1.5Fe0.5O4 per 50 mL CR solutions (Fig. 10c). Here, the degradation efficiency has increased with the increase of concentration of CR solution from 20 ppm (86.80%) to 30 ppm (88.08%). Moreover, the highest activity was observed with 40 ppm (91.34%) of CR solution, but the degradation efficiency decreased with a further increase of concentration to 50 ppm (65.15%) and 60 ppm (50.13%). With the higher dye concentration above 40 ppm, the formation of the reactive species from the catalyst surface is also reduced due to increased interaction between the dye molecules with light at higher dye concentration.46,47 Therefore, the results obtained from the study of the dose and concentration are correlated. There must be a suitable catalyst dose-to-concentration ratio that is required to observe the maximum degradation rate by the photocatalyst.
In this study, the optimized dose and concentration were observed to be 60 mg of 40 ppm CR in 50 mL solution.
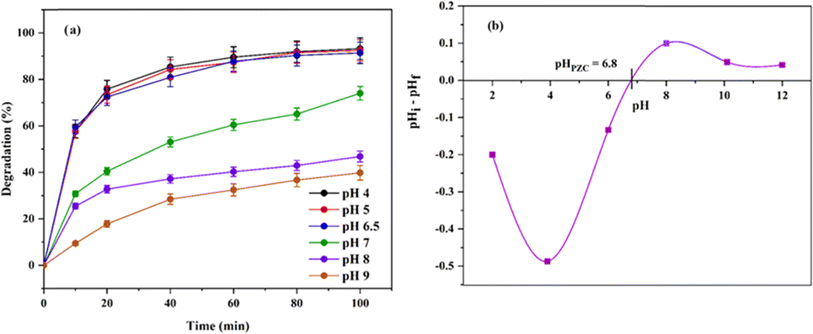 | ||
| Fig. 11 (a) Effect of pH on the degradation efficiency. (b) Point of zero charge for Ni0.6Cu0.4Ce1.5Fe0.5O4. | ||
The variation in the degradability is due to the change in adsorption behavior of the catalyst at different pH values. The adsorption–desorption processes are influenced by the alteration of the nature of the electrical double layer of the particle interface.48 The obtained result can be explained as follows. At low pH, the positive surface of the catalyst facilitates the degradation efficiency due to the electrostatic affinity of the catalyst towards anionic CR dye. Furthermore, at a high pH value, the surface gets a charge similar to the anionic CR, which repeals the dye molecules from the vicinity of the catalyst surface. Thus, the adsorption of dye molecules is reduced, consequently decreasing the degradation percentage. The process is depicted schematically in Fig. 12.
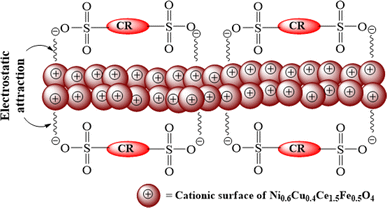 | ||
| Fig. 12 Schematic representation of the electrostatic attraction between the cationic surface of the catalyst with the anionic CR. | ||
The result can be evident from the point of zero charge (PZC) study of Ni0.6Cu0.4Ce1.5Fe0.5O4, which is pHPZC = 6.8, and supports the outcome mentioned above in this section (Fig. 11b). PZC commonly states that at pH < pHPZC, the surface of the solid material is positively charged, and vice versa. Thus, CR is an anionic dye that can be adsorbed best to a surface having an opposite charge. Hence, in this study, the catalytic activity was highly maintained below pH 7.0. The CR anions were, however, typically excluded away from the similarly charged catalyst surface at higher pH levels. Consequently, the degradation ratio then started to decrease. Similar results have been reported describing the effect of the initial solution pH on the degradation of CR.49,50
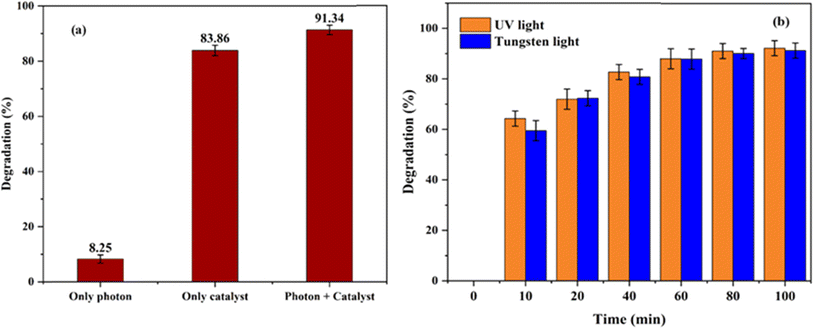
The experiment carried out using 60 mg of Ni0.6Cu0.4Ce1.5Fe0.5O4 catalyst for 50 mL of 40 ppm dye with CR under visible light radiation with no catalyst showed only 8.25% degradation, while the catalyst alone with no light showed 83.86% removal (Fig. 13a). Hence, it can be concluded that the synergistic effect of light with the catalyst yields an excellent result of 91.34% degradation of the toxic CR dye in aqueous solution.
This may be attributed to the higher energy of the radiation in UV light compared to other lights, leading to higher degradation efficiency.
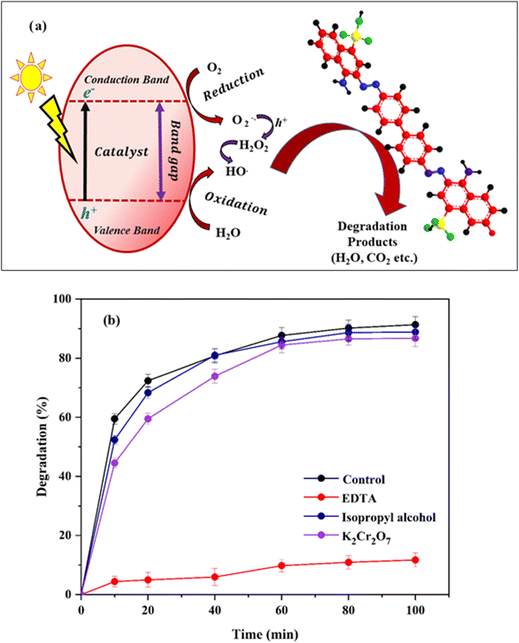 | ||
| Fig. 14 (a) Schematic representation of the degradation mechanism of CR by Ni0.6Cu0.4CexFe2−xO4 under light energy. (b) Role of different scavengers on quenching the degradation percentage. | ||
| Catalyst | Synthesis method | Crystallite size | Treated dye | Optimum dose | Optimum concentration | Optimum pH | Efficiency | Ref. |
|---|---|---|---|---|---|---|---|---|
| NiO | Coprecipitation | 41 nm | Congo red | 20 mg | 10 ppm | 4 | 72% | 51 |
| Ag-CdS@Pr-TiO2 | Sol–gel | 28.32 nm | Methyl orange | 2 μg | 32 mg L−1 | — | 98% | 52 |
| CoFe2O4 | Coprecipitation | 44.26 nm | Methylene blue | — | — | — | 74% | 53 |
| GO/CuFe2O4 | Precipitation | 2.221 Å | Malachite green | — | — | — | 62% | 54 |
| fs-CoFe2O4 | Coprecipitation | 5.26 nm | Congo red | 35 mg | 5 ppm | 9 | 91% | 46 |
| Co0.6Zn0.1Ni0.3Ce0.15Fe1.85O4 | Sol–gel auto combustion | 38 nm | Congo red | — | — | Up to 7 | 94.50% | 55 |
| Ni0.6Cu0.4Ce1.5Fe0.5O4 | Coprecipitation | 18.83 nm | Congo red | 60 mg | 40 ppm | Up to 6.5 | 91% | Present work |
3.7. Kinetic model
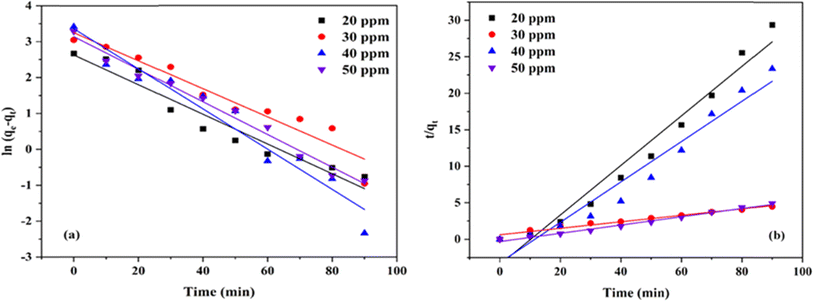
The study of adsorption kinetics gives critical information regarding the degradation mechanism. In this study, pseudo-first-order and pseudo-second-order models were used to assess the adsorption kinetics. Lagergren's pseudo-first-order kinetic model, which describes the physisorption between the adsorbent and adsorbate, can be represented in the linear form as follows:56
 | (9) |
Moreover, the linear form of the rate equation for the pseudo-second-order kinetic model can be written as follows:
 | (10) |
The plot of the kinetic model for CR on Ni0.6Cu0.4Ce1.5Fe0.5O4 is represented in Fig. 16a and b, and the values are tabulated in Table 4. Considering the correlation coefficient (R2) values for both models, it can be said that the process follows pseudo-second-order kinetics rather than the pseudo-first-order kinetics. As a result, the rate-determining step followed the chemisorption process.
| Concentration (ppm) | Pseudo-first-order | Pseudo-second-order | ||||
|---|---|---|---|---|---|---|
| qe (mg g−1) | k1 (min−1) | R2 | qe (mg g−1) | k2 (g mg−1 min−1) | R2 | |
| 20 | 13.86 | 0.00046 | 0.9445 | 15.50 | 0.00416 | 0.9811 |
| 30 | 25.81 | 0.00044 | 0.9288 | 22.47 | 0.00198 | 0.9644 |
| 40 | 28.82 | 0.00062 | 0.9485 | 31.45 | 0.00101 | 0.9953 |
| 50 | 23.14 | 0.00051 | 0.9839 | 28.09 | 0.00127 | 0.9893 |
3.8. Isotherm analysis
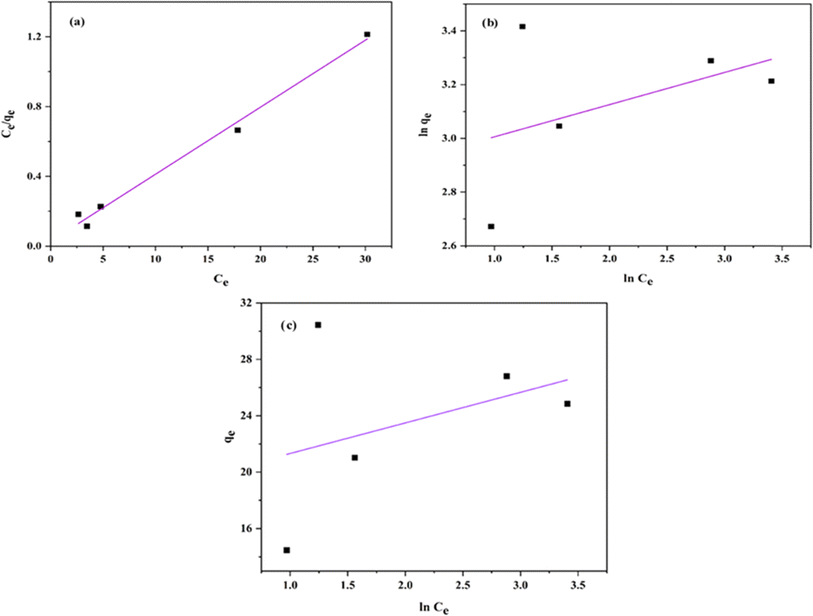
The adsorption isotherm was also evaluated to understand the degradation behavior of CR with the synthesized catalyst using the Langmuir, Freundlich, and Temkin models. Those can be expressed in the linear form as follows:56,57
 | (11) |
 | (12) |
qe = B![[thin space (1/6-em)]](https://www.rsc.org/images/entities/char_2009.gif) ln ln![[thin space (1/6-em)]](https://www.rsc.org/images/entities/char_2009.gif) KT + B KT + B![[thin space (1/6-em)]](https://www.rsc.org/images/entities/char_2009.gif) ln ln![[thin space (1/6-em)]](https://www.rsc.org/images/entities/char_2009.gif) Ce Ce
| (13) |
The plot of the isotherm models is represented in Fig. 17a–c, and the values are tabulated in Table 5. The correlation coefficient (R2) values were obtained as follows: Langmuir model is R2 = 0.9903, Freundlich is R2 = 0.1986, and Temkin is R2 = 0.1448. Hence, the adsorption process is best fitted with the Langmuir adsorption model, indicating that the adsorption occurred by the formation of a monolayer of dye molecule on the adsorbent surface.
| Langmuir | Freundlich | Temkin | ||||||
|---|---|---|---|---|---|---|---|---|
| qm (mg g−1) | KL (L mg−1) | R2 | n | KF | R2 | B (J mol−1) | KT (L g−1) | R2 |
| 26.04 | 1.37 | 0.9903 | 8.35 | 17.9215 | 0.1986 | 2.169 | 6.84 | 0.1448 |
4. Conclusion
Cerium-doped copper zinc ferrite, Ni0.6Cu0.4CexFe2−xO4 (x = 0.0, 0.5, 1.0, 1.5), has been successfully synthesized by the co-precipitation method. The FTIR and XRD analyses confirmed the successful formation of cerium-doped ferrite with relatively smaller crystallite size, while the morphological analysis has shown that the particles have agglomeration. The synthesized catalyst has been successfully utilized in the degradation of congo red dye via photocatalytic process, varying doses, concentrations, and pH. The catalyst exhibited the highest efficiency of ∼91% (when x = 1.5) in degrading CR at a dose of 60 mg dose in a 40 ppm CR solution at pH 6.5. Batch studies were conducted to evaluate the influence of light on the degradation efficiency, revealing a higher percentage of degradation under light compared to a dark system. The radical scavenging assay was performed to understand the degradation pathway and identified h+ as the primary reactive species responsible for this degradation. Moreover, the catalyst has potent recycling qualities and is not structurally altered when it is recycled. The kinetic studies showed that the system followed a pseudo-second-order kinetic model, thus corresponding to a chemisorption process. Furthermore, adsorption isotherm studies revealed that the Langmuir isotherm was most suitable for describing the system, outperforming the Freundlich and Temkin isotherms.Data availability
The data that support the findings of this study are available on request from the corresponding author. The data are not publicly available due to restrictions [e.g., their containing information that could compromise the privacy of research participants].Author contributions
Morsheda Akhter: validation, investigation, formal analysis, software, writing – original draft; Md. Khairul Amin: visualization, writing – review & editing; Palash Kumar Dhar: writing – review & editing; Shishir Kumar Dey: writing – review & editing; Sagar Kumar Dutta: conceptualization, methodology, visualization, software, supervision.Conflicts of interest
The authors declare that they have no known competing financial interests or personal relationships that could have appeared to influence the work reported in this paper.Acknowledgements
The authors are grateful to Chemistry Discipline, Khulna University, Khulna-9208 for providing the necessary laboratory facilities.References
- A. Soufi, H. Hajjaoui, R. Elmoubarki, M. Abdennouri, S. Qourzal and N. Barka, Appl. Surf. Sci. Adv., 2022, 9, 100251 CrossRef.
- K. K. Kefeni and B. B. Mamba, Sustainable Mater. Technol., 2020, 23, e00140 CrossRef CAS.
- E. N. Zare, S. Iftekhar, Y. Park, J. Joseph, V. Srivastava, M. A. Khan, P. Makvandi, M. Sillanpaa and R. S. Varma, Chemosphere, 2021, 280, 130907 CrossRef CAS PubMed.
- H. Liu, C. Wang and G. Wang, Chem.–Asian J., 2020, 15, 3239–3253 CrossRef CAS.
- Y. Yang, N. Ali, A. Khan, S. Khan, S. Khan, H. Khan, S. Xiaoqi, W. Ahmad, S. Uddin, N. Ali and M. Bilal, Int. J. Biol. Macromol., 2021, 167, 169–181 CrossRef CAS PubMed.
- B. Sharma, S. Tiwari, N. Bisht and L. Tewari, Ind. Crops Prod., 2021, 170, 113755 CrossRef CAS.
- K. Naseem, Z. H. Farooqi, R. Begum and A. Irfan, J. Cleaner Prod., 2018, 187, 296–307 CrossRef CAS.
- A. I. Borhan, P. Samoila, V. Hulea, A. R. Iordan and M. N. Palamaru, J. Photochem. Photobiol., A, 2014, 279, 17–23 CrossRef CAS.
- T. de Oliveira Guidolin, N. M. Possolli, M. B. Polla, T. B. Wermuth, T. Franco de Oliveira, S. Eller, O. R. Klegues Montedo, S. Arcaro and M. A. P. Cechinel, J. Cleaner Prod., 2021, 318, 128556 CrossRef CAS.
- M. Haneef, I. H. Gul, M. Hussain and I. Hassan, J. Supercond. Novel Magn., 2021, 34, 1467–1476 CrossRef CAS.
- E. Z. Hegazy, S. A. Kosa, I. H. Abd Elmaksod and J. T. Mojamami, Ceram. Int., 2019, 45, 7318–7327 CrossRef CAS.
- Z. K. Heiba, M. Bakr Mohamed, L. Arda and N. Dogan, J. Magn. Magn. Mater., 2015, 391, 195–202 CrossRef CAS.
- P. Zhang, B. Yu and L. Zhang, Sci. China, Ser. B: Chem., 2009, 52, 101–108 CrossRef CAS.
- P. Samoila, C. Cojocaru, L. Sacarescu, P. Pascariu, A. Domocos and A. Rotaru, Appl. Catal., B, 2017, 202, 21–32 CrossRef CAS.
- K. Tanbir, M. Prasad, G. Rakesh, K. Singh, M. Kar and S. Mukherjee, J. Mater. Sci.: Mater. Electron., 2020, 31, 435–443 CrossRef CAS.
- S. Jauhar, S. Singhal and M. Dhiman, Appl. Catal., A, 2014, 486, 210–218 CrossRef CAS.
- D. D. Andhare, S. R. Patade, J. S. Kounsalye and K. M. Jadhav, Phys. B Condens. Matter, 2020, 583, 412051 CrossRef CAS.
- M. A. Camacho-González, M. Quezada-Cruz, G. I. Cerón-Montes, M. F. Ramírez-Ayala, L. E. Hernández-Cruz and A. Garrido-Hernández, Mater. Chem. Phys., 2019, 236, 121808 CrossRef.
- A. Hakeem, T. Alshahrani, G. Muhammad, M. H. Alhossainy, A. Laref, A. Rauf, I. Ali, H. Muhammad, T. Farid, T. Ghrib, S. Rabia and R. Yasmin, J. Mater. Res. Technol., 2020, 11, 158–169 CrossRef.
- Y. Peng, C. Xia, M. Cui, Z. Yao and X. Yi, Ultrason. Sonochem., 2021, 71, 105369 CrossRef CAS PubMed.
- F. A. Hezam, N. O. Khalifa, O. Nur and M. A. Mustafa, Mater. Chem. Phys., 2021, 257, 123770 CrossRef CAS.
- M. Kamran and M. Anis-ur-Rehman, J. Alloys Compd., 2020, 822, 153583 CrossRef CAS.
- M. V. Limaye, S. B. Singh, S. K. Date, D. Kothari, V. R. Reddy, A. Gupta, V. Sathe, R. J. Choudhary and S. K. Kulkarni, J. Phys. Chem. B, 2009, 113, 9070–9076 CrossRef CAS.
- K. Maaz, S. Karim, A. Mashiatullah, J. Liu, M. D. Hou, Y. M. Sun, J. L. Duan, H. J. Yao, D. Mo and Y. F. Chen, Phys. B Condens. Matter, 2009, 404, 3947–3951 CrossRef CAS.
- S. Manouchehri, S. T. Mohammadi Benehi and M. H. Yousefi, J. Supercond. Novel Magn., 2016, 29, 2179–2188 CrossRef CAS.
- A. H. Zyoud, A. Zubi, S. H. Zyoud, M. H. Hilal, S. Zyoud, N. Qamhieh, A. R. Hajamohideen and H. S. Hilal, Appl. Clay Sci., 2019, 182, 105294 CrossRef CAS.
- D. Chahar, S. Taneja, S. Bisht, S. Kesarwani, P. Thakur, A. Thakur and P. B. Sharma, J. Alloys Compd., 2021, 851, 156878 CrossRef CAS.
- N. Abbas, N. Rubab, K. H. Kim, R. Chaudhry, S. Manzoor, N. Raza, M. Tariq, J. Lee and S. Manzoor, J. Colloid Interface Sci., 2021, 594, 902–913 CrossRef CAS PubMed.
- M. N. Alshabanat and M. M. Al-Anazy, J. Chem., 2018, 1, 9651850 Search PubMed.
- R. Behura, R. Sakthivel and N. Das, Powder Technol., 2021, 386, 519–527 CrossRef CAS.
- N. Elamin, A. Modwi, M. A. B. Aissa, K. K. Taha, O. K. Al-Duaij and T. A. Yousef, J. Mater. Sci.: Mater. Electron., 2021, 32, 2234–2248 CrossRef CAS.
- S. Qamar, M. N. Akhtar, K. M. Batoo and E. H. Raslan, Ceram. Int., 2020, 46, 14481–14487 CrossRef CAS.
- S. Jauhar and S. Singhal, Ceram. Int., 2014, 40, 11845–11855 CrossRef CAS.
- R. Zakir, S. S. Iqbal, A. U. Rehman, S. Nosheen, T. S. Ahmad, N. Ehsan and F. Inam, Ceram. Int., 2021, 47, 28575–28583 CrossRef CAS.
- S. Anjum, T. Zeeshan, S. Waseem, I. Waseem and Z. Mustafa, Appl. Phys. A: Mater. Sci. Process., 2022, 128, 1–13 CrossRef.
- B. Bhujun, M. T. T. Tan and A. S. Shanmugam, Results Phys., 2017, 7, 345–353 CrossRef.
- S. Debnath, K. Deb, B. Saha and R. Das, J. Phys. Chem. Solids, 2019, 134, 105–114 CrossRef CAS.
- K. Hussain, N. Amin and M. I. Arshad, Ceram. Int., 2021, 47, 3401–3410 CrossRef CAS.
- E. Hema, A. Manikandan, P. Karthika, S. A. Antony and B. R. Venkatraman, J. Supercond. Novel Magn., 2015, 28, 2539–2552 CrossRef CAS.
- S. Kumar, S. Kumari, M. Kar, A. Singh, H. Pathak, J. P. Borah and L. Kumar, J. Phys. Chem. Solids, 2021, 151, 109928 CrossRef.
- J. Sarkar, S. Kalyan Roy, A. Laskar, D. Chattopadhyay and K. Acharya, Mater. Lett., 2013, 92, 313–316 CrossRef CAS.
- M. Rouchdi, H. Mamori, E. Salmani, B. Ait Syad, O. Mounkachi, R. Essajai, H. Ez-zahraouy, H. Chakchak, N. Hassanain, A. Benyoussef, A. El Kenz and A. Mzerd, Appl. Phys. A: Mater. Sci. Process., 2021, 127, 1–14 CrossRef.
- Y. Orooji, M. Ghanbari, O. Amiri and M. Salavati-Niasari, J. Hazard. Mater., 2020, 389, 122079 CrossRef CAS PubMed.
- N. Hosni, K. Zehani, T. Bartoli, L. Bessais and H. Maghraoui-meherzi, J. Alloys Compd., 2017, 694, 1295–1301 CrossRef CAS.
- E. Peng, X. Wei, T. S. Herng, U. Garbe, D. Yu and J. Ding, RSC Adv., 2017, 7, 27128–27138 RSC.
- N. Ali, A. Said, F. Ali, F. Raziq, Z. Ali, M. Bilal, L. Reinert, T. Begum and H. M. N. Iqbal, Water, Air, Soil Pollut., 2020, 231, 1–16 CrossRef.
- A. Zamani, M. Seyed, S. Alireza, M. Mohammad and Y. Nazanin, Int. J. Ind. Chem., 2020, 11, 205–216 CrossRef CAS.
- K. M. Reza, A. Kurny and F. Gulshan, Appl. Water Sci., 2017, 7, 1569–1578 CrossRef CAS.
- Z. U. H. Khan, A. Khan, N. S. Shah, I. U. Din, M. A. Salam, J. Iqbal, N. Muhammad, M. Imran, M. Ali, M. Sayed and M. A. Gohar, Surf. Interfaces, 2021, 23, 100944 CrossRef CAS.
- W. Shi, X. Liu, T. Zhang, Q. Wang and L. Zhang, RSC Adv., 2015, 5, 51027–51034 RSC.
- S. A. Bhat, F. Zafar, A. H. Mondal, A. Kareem, A. U. Mirza, S. Khan, A. Mohammad, Q. M. R. Haq and N. Nishat, J. Iran. Chem. Soc., 2020, 17, 215–227 CrossRef CAS.
- A. Singh, A. Ahmed, A. Sharma, C. Sharma, S. Paul, A. Khosla, V. Gupta and S. Arya, Phys. B Condens. Matter, 2021, 616, 413121 CrossRef CAS.
- S. Swathi, R. Yuvakkumar, P. S. Kumar, G. Ravi and D. Velauthapillai, Chemosphere, 2021, 281, 130903 CrossRef CAS PubMed.
- P. Yadav, P. K. Surolia and D. Vaya, Mater. Today: Proc., 2021, 43, 2949–2953 CAS.
- R. Jasrotia, N. Kumari, R. Kumar, M. Naushad, P. Dhiman and G. Sharma, Earth Syst. Environ., 2021, 5, 399–417 CrossRef.
- C. Aoopngan, J. Nonkumwong, S. Phumying, W. Promjantuek, S. Maensiri, P. Noisa, S. Pinitsoontorn, S. Ananta and L. Srisombat, ACS Appl. Nano Mater., 2019, 8, 5329–5341 CrossRef.
- C. Lei, M. Pi, P. Kuang, Y. Guo and F. Zhang, J. Colloid Interface Sci., 2017, 496, 158–166 CrossRef CAS PubMed.
| This journal is © The Royal Society of Chemistry 2024 |

