 Open Access Article
Synthesis and characterization of micro-/nano-α-Fe2O3 for photocatalytic dye degradation†
Vikram Rama Uttam Pandit *a,
Ganesh Kavita Parshuram Jadhava,
Vivekanand Mangal Sakharam Jawaleb,
Rohit Dubepatilc,
Rajendra Guraoa and
Dattatray J. Late
 *d
*d
aDepartment of Chemistry, The PGK Mandals Haribhai V. Desai College, Pune-411002, India. E-mail: vikramupandit@gmail.com
bModern College of Engineering, Pune-411005, India
cOrah Nutrichem Pvt Ltd, Pune-411044, India
dMaterials Science and Technology Research Group, Brane Enterprises Private Limited, Hyderabad 500081, India. E-mail: datta099@gmail.com
First published on 13th September 2024
Abstract
Photocatalytic activity using micro-/nano-α-Fe2O3 on a large scale was carried out using a sol–gel autocombustion method. A degradation time of 60 min was noted for 50 mg of the catalyst. Post characterization, this catalyst system showed a degradation of about 53% (rate = 2.60 × 10⁻³ min−1) and 17% (rate = 1.38 × 10⁻² min−1) under sunlight and up to 45% (rate = 1.13 × 10⁻³ min−1) and 7% (rate = 1.20 × 10⁻² min−1) under a 400 W UV lamp for rhodamine 6G (R6G) and crystal violet (CV), respectively. Sunlight has a broad spectrum of light; it greatly accelerates the degradation process and creates ideal conditions for the reaction to occur. The rate of photocatalytic dye degradation of α-Fe2O3 without Fenton's reagent was found to be 7.84 × 10⁻³ min−1 in the presence of external air provided (in the photocatalytic setup) through a bubbler and 3.23 × 10⁻³ min−1 in the absence of the bubbler.
1 Introduction
Inorganic semiconductor materials for photocatalytic applications are well studied owing to their durability, low cost, minimal toxicity, hydrophilicity, and outstanding photochemical and chemical stability.1 Iron oxide is one of the promising transition metal oxides and is being studied in a wide range of scientific domains. It can be found in different stoichiometric and crystalline structural arrangements in nature, including FeO (wurtzite), α-Fe2O3 (hematite), ν-Fe2O3 (maghemite), and Fe3O4 (magnetite).2 Among these, α-Fe2O3 is abundant, non-toxic, and a noteworthy n-type semiconducting material.3 It has excellent chemical, thermal and environmental stabilities as compared to other metal oxides and sulphide semiconductors.4 These unique and distinct properties open new doors in electronics, sensing, metallurgy, energy storage, batteries, anti-corrosion, catalysis, and biological activity.5–7 Among these cutting-edge uses, photocatalysis is one of the most promising since it will be essential for the sustainability of future generations.To date, numerous metal oxides, nitriles, and sulphide semiconductor photocatalyst systems have been reported with countless applications. Individual photocatalyst materials such as TiO2, ZnO, Fe2O3 and ZnS8–10 have been found effective for photocatalytic applications without any further modifications. Komal et al. proved the photo-activeness of α-Fe2O3 in ionic liquids towards rhodamine dye degradation.9 Nevertheless, several of these, namely, SnO2, CdS, WS2, and PQ,11–13 need assistance from other inorganic or organic semiconductor materials in order to function well. Jasim et al. reported quasi spherical α-Fe2O3 for the degradation of both rhodamine and methylene blue dyes.14 Several modifications, including composites, co-catalysts, coupling, and doping, are available to improve the overall photocatalytic activity of semiconductor catalyst materials.15–19
α-Fe2O3 is a significant photocatalyst compared to any other semiconductor because it absorbs about 35% of solar light from the whole spectrum.20–22 Taking into account the aforementioned facts, researchers have documented the synthesis of α-Fe2O3 via several methods such as hydrolysis, co-precipitation, hydrothermal, solvothermal, ionic liquid-aided, thermal decomposition, and sol–gel autocombustion methods.23–25 However, sol–gel autocombustion is an easy, one-step, straightforward, and inexpensive procedure compared with other methods. Lately, synthesis methods have been designed according to the size, shape, and porosity of Fe2O3 nanomaterials for photocatalysis.26–32 In this context, Zhou's research group proved the size-dependant photocatalytic activities of Fe2O3 over the Rhodamine-B dye.33 Xu et al. studied the effect of reactive sites over the enhanced photocatalytic dye degradation activities.34 Further, Wu et al. prepared the nanocubes of Fe2O3-truncated (104) and oblique (012) with higher photocatalytic dye degradation results.35 Along with these, the role of pH and catalytic amount of Fe2O3 nanoparticles were explored for the degradation of MB and R-6G dyes, respectively.33
This present study describes the synthesis of α-Fe2O3 nanostructures with (104) plane orientation using the sol–gel autocombustion process. The main objective of the present study is to check the degradation of dyes in natural sunlight and UV lamp and compare it with the bubbler results without Fenton's reagent. Rhodamine and crystal violet dyes were employed in both studies, and it was discovered that the rate of photocatalytic dye degradation was 7.84 × 10⁻³ min−1. A three-fold increase in photocatalytic activity was observed with external air provided through a bubbler in the photocatalytic setup. Overall, natural sunlight provides a wide range of light spectrum, which results in more dye degradation (almost two-fold) than the UV lamp. In future, this work can open new methods for the synthesis of specific structure-oriented hematite with doping and nanocomposite materials with organic and inorganic semiconductors for various applications.36,37 Also, using these multifunctional systems without Fenton's reagent to scaleup the photocatalytic dye degradation experiments with other complex dyes is currently a limitation of this photocatalytic study.
2 Experimental methods
2.1 Synthetic chemicals and reagents
All materials were analytical grade (99% pure) and used without any further purification. Ferric nitrate nonahydrate (Fe(NO3)3·9H2O) was obtained from Himedia. Citric acid (C6H8O7) was purchased from Research lab Einechem Industries, and ammonia solution 25% extra pure (NH4OH) was purchased from Loba Chemie Pvt. Ltd. Both the dyes (rhodamine and crystal violet) were purchased from Loba Chemie Pvt Ltd India. Doubled distilled water was used as the solvent for synthesis and all photocatalytic dye degradation experiments.2.2 Synthesis of rhombohedral α-Fe2O3
The rhombohedral α-Fe2O3 nanostructure was synthesised using the sol–gel autocombustion method.7 The synthesis was carried out in 1000 mL glass beaker with 45.99 g (Fe(NO3)3 9H2O) and 35.80 g citric acid. An appropriate amount of deionized water was added into the reaction mixture to form a homogeneous solution, and the pH of the reaction mixture was further optimized to pH = 9 with the dropwise addition of liquor ammonia and continuous stirring.7 The reaction mixture was subsequently subjected for to 180 min reaction with constant stirring while maintaining the reaction temperature at 80 °C. The completion of reaction was indicated when the brown coloured reaction mixture turned in to a gel-like mass and with further heating, a puffy brown coloured powder was observed to be formed. This powder was subjected to calcination at 550 °C for 180 min in a furnace, which converts it in to α-Fe2O3 nanomaterial.72.3 Characterization
The structural, optical, and morphological characterization of the synthesized α-Fe2O3 nanostructure was done with high-end instrumentation systems. The fundamental structural bonds (Fe–O, Fe–O–Fe) and their relevant vibrating frequencies were calculated with the help of Fourier Transform Infrared (FTIR) spectroscopy (IR affinity-1, Shimadzu) in the range of 4000–400 cm−1. The α-Fe2O3 sample confirmation and crystal phase purity were determined with the help of X-ray diffraction (XRD) technique (Bruker AXS model D8; the intensity data were measured with 2θ ranging from 10° to 80° at scanning rate 1° min−1). The XRD data agrees with the JCPDS no. 79-1741 structure with high phase purity (104). The optical properties determined with the help of a UV-visible diffusion reflectance spectrophotometer (Shimadzu UV-vis DRS Model UV 3600) in the range from 200 to 800 nm give an optical band gap of 2.3 eV. The surface morphological analysis of the synthesized α-Fe2O3 was done with Field Emission Electron Microscopy (FESEM) to prove the layered structure formation. These layered structures consist of rhombohedral nanorods such microstructural analysis performed with transmission electron microscopy (TEM). The material purity, phase, molecular interaction and polymorphism analysis were done with the help of Raman spectroscopy.2.4 Photocatalytic activity
The photocatalytic activity11–13 was studied under natural sunlight and 400 W UV lamp with and without an air bubbler for the synthesized α-Fe2O3 nanoparticles. This activity was studied for standard 10 ppm crystal violet (CV) and rhodamine 6G (R6G) dye by preparing a 1 L stock solution, which consisted of 10 mg of the respective dye in deionized water. In this experiment, 50 mg of the accurately weighed synthesized α-Fe2O3 nanoparticles and 100 mL of 10 ppm dye solution were taken in a 100 mL conical flask. Then, these solutions were stirred for about 30 min with the help of a magnetic stirrer in the dark to obtain adsorption–desorption equilibrium.11,13 Once equilibrium was established, the solution was irradiated with natural sunlight and a 400 W UV lamp (with and without oxygen air bubbler) with constant stirring. After a fixed 10 min time interval, an aliquot of the dye sample was taken out and centrifuged at 2500–3000 rpm. The centrifuged supernatant liquid gives exact information about the degradation of CV and R6G dye by α-Fe2O3 with respect to time, which was confirmed by a UV-visible spectrophotometer (UV-1800 Shimadzu). The absorbance value at 556 nm for the degradation of CV and R6G was calculated38 using eqn (1).| Percent degradation of CV and R6G = (C0 − Ct)/C0 × 100 | (1) |
3 Results and discussion
3.1 FT-IR and UV-DRS, powder X-ray diffraction and Raman analysis for α-Fe2O3
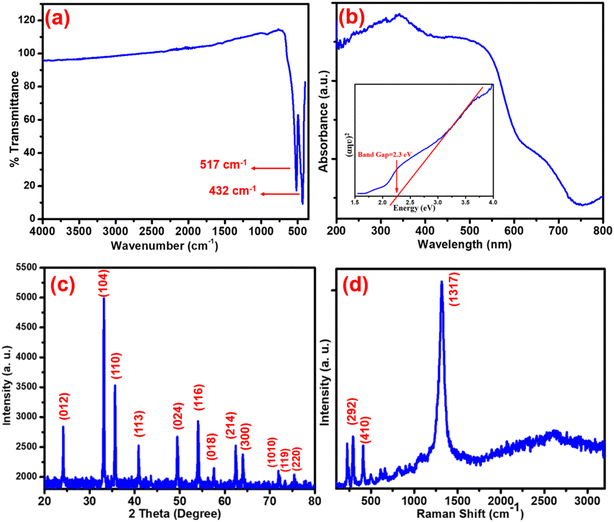
Fig. 1(a) shows the FTIR, (b) UV-DRS, (c) XRD and (d) Raman graphs for the α-Fe2O3 analysis of the synthesised α-Fe2O3 nanostructure. FTIR gives an idea about the vibrational frequencies in the fingerprint and functional group region, which is associated with the functional groups present in organic and inorganic molecules. Fig. 1(a) shows the FTIR spectrum of α-Fe2O3.Functional groups (400–650 cm−1) show two very intense and sharp peaks mainly at 330–510 cm−1, which is the characteristic peak for the vibrational mode of α-Fe2O3 nanostructures. Also, the broad peak at about 516–600 cm−1 is due to the Fe–O vibration in the α-Fe2O3 lattice of α-Fe2O3. The material with highly purified confirms shows no significant peaks in the fingerprint region associated with the nanostructure, none for even a trace amount of the impurities in it (unreacted, hydroxyl and other organic species), which was confirmed by XRD analysis. The optical properties for the materials were inspected with the help of UV-DRS, which gives fruitful information about the reflection and reflectance of incident light. This significant information gives an idea about band gap energy. The UV-DRS result for α-Fe2O3 is shown in Fig. 1(b). The significant absorbance peak in Fig. 1(b) is seen at about 346 nm, which indicates the formation of α-Fe2O3. The energy band gap value of the synthesized α-Fe2O3 was calculated using the Tauc plot (inset of Fig. 1(b)) and was found to be 2.3 eV. The original Tauc plot is shown in ESI Fig. S1.† FTIR and UV-DRS interpret highly pure crystalline α-Fe2O3 formation at this elevated calcination temperature.
In the present study, after powder X-ray diffraction (PXRD) analysis, Raman spectroscopy was also performed (Fig. 1(d)). The crystallinity and phase purity were determined by structure analysis with the help of XRD. The PXRD pattern of the α-Fe2O3 structure is shown in Fig. 1(c). The position of the diffraction patterns correspond to (012), (104), (110), (113), (024), (116), (122), (214), (300), (119) and (220) planes, which indicate a rhombohedral (cubic) structure of α-Fe2O3, in good agreement with JCPDS no. 79-1741.7,38 The Debye–Scherrer equation (D = kλ/B![[thin space (1/6-em)]](https://www.rsc.org/images/entities/char_2009.gif) cos
cos![[thin space (1/6-em)]](https://www.rsc.org/images/entities/char_2009.gif) θ), where B is the full-width half maximum, k is the Scherrer constant, D is the crystallite size, and λ is the wavelength of X-rays, was used to calculate the particle size of Fe2O3, which was found to be about 20–24 nm. All peaks were highly intense without any extra peaks, showing the high phase purity of the nanostructure with the (104) plane, which was also confirmed through TEM analysis.38 Raman spectroscopy is a non-destructive analytical technique that gives an idea about the materials purity, phases, molecular interaction, and polymorphism. Pristine α-Fe2O3 belongs to the R
θ), where B is the full-width half maximum, k is the Scherrer constant, D is the crystallite size, and λ is the wavelength of X-rays, was used to calculate the particle size of Fe2O3, which was found to be about 20–24 nm. All peaks were highly intense without any extra peaks, showing the high phase purity of the nanostructure with the (104) plane, which was also confirmed through TEM analysis.38 Raman spectroscopy is a non-destructive analytical technique that gives an idea about the materials purity, phases, molecular interaction, and polymorphism. Pristine α-Fe2O3 belongs to the R![[3 with combining macron]](https://www.rsc.org/images/entities/char_0033_0304.gif) c crystal space group and seven phonon lines are seen in the Raman spectrum, which are attributed to two A1g phonon & 5 Eg phonon modes.9 From Fig. 1(d), it is very clear that the Raman peaks at 225 and 498 cm−1 can be attributed to the A1g phonon mode, while the peaks at 245, 292, 300, 410 and 611 cm−1 are related to the Eg phonon mode.9,24 The extra peak at 663 cm−1 in Fig. 1(d) is due to the defects present in the crystal lattice of α-Fe2O3. A very sharp and intense peak at 1317 cm−1 is seen due to the second order scattering process, which can be attributed to the magnon scattering process in α-Fe2O3. All these modes are responsible for hematite without magnetite or maghemite, again confirming the purity of the material with a specific defect, which is helpful in photocatalysis.
c crystal space group and seven phonon lines are seen in the Raman spectrum, which are attributed to two A1g phonon & 5 Eg phonon modes.9 From Fig. 1(d), it is very clear that the Raman peaks at 225 and 498 cm−1 can be attributed to the A1g phonon mode, while the peaks at 245, 292, 300, 410 and 611 cm−1 are related to the Eg phonon mode.9,24 The extra peak at 663 cm−1 in Fig. 1(d) is due to the defects present in the crystal lattice of α-Fe2O3. A very sharp and intense peak at 1317 cm−1 is seen due to the second order scattering process, which can be attributed to the magnon scattering process in α-Fe2O3. All these modes are responsible for hematite without magnetite or maghemite, again confirming the purity of the material with a specific defect, which is helpful in photocatalysis.
3.2 Morphological analysis using FESEM and TEM analysis
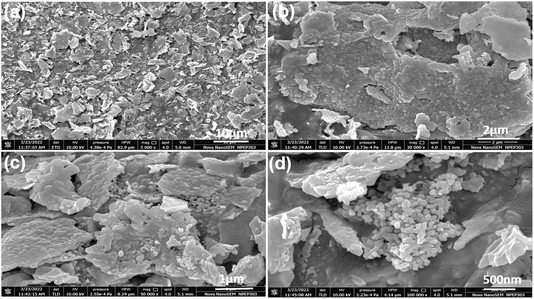
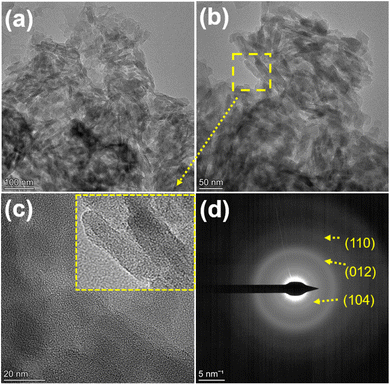
Fig. 2(a–d) shows morphological study performance of the synthesized α-Fe2O3 using FESEM analysis. From Fig. 2(a), it is seen that the as-synthesized α-Fe2O3 has a layered structure with sheet-like microstructures. As the resolution increases, it is revealed that the sheets are made up of tiny spherical particles. These particles are found together and self-assemble with a puffy structure and flake-like morphology. These flakes show different orientations in space, which merge to forms thin films with a size of 2–3 micron. These films show deep or elevated microstructures with hollow cavities (Fig. 2(d)).Fig. 3(a–d) shows the TEM images of α-Fe2O3, and the XRD pattern confirms hexagonal α-Fe2O3 with high phase purity and rhombohedral unit cell with a particle size of 25–30 nm. Fig. 3(a) shows nanoparticles oriented in space in different directions with equal length. Similar results are observed in FESEM analysis, where it is observed that the particles get fuse together due to the very high energy during the autocombustion reaction conditions (Fig. 3(b)). With an increase in the resolution, it is observed in Fig. 3(c) as a single particle with elongated shape morphology from the top view and about 20 nm size. Fig. 3(d) shows the selected area electron diffraction (SAED) pattern for α-Fe2O3, where the (h, k, l) values (calculated and observed) are found to exactly match with those from the XRD values.9,38 It can be concluded from the morphological study that Fe2O3 has high phase purity and good orientation in space.
It also confirms that surface modification with increasing reactive sides can be achieved through autocombustion, which helps in the photocatalytic reactions performed in this study.
4 Applications
4.1 Photocatalytic activity study
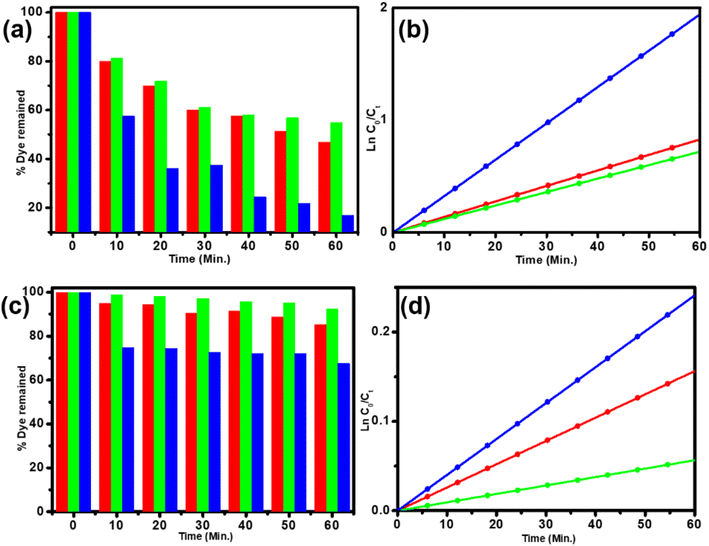
Before the start of photocatalytic experiments, we compared the dye degradation activities of few earlier reports shown in ESI Tables T1 and T2.† After complete characterization, the synthesized α-Fe2O3 was subjected to photocatalytic activity test with crystal violet (CV) and rhodamine 6G (R6G) dye. The photocatalytic activity was studied with the help of a UV-visible spectrophotometer.12 This study started with exactly 50 mg catalyst and 10 ppm of the respective dyes, which were taken in 100 mL conical flasks. These solutions were kept in the dark for about 30 min to attain absorption–desorption equilibrium (ESI S2†) and then irradiated with natural sunlight and 400 W UV lamp with and without a bubbler. The rate of degradation was studied with small sample amounts (1–2 mL), which were taken out at fixed time intervals; the detailed process is explained in the Experimental section.As shown in Fig. 4, the degradation of CV and R6G dye in natural sunlight is about 53% and 17%, and 45% & 7% using 400 W UV lamp, respectively. These results imply higher degradation in natural sunlight than 400 W UV lamp for both the dyes because α-Fe2O3 has good absorbing tendency of natural sunlight. Natural sunlight has good degradation capacity as compared to UV lamp, but the former has some demerits such as intermittent sunlight, intensity of sunlight and weather conditions. αFe2O3 shows excellent enhancement in the photocatalytic activity from 1.13 × 10⁻³ to 7.84 × 10⁻³ min−1. In the present study, the comparison of the results with those obtained using Fenton reagent was done, and the results of this study were found to be better (ESI Table T1†). The result is enhanced at slightly high temperature than ambient temperatures, but the process is relatively costlier, favourable in acidic condition and with the progress of degradation, a higher amount of ferric sludge production takes place. The material important for photocatalytic degradation is the one that can further show enhanced performance upon passing an optimum amount of air oxygen through the reaction mixture.11 Air oxygen can be passed into it through an air bubbler at a rate of about 100–120 bubbles min−1 (photograph of the bubbler is shown in ESI S3†), which shows enhancement in CV degradation from 45 to 83% and R6G from 7 to 32%. The improvement in the results is attributed to the proposed mechanism, wherein the excited electron is absorbed through air oxygen and used for superoxide ion and hydroxyl radical formation, which enhances the photocatalytic activity, also meaning that it overcomes the problem of charge recombination due to a small band gap. In this study, we have also observed the reaction kinetics of photocatalytic CV and R6G degradation reactions. These reactions follow the Langmuir–Hinshelwood model which appears to be the first-order reaction kinetics (ln(C0/Ct) = Kapp), as given in Fig. 4. The slope of the ln(C0/Ct) vs. irradiation time graph gives an exact rate constant value (Kapp).12 α-Fe2O3 shows the highest apparent rate constant value of 7.84 × 10⁻³ min−1 for the photocatalytic R6G degradation. The reason for the higher photocatalytic activity is the supply of air oxygen, which helps in superoxide ion and hydroxyl radical formation and also helps to reduce the charge recombination rate. The properties of both R6G and CV dyes are shown in ESI Table T3,† which gives an idea about the easy-to-break structures as compared to other complex organic toxic compounds.
The rate constant value for CV and R6G with standard fitting error using α-Fe2O3 are tabulated in Table 1. A higher rate constant is observed for rhodamine 6G with air oxygen bubbler.
| Dyes | Sun light | UV lamp | With bubbler | |||
|---|---|---|---|---|---|---|
| Kapp (min−1) | Standard error | Kapp (min−1) | Standard error | Kapp (min−1) | Standard error | |
| CV | 1.38 × 10⁻² | 0.0007 | 1.20 × 10⁻² | 0.0009 | 3.23 × 10⁻² | 0.0002 |
| R6G | 2.60 × 10⁻³ | 0.0009 | 1.13 × 10⁻³ | 0.0003 | 7.84 × 10⁻³ | 0.0001 |
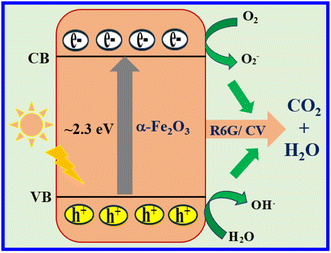
Fig. 5 shows the mechanism of photocatalytic dye degradation. The absorption of a photon with energy above or equal to the band gap of the Fe2O3 photocatalyst generates photoexcited electrons at the conduction band (CB) and the same number of holes at the valence band (VB). Holes are responsible for oxidation and electrons are responsible for reduction.11
Herein, the holes oxidize water to form hydroxyl ions, while electrons react with surface adsorbed oxygen molecule to generate the superoxide anion by providing enough oxygen rate to enhance superoxide formation. The hole–electron then form hydroxide free radicals after combination with water, which are well-known for their tendency to degrade dyes into harmless compounds such as carbon dioxide and water.12,13 A significantly higher dye degradation rate was observed in natural sunlight than under UV lamp irradiation due to the broader spectrum of light available.38 From Table 1, the R6G dye was degraded at 2.60 × 10⁻³ min−1 under natural sunlight, which is almost double the UV lamp results. Moreover, the heterocyclic structure and other easy to remove substituents may make R6G dye degradation fast than CV degradation. These active adequate superoxide anions and hydroxyl radicals act as strong oxidizing species, which helps in improving the degradation of CV and R6G dyes without Fenton's reagent, making the process better. In the presence of external air from the bubbler, the aromatic compounds and harmful coloured dyes are degraded and decolorized much faster, leading to a loss of colour intensity and a reduction in their harmful effects.39
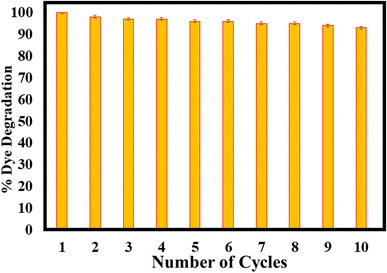
4.2 Recycling study
The potential of reusability of α-Fe2O3 towards CV and R6G degradation was studied in ten batches, as shown in Fig. 6. After each reaction batch, the catalyst was centrifuged and washed with DI water and reused after drying. The catalyst shows comparable photocatalytic activity up to ten cycles of these experiments shown into ESI.† Even after ten cycles, the material shows good stability (Fig. 6) with good photocatalytic degradation efficiency via the sufficient production of the ˙OH radical.The XRD and FTIR spectra after the photocatalytic experiments are shown in the ESI (Fig. S5 and S6†), respectively. Moreover, this stable and recyclable photocatalyst can be used for sensing, organic transformations, and biological studies.37
5 Conclusions
In a nutshell, nanosized (60 nm) α-Fe2O3 was prepared using the sol–gel autocombustion method. Powder XRD confirms the formation of α-Fe2O3. IR spectroscopy gave clear information about Fe–O–Fe bond formation without any single impurity in the material. The UV-visible spectrum shows absorbance peck at 346 nm with a band gap of about 2.3 eV. FESEM and TEM analysis showed α-Fe2O3 formation with 35–40 nm particle size. CV and R6G dye degradation in natural sunlight was about 53% and 17% through a 400 W UV lamp, and then up to 45% and 7%, respectively, and the rate of photocatalytic dye degradation was found to be 7.84 × 10⁻³ min−1. A three-fold increase in the photocatalytic activity was observed with the external air been provided through a bubbler.Data availability
Data are available from the corresponding authors on reasonable request.Conflicts of interest
The authors declare that they have no known competing financial interests or personal relationships that could have appeared to influence the work reported in this paper.Acknowledgements
Dr Vikram Rama Uttam Pandit is thankful to the SPPU-IQAC for ASPIRE-18TEC001239 grant and Principal Dr Rajendra G. Gurao of H. V. Desai College for continuous support. VUP is also grateful to Chairman Shri Rajeshbhai Shah, Secretary Shri Hemantbhai Maniar and Joint Secretary Shri Dilipbhai Jagad PGK Mandal Pune for providing valuable guidance, encouragement and lab facilities. For English language corrections authors are thankful to Mrs Sankruti Pandit and Miss Pradnya Gaikwad from NCL Pune.References
- D. Zhu and Q. Zhou, Environ. Nanotechnol., Monit. Manage., 2019, 12, 100255 Search PubMed.
- C. Hitam and A. Jalil, J. Environ. Manage., 2020, 258, 110050 CrossRef CAS PubMed.
- A. Mirzaei, B. Hashemi and K. Janghorban, J. Mater. Sci.: Mater. Electron., 2016, 27, 3109 CrossRef CAS.
- M. Tahmasebpoor, S. Hosseini Nami, M. Khatamian and L. Sanaei, Environ. Technol., 2022, 43, 116 CrossRef CAS PubMed.
- H. Helmiyati, N. Fitriana, M. L. Chaerani and F. W. Dini, Opt. Mater., 2022, 124, 111982 CrossRef CAS.
- D. Havenga, R. Akoba, L. Menzi, S. Azizi, J. Sackey, N. Swanepoel, A. Gibaud and M. Maaza, Sci. Rep., 2022, 12, 1 CrossRef PubMed.
- T. Marin, K. Lazar, P. Matjaz, L. Jelena, T. Biljana, S. Boban and M. Laurence, Mater. Res. Bull., 2021, 133, 111055 CrossRef.
- L. Chen, F. Li, B. Ni, J. Xu, Z. Fu and Y. Lu, RSC Adv., 2012, 2, 10057 RSC.
- Komal, H. Kaur, M. Kainth, S. S. Meena and T. S. Kang, RSC Adv., 2019, 9, 41803 RSC.
- L. Xu, J. Xia, K. Wang, L. Wang, H. Li, H. Xu, L. Huang and M. He, Dalton Trans., 2013, 42, 6468 RSC.
- V. Pandit, S. Arbuj, U. Mulik and B. Kale, Environ. Sci. Technol., 2014, 7, 4178 CrossRef PubMed.
- V. Jawale, A. Al-fahdawi, S. Pandit, G. Dawange, G. Gugale, M. Chaskar, D. Hammiche, S. Arbuj and V. Pandit, Mater. Today: Proc., 2021, 52, 17 Search PubMed.
- B. Sun, M. Yao, Y. Chen, X. Tang, W. Hu and S. C. Pillai, J. Alloys Compd., 2022, 922, 166055 CrossRef CAS.
- S. A. Jasim, M. M. Kadhim, B. A. Hussein, S. E. Izzat, Z. M. Najm and C. Chem, Phys. Chem. Res., 2023, 11, 139 CAS.
- Y. Chen, H. Li, Q. Ma, J. Wang, Q. Che, G. Wang, Y. Li and P. Yang, Adv. Powder Technol., 2022, 33, 103858 CrossRef.
- H. M. Banbela, L. M. Alharbi and M. A. Salam, Int. J. Electrochem. Sci., 2022, 17, 1 Search PubMed.
- D. G. Sayed, F. I. El-Hosiny, S. M. A. El-Gamal, M. M. Hazem and M. Ramadan, J. Build. Eng., 2022, 57, 104947 CrossRef.
- M. Shahmirzaee, A. Hemmati-sarapardeh, M. M. Husein and M. Scha, ACS Omega, 2022, 7, 3700 CrossRef CAS PubMed.
- E. A. Mahdy, J. Non-Cryst. Solids, 2022, 583, 121467 CrossRef.
- K. T. Orii, H. S. Ugihara and K. D. Owaki, J. Jpn. Inst. Energy, 2022, 101, 66 CrossRef.
- A. Bothe, L. Gehrlein, Q. Fu, C. Li, J. Maibach, S. Dsoke and A. Balducci, Batteries Supercaps, 2022, 5, e202200152 CrossRef CAS.
- J. Qin, M. Liu, Z. Wang, L. Pei, M. Zhao, Q. Zhou and B. Wu, Mater. Res. Express, 2022, 1, 2105553 Search PubMed.
- H. Huang, L. Kong, W. Shuang, W. Xu, J. He and X. Bu, Chin. Chem. Lett., 2022, 33, 1037 CrossRef CAS.
- J. Zoubir, N. Bougdour, C. Radaa, A. Idlahcen, I. Bakas and A. Assabbane, Sensors Int., 2022, 3, 100160 CrossRef.
- Y. Zhou, L. Wei, C. Li, Y. Han, J. Xu, Z. Jia, J. Sun and Y. Fu, J. Energy Storage, 2022, 45, 103765 CrossRef.
- V. Jawale, G. Gugale, M. Chaskar, S. Pandit, R. Pawar, S. Suryawanshi, V. Pandit, G. Umarji and S. Arbuj, J. Mater. Res., 2021, 36, 1573 CrossRef CAS.
- J. Hu, H. Li, S. Chen and W. Xiang, Ind. Eng. Chem. Res., 2022, 61, 1022 CrossRef CAS.
- F. C. İskenderoğlu and M. K. Baltacıoğlu, Eur. Mech. Sci., 2022, 6, 179 CrossRef.
- B. Zerihun, M. D. Yehualaw and D. Vo, Adv. Civ. Eng. Mater., 2022, 1, 156 Search PubMed.
- M. A. K. Athanasios, B. Bourlinos, N. Chalmpes and D. Gournis, Nanotechnol. Res. J., 2022, 2022, 59 Search PubMed.
- P. Kushwaha and P. Chauhan, Appl. Phys. A: Mater. Sci. Process., 2022, 128, 18 CrossRef CAS.
- O. Fabrichnaya, M. Zinkevich and F. Aldinger, Int. J. Mater. Res., 2022, 97, 1495 CrossRef.
- X. Zhou, H. Yang, C. Wang, X. Mao, Y. Wang, Y. Yang and G. Liu, J. Phys. Chem. C, 2010, 114, 17051 CrossRef CAS.
- Y. Xu, G. Zhang, G. Du, Y. Sun and D. Gao, Mater. Lett., 2013, 92, 321 CrossRef CAS.
- W. Wu, R. Hao, F. Liu, X. Su and Y. Hou, J. Mater. Chem. A, 2013, 1, 6888 RSC.
- S. Mahire, A. S. Tiwana, A. Khan, P. Nalawade, G. Bandekar, N. Trehan, U. Mukkannawar, S. Kaur, V. Pandit and P. Kamble, Arabian J. Geosci., 2023, 16, 570 CrossRef CAS.
- K. Vijay, C. Surjeet, S. Dharamvir, K. Ashok, K. Parmod and K. Asokan, AIP Conf. Proc., 2018, 1953, 030245 CrossRef.
- G. Na, L. Yimai, L. Shi, L. Lu, Z. Junjun, J. Guijuan and G. Shucai, J. Phys. Chem. C, 2014, 118, 18343–18355 CrossRef.
- Z. Bahreini, V. Heydari, A. N. Hekmat, M. Taheri, B. Vahid and L. Moradkhannejhad, Pigm. Resin Technol., 2016, 45, 119 CrossRef CAS.
Footnote |
| † Electronic supplementary information (ESI) available. See DOI: https://doi.org/10.1039/d4ra04575k |
| This journal is © The Royal Society of Chemistry 2024 |

