
 Open Access Article
 This Open Access Article is licensed under a Creative Commons Attribution-Non Commercial 3.0 Unported Licence
Robust interaction of ZnO and TiO2 nanoparticles with layered graphitic carbon nitride for enhanced photocatalytic oxidative desulfurization of fuel oil: mechanism, performance and stability†‡
Manh B. Nguyen§
 *ab,
Pham Thi Lan§c,
Xuan Nui Phamd,
Thi Hai Yen Phama,
Nguyen Ngoc Hae,
Nguyen Thi Thu Hae,
T.-Thanh-Bao Nguyenf,
Huan V. Doan*dg,
Nguyen Tuan Anhc and
Tran Dai Lam*c
*ab,
Pham Thi Lan§c,
Xuan Nui Phamd,
Thi Hai Yen Phama,
Nguyen Ngoc Hae,
Nguyen Thi Thu Hae,
T.-Thanh-Bao Nguyenf,
Huan V. Doan*dg,
Nguyen Tuan Anhc and
Tran Dai Lam*c
aInstitute of Chemistry, Vietnam Academy of Science and Technology, 18 Hoang Quoc Viet, Cau Giay, Hanoi, Vietnam. E-mail: nguyenbamanh@ich.vast.vn
bGraduate University of Science and Technology, Vietnam Academy of Science and Technology, 18 Hoang Quoc Viet, Cau Giay, Hanoi, Vietnam
cInstitute for Tropical Technology, Vietnam Academy of Science and Technology, 18 Hoang Quoc Viet, Cau Giay, Hanoi, Vietnam. E-mail: trandailam@gmail.com
dHanoi University of Mining and Geology, 18 Pho Vien, Duc Thang, Bac Tu Liem, Hanoi, Vietnam
eHanoi National University of Education, 136 Xuan Thuy, Cau Giay, Hanoi, Vietnam
fInstitute of Physics, Vietnam Academy of Science and Technology, 18 Hoang Quoc Viet, Cau Giay, Hanoi, Vietnam
gResearch School of Chemistry, The Australian National University, ACT 2601, Canberra, Australia. E-mail: huan.doan@anu.edu.au
First published on 14th August 2024
Abstract
Sulfur compounds in fuel such as thiophene, benzothiophene and dibenzothiophene are the primary source of SOx emissions, leading to environmental pollution and acid rain. In this study, we synthesized a layered oxygen-doped graphitic carbon nitride (OCN) structure and integrated ZnO and TiO2 nanoparticles onto the OCN surface through a microwave-assisted sol–gel method. The X-ray photoelectron spectroscopy (XPS) and density functional theory (DFT) results confirmed a robust interaction between the ZnO and TiO2 nanoparticles and the oxygen-doped g-C3N4 (OCN) surface, as indicated by the formation of C–N–Ti and C–O–Ti bonds. This interaction notably improved the optoelectronic properties of the ZnO–TiO2/OCN composite, yielding increased visible light absorption, reduced charge recombination rate, and enhanced separation and transfer of photogenerated electron–hole pairs. The oxygen doping into the CN network could alter the band structure and expand the absorption range of visible light. The ZnO–TiO2/OCN photocatalyst demonstrated remarkable desulfurization capabilities, converting 99.19% of dibenzothiophene (DBT) to dibenzothiophene sulfone (DBT-O2) at 25 °C, and eliminating 92.13% of DBT from real-world fuel oil samples. We conducted in-depth analysis of the factors impacting the redox process of DBT, including the ZnO ratio, initial DBT concentration, catalyst dosage, stability, and O/S molar ratio. Radical trapping experiments established that ˙O2−, ˙OH and h+ radicals significantly influence the reaction rate. The obtained results indicated that the ZnO–TiO2/OCN photocatalyst represents a promising tool for future fuel oil desulfurization applications.
1. Introduction
Sulfur compounds in fuel such as thiophene, benzothiophene (BT) and dibenzothiophene (DBT) are the primary source of SOx emissions, leading to environmental pollution and acid rain.1–3 Consequently, more stringent regulations are being implemented globally to limit fuel sulfur content. For instance, the U.S. Environmental Protection Agency (EPA) requires that diesel fuel for on-road use must contain no more than 15 ppm of sulfur, while the European Union requires a limit of 10 ppm.4 In Vietnam, the standard for sulfur content in fuel remains high at 500 ppm, resulting in significant SOx emissions during fuel combustion, leading to severe air pollution and acid rain in major cities.Various desulfurization methods have been developed to meet these regulations, including hydrodesulfurization (HDS), oxidative desulfurization (ODS), adsorptive desulfurization (ADS), biodesulfurization (BDS), and photocatalytic oxidative desulfurization (PODS).5–7 The PODS process, fundamentally driven by a photocatalytic reaction, leverages light energy to activate catalysts that can oxidize sulfur compounds, resulting in deep desulfurization.8,9 This method offers benefits such as low cost, operation at room temperature, non-toxicity, high selectivity, simple operation, and ease of product separation from fuel.6,10
The future of PODS research appears promising, with opportunities for the exploration of novel catalyst materials, hybrid methods, and strategies for successful scale-up and commercialization. However, the efficiency of PODS is significantly constrained by several factors, key among them being its dependency on light, meaning that without sufficient natural or artificial light, its applicability could be severely limited. Furthermore, the process faces efficiency challenges due to issues such as the recombination of electron–hole pairs and the necessity for enhanced visible light absorption in catalysts, the resolution of which may require considerable resources. Additionally, agglomeration poses a significant risk, as catalyst particles tend to clump together, thereby reducing the catalyst's effective surface area and, consequently, the overall efficiency of the desulfurization process.11,12
Titanium dioxide (TiO2) and zinc oxide (ZnO) have found extensive applications in solar cells, batteries, sensors, photodetectors, photocatalysis, lasers, and light-emitting diodes owing to their robust oxidation properties, high chemical stability, affordability, biocompatibility, and non-toxicity nature.13 However, despite these advantageous characteristics, these catalysts demonstrate limited effectiveness in treating DBT due to their low surface area, rapid electron–hole recombination, and high bandgap energy.14–16 For example, Matsuzawa et al. reported that TiO2 material converted only approximately 40% of DBT after 10 hours of UV irradiation.14 Similarly, TiO2 doped with nitrogen for visible light absorption achieved a sulfur treatment of only 40.3% after 4 hours of reaction.15 Furthermore, Nadzim et al.16 reported that ZnO material with particle sizes of 5–15 nm achieved oxidative desulfurization efficiency of only 31.93% after 90 minutes of reaction under UV light. To address the limitations of traditional photocatalytic materials, various strategies have been proposed, including fabricating materials with support carriers, combining multiple semiconductors, and creating defects.9
Graphitic carbon nitride (CN) has emerged as a prominent candidate for PODS reactions in recent studies.17 This material could be synthesized via fractional thermal polymerization methods using inexpensive precursors such as cyanamide, dicyandiamide, melamine and urea, offering advantages including low production cost and simple fabrication.18–20 As for photocatalytic applications, this material exhibits strong oxidizing properties, thermal stability, high chemical stability, and excellent optical and thermal properties.21–23 However, CN also presents drawbacks such as low surface area (10–20 m2 g−1) fast charge recombination rate, poor electrical conductivity, chemically inert nature, and poor hydrophilicity.24–26
To enhance CN photocatalytic performance in PODS reactions, researchers have explored various methods such as engineering the electronic structure via molecular doping or integrating them with carbon-based materials, metal nanoparticles and metal–organic frameworks.27–29 Recent studies showed that oxygen doping into the CN network could alter the band structure, thereby expanding the absorption range of visible light.29–31 For instance, after doping with oxygen, the photocatalytic activity of CN nanosheets increased approximately 5.2 times and 71 times for H2 evolution and methyl orange degradation processes, respectively.32 Combining CN with other semiconductors can further enhance photocatalytic efficiency by prolonging the lifetime of charge carriers, suppressing the recombination of photogenerated electrons and holes, and improving electron mobility.33 For example, Miao et al., achieved an impressive desulfurization efficiency of thiophene by enhancing the surface area and managing the electron–hole recombination of CN through anchoring CN particles onto a SiO2 carrier, reaching 99%.34 Wang et al.33 modified CN with TiO2, resulting in a 98.9% removal rate of DBT within 2 h at room temperature, credited to the reduced recombination rate of photogenerated electrons and holes. Similarly, Li et al.6 developed a Ti3C2/CN photocatalyst capable of removing 78% of thiophene at room temperature using ambient air as the oxidizer. Moreover, Saeed et al.17 utilized Ni-WO3@CN material for PODS, achieving 89.5 and 91.5% DBT removal for diesel and kerosene, respectively. Additionally, Zhou et al.35 demonstrated a p–n-type photocatalyst Ag2O/Na-CN, which removed up to 98.5% of sulfur compounds at a concentration of 200 mg L−1 in 180 min.
In this study, we introduce a pioneering approach in the fabrication of Z-scheme photocatalysts, marking the first instance of ZnO–TiO2/OCN integration using a sol–gel method coupled with microwave techniques. We also investigated influencing factors such as catalyst mass, DBT concentration, and O/S molar ratio. The density functional theory (DFT) method was also performed to correlate with the experimental findings when studying the electronic structures of OCN and their interactions with decorated ZnO–TiO2 nanoparticles.
2. Experimental methods
2.1. Synthesis of the OCN sample
The OCN material was synthesized in line with our previous studies.20,36 Initially, 18 g of urea was dissolved in 80 mL of H2O2 (30%) and stirred for 60 min to form a transparent solution. This solution was then recrystallized at 80 °C for 12 h to obtain the precursor for OCN synthesis. The resulting product was mixed with NH4Cl in a 1![[thin space (1/6-em)]](https://www.rsc.org/images/entities/char_2009.gif) :1 ratio and placed in a melamine styrofoam crucible (dimensions: 45 × 60 × 30 mm). The mixture was calcined at 550 °C for 2 h to yield the OCN sample.
:1 ratio and placed in a melamine styrofoam crucible (dimensions: 45 × 60 × 30 mm). The mixture was calcined at 550 °C for 2 h to yield the OCN sample.
2.2. Synthesis of ZnO–TiO2/OCN samples
For this process, 0.5 g of OCN was dissolved in 60 mL of ethanol and subjected to ultrasonication for 30 min (solution A). Concurrently, 1.14 mL of titanium isopropoxide (TIP) was added to a 40 mL mixture of ethanol and acetic acid (1:1) (solution B), while 600 mg of ZnCl2·6H2O was added to 60 mL of water and stirred to produce a homogeneous solution (solution C). Subsequently, solutions B and C were slowly introduced to solution A, stirred for 30 min, and transferred into a Teflon resin reaction system. The mixture was rapidly crystallized by microwaving at 100 °C for 30 min. The resulting product was then filtered and rinsed with distilled water to eliminate unreacted chemicals (refer to see Fig. S1‡). Finally, the solid was dried at 80 °C for 12 h and calcined at 450 °C for 4 h to obtain the 20%ZnO–TiO2/OCN sample. To synthesize 10%ZnO–TiO2/OCN and 30%ZnO–TiO2/OCN samples, the same procedure was followed with an adjusted ratio of ZnCl2·6H2O to TIP to modify the %wt of ZnO (see Table S1‡).
2.3. Photocatalytic oxidative desulfurization
A model fuel sample was prepared by combining 300 mg of DBT with 1000 mL of a solution mixture (n-octane and acetonitrile in a 1:1 ratio). Subsequently, 100 mg of the photocatalyst was added to 100 mL of 300 mg L−1 DBT solution and stirred in the darkness for 60 min to achieve adsorption–desorption equilibrium. To this mixture, 0.5 mL of H2O2 (30%) was added and a 60 W (Xe) bulb was employed as a light source to stimulate the photocatalyst. Every 20 min, a 2 mL aliquot of the solution was extracted, and the catalyst was removed catalyst for the determination of the DBT concentration at a time ‘t’. The reaction temperature was maintained at 25 °C via a circulating water flow, and a light source, with a power of 60 W (Xe), provided an intensity of approximately 2280 Lux to the reaction system. The concentrations of DBT in the n-octane solvent, before and after the photocatalytic reaction, were analyzed using ultraviolet-visible (UV-Vis) spectroscopy at λmax = 325 nm.37 DBT removal in model and real fuel oil samples was calculated using eqn (1).
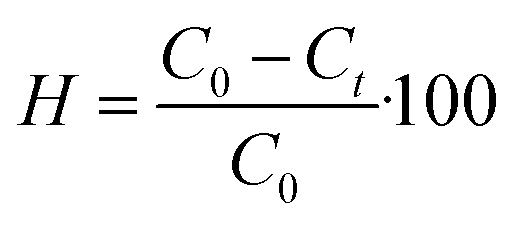 | (1) |
The process was tested with varying parameters: DBT concentrations (200, 300, 400 and 500 mg L−1), photocatalyst dosages (0.5, 1, 1.5 and 2 g L−1), and O/S molar ratio were all explored.
3. Result and discussion
3.1. Characterization of TiO2, ZnO, OCN and ZnO–TiO2/OCN samples
The X-ray diffraction (XRD) technique was employed to analyze the crystal structures of the OCN, TiO2, ZnO, ZnO–TiO2, TiO2/OCN, ZnO/OCN and ZnO–TiO2/OCN samples. As depicted in Fig. 1, the XRD pattern of the OCN sample showed diffraction peaks at 2θ of 27.4° and 13.2°, corresponding to the (002) and (100) planes of CN, respectively.38–40 The ZnO sample presented diffraction peaks at 2θ of 32.0°, 34.9°, 36.6°, 47.8°, 56.7°, 62.8° and 68.2°, which can be assigned to the (100), (002), (101), (102), (110), (103) and (112) planes of ZnO wurtzite phase (JCPDS no. 36-1451), respectively.41 The TiO2 sample exhibited peaks at 2θ of 25.3°, 38.64°, 48.02°, 53.89° and 62.69°, which correspond to the (101), (004), (200), (105) and (204) planes of the anatase phase of TiO2 (JCPDS no. 89-4921).42,43 The ZnO–TiO2/OCN samples displayed all characteristic peaks of the OCN, ZnO and TiO2 phases, and the peaks intensity of ZnO increased in tandem with the ZnO content, ranging from 0 to 30% in the ZnO–TiO2/OCN sample. The Debye–Scherrer equation was used to determine the average crystal size of the TiO2 and ZnO phases in the ZnO–TiO2/OCN samples, found to be 5.4 nm and 7.8 nm, respectively. Lattice parameters of ZnO–TiO2/OCN samples were calculated using Bragg's law and the Miller index, revealing that the samples possess lattice parameters corresponding to the tetragonal structure of TiO2 (a = b = 3.785 Å, c = 9.514 Å; α = β = γ = 90°) and hexagonal of ZnO (a = b = 3250 Å, c = 5.207 Å; α = β = 90°, γ = 120°). These results align with those reported by Burdett et al.44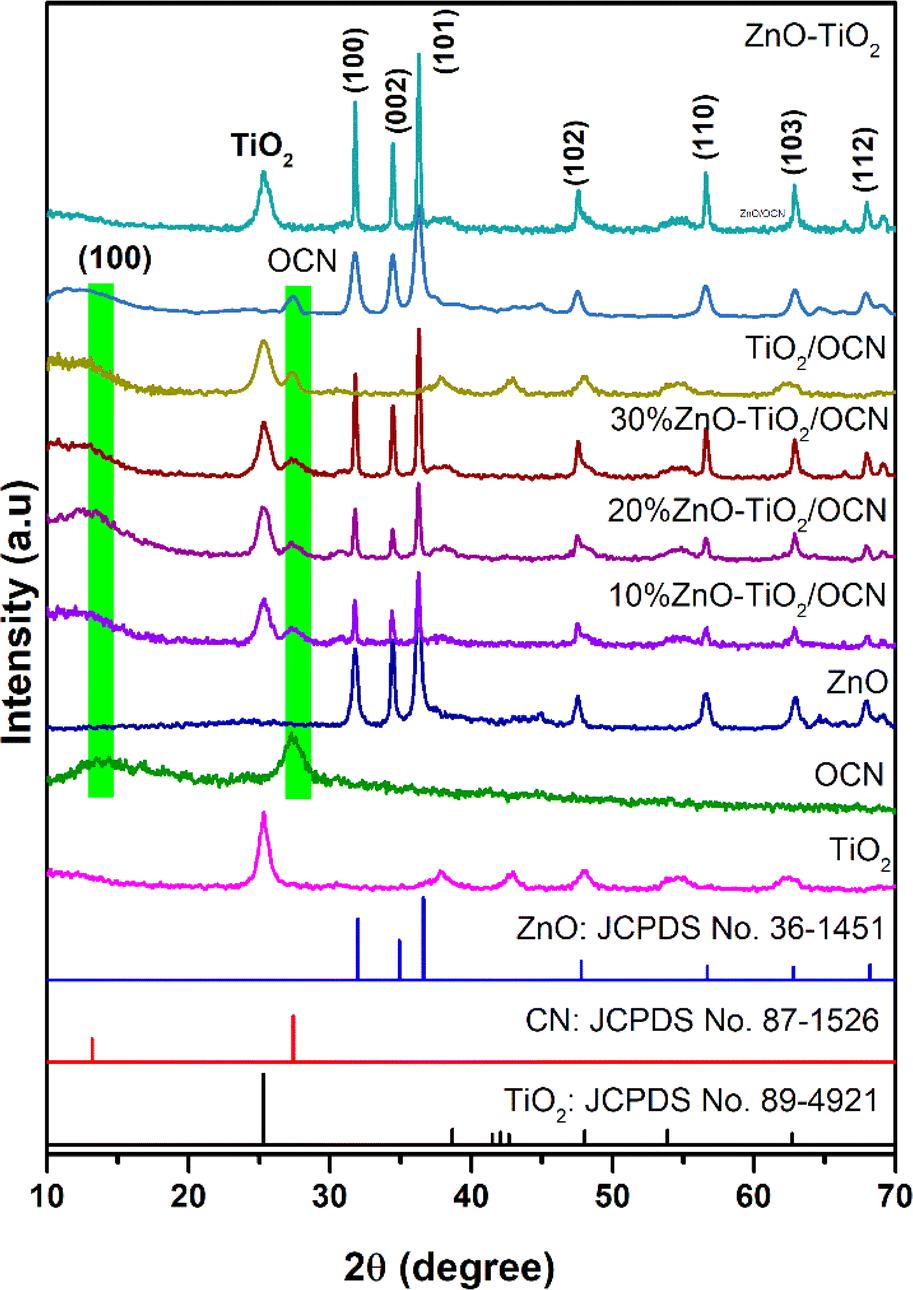 | ||
| Fig. 1 XRD patterns of OCN, TiO2, ZnO, ZnO–TiO2, ZnO/OCN, TiO2/OCN and ZnO–TiO2/OCN samples. | ||
Fig. 2, S2 and Table S2‡ present the X-ray photoelectron spectroscopy (XPS) spectra of the OCN, ZnO, TiO2 and ZnO–TiO2/OCN samples. The full-scan XPS spectra of these samples display the presence of C 1s (284 eV), N 1s (400 eV), O 1s (528 eV), Ti 2p (458 eV) and Zn 2p (1022 eV) (Fig. S2‡).19,45 As shown in Fig. 2A, the high-resolution C 1s XPS spectra can be broken down into three peaks at 284.87, 287.80 and 288.53 eV, representing sp2 C–C, C–O and sp2 N–C![[double bond, length as m-dash]](https://www.rsc.org/images/entities/char_e001.gif) N in the CN triazines, respectively.46 The binding energies at 287.80 eV (C–O) and 530.64 eV (N–C–O) confirm successful O incorporation into the CN framework, as demonstrated by the partial substitution of the N atom with O in the aromatic heterocyclics of CN.47
N in the CN triazines, respectively.46 The binding energies at 287.80 eV (C–O) and 530.64 eV (N–C–O) confirm successful O incorporation into the CN framework, as demonstrated by the partial substitution of the N atom with O in the aromatic heterocyclics of CN.47
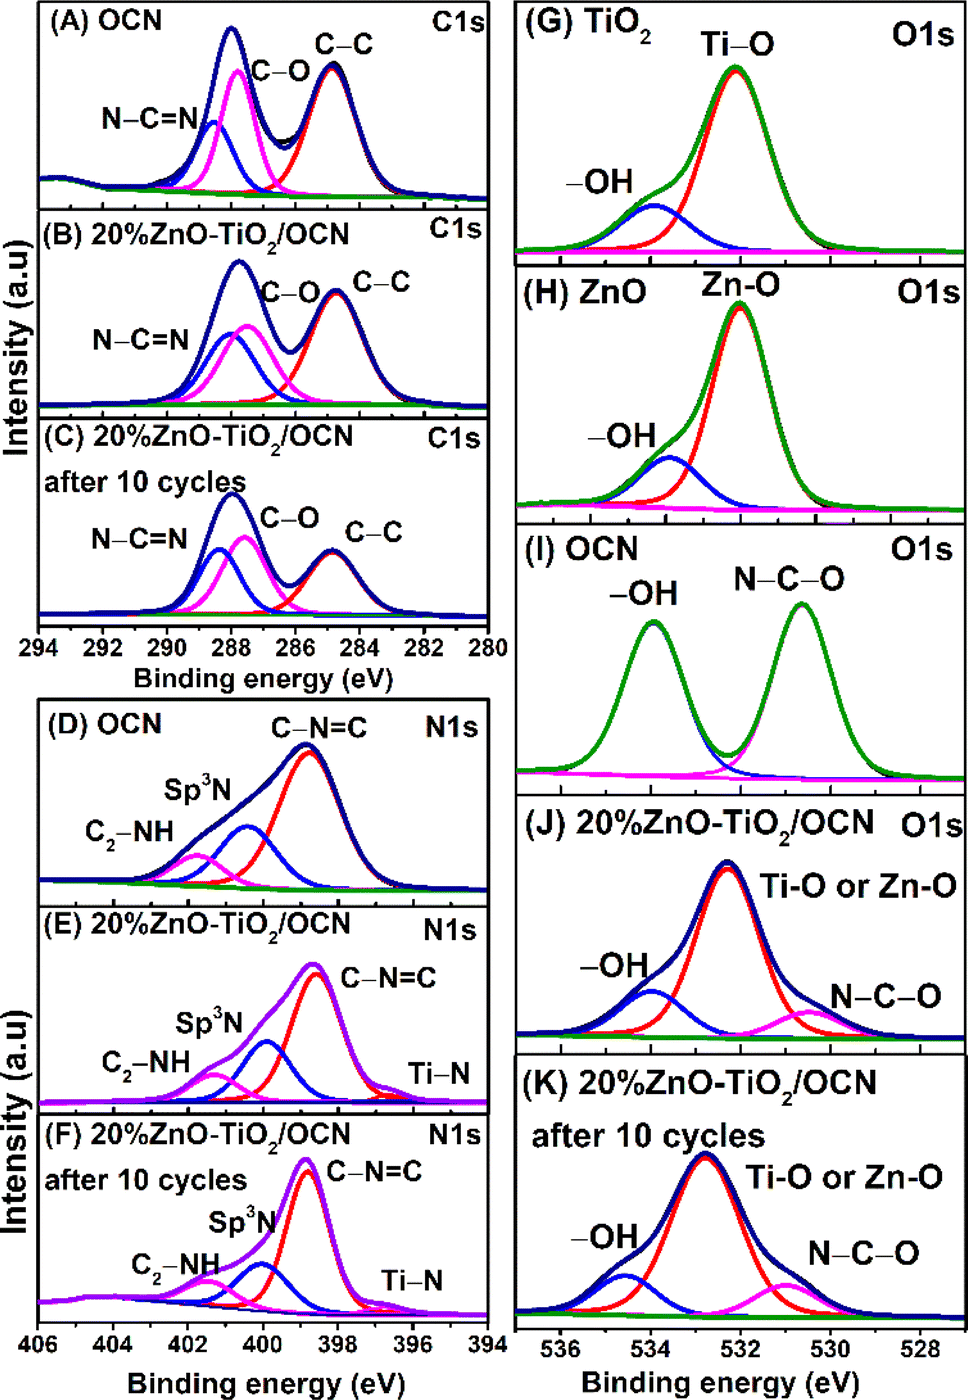 | ||
| Fig. 2 High-resolution C 1s XPS spectra of TiO2 (A), 20%ZnO–TiO2/OCN (B), and 20%ZnO–TiO2/OCN after 5 cycles (C); high-resolution N 1s XPS spectra of OCN (D), 20%ZnO–TiO2/OCN (E) and 20%ZnO–TiO2/OCN after 10 cycles (F); high-resolution O 1s XPS spectra of TiO2 (G), ZnO (H), OCN (I), 20%ZnO–TiO2/OCN (J) and 20%ZnO–TiO2/OCN after 5 cycles (K). | ||
The N 1s XPS spectra of the OCN, as illustrated in Fig. 2D, reveal three peaks associated with sp2 N (C–NC, 398.77 eV), tertiary N atom (sp3 N, 400.21 eV), and the amine functional group (C2–NH, 401.76 eV).48 Meanwhile, the N 1s XPS spectra of the 20%ZnO–TiO2/OCN sample display four peaks attributed to Ti–N bonding (396.63 eV), sp2 N (C–NC, 398.59 eV), tertiary N atom (sp3 N, 399.92 eV), and amine functional group (C2–NH, 401.31 eV).49 Interestingly, the C 1s and N 1s binding energies in the ZnO–TiO2/OCN sample exhibit a higher electron density than those in the OCN sample, owing to the negative binding energy shift. The high-resolution O 1s XPS spectra of ZnO and TiO2 samples are divided into two peaks at 532.09 and 533.91 eV, corresponding to metal–O bonding (Zn–O and Ti–O) and physically adsorbed –OH groups on the material (Fig. 2G and H).50–52 In a similar vein, the OCN sample presents two peaks at 530.64 and 533.93 eV that are assigned to the N–C–O bond and the physically adsorbed –OH group on the material (Fig. 2I).20
For the 20%ZnO–TiO2/OCN sample, the O 1s peaks are divided into three peaks at 530.48 eV (N–C–O), 532.29 eV (Ti–O or Zn–O) and 533.97 eV (–OH groups), respectively.30,31,53,54 The adsorption of –OH groups on the material's surface is advantageous for the formation of reactive radicals such as ˙OH and ˙O2− upon excitation by a suitable light source.55 Additionally, hydroxyl groups contribute to the reduction of electron recombination, prevent particle aggregation, and help enhance electrostatic interactions between the material and the targeted substance.55
The Ti 2p XPS spectra of the TiO2 sample were divided into two peaks at 458.48 and 464.16 eV, corresponding to Ti4+ in the TiO2 phase (Fig. 3A).56 In the 20%ZnO–TiO2/OCN sample (Fig. 3B), there was a positive shift in the binding energies of Ti4+ (458.79 and 464.46 eV), Ti3+ (457.47 and 462.96 eV) and Ti–N (460.28 and 465.91 eV), indicating an electron transition from TiO2 to OCN and subsequently decreasing the electric density of TiO2.57 In the TiO2 sample, Ti exists in the form of Ti4+, and no characteristic peak of Ti3+ is observed. For the 20%ZnO–TiO2/OCN sample, the Ti3+ and Ti4+ components account for 14.92% and 85.08%, respectively. The formation of Ti3+ in the 20%ZnO–TiO2/OCN sample may be due to the [–O–Ti–O–]n –Ti–(OH)x – mH2O groups or Ti–N formed during the oxidation process of sol–gel formation by the functional groups of OCN or the remaining amount of H2O2 in the OCN synthesis process.58 Both ZnO and ZnO–TiO2/OCN samples exhibited two peaks for Zn 2p binding energies at 1045.81 and 1022.72 eV for Zn 2p1/2 and Zn 2p3/2 (Fig. 3D and E). In the ZnO–TiO2/OCN sample, these two peaks shifted to a higher binding energy by 0.12 eV compared to the ZnO sample, indicating a decrease in electron density of the Zn atom in the ZnO–TiO2/OCN sample.59 Consequently, the binding energies of Ti 2p, Zn 2p and O 1s in the ZnO–TiO2/OCN sample increased compared to the pure ZnO and TiO2 samples. In contrast, the binding energies of C 1s and N 1s in the ZnO–TiO2/OCN sample decreased relative to the OCN sample. This outcome suggests that TiO2 and ZnO function as electron donors due to the decrease in electron density, while OCN acts as an electron acceptor as a result of the increased electron density. The formation of C–O–Ti and C–N–Ti covalent bonds at the OCN and ZnO–TiO2 heterojunctions facilitates charge migration and the separation of charge carriers from ZnO–TiO2 to OCN.60
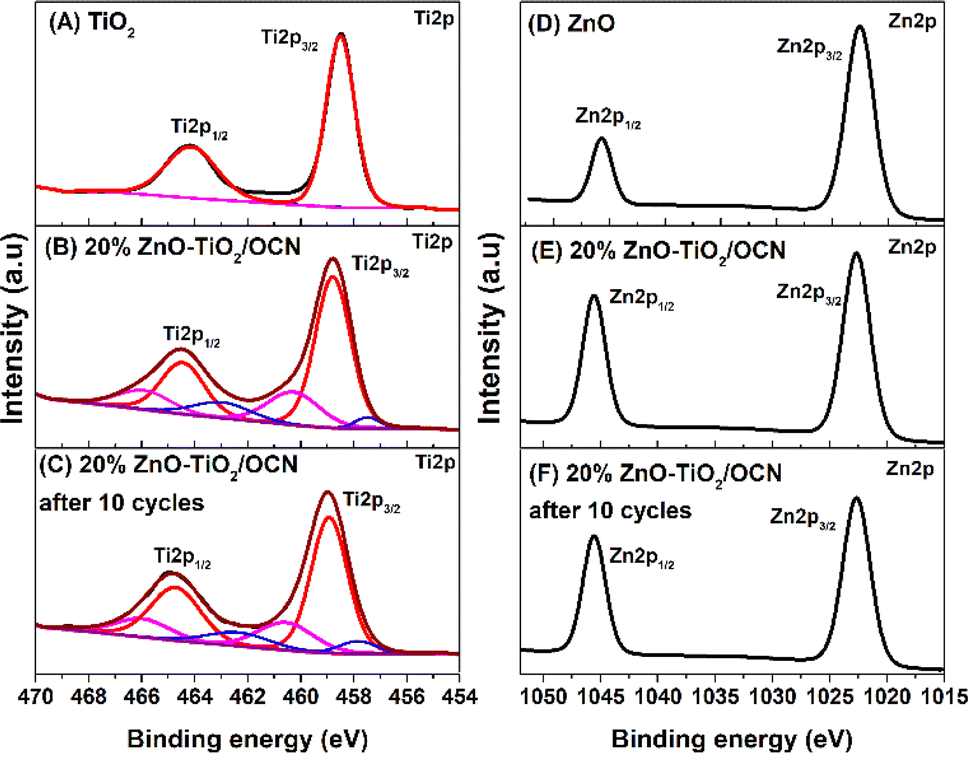 | ||
| Fig. 3 High-resolution Ti 2p XPS spectra of TiO2 (A), 20%ZnO–TiO2/OCN (C) and 20%ZnO–TiO2/OCN after 5 cycles (E); high-resolution Zn 2p XPS spectra of ZnO (B), 20%ZnO–TiO2/OCN (D) and 20%ZnO–TiO2/OCN after 5 cycles (F). | ||
The chemical compositions of the OCN and ZnO–TiO2/OCN samples were examined using energy-dispersive X-ray spectroscopy (EDS). The EDS analysis and EDS-mapping images of the OCN sample confirmed the presence of C, N and O elements in the OCN sample, corroborating the successful doping of O into the CN framework (see Fig. S3‡). As outlined in Table S3,‡ the elemental composition of C, N, and O in the OCN sample amounted to 43.60, 51.66 and 4.74 wt%, respectively.
In Fig. 4, the 20%ZnO–TiO2/OCN sample displays characteristic peaks for elements C, N, O, Ti and Zn. As indicated in Table S3,‡ the elemental composition of C and N remains relatively stable, registering at 21.92 to 22.04 and 26.07 to 26.47 wt%, respectively. Within the ZnO–TiO2/OCN samples, a decrease in the mass percentages of Ti and O coincides with an increase in the mass percentage of ZnO. The weight percentages of ZnO in the of 10%ZnO–TiO2/OCN, 20%ZnO–TiO2/OCN and 30%ZnO–TiO2/OCN were 9.8, 20.4 and 29.3%, respectively. These results suggest that the ZnO and TiO2 ratios determined by the EDS method align closely with the ZnCl2 and titanium isopropoxide ratios incorporated during the synthesis process.
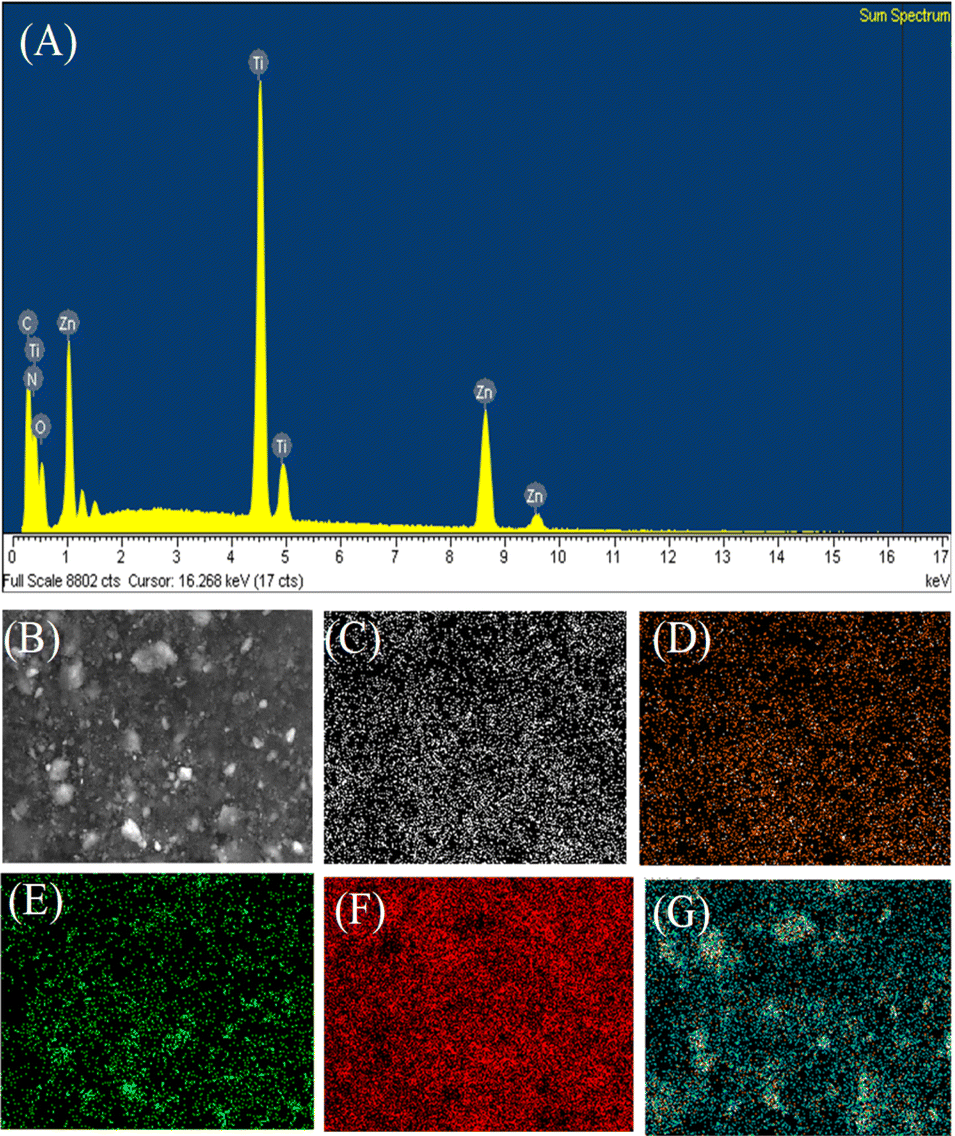 | ||
| Fig. 4 EDS spectrum (A), EDS element layered image (B), EDS element mapping images of C (C), N (D), O (E), Ti (F) and Zn (G) of 20%ZnO–TiO2/OCN sample. | ||
The morphology of the OCN, ZnO, TiO2 and ZnO–TiO2/OCN samples is illustrated in Fig. 5. The OCN sample, as viewed through transmission electron microscopy (TEM) in Fig. 5A, exhibits a plate-like morphology with plates stacked on top of each other. The ZnO and TiO2 samples, as seen in Fig. 5B and C, display a spherical shape with a uniform particle size of 20–30 nm. The ZnO–TiO2/OCN samples (Fig. 5D and E) reveal dark regions in the TEM images, representing high-density TiO2 and ZnO nanoparticles with a grain size of 10–15 nm, mounted on the surface of the OCN. The brighter contours within these samples correspond to OCN sheets adorned with TiO2 and ZnO nanoparticles. These findings confirm the successful attachment of TiO2 and ZnO nanoparticles to the surface of OCN sheets via the microwave-assisted hydrothermal method. Thus, the OCN sheets act as carriers to form nano-sized TiO2 and ZnO particles smaller than those synthesized individually. HRTEM image of the 20%ZnO–TiO2/OCN sample shows lattice spacing of 0.346 nm, 0.323 nm, and 0.254 nm assigned to TiO2 (110), CN (002), and ZnO (101) phases, respectively (Fig. S4‡). Thus, the (110) and (101) planes of TiO2 and ZnO are connected to OCN (002) at certain angles, demonstrating strong interaction between ZnO and TiO2 nanoparticles with carbon nitrite layered graphite.
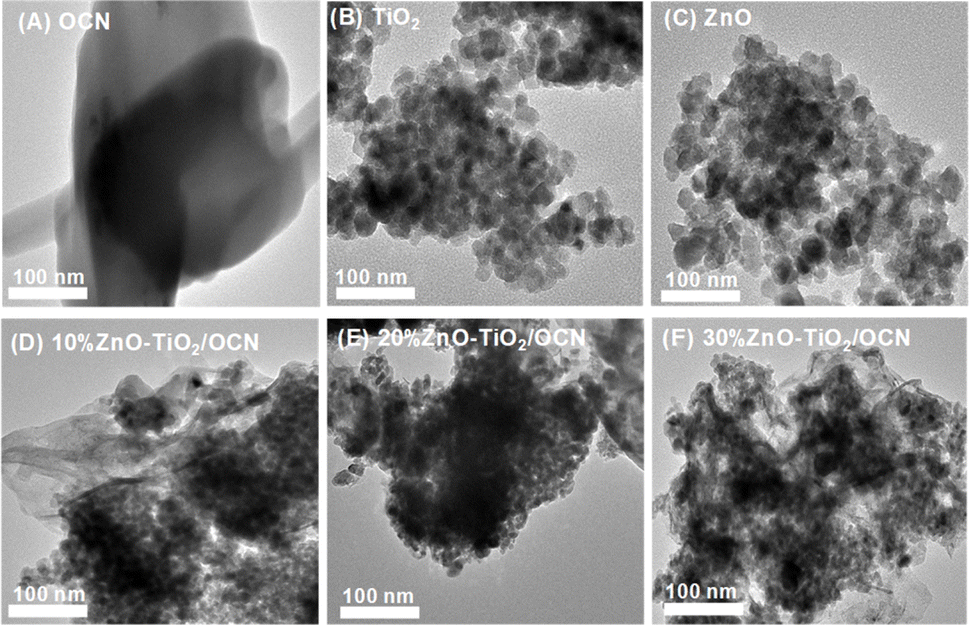 | ||
| Fig. 5 TEM images of OCN, ZnO, TiO2 and ZnO–TiO2/OCN samples. | ||
Fig. 6 represents the N2 adsorption–desorption isotherms of the OCN, TiO2, ZnO and ZnO–TiO2/OCN samples. As shown in the figure, the N2 adsorption–desorption isotherms of these samples align with the type IV hysteresis classification of IUPAC.61 At a partial pressure range of P/Po from 0.5 to 1, these isotherms display a hysteresis loop typical of mesoporous materials. Table 1 reveals that OCN materials have a surface area, pore volume, and pore diameter of 83.7 m2 g−1, 0.564 cm3 g−1, and 26.93 nm, respectively. This implies that the specific surface area parameters of the plate OCN of this study exceed those of the bulkier form of CN (28.6 m2 g−1) reported in previous studies.62 The ZnO sample exhibits the lowest surface area (18 m2 g−1), while the TiO2 samples demonstrate the highest surface area (133 m2 g−1). For ZnO–TiO2/OCN samples, both the specific surface area and total pore volume decrease notably with an increase in ZnO content from 10 to 30%, primarily due to the low surface area of ZnO (18 m2 g−1, as per Table 1).
 | ||
| Fig. 6 N2 adsorption–desorption isotherms of OCN, ZnO, TiO2 and ZnO–TiO2/OCN samples. | ||
| Samples | SBET (m2 g−1) | Vpore (cm3 g−1) | DBJH (nm) | Eg (eV) |
|---|---|---|---|---|
| ZnO | 18 | 0.068 | 6.75 | 3.25 |
| TiO2 | 133 | 0.380 | 10.53 | 3.20 |
| OCN | 84 | 0.703 | 24.63 | 2.70 |
| 10%ZnO–TiO2/CN | 98 | 0.681 | 19.04 | 2.75 |
| 20%ZnO–TiO2/CN | 86 | 0.645 | 18.93 | 2.77 |
| 30%ZnO–TiO2/CN | 69 | 0.428 | 18.86 | 2.80 |
Fig. 7 illustrates the optical and photoelectrochemical properties, including ultraviolet-visible diffuse reflectance spectroscopy (UV-Vis DRS), photoluminescence (PL), and electrochemical impedance spectroscopy (EIS) of the ZnO, TiO2, OCN and ZnO–TiO2/OCN samples.
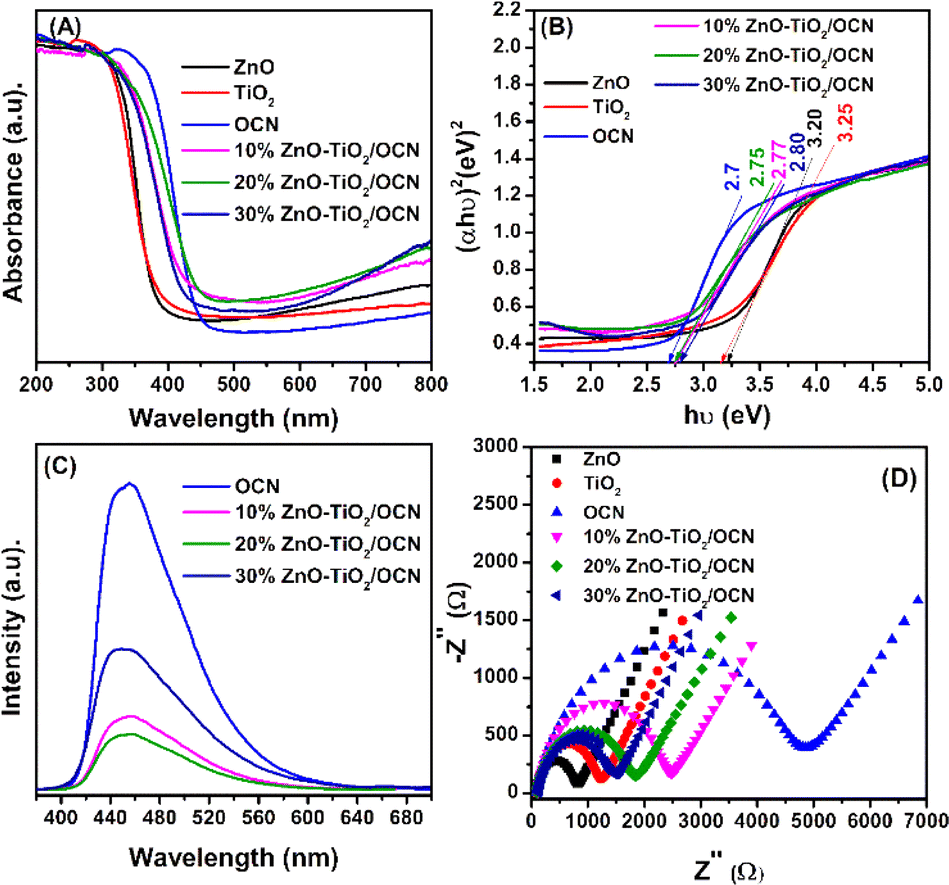 | ||
| Fig. 7 UV-Vis DRS spectrum (A), band-gap energies (B), photoluminescence spectra (C), EIS spectra (D) of TiO2, ZnO and ZnO–TiO2/OCN samples. | ||
As depicted in Fig. 7A, the UV-Vis spectra of the ZnO and TiO2 samples exhibit strong absorption in the ultraviolet light region with an absorption edge around 380 nm.16 The OCN sample, however, extends its absorption edge wavelength into the visible light region, approximately at 460 nm.36 The ZnO–TiO2/OCN samples demonstrate an absorption of light at longer wavelengths compared to the ZnO and TiO2 samples, attributable to the visible light absorption by OCN. The band-gap energies of the ZnO, TiO2, OCN and ZnO–TiO2/OCN samples were calculated using the Tauc plot equation, as depicted in Fig. 7B and Table 1. The band-gap energies of the ZnO, TiO2, OCN, 10%ZnO–TiO2/OCN, 20%ZnO–TiO2/OCN and 30%ZnO–TiO2/OCN samples were found to be 3.25, 3.20, 2.70, 2.76, 2.77 and 2.80 eV, respectively. As a result, all OCN and ZnO–TiO2/OCN samples exhibit visible light regions with band-gap energies ranging from 2.7 to 2.8 eV. The enhanced visible light absorption capacity of the ZnO–TiO2/OCN samples can be ascribed to the contact between the surfaces of the metal nanoparticles (TiO2 or ZnO) and the OCN sheets, fostering the separation of the charge carriers and accelerating electron transfer.6,63 Furthermore, the presence of Ti3+ in the photocatalysts heterostructure also broadens the visible light absorption range.60,63
The Mott–Schottky (MS) method was used to determine the flat band potential (Efb) as shown in Fig. S5.‡ For the ZnO, TiO2 and OCN samples, the Efb values were found to be −1.02, −1.04 and −1.36 eV, respectively. The Efb value using a conventional hydrogen electrode (NHE) can be computed using eqn (2):
| E(NHE) = EAg/AgCl + 0.059 pH + EAg/AgCl | (2) |
Considering the difference in valence energy (EVB) from NHE to be around 0.1 eV for n-type semiconductors,64 the conduction band (CB) values for ZnO, TiO2, and OCN samples were found to be −0.51, −0.53 and −0.95 eV, respectively. The relationship between the conduction band potential (ECB) and band gap energy (Eg) allows for the determination of the valence band potential (EVB) using eqn (3):
| EVB = Eg + ECB | (3) |
The EVB values of the ZnO, TiO2 and OCN samples were calculated to be 2.74, 2.67 and 1.75 eV, respectively.
Photoluminescence spectroscopy was employed to analyze the recombination of the photogenerated electron–hole pairs in the OCN, TiO2, ZnO and ZnO–TiO2/OCN samples (Fig. 7B). The OCN sample displayed an intense emission band around 465 nm, indicating electron–hole recombination and n–π* electron transition in CN.65 This peak intensity decreases in the following order: OCN > TiO2 > ZnO > 10%ZnO–TiO2/OCN > 30%ZnO–TiO2/OCN > 20%ZnO–TiO2/OCN. The recombination rate of photogenerated electron and hole pairs in CN is significantly reduced due to the electron captured by ZnO–TiO2 nanoparticles, leading to faster charge carrier movement between ZnO–TiO2 and OCN, lower PL intensity, and enhanced photocatalytic activity of ZnO–TiO2/OCN samples in the oxidation desulfurization reaction.66 The 20%ZnO–TiO2/OCN sample displayed the lowest photoluminescence intensity, suggesting the lowest recombination capacity of electron and hole pairs.
EIS was used to assess the electron transport properties of the OCN, TiO2, ZnO and ZnO–TiO2/OCN samples. In Fig. 7D, the OCN sample, with a large Nyquist semicircle radius, exhibited poor charge transfer.51 However, the semicircle radius significantly decreased after grafting the TiO2 and ZnO nanoparticles onto the OCN plates. This suggests that the electron transfer rate from the electrolyte to the electrode surface can be enhanced by combining OCN with ZnO or TiO2, further substantiating the strong interaction between phases in the ZnO–TiO2/OCN sample. This increase in charge transfer capacity can be attributed to (i) the rise in the ZnO and TiO2 carriers; and (ii) the formation of heterojunctions between the OCN and MOx phases (ZnO and TiO2) through Ti–N–C, Ti–O–C bonding, as confirmed by XPS spectra.
3.2. Photocatalytic activity of ZnO, TiO2, OCN and ZnO–TiO2/OCN samples
The photocatalytic activity of ZnO, TiO2, OCN and ZnO–TiO2/OCN samples was evaluated through the desulfurization of DBT under visible light irradiation. The performance of these materials is depicted in Fig. 6. As shown in Fig. 8A, all samples adsorbed 15–25% of DBT in the dark after 60 min, a result attributable to their high surface area. The ZnO, TiO2 and OCN samples achieved DBT removal rates of 48.15, 56.82 and 68.15%, respectively after 120 minutes of light irradiation. The desulfurization efficiency of ZnO/OCN, TiO2/OCN, ZnO–TiO2 and 20%ZnO–TiO2/OCN samples (Fig. S6‡) reached 80.35, 83.63, 72.16 and 94.62%, respectively, after 120 minutes of light irradiation. The first-order reaction rate constant of the ZnO–TiO2/OCN sample is faster by 2.16, 1.7, and 1.52 times compared to the ZnO–TiO2, ZnO/OCN, TiO2/OCN samples, respectively, demonstrating the effectiveness of the third-order photocatalyst ZnO–TiO2/OCN (Fig. S7‡). Intriguingly, the ZnO–TiO2/OCN samples exhibited higher DBT removal efficiency than the individual ZnO, TiO2 and OCN samples. This can be ascribed to (i) enhanced visible light absorption, (ii) reduced recombination rates of photogenerated electron–hole pairs, (iii) more favorable generation and movement of charge carriers due to the formation of Ti–O–N, Ti–N–C bonds, and (iv) the synergistic effect of active phases. For the ZnO–TiO2/OCN samples, the DBT removal rates achieved by the 10%ZnO–TiO2/OCN, 20%ZnO–TiO2/OCN and 30%ZnO–TiO2/OCN samples were 88.91, 94.62 and 85.06%, respectively after 120 min light irradiation. As the ZnO content increased from 10 to 20%, the DBT treatment efficiency increased, but when the ZnO content further increased from 20% to 30%, the DBT removal decreased. This decrease can be attributed to the 30%ZnO–TiO2/OCN samples significantly reduced surface area (Table 1), higher band gap energy, and increased rate of photogenerated electron–hole recombination, compared to the 10%ZnO–TiO2/OCN and 20% ZnO–TiO2/OCN samples.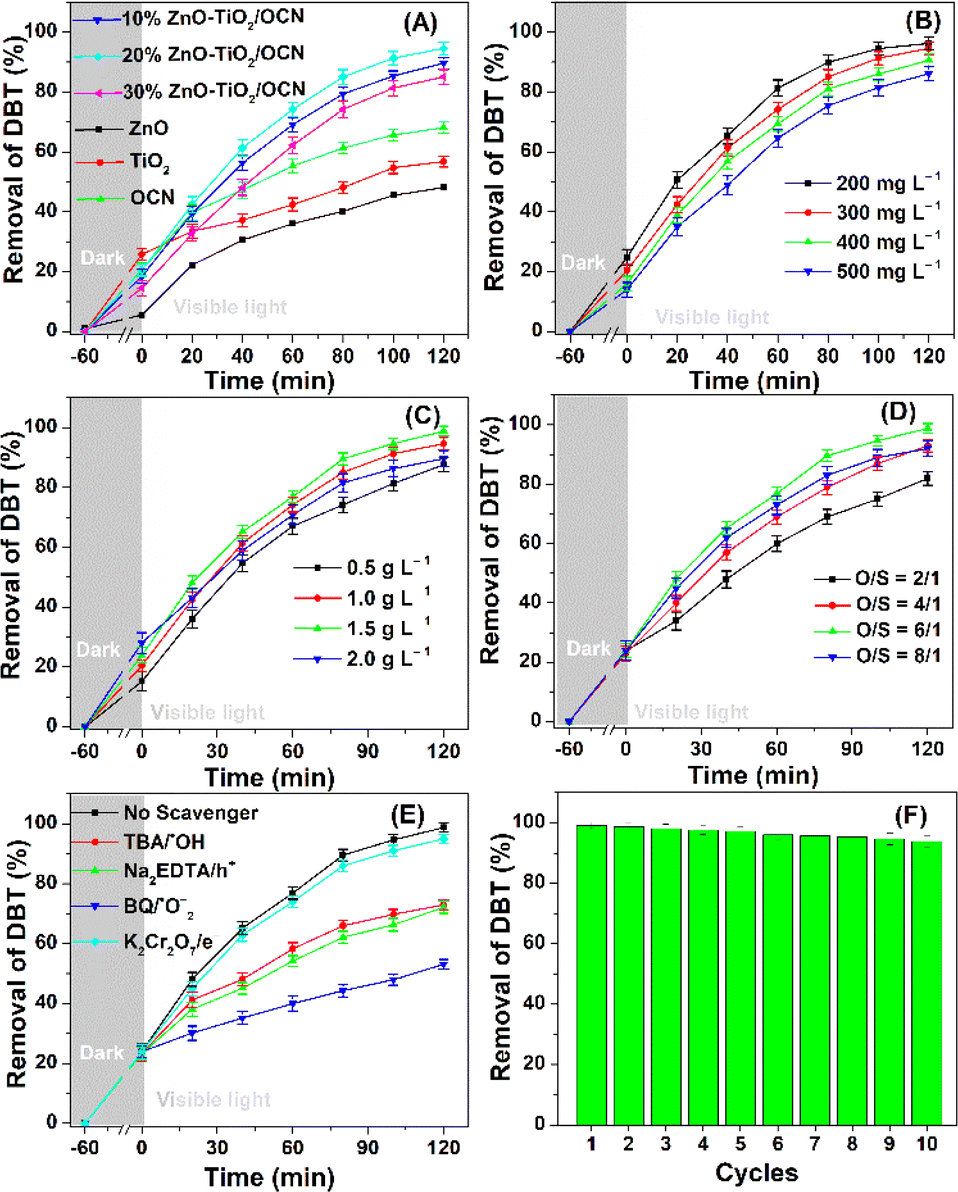 | ||
| Fig. 8 (A) DBT conversion using ZnO, TiO2, OCN and ZnO–TiO2/OCN samples; DBT conversion using 20%ZnO–TiO2/OCN at various initial DBT concentrations (B), catalyst dosage (C), O/S molar ratio (D), reactive radicals (E) and stability (F). | ||
Fig. 8B presents the removal of DBT on the 20%ZnO–TiO2/OCN photocatalyst for various initial DBT concentrations. It can be observed that as the initial DBT concentration increases, the DBT removal efficiency decreases. With an initial DBT concentration of 200 mg L−1, 97% of DBT was desulfurized into DBT-O2 after 120 minutes. However, when the DBT concentration increased from 200 mg L−1 to 500 mg L−1, the desulfurization efficiency dropped from 97% to 85% after the same reaction duration. Thus, for higher concentrations of DBT, the 20% ZnO–TiO2/OCN catalyst requires more time to convert DBT into DBT-O2 (Fig. S6‡). The dosage of 20% ZnO–TiO2/OCN catalyst also influences the removal of DBT. As depicted in Fig. 8C, the DBT removal rate rose from 87.6% to 99.19% when the catalyst dosage increased from 0.5 to 1.5 g L−1. This outcome can be attributed to an increase in active sites resulting from the increase in catalyst dosage, thereby enhancing the DBT removal.7 However, when the dosage of 20%ZnO–TiO2/OCN catalyst excessively increased from 1.5 to 2 g L−1, the DBT removal rate decreased from 99.19 to 89.68%. This decline is attributed to the catalyst being suspended in the solution, hindering the light absorption.37
The effect of the O/S ratio on DBT removal was determined by adjusting the H2O2 content and the DBT concentration. Fig. 8D shows that the DBT removal rose from 82.83% to 99.19% when the O/S molar ratio increased from 2 to 6. However, when the O/S ratio further increased from 6 to 8, the DBT removal fell from 99.19% to 92.08%. This reduction might be due to the excess of ˙OH groups facilitating the formation of ˙OOH radicals, which possess a weaker oxidizing potential than the ˙OH radical. Consequently, the optimal conditions determined in this study are a 20%ZnO–TiO2/OCN photocatalyst, DBT concentration of 300 mg L−1, catalyst dosage of 1.5 g L−1 and O/S molar ratio of 6. Under optimal conditions, the ZnO–TiO2/OCN photocatalyst demonstrated capabilities remarkable desulfurization with 92.13% of DBT removed from the real fuel oil samples. The intermediate product of DBT desulfurization on the photocatalyst was analyzed by GC-MS (Fig. S8‡). In Fig. S6A,‡ the ion signal at m/z 184.03 corresponds to the original DBT.67,68 After the light irradiation time was increased, the intensity of the signal at m/z 184.03 decreased and the intensity of the signal at m/z 216.02 assigned to DBT-O2 increased.67,68 Thus, the GC-MS results demonstrated that the main product of DBT desulfurization on 20%ZnO–TiO2/OCN photocatalyst is DBT sulfone. The DBT desulfurization efficiency of 20%ZnO–TiO2/OCN photocatalyst was compared with other photocatalysts (Table S4‡). It is shown that the 20%ZnO–TiO2/OCN sample in our study outperforms other photocatalysts published previously in terms of DBT desulfurization efficiency.
3.3. Photodegradation mechanism of DBT over the ZnO–TiO2/OCN photocatalyst
Reactive radicals (˙O2− and ˙OH), photogenerated holes (h+) and electrons (e−) are pivotal in the PODS process of DBT. To elucidate the photodegradation mechanism, the ZnO–TiO2/OCN photocatalyst was employed, and radical trapping experiments were conducted. As shown in Fig. 8E, the addition of radical scavengers such as Na2-EDTA, p-BQ and TBA significantly diminished the DBT removal, indicating that the oxidative desulfurization of DBT primarily involves ˙O2−, ˙OH and photogenerated holes (h+).69 Conversely, electrons (e−) played a negligible role in the oxidative desulfurization process of DBT, as the addition of K2Cr2O7 did not significantly affect the DBT removal. Reactive radicals ˙O2− and ˙OH were determined using electron spin resonance (ESR) spectroscopy with 5,5-dimethyl-1-pyrroline-N-oxide (DMPO) as a spin trap. In Fig. S9,‡ no peaks characteristic of ˙O2− and ˙OH were observed under dark conditions. However, under visible light irradiation conditions, distinct high-intensity peaks of ˙O2− and ˙OH radicals were evident, indicating their generation during the reaction on the 20%TiO2/ZnO/OCN photocatalyst.70–72 The greater intensity of DMPO-˙O2− compared to DMPO-˙OH suggests that ˙O2− plays a more important role than ˙OH in the removal of DBT. Based on the results of the trap active radicals experiment and ESR spectra, it is evident that ˙O2− is the predominant species in the removal process of DBT. Drawing on the electrochemical, photoelectric, and XPS properties of OCN, ZnO and TiO2 materials, we analyzed the band structure of these materials.As depicted in Fig. 9A, under light irradiation, all phase components in the ZnO–TiO2/OCN sample are excited, causing electrons to transition from VB to CB. As the CB levels of ZnO (−0.51 eV), TiO2 (−0.53 eV) and OCN (−0.95 eV) are all more negative than the redox potential of E°(O2/˙O2−, −0.33 eV), the electrons on the CB of ZnO, TiO2, and OCN can absorb O2 at the surface to generate ˙O2− radicals.73,74 The VB of TiO2 (+2.67 eV) and ZnO (+2.74 eV), both having more positive energy than the potential of ˙OH/H2O pair (+2.4 eV), enable the holes to react with surface hydroxyl groups or adsorbed water molecules on the ZnO and TiO2 surfaces to generate hydroxyl radicals (˙OH) with high DBT desulfurization activity.60 However, the photogenerated holes (h+) at the VB of OCN (+1.75 eV) cannot react with OH− or H2O to generate the ˙OH radical, as the potential of ˙OH/H2O and OH/OH− pairs is more positive than the VB level of the OCN (+1.75 eV). It's noteworthy that the ZnO–TiO2/OCN material is rich in oxygen, and the –OH groups are evidenced in the XPS spectra. According to the direct Z-scheme, the electrons at CB of TiO2 and ZnO can recombine with photogenerated holes in the VB of OCN as determined by XPS (Fig. 9B). These electrons then react with molecular oxygen near the surface of the OCN to produce ˙O2− radicals and directly oxidize DBT. Unlike the p–n mechanism, the holes in the conduction band of TiO2 and ZnO do not lose energy when moving to the conduction band of OCN. The holes in the conduction band of TiO2 and ZnO will react with water molecules adsorbed on the surface of ZnO and TiO2 or with hydroxyl groups on the surface to generate hydroxyl radicals (˙OH).
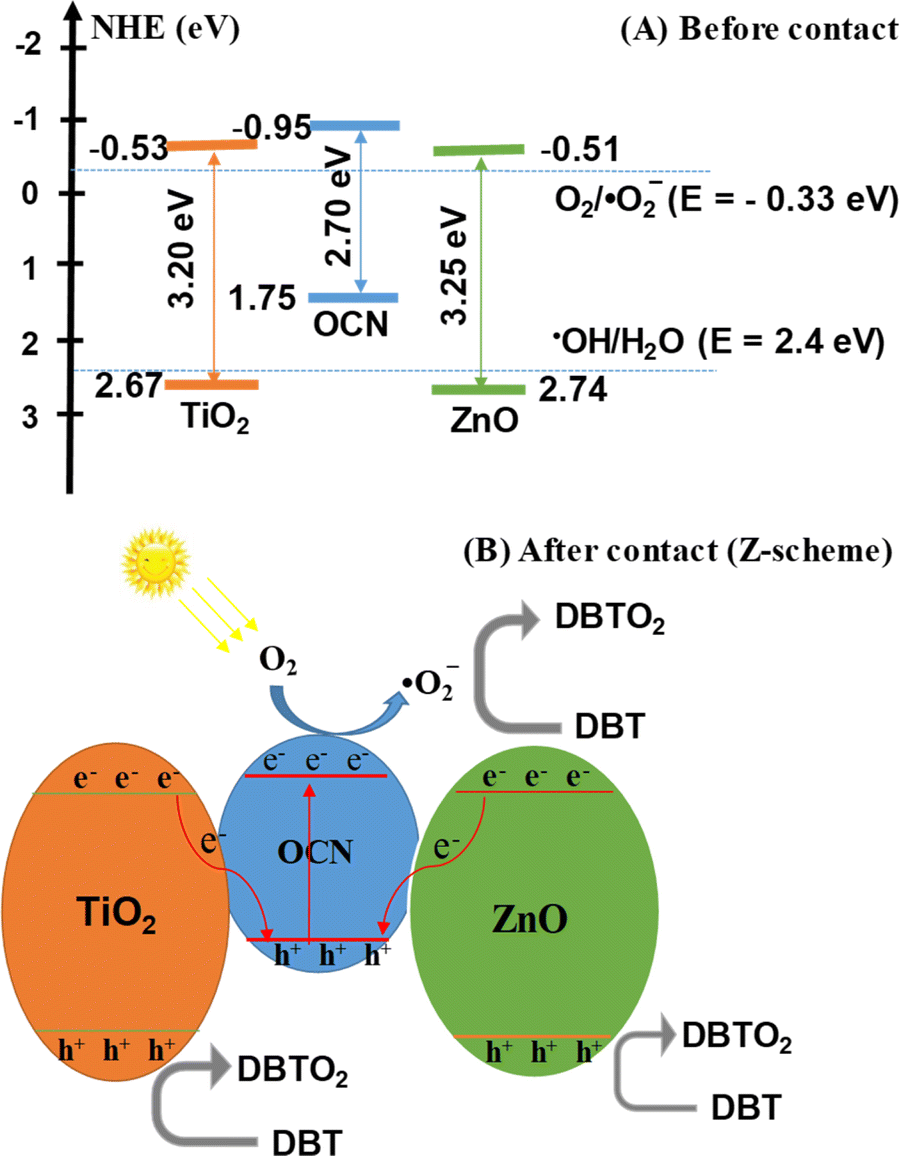 | ||
| Fig. 9 Band structure of ZnO–TiO2/OCN sample; (A) before contact and (B) after contact. | ||
3.4. The stability of 20%ZnO–TiO2/OCN
The practical utility of a photocatalyst system relies on its stability and reusability. To evaluate these attributes, recycling tests were conducted using the 20%ZnO–TiO2/OCN photocatalyst in the DBT desulfurization process. As depicted in Fig. 8F, the DBT removal efficiency remained consistently above 93% throughout ten cycles of 120 minute desulfurization, affirming the reusability and stability of the 20%ZnO–TiO2/OCN photocatalyst. The slight decrease in DBT removal efficiency observed may be attributed to the oxidation product of DBT (DBTO2) coating the catalyst surface, as suggested by Xun et al.67 The stability of the heterogeneous 20%ZnO–TiO2/OCN catalyst was further confirmed by XPS, XRD and TEM analysis. Post five reaction cycles, the XPS spectra of the ZnO–TiO2/OCN sample exhibit peaks corresponding to the binding energies of Ti4+ (459.72 and 465.53 eV), Ti3+ (461.36 and 466.77 eV), Ti–N (458.64 and 463.17 eV) (Fig. 3D), Zn2+ (1046.83 and 1022.81) (Fig. 3E), C 1s (284.85 eV: sp2 C–C; 287.59 eV: C–O; 288.37 eV: sp2 N–CN) (Fig. 2C), N 1s (Ti–N: 396.81 eV; C–NC: 398.80 eV; sp3 N, 400.00 eV; C2–NH, 401.41 eV) (Fig. 2F) and O 1s (530.99 eV: N–C–O; 532.77 eV: Ti–O or Zn–O; and 534.55 eV: –OH groups) (Fig. 2K).75 The binding energies of Ti 2p, Zn 2p, O 1s, C 1s and N 1s did not undergo significant changes. However, there was a positive energy shift in the bond energies of these elements, likely due to the decrease in electron density during the reaction.19 As depicted in Fig. S10 and S11,‡ the crystal structure and morphology of the ZnO–TiO2/OCN heterogeneous photocatalyst remained largely unchanged after five cycles. These observations suggest that the ZnO–TiO2/OCN heterojunction exhibits excellent stability, marking it as a potent photocatalyst. This underpins its potential for industrial application.
3.5. Theoretical calculation results
To gain deeper insights into the interactions within the ZnO–TiO2-OCN system, density functional theory (DFT) employing the Grimme D2 dispersion correction method was utilized.76 The Perdew–Burke–Ernzerhof (PBE) exchange-correlation functional was applied with a double zeta plus polarization (DZP) basis set.77 The Brillouin zone was sampled at the Γ point (1,1,1), and a mesh cutoff energy of 250 Ryd was employed. The calculations utilizing the corrugated g-C3N4 model in s-triazine form have demonstrated superior photocatalytic activity compared to the planar model.78 The TiO2-ZnO composite phase was modeled using clusters (TiO2)7 and (ZnO)6.78,79The interaction between the components in the photocatalytic system is characterized by the interaction energy (Eint), which is calculated as: Eint = E(A/B) − E(A) − E(B). Here, E(A/B) represents the energy of the combined system, while E(A) and E(B) denote the energies of the individual components. Population analysis, including bond order values, was conducted to elucidate the nature of the interaction. All optimizations and energy calculations were performed using the SIESTA code.80 The optical properties of the material system, including band gap and maximum absorption peaks obtained from UV spectra calculations, were evaluated using time-dependent density functional theory (TDDFT) with the hybrid functional PBE0 in the CP2K code.81 Theoretical calculation results revealed a strong chemical interaction between the (TiO2)7 and (ZnO)6 phases, indicated by highly negative Eint (−770 kJ mol−1). In contrast, (TiO2)7(ZnO)6 showed a weaker chemical interaction with CN, primarily through M⋯N bonds (Zn⋯N and Ti⋯N), with the maximum bond order being 0.37 (Fig. 10A). These theoretical calculation results align with the XPS findings presented in Fig. 3. The calculated optical properties of the (TiO2)7, (ZnO)6, (TiO2)7(ZnO)6, OCN and ZnO–TiO2/OCN are presented in Table S5.‡
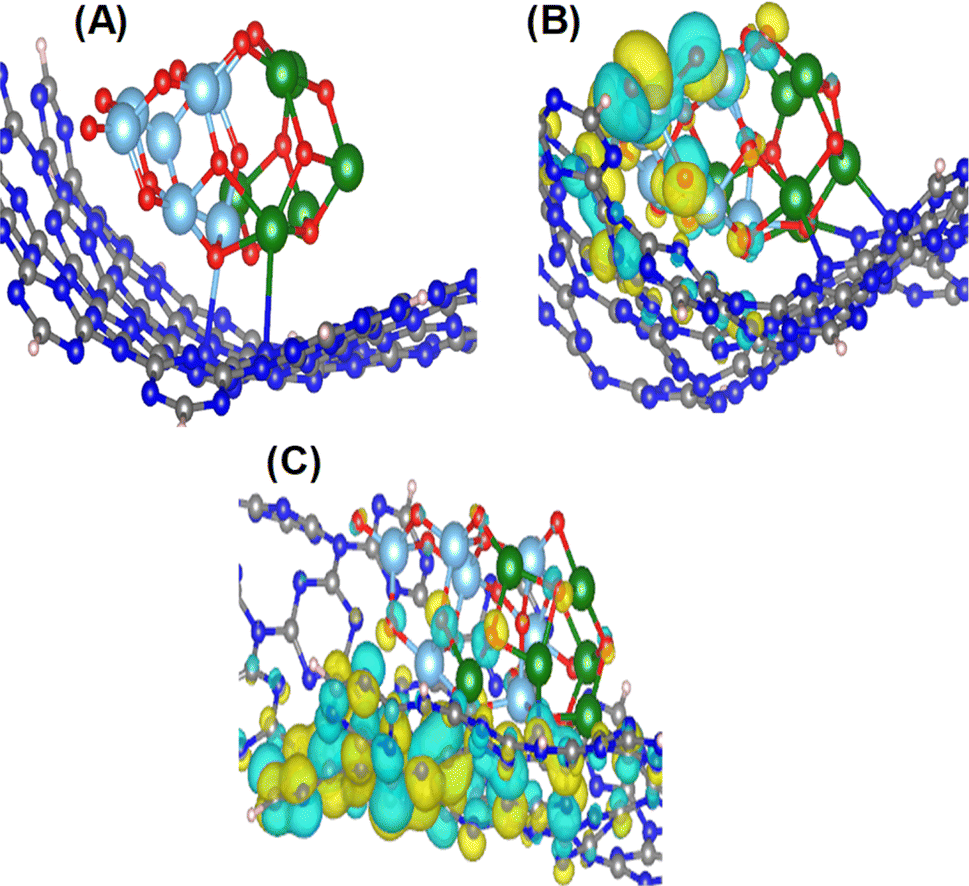 | ||
| Fig. 10 Chemical bonding between (TiO2)7(ZnO)6 with g-C3N4 (A); images of HOMO (B) and LUMO (C) of ZnO–TiO2/OCN photocatalyst. Color codes: grey – C, blue – N, light blue – Ti, green – Zn, red – O. | ||
Notably, there is a marked reduction in bandgap energy and maximum absorption peak when TiO2, ZnO with OCN are combined, attributed to the electron redistribution between ZnO, TiO2 and OCN.82 It is noteworthy that the calculated band gap is significantly higher than the experimental result due to the quantum confinement effect. Fig. 10B and C display images of the highest occupied molecular orbital (HOMO) and the lowest unoccupied molecular orbital (LUMO). It can be observed that the HOMO of the ZnO–TiO2/OCN system is predominantly localized on TiO2, whereas the LUMO is primarily contributed by the atoms of OCN. This finding supports the hypothesis that the ZnO–TiO2/OCN system exhibits a band structure consistent with the Z-scheme mechanism. Specifically, upon light excitation, photogenerated electrons and holes dissociate and the electrons move from the HOMO to the LUMO of the constituent phases. Owing to the chemical interaction between ZnO–TiO2 and CN via M⋯N bonds (Zn⋯N and Ti⋯N), ZnO and TiO2 electrons readily migrate to the OCN HOMO, inhibiting electron–hole recombination and promoting effective separation of electron–hole pairs. This theoretical calculation result well corroborates the experimental findings in previous studies.82–84
4. Conclusion
This study present pioneering approach to fabricating Z-scheme photocatalysts, representing the first instance of integrating ZnO–TiO2/OCN using a sol–gel method coupled with microwave techniques. Remarkably, our method significantly reduces the crystallization time to just 30 minutes and stands out for its avoidance of harmful solvents, a common concern in similar studies. Under optimal conditions (1.5 g L−1 of 20%ZnO–TiO2/OCN photocatalyst, a temperature of 25 °C, irradiation time of 120 min, O/S molar ratio of 6, and initial DBT concentration 300 mg L−1), the 20%ZnO–TiO2/OCN photocatalyst could convert 99.19% of DBT to DBT-O2. Radical trapping experiments confirmed that the formation of ˙O2− and ˙OH radicals primarily determine the reaction rate.After ten reaction cycles, the 20%ZnO–TiO2/OCN catalyst maintained an efficiency of over 93% for DBT desulfurization and could remove 92.13% of DBT in the actual fuel oil sample. Based on the trapping test of reaction intermediates, the band structure of the material, and the confirmed electronic shift results in the XPS and DFT methods, the 20%ZnO–TiO2/OCN catalyst operates according to the properties of the direct Z-scheme photocatalyst. Our findings catalyze a new direction in the research of next-generation Z-scheme composite materials, emphasizing the sol–gel method combined with microwave techniques for enhanced oxidative desulfurization. Future work will aim at the pilot-scale production of ZnO–TiO2/OCN and its integration into desulfurization units, as well as broadening its application to water purification.
Data availability
The authors confirm that the data supporting the findings of this study are available within the article.Author contributions
Manh B. Nguyen: investigation, formal analysis, data curation, writing – original draft, Pham Thi Lan: investigation, formal analysis, data curation, writing – original draft. Xuan Nui Pham: writing – original draft; validation. Pham Thi Hai Yen: data curation, methodology. Nguyen Ngoc Ha: resources; software. Nguyen Thi Thu Ha: software; visualization. T.-Thanh-Bao Nguyen: project administration. Huan V. Doan: validation; visualization. Nguyen Tuan Anh: writing – original draft. Tran Dai Lam: conceptualization; funding acquisition; writing – reviewing and editing; supervision.Conflicts of interest
There are no conflicts to declare.Acknowledgements
This work was funded by The Vietnam Academy of Science and Technology (VAST) under the grant number NCXS 01.01/22-24.References
- X. Zhou, H. Liu, S. Liu, L. Zhang, T. Wang, C. Wang and D. Su, Fuel, 2023, 332, 126147 CrossRef CAS.
- L. Wu, Z. Jiao, S. Xun, M. He, L. Fan, C. Wang, W. Yang, W. Zhu and H. Li, Chin. J. Chem. Eng., 2022, 44, 205–211 CrossRef CAS.
- K. Zhang, F. Chu, Y. Hu, X. Huang, G. Zhao and G. Wang, Chin. Chem. Lett., 2023, 34, 107766 CrossRef CAS.
- W. Piao, Z. Li, C. Li, J. S. Park, J. H. Lee, Z. Li, K. Y. Kim, L. Y. Jin, J. M. Kim and M. Jin, RSC Adv., 2021, 11, 27453–27460 RSC.
- X. Zhang, H. Song, C. Sun, C. Chen, F. Han and X. Li, Mater. Chem. Phys., 2019, 226, 34–43 CrossRef CAS.
- B. Li, H. Song, F. Han and L. Wei, Appl. Catal., B, 2020, 269, 118845 CrossRef CAS.
- X. N. Pham, M. B. Nguyen, H. S. Ngo and H. V. Doan, J. Ind. Eng. Chem., 2020, 90, 358–370 CrossRef CAS.
- X. N. Pham, B. M. Nguyen, H. T. Thi and H. Van Doan, Adv. Powder Technol., 2018, 29(8), 1827–1837 CrossRef CAS.
- C. N. C. Hitam, A. A. Jalil and A. A. Abdulrasheed, J. Ind. Eng. Chem., 2019, 74, 172–186 CrossRef CAS.
- M. B. Nguyen, X. N. Pham and H. V. Doan, RSC Adv., 2021, 11, 31738–31745 RSC.
- Q. Xu, L. Zhang, J. Yu, S. Wageh, A. A. Al-Ghamdi and M. Jaroniec, Mater. Today, 2018, 21, 1042–1063 CrossRef CAS.
- T. Pedram-rad, Z. Es'haghi, A. Ahmadpour, M. S. Kazemi and A. A. Mohammadi, Arabian J. Chem., 2022, 15, 104084 CrossRef CAS.
- A. H. Mamaghani, F. Haghighat and C. S. Lee, Appl. Catal., B, 2017, 203, 247–269 CrossRef CAS.
- S. Matsuzawa, J. Tanaka, S. Sato and T. Ibusuki, J. Photochem. Photobiol., A, 2002, 149, 183–189 CrossRef CAS.
- K. Kalantari, M. Kalbasi, M. Sohrabi and S. J. Royaee, Ceram. Int., 2016, 42, 14834–14842 CrossRef CAS.
- U. K. H. M. Nadzim, N. H. H. Hairom, M. A. H. Hamdan, M. K. Ahmad, A. A. Jalil, N. W. C. Jusoh and S. Hamzah, J. Alloys Compd., 2022, 913, 165145 CrossRef CAS.
- M. Saeed, M. Munir, A. Intisar and A. Waseem, ACS Omega, 22, 7(18), 15809–15820 CrossRef PubMed.
- D. Van Le, M. B. Nguyen, P. T. Dang, T. Lee and T. D. Nguyen, RSC Adv., 2022, 12, 22367–22376 RSC.
- M. B. Nguyen, D. T. Sy, V. T. K. Thoa, N. T. Hong and H. V. Doan, J. Taiwan Inst. Chem. Eng., 2022, 140, 104543 CrossRef CAS.
- X. N. Pham, H. T. Nguyen, T. N. Pham, T. T. B. Nguyen, M. B. Nguyen, V. T. T. Tran and H. V. Doan, J. Taiwan Inst. Chem. Eng., 2020, 114, 91–102 CrossRef CAS.
- J. Wen, J. Xie, X. Chen and X. Li, Appl. Surf. Sci., 2017, 391, 72–123 CrossRef CAS.
- M. Ismael and Y. Wu, Sustainable Energy Fuels, 2019, 3, 2907–2925 RSC.
- T. Wang, C. Nie, Z. Ao, S. Wang and T. An, J. Mater. Chem. A, 2020, 8, 485–502 RSC.
- A. Naseri, M. Samadi, A. Pourjavadi, A. Z. Moshfegh and S. Ramakrishna, J. Mater. Chem. A, 2017, 5, 23406–23433 RSC.
- C. C. Wang, X. H. Yi and P. Wang, Appl. Catal., B, 2019, 247, 24–48 CrossRef CAS.
- A. Y. Shen, C. Zhang and C. Yan, Chin. Chem. Lett., 2017, 28(6), 1312–1317 CrossRef.
- M. Hassannezhad, M. Hosseini, M. R. Ganjali and M. Arvand, Anal. Methods, 2019, 11, 2064–2071 RSC.
- Y. Li, Y. Fang, Z. Cao, N. Li, D. Chen, Q. Xu and J. Lu, Appl. Catal., B, 2019, 250, 150–162 CrossRef CAS.
- L. Jiang, X. Yuan, Y. Pan, J. Liang, G. Zeng, Z. Wu and H. Wang, Appl. Catal., B, 2017, 217, 388–406 CrossRef CAS.
- Y. C. Chu, T. J. Lin, Y. R. Lin, W. L. Chiu, B. S. Nguyen and C. Hu, Carbon, 2020, 169, 338–348 CrossRef CAS.
- C. Saka, Fuel, 2022, 310, 122444 CrossRef CAS.
- X. She, L. Liu, H. Ji, Z. Mo, Y. Li, L. Huang, D. Du, H. Xu and H. Li, Appl. Catal., B, 2016, 187, 144–153 CrossRef CAS.
- C. Wang, W. Zhu, Y. Xu, H. Xu, M. Zhang, Y. Chao, S. Yin, H. Li and J. Wang, Ceram. Int., 2014, 40, 11627–11635 CrossRef CAS.
- G. Miao, D. Huang, X. Ren, X. Li, Z. Li and J. Xiao, Appl. Catal., B, 2016, 192, 72–79 CrossRef CAS.
- X. Zhou, T. Wang, L. Zhang, S. Che, H. Liu, S. Liu, C. Wang, D. Su and Z. Teng, Appl. Catal., B, 2022, 316, 121614 CrossRef CAS.
- D. Van Le, M. B. Nguyen, P. T. Dang, T. Lee and T. D. Nguyen, RSC Adv., 2022, 12, 22367–22376 RSC.
- M. Abdollahi, A. Larimi, Z. Jiang, F. Khorasheh and C. Ghotbi, J. Cleaner Prod., 2022, 380, 134968 CrossRef CAS.
- H. He, Z. Luo and C. Yu, J. Alloys Compd., 2020, 816, 152652 CrossRef CAS.
- H. He, J. Li, C. Yu and Z. Luo, Sustainable Mater. Technol., 2019, 22, e00127 CrossRef CAS.
- T. Liu, Y. Li, H. Sun, M. Zhang, Z. Xia and Q. Yang, Jiegou Huaxue, 2022, 41, 2206055–2206061 CAS.
- A. S. M. I. Uddin, D. T. Phan and G. S. Chung, Surf. Rev. Lett., 2014, 21, 1–11 CrossRef.
- A. A. Silahua-Pavón, C. G. Espinosa-González, F. Ortiz-Chi, J. G. Pacheco-Sosa, H. Pérez-Vidal, J. C. Arévalo-Pérez, S. Godavarthi and J. G. Torres-Torres, Catal. Commun., 2019, 129, 105723 CrossRef.
- S. Bibi, S. S. Shah, F. Muhammad, M. Siddiq, L. Kiran, S. A. Aldossari, M. Sheikh Saleh Mushab and S. Sarwar, Chemosphere, 2023, 339, 139583 CrossRef CAS PubMed.
- J. K. Burdett, T. Hughbanks, G. J. Miller, J. V. Smith and J. W. Richardson, J. Am. Chem. Soc., 1987, 109, 3639–3646 CrossRef CAS.
- W. Fan, S. Jewell, Y. She and M. K. H. Leung, Phys. Chem. Chem. Phys., 2014, 16, 676–680 RSC.
- Y. Zhou, W. Lv, B. Zhu, F. Tong, J. Pan, J. Bai, Q. Zhou and H. Qin, ACS Sustainable Chem. Eng., 2019, 7, 5801–5807 CrossRef CAS.
- L. Ming, H. Yue, L. Xu and F. Chen, J. Mater. Chem. A, 2014, 2, 19145–19149 RSC.
- M. B. Nguyen, L. H. T. Nguyen, M. T. Le, N. Q. Tran, N. H. T. Tran, P. H. Tran, A. T. T. Pham, L. D. Tran and T. L. H. Doan, J. Ind. Eng. Chem., 2024, 134, 217–230 CrossRef CAS.
- S. Oktay, Z. Kahraman, M. Urgen and K. Kazmanli, Appl. Surf. Sci., 2015, 328, 255–261 CrossRef CAS.
- L. Zhu, Q. Lu, L. Lv, Y. Wang, Y. Hu, Z. Deng, Z. Lou, Y. Hou and F. Teng, RSC Adv., 2017, 7, 20084–20092 RSC.
- G. T. T. Pham, H. T. Vu, T. T. Pham, N. N. Thanh, V. N. Thuy, H. Q. Tran, H. V. Doan and M. B. Nguyen, RSC Adv., 2023, 13, 12402–12410 RSC.
- G. Qu, G. Fan, M. Zhou, X. Rong, T. Li, R. Zhang, J. Sun and D. Chen, ACS Omega, 2019, 4, 4221–4232 CrossRef CAS PubMed.
- M. Serhan, M. Sprowls, D. Jackemeyer, M. Long, I. D. Perez, W. Maret, N. Tao and E. Forzani, AIChE annual meeting, Conference Proceedings, 2019, pp. 1–3 Search PubMed.
- D. A. Tran, C. T. Nguyen Pham, T. Nguyen Ngoc, H. Nguyen Phi, Q. T. Hoai Ta, D. H. Truong, V. T. Nguyen, H. H. Luc, L. T. Nguyen, N. N. Dao, S. J. Kim and V. Vo, J. Phys. Chem. Solids, 2021, 151, 109900 CrossRef CAS.
- A. Kumar, S. K. Sharma, G. Sharma, C. Guo, D. V. N. Vo, J. Iqbal, M. Naushad and F. J. Stadler, J. Hazard. Mater., 2021, 402, 123790 CrossRef CAS PubMed.
- B. Bharti, S. Kumar, H. N. Lee and R. Kumar, Sci. Rep., 2016, 6, 1–12 CrossRef PubMed.
- H. Wang, X. Yuan, Y. Wu, G. Zeng, X. Chen, L. Leng and H. Li, Appl. Catal., B, 2015, 174–175, 445–454 CrossRef CAS.
- S. Gong, Z. Jiang and S. Zhu, J. Nanopart. Res., 2018, 20, 310–323 CrossRef.
- M. Moradi, F. Hasanvandian, A. A. Isari, F. Hayati, B. Kakavandi and S. R. Setayesh, Appl. Catal., B, 2021, 285, 119838 CrossRef CAS.
- R. Acharya and K. Parida, J. Environ. Chem. Eng., 2020, 8, 103896 CrossRef CAS.
- M. D. Donohue and G. L. Aranovich, Adv. Colloid Interface Sci., 1998, 76–77, 137–152 CrossRef CAS.
- Y. Qi, Y. Chen, R. Wang, L. Wang, F. Zhang, Q. Shen, P. Qu and D. Liu, Catal. Lett., 2021, 151, 1546–1555 CrossRef CAS.
- L. Shen, Z. Xing, J. Zou, Z. Li, X. Wu, Y. Zhang, Q. Zhu, S. Yang and W. Zhou, Sci. Rep., 2017, 7, 1–11 CrossRef PubMed.
- H. T. Vu, G. T. T. Pham, T. Le, H. Doan, T. Dai, N. T. Van, N. Van Manh, P. Thi, N. Duc, H. V Doan and B. Nguyen, J. Taiwan Inst. Chem. Eng., 2024, 161, 105518 CrossRef CAS.
- S. Pareek and J. K. Quamara, J. Mater. Sci., 2018, 53, 604–612 CrossRef CAS.
- Y. R. Girish, Udayabhanu, G. Alnaggar, A. Hezam, M. B. Nayan, G. Nagaraju and K. Byrappa, J. Sci.: Adv. Mater. Devices, 2022, 7, 100419 CAS.
- S. Xun, W. Zhu, Y. Chang, H. Li, M. Zhang, W. Jiang, D. Zheng, Y. Qin and H. Li, Chem. Eng. J., 2016, 288, 608–617 CrossRef CAS.
- S. Xun, W. Zhu, D. Zheng, L. Zhang, H. Liu, S. Yin, M. Zhang and H. Li, Fuel, 2014, 136, 358–365 CrossRef CAS.
- M. B. Nguyen, H. V Doan, D. Le, H. Tan and T. Dai, J. Environ. Chem. Eng., 2024, 12, 112965 CrossRef CAS.
- G. Li, Z. Lian, Z. Wan, Z. Liu, J. Qian, Y. Deng, S. Zhang and Q. Zhong, Chem. Eng. J., 2023, 451, 138625 CrossRef CAS.
- Y. Luo, C. Liu, J. Liu, X. Liu, Y. Zhou, X. Ou, B. Weng, J. Jiang and B. Han, Chem. Eng. J., 2024, 481, 148494 CrossRef CAS.
- H. Niu, H. Lv, L. Mao, Y. Cai, X. Zhao and F. Wu, J. Hazard. Mater., 2023, 459, 132267 CrossRef CAS PubMed.
- A. Kumar, S. Kumar, G. Sharma, M. Naushad and F. J. Stadler, J. Alloys Compd., 2020, 838, 155692 CrossRef CAS.
- Y. Song, A. Long, X. Ge, Z. Bao, M. Meng, S. Hu and Y. Gu, Chemosphere, 2023, 343, 140240 CrossRef CAS PubMed.
- D. Van Le, T. D. Nguyen, P. T. Dang, P. T. H. Yen and M. B. Nguyen, Appl. Surf. Sci., 2024, 655, 159588 CrossRef.
- S. Grimme, J. Antony, S. Ehrlich and H. Krieg, J. Chem. Phys., 2010, 132, 154104 CrossRef PubMed.
- K. Li, L. Luo, Y. Zhang, W. Li and Y. Hou, ACS Appl. Mater. Interfaces, 2018, 10, 41525–41534 CrossRef CAS PubMed.
- N. T. T. Ha, P. T. Be, P. T. Lan, N. T. Mo, L. M. Cam and N. N. Ha, RSC Adv., 2021, 11, 16351–16358 RSC.
- T. T. H. Nguyen, M. C. Le, Z. T. Jiang and N. H. Nguyen, Adsorption, 2020, 26, 1335–1344 CrossRef CAS.
- J. M. Soler, E. Artacho, J. D. Gale, A. García, J. Junquera, P. Ordejón and D. Sánchez-Portal, J. Phys.: Condens.Matter, 2002, 14, 2745–2779 CrossRef CAS.
- T. D. Kühne, M. Iannuzzi, M. Del Ben, V. V. Rybkin, P. Seewald, F. Stein, T. Laino, R. Z. Khaliullin, O. Schütt, F. Schiffmann, D. Golze, J. Wilhelm, S. Chulkov, M. H. Bani-Hashemian, V. Weber, U. Borštnik, M. Taillefumier, A. S. Jakobovits, A. Lazzaro, H. Pabst, T. Müller, R. Schade, M. Guidon, S. Andermatt, N. Holmberg, G. K. Schenter, A. Hehn, A. Bussy, F. Belleflamme, G. Tabacchi, A. Glöβ, M. Lass, I. Bethune, C. J. Mundy, C. Plessl, M. Watkins, J. VandeVondele, M. Krack and J. Hutter, J. Chem. Phys., 2020, 152, 194103 CrossRef PubMed.
- H. Gao, J. Jia, F. Guo, B. Li, D. Dai, X. Deng, X. Liu, C. Si and G. Liu, J. Photochem. Photobiol., A, 2018, 364, 328–335 CrossRef CAS.
- M. Y. Yan, Z. Y. Jiang, J. M. Zheng, Y. M. Lin and Z. Y. Zhang, Appl. Surf. Sci., 2020, 531, 147318 CrossRef CAS.
- Z. Li, Y. Mao, Y. Huang, D. Wei, M. Chen, Y. Huang, B. Jin, X. Luo and Z. Liang, Catal. Sci. Technol., 2022, 2804–2818 RSC.
Footnotes |
| † EDS spectrum and Mott–Schottky (MS) plot of ZnO, TiO2 and OCN samples, ESR spectra of 20%ZnO–TiO2/OCN, GC-MS spectra of the products in the desulfurization of DBT over 20%ZnO–TiO2/OCN photocatalyst. |
| ‡ Electronic supplementary information (ESI) available. See DOI: https://doi.org/10.1039/d4ra04357j |
| § The authors contributed equally to this work. |
| This journal is © The Royal Society of Chemistry 2024 |