 Open Access Article
Four cyclometalated Ir(III) complexes and insights into their luminescence, cytotoxicity and DNA/BSA binding performance†
Qianshui Yua,
Shunxin Gua,
Xinda Yangb,
Qin Jiang *a and
Pengfei Shi
 *a
*a
aSchool of Environmental and Chemical Engineering, Jiangsu OceanUniversity, Lianyungang, 222005, P. R. China. E-mail: jiangqin@jou.edu.cn; shipf@jou.edu.cn
bShanghai Key Laboratory of Chemical Assessment and Sustainability,School of Chemical Science and Engineering,Tongji University, Shanghai 200120, P. R. China
First published on 20th September 2024
Abstract
Four cyclometalated Ir(III) complexes based on 4′-p-N,N-bis(2-hydroxyethyl)benzyl-2,2′:6′,2′′-terpyridine (TPYOH) and 4′-p-N,N-bis(2-hydroxyethyl)benzyl-6′-benzyl-2,2′-bipyridine (PhbpyOH) were synthesized and characterized. All the Ir(III) complexes exhibited strong MLCT absorption peaks at about 450 nm, broad emission bands in the range of 500–700 nm. Z-scan results revealed that only complex Ir1A could exhibit certain two-photon absorption with maximal cross section values of 215 GM at 890 nm. When excited by 700–850 nm femtosecond laser, complex Ir1A gave a TPEF peak around 567 nm. All four complexes exhibited enhanced cell growth inhibitory activity against MCF-7 tumour cells under light irradiation comparing to their dark toxicity, with Ir1B showing the highest PI value (>50). The pathways and efficiencies of ROS generation by Ir(III) complexes varied, with Ir2A being more effective in producing 1O2 while Ir1A mainly generating O2˙−. The Ir(III) complexes undergo hydrogen bonding with DNA bases/phosphodiester through two O–H bonds on the bis(hydroxyethyl)amino group. The free pyridine-N atom in Ir1A forms additional hydrogen bond with DNA base, while the ligand TPYOH in Ir2A has better molecular planarity due to adopting {N, N, N} coordination mode, thus these two complexes show better DNA affinity. The complexes demonstrated weak interactions with BSA, through hydrogen bonding with amino acid residues at different regions of BSA molecule.
1. Introduction
Cyclometalated Ir(III) complexes have a broad range of applications in optoelectronics due to their tunable photophysical properties and chemical stability. Many cyclometalated Ir(III) served as efficient emitters in OLED and OSCs technology owing to their high phosphorescence quantum yields and large Stokes shifts, enabling them to emit green, red, or blue light with excellent color purity and long lifetime.1–4 Certain Ir(III) complexes show promise for applications requiring long-lasting afterglow effects, useful in displays and security markings.5,6 Cyclometalated Ir(III) complexes also show high cellular uptake efficiency, specific subcellular localization, characterized distribution and kinetics in biological tissue, facilitating them to serve as fluorescent markers in biological imaging,7,8 many of them were reported as fluorescent probes for intracellular signal molecules, such as H2S, O2, H2O2, etc9–13. Cyclometalated Ir(III) complexes exhibit lower dark cytotoxicity and higher phototoxicity, and some of which demonstrate good toxic activity against cisplatin resistant tumor cell lines. As results of their unique antitumor properties, cyclometalated Ir(III) complexes have been investigated for use as photosensitizers in photodynamic therapy, where they can generate reactive oxygen species upon light absorption, potentially targeting cancer cells.14–18{N, C} coordination mode was adopted for most published cyclometalated Ir(III) complexes, and commonly used {N, C} ligands are derivatives based on phenylpyridine or benzo[h]quinoline.8,10 Since the saturation coordination number required by Ir(III) core is six, bipyridine, terpyridine or ortho phenanthroline derivatives are often used as auxiliary ligands.19 Cyclometalated Ir(III) complexes featuring three identical {N, C} ligands are relatively rare, researchers typically opt to employ either one or two {N, C} ligands in the synthesis of Ir(III) complexes. Given the excellent coordination ability of 2,2′-bipyridine and 2,2′:6′,2′′-terpyridine, and the majority of bipyridine/terpyridine metal complexes exhibit distinctive optical properties, herein 4′-p-N,N-bis(2-hydroxyethyl)benzyl-2,2′:6′,2′′-terpyridine and 4′-p-N,N-bis(2-hydroxyethyl)benzyl-6′-benzyl-2,2′-bipyridine were chosen as the auxiliary ligands. The introduction of N,N-bis(2-hydroxyethyl)amino group is to increase water solubility and biocompatibility of the Ir(III) complexes.20 Given the prominent structural differences between Ir(III) complexes with two {N, C} ligands and those with only one {N, C} ligand, the impact on their luminescence performance and biological activity are investigated, and the structure–property relationship is further discussed in this paper.
2. Experimental section
2.1 Materials and apparatus
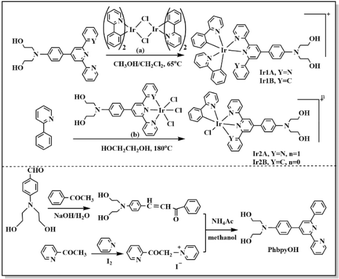
All the reagents were obtained commercially and used as supplied. The chemical structures of the Ir(III) complexes are described in Scheme 1. The 1H NMR data were obtained with a 500 MHz Bruker DMX spectrometer. The ESI-MS data were gained using an Agilent 1290-6545 LC/MS system. Elemental analysis was acquired with a Heraeus CHN–O Rapid analytical instrument. UV-vis spectra were recorded on a PerkinElmer LAMBDA®365 spectrophotometer. Fluorescence spectra were obtained using a Hitachi F-7000 spectrofluorimeter. The emission lifetime and quantum yield were measured on HORIBA FLUOROLOG-3-11.2.2 Synthetic section
The ligand 4′-p-N,N-bis(2-hydroxyethyl)benzyl-2,2′:6′,2′′-terpyridine (TPYOH)21 and compound [IrIII(phpy)2Cl]2 (ref. 22) were synthesized according to the reported procedures.A solution of 1.68 g acetophenone, 2.9 g 4-N,N-bis(2-hydroxyethyl)aminobenzaldehyde, 2.24 g NaOH and 20 mL H2O was stirred at 30 °C for 12 h, then the mixture was extracted using 50 mL CH2Cl2. The organic phase was dried on anhydrous magnesium sulfate overnight. The organic solvent was removed and red oil remained. Yield: 45%.
2.2 g red oil, 2.3 g grey solid and 3.27 g NH4Ac were dissolved in 100 mL methanol and refluxed for 24 h, the mixture was cooled to 20 °C and then extracted using ethyl acetate. The organic phase was dried on anhydrous magnesium sulfate. The organic solvent was removed and brown oil remained. Further purification was performed on silica gel column using ethyl acetate![[thin space (1/6-em)]](https://www.rsc.org/images/entities/char_2009.gif) :
:![[thin space (1/6-em)]](https://www.rsc.org/images/entities/char_2009.gif) petroleum ether = 4
petroleum ether = 4![[thin space (1/6-em)]](https://www.rsc.org/images/entities/char_2009.gif) :
:![[thin space (1/6-em)]](https://www.rsc.org/images/entities/char_2009.gif) 1 as the elution to get PhbpyOH as yellow powder. Total yield was 25%. 1H NMR (CDCl3, 500 MHz) δ (ppm) = 8.70 (t, 1H), 8.67 (d, 1H), 8.57 (d, 1H), 8.20 (d,2H), 7.93 (d, 1H), 7.88 (td, 1H), 7.74 (d, 2H), 7.47 (t, 1H), 7.38–7.31 (m, 1H), 6.77 (d, 2H), 4.17–3.96 (m, 2H), 3.88 (t, 4H), 3.64 (t, 4H). ESI-MS (+p): m/z = 411.1942 could be assigned as [PhbpyOH]+ (calc. m/z = 411.1947). Elemental analysis for C26H25N3O2: calc.: C, 75.89; H, 6.12; N,10.21; found: C, 75.76; H, 6.02; N, 10.39.
1 as the elution to get PhbpyOH as yellow powder. Total yield was 25%. 1H NMR (CDCl3, 500 MHz) δ (ppm) = 8.70 (t, 1H), 8.67 (d, 1H), 8.57 (d, 1H), 8.20 (d,2H), 7.93 (d, 1H), 7.88 (td, 1H), 7.74 (d, 2H), 7.47 (t, 1H), 7.38–7.31 (m, 1H), 6.77 (d, 2H), 4.17–3.96 (m, 2H), 3.88 (t, 4H), 3.64 (t, 4H). ESI-MS (+p): m/z = 411.1942 could be assigned as [PhbpyOH]+ (calc. m/z = 411.1947). Elemental analysis for C26H25N3O2: calc.: C, 75.89; H, 6.12; N,10.21; found: C, 75.76; H, 6.02; N, 10.39.
![[thin space (1/6-em)]](https://www.rsc.org/images/entities/char_2009.gif) :
:![[thin space (1/6-em)]](https://www.rsc.org/images/entities/char_2009.gif) v = 1
v = 1![[thin space (1/6-em)]](https://www.rsc.org/images/entities/char_2009.gif) :
:![[thin space (1/6-em)]](https://www.rsc.org/images/entities/char_2009.gif) 1) in 50 mL Schlenk tube filled with nitrogen. The mixture was refluxed at 65 °C for 4 h in dark. The organic solvent was removed under vacuum and orange solid obtained. The solid was dissolved in 30 mL hot water and then 150 mg NH4PF6 was added. The mixture was stirred for 30 min and then red precipitate was collected by centrifugal filtration. The solid was washed successively with H2O (3 × 20 mL), ethanol (3 × 10 mL) and diethyl ether(10 mL). 166 mg orange-red powder was dried in vacuum. Yield: 78%. 1H NMR (d6-acetone, 500 MHz) δ (ppm) = 9.17 (s, 1H), 9.08 (d, 1H), 9.01 (d, 1H), 8.32 (td, 1H), 8.25 (d, 1H), 8.18 (d, 1H), 8.09 (d, 1H), 8.03–7.94 (m, 3H), 7.94–7.86 (m, 2H), 7.78 (dd, 2H), 7.75 (d, 1H), 7.66–7.58 (m, 1H), 7.48 (d, 1H), 7.34–7.28 (m, 1H), 7.27–7.20 (m, 1H), 7.08 (ddd, 1H), 7.03–6.97 (m, 1H), 6.97–6.90 (m, 2H), 6.80 (d, 1H), 6.74 (td, 1H), 6.62–6.56 (m, 1H), 6.29 (td, 1H), 5.95 (d, J = 7.6 Hz, 1H), 5.51 (d, 1H), 4.19 (t, 2H), 3.85–3.77 (m, 3H), 3.68 (t, 3H). ESI-MS (+p): m/z = 913.2846 could be assigned as [Ir(ppy)2(TPYOH)]+ (calc. m/z = 913.2842). Elemental analysis for C47H40IrN6O2PF6: calc.: C, 53.35; H, 3.81; N, 7.94; found: C, 53.56; H, 3.62; N, 7.79.
1) in 50 mL Schlenk tube filled with nitrogen. The mixture was refluxed at 65 °C for 4 h in dark. The organic solvent was removed under vacuum and orange solid obtained. The solid was dissolved in 30 mL hot water and then 150 mg NH4PF6 was added. The mixture was stirred for 30 min and then red precipitate was collected by centrifugal filtration. The solid was washed successively with H2O (3 × 20 mL), ethanol (3 × 10 mL) and diethyl ether(10 mL). 166 mg orange-red powder was dried in vacuum. Yield: 78%. 1H NMR (d6-acetone, 500 MHz) δ (ppm) = 9.17 (s, 1H), 9.08 (d, 1H), 9.01 (d, 1H), 8.32 (td, 1H), 8.25 (d, 1H), 8.18 (d, 1H), 8.09 (d, 1H), 8.03–7.94 (m, 3H), 7.94–7.86 (m, 2H), 7.78 (dd, 2H), 7.75 (d, 1H), 7.66–7.58 (m, 1H), 7.48 (d, 1H), 7.34–7.28 (m, 1H), 7.27–7.20 (m, 1H), 7.08 (ddd, 1H), 7.03–6.97 (m, 1H), 6.97–6.90 (m, 2H), 6.80 (d, 1H), 6.74 (td, 1H), 6.62–6.56 (m, 1H), 6.29 (td, 1H), 5.95 (d, J = 7.6 Hz, 1H), 5.51 (d, 1H), 4.19 (t, 2H), 3.85–3.77 (m, 3H), 3.68 (t, 3H). ESI-MS (+p): m/z = 913.2846 could be assigned as [Ir(ppy)2(TPYOH)]+ (calc. m/z = 913.2842). Elemental analysis for C47H40IrN6O2PF6: calc.: C, 53.35; H, 3.81; N, 7.94; found: C, 53.56; H, 3.62; N, 7.79.71 mg red solid and 20 mg 2-phenylpyridine was dissolved in 20 mL ethylene glycol and refluxed in dark at 200 °C for 16 h. After cooling to room temperature, 80 mg NH4PF6 was added into the orange solution. The mixture was stirred for 30 min and then red precipitate was collected by centrifugal filtration. The solid was first washed with 20 H2O and then put into 15 mL ethanol. After the insoluble solid was filtered out, 30 mL diethyl ether was added into the ethanol solution and orange-red solid could be dispersed out. 72.4 mg orange-red powder was dried in vacuum. Yield: 76%. 1H NMR (500 MHz, d6-DMSO) δ(ppm) 9.80 (d, J = 5.3 Hz, 1H), 9.00 (d, J = 9.5 Hz, 2H), 8.84 (t, J = 12.1 Hz, 2H), 8.39 (d, J = 8.2 Hz, 1H), 8.20–8.15 (m, 1H), 8.09 (dd, J = 7.8, 4.7 Hz, 4H), 7.83 (t, J = 8.8 Hz, 1H), 7.71 (t, J = 6.6 Hz, 1H), 7.57 (d, J = 5.3 Hz, 2H), 7.47–7.38 (m, 2H), 6.87 (d, J = 9.0 Hz, 2H), 6.82 (t, J = 7.4 Hz, 1H), 6.67 (t, J = 7.4 Hz, 1H), 5.99 (d, J = 7.6 Hz, 1H), 4.81 (dd, J = 16.6, 11.6 Hz, 2H), 3.61–3.46 (m, 8H). ESI-MS (+p): m/z = 794.1867 could be assigned as [Ir(ppy)(TPYOH)Cl]+ (calc. m/z = 794.1874). Elemental analysis for C36H32ClF6IrN5O2P: calc.: C, 46.03; H, 3.43; N, 7.46; found: C, 46.16; H, 3.52; N, 7.58.
315 mg yellow solid and 90.8 mg 2-phenylpyridine was dissolved in 50 mL ethylene glycol and refluxed in dark at 200 °C for 16 h. The solvent was removed under vacuum and the residue was poured into 20 mL H2O, then yellow-brown precipitate was collected by centrifugal filtration. The solid was first washed with 20 mL H2O and then put into 100 mL ethanol. After the insoluble solid was filtered out, 30 mL diethyl ether was added into the ethanol solution and red solid could be dispersed out. The solid was further purified on silica column chromatography using dichloromethane: methanol: (v![[thin space (1/6-em)]](https://www.rsc.org/images/entities/char_2009.gif) :
:![[thin space (1/6-em)]](https://www.rsc.org/images/entities/char_2009.gif) v = 1
v = 1![[thin space (1/6-em)]](https://www.rsc.org/images/entities/char_2009.gif) :
:![[thin space (1/6-em)]](https://www.rsc.org/images/entities/char_2009.gif) 3) as the eluent solution. 172.6 mg yellow powder was obtained and dried in vacuum. Yield: 49%. 1H NMR (500 MHz, d6-DMSO) δ(ppm) 9.71 (d, J = 5.8 Hz, 1H), 9.16 (d, J = 5.7 Hz, 1H), 9.07 (d, J = 8.3 Hz, 1H), 8.84 (s, 1H), 8.34 (t, J = 8.0 Hz, 1H), 7.93 (t, J = 11.5 Hz, 2H), 7.81 (t, J = 6.8 Hz, 1H), 7.55 (dd, J = 13.3, 7.8 Hz, 2H), 7.49 (t, J = 7.8 Hz, 1H), 7.23 (s, 1H), 7.08 (t, J = 6.5 Hz, 1H), 6.82 (ddt, J = 23.1, 14.8, 7.6 Hz, 5H), 6.54 (d, J = 7.7 Hz, 1H), 6.48 (d, J = 7.7 Hz, 1H), 6.14 (d, J = 7.5 Hz, 1H), 4.82 (t, J = 4.6 Hz, 2H), 3.64–3.47 (m, 8H). ESI-MS (+p): m/z = 792.1869 could be assigned as [Ir(ppy)Cl(PhbpyOH)]+ (calc. m/z = 792.1843). Elemental analysis for C37H32IrN4O2Cl: calc.: C, 56.09; H, 4.07; N, 7.07; found: C, 56.21; H, 4.22; N, 7.16.
3) as the eluent solution. 172.6 mg yellow powder was obtained and dried in vacuum. Yield: 49%. 1H NMR (500 MHz, d6-DMSO) δ(ppm) 9.71 (d, J = 5.8 Hz, 1H), 9.16 (d, J = 5.7 Hz, 1H), 9.07 (d, J = 8.3 Hz, 1H), 8.84 (s, 1H), 8.34 (t, J = 8.0 Hz, 1H), 7.93 (t, J = 11.5 Hz, 2H), 7.81 (t, J = 6.8 Hz, 1H), 7.55 (dd, J = 13.3, 7.8 Hz, 2H), 7.49 (t, J = 7.8 Hz, 1H), 7.23 (s, 1H), 7.08 (t, J = 6.5 Hz, 1H), 6.82 (ddt, J = 23.1, 14.8, 7.6 Hz, 5H), 6.54 (d, J = 7.7 Hz, 1H), 6.48 (d, J = 7.7 Hz, 1H), 6.14 (d, J = 7.5 Hz, 1H), 4.82 (t, J = 4.6 Hz, 2H), 3.64–3.47 (m, 8H). ESI-MS (+p): m/z = 792.1869 could be assigned as [Ir(ppy)Cl(PhbpyOH)]+ (calc. m/z = 792.1843). Elemental analysis for C37H32IrN4O2Cl: calc.: C, 56.09; H, 4.07; N, 7.07; found: C, 56.21; H, 4.22; N, 7.16.
2.3 Geometric structures optimization
DFT calculations were performed using the Gaussian09 (ref. 23) program package with the B3LYP functional and the 6-31g(d) (ligand atoms)/LANL2DZ (Ir atom) mixed basis set. The geometries of the Ir(III) complexes were optimized in the gas phase using their molecular structure formula as starting points.2.4 Molecular docking
The interaction between the Ir(III) complex and DNA (or BSA) was studied by the molecular docking program Autodock Vina24 plugin PyMOL. The molecular structures of DNA (PDB ID 1BNA) and BSA (PDB ID 4f5sBSA) were obtained from RCSB Protein Data Bank (https://www.rcsb.org/pdb). All water molecules were removed. The geometries of the four Ir(III) complexes were optimized using Gaussian DFT calculation results, and their counter anions were omitted and then converted to PDB format files using Mercury software during molecular docking calculation study, the grid box size of DNA-Ir(III)/BSA-Ir(III) complex system, the grid spacing, the GA population size and the maximum number of energy evaluation were set as shown in Table S1.† Others used were default parameters. Pymol software was selected to analyze the predicted binding mode with the lowest binding free energy.2.5 Cytotoxicity assay
The cytotoxicity of Ir(III) complex was determined using the MTT assay.25 The cells were seeded in a 96-well plate at a density of 5000 cells per well and incubated with 100 μL culture medium containing a series of doses of the Ir(III) complex at 37 °C for 48 h. After the incubation, the culture medium in each well was removed and the cells were washed three times with PBS. 20 μL of MTT solution (5 mg mL−1) was added to each well and cultured for another 2 h. The supernatant was discarded and then 100 μL of DMSO was added to each well. The values of the plate were observed on a microplate reader at 570 nm (Safire, Tecan). The results were expressed as the viable percentage of cells after various treatments relative to the control cells without any treatment. The cell viability (%) was calculated according to the following equation:| cell viability% = OD570(sample)/OD570(control) × 100, |
2.6 Z-scan and TPEF experiment
The two-photon excited fluorescence (TPEF) spectra were measured using a mode-locked Ti:sapphire laser (Coherent Mira900F) as the pump source with a pulse duration of 200 fs, a repetition rate of 76 MHz, and a single-scan streak camera (Hamamastu Model C5680-01) together with a monochromator as the recorder. The Ir(III) complex was dissolved in DMSO with a concentration of 1.0 × 10⁻³ mol L−1.The two-photon absorption cross section δ2 was determined on the open-aperture Z-scan setup. All the optical studies were done using a femtosecond laser with pulse duration of 140 fs and 80 MHz repetition rate. The thermal heating of the Ir(III) complex by high repetition rate laser pulse was removed by the use of a mechanical chopper running at 1 kHz. The nonlinear absorption component was evaluated under an open aperture. The measured experimental data were fitted according to eqn (1) to obtain the value of the two-photon absorption coefficient (β). Furthermore, δ2 could be determined by eqn (4).
 | (1) |
| q(z) = βI0Leff/(1 + z2/z20) | (2) |
| Leff = (1 − e−αL)/α | (3) |
| δ2 = hβγ/NAC × 10−3 | (4) |
3. Results and discussion
3.1 Synthesis and characterization
Ir1A and Ir1B were obtained conveniently, since bridging Ir–Cl bonds in [IrIII(phpy)2Cl]2 (Scheme 1 (a)) were relatively weak and can be broken under mild heating condition and subsequently coordinated by TPYOH or PhbpyOH. When three chloride anions act as auxiliary ligands in the Ir(III) coordinating precursor (Scheme 1 (b)), the resulted Ir–Cl bonds are very stable and hard to be cleaved by 2-phenylpyridine, so that the synthetic reactions for Ir2A and Ir2B were performed successfully in refluxed ethylene glycol solution for 16 h.The molecular structures of the complexes were optimized for energy minimization using the Gaussian09 software package, shown in Fig. S10.† The dihedral angles between the central pyridine ring and the adjacent pyridine or benzene ring changed significantly before and after coordination. The maximum angle in free ligand TPYOH and PhbpyOH is 14.48° and 24.63°, respectively. The coplanarity of the above ligands in Ir1A and Ir1B got worse due to the steric hindrance effect of the Ir(III) coordination cores, with the angels increases to be 49.33°and 65.37°, respectively. For complexes Ir2a and Ir2B, the 2,2′:6′,2′′-terpyridine and 6′-phenyl-2,2′-bipyridine groups are almost coplanar due to complete participation in coordination.
3.2 Absorption and emission properties
Two well-resolved bands in the range of 250–350 nm are observed for TPYOH (shown in Fig. 1), which can be attributed to the n → π* transition from the terminal bis (hydroxyethyl) amine group to the 4′-benzene ring, as well as the π → π* transition between terpyridine conjugated systems. PhbpyOH exhibits three absorption bands in the range of 250–400 nm, namely the n → π* transition from the terminal bis (hydroxyethyl) amine group to the 4′- benzene ring, the π → π* transition from the central pyridine ring to the adjacent pyridine ring and benzene ring, respectively. After coordinating with Ir(III), the strong and broad band with a peak appeared at about 450 nm can be attributed to the MLCT absorption for all the four Ir(III) complexes.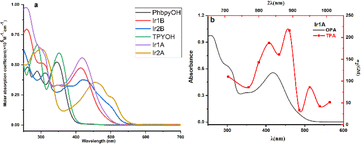 | ||
| Fig. 1 (a) UV-vis spectra of the ligands and four Ir(III) complexes; (b) OPA and TPA spectra of Ir1A. | ||
The coordination environment of the Ir(III) complex has a profound impact on its absorption spectrum. Although Ir1A and Ir2A sharing the same ligand TPYOH, there is a significant difference in the wavelength (416 nm and 455 nm, respectively) and molar absorption coefficient (55![[thin space (1/6-em)]](https://www.rsc.org/images/entities/char_2009.gif) 700 M−1 cm−1 and 35
700 M−1 cm−1 and 35![[thin space (1/6-em)]](https://www.rsc.org/images/entities/char_2009.gif) 500 M−1 cm−1, respectively) of their MLCT peaks. The terpyridine group in Ir2A was totally involved in coordination through {N, N, N} modes, resulting in better planarity and larger conjugated systems, therefore, the MLCT absorption peak shows a significant red shift relative to Ir1A. Comparing the absorption spectra of Ir2A and Ir2B, the same phenomenon can also be observed. Although the main ligands in Ir1A and Ir1B are different in structures (TPYOH and PhbpyOH), their MLCT band peaks are very close (416 nm and 415 nm, respectively) since they both adopted {N, N} bidentate coordination mode.
500 M−1 cm−1, respectively) of their MLCT peaks. The terpyridine group in Ir2A was totally involved in coordination through {N, N, N} modes, resulting in better planarity and larger conjugated systems, therefore, the MLCT absorption peak shows a significant red shift relative to Ir1A. Comparing the absorption spectra of Ir2A and Ir2B, the same phenomenon can also be observed. Although the main ligands in Ir1A and Ir1B are different in structures (TPYOH and PhbpyOH), their MLCT band peaks are very close (416 nm and 415 nm, respectively) since they both adopted {N, N} bidentate coordination mode.
Iridium complexes are well known for their outstanding nonlinear optical properties,26 two-photon absorption (TPA) cross-sections (δ2) were measured in the range of 710 to 1010 nm for the four Ir(III) complexes. Complex Ir1A possesses the most intense TPA features with a peak value of 215 GM at 890 nm (Fig. S12†). As shown in Fig. 1b, TPA band looks qualitatively consistent with OPA band in the range of 350–500 nm, indicating that the two-photon absorptions above 750 nm are possibly due to MLCT transitions. Compared to twice the OPA wavelength, the TPA peak shows a substantial redshift. Moreover, the two-photon absorption spectrum exhibits two absorption peaks in the range of 750–950 nm, indicating that there is a certain difference between the TPA process and the OPA process. The other three Ir(III) complexes didn't exhibit certain TPA effect under our testing setup and conditions, properly because the relative importance of transitions in a one-photon spectrum is often not carried over to multiphoton spectra.
The fluorescence spectra of the ligands and their Ir(III) complexes displayed strong broad emission bands (Fig. 2a). The highly efficient emission of Ir(III) complexes is due to the strong spin orbit coupling which is caused by the 5d orbitals of Ir(III) ion that leads to the intersystem crossing of the singlet to triplet excited states. Conversion of singlet to triplet excited states allows radiative relaxation of excited states, thus high phosphorescence emission can be readily achieved. The trends of redshifted emissions were consistent with the absorption features: when compared with the emission spectra of TPYOH and PhbpyOH in H2O, Ir1A, Ir2A, Ir1B and Ir2B showed a redshift of 86 nm, 47 nm, 81 nm, 96 nm, respectively. The effect of solvent on the emission spectra was further examined and the recorded fluorescence spectra clearly displayed positive solvatochromism (Fig. S11†), indicating the polar excited states of the polypyridine ligands and Ir(III) complexes. This result also indicated that the emission is a CT transition in nature.27 The fluorescence lifetime of all the four complexes are around 3 ns. Photoluminescent quantum yield of Ir1A, Ir2A, Ir1B and Ir2B are 0.64, 0.80, 0.54 and 0.90, respectively, shown in Table S7.†
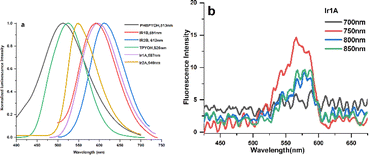 | ||
| Fig. 2 (a) OPEF spectra of the ligands and four Ir(III) complexes in H2O solution; (b) TPEF spectra of Ir1A in DMSO solution excited by different wavelength laser. | ||
TPYOH and complexes Ir1A exhibit two-photon excited fluorescence (TPEF) under 750 nm femtosecond laser excitation, as shown in Fig. 2b. No TPEF signals were found for PhbpyOH, Ir2A, Ir1B and Ir2B. Under the same testing conditions, the TPEF band of Ir1A in DMSO solution shows a peak redshift of about 40–50 nm compared to free ligand TPYOH, but the luminescence intensity is significantly weaker than that of TPYOH. The maximum TPEF emission wavelength of ligand TPYOH in DMSO is at 528 nm, which is about 10 nm red shifted compared to its one-photon excited fluorescence (OPEF). This is mainly due to the sample concentration being much higher than OPEF (about 100 times) during TPEF measurement, resulting in the reabsorption of fluorescence. The TPEF peaks of complexes Ir1A is located at 567 nm, with blue shifts of 35 nm relative to the OPEF band, indicating that single photon excitation and two-photon excitation have different excited state energy levels and structures. TPEF originates from higher level singlet excited state 1MLCT, while OPEF originates from lower level triplet excited state 3MLCT.
3.3 Cytotoxicity analysis
Herein, the MTT method was used to preliminarily evaluate the in vitro cytotoxicity of Ir(III) complex on selected cell lines. After 48 h of incubation with the Ir(III) complexes, MCF-7 cells still maintained high cell survival rates (∼80%) in spite that the concentration of Ir(III) complexes were up to 32 μM, indicating poor cell growth inhibitory activity of these Ir(III) complexes under dark.Under light irradiation (enon lamp, 400–700 nm, 150 mW cm−2, 5 min) the cell viability decreased markedly with increasing concentration of four Ir(III) complex, indicating the potential photocytotoxicity of Ir1A–Ir2B. For instance, the IC50 value for Ir1B in the dark was 1.03 μM, while the IC50 was improved to be 0.02 μM (PI > 50) under light (Fig. 3).
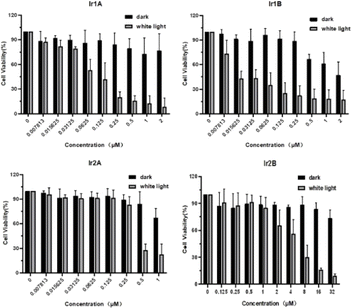 | ||
| Fig. 3 Cytotoxic activity in dark and under light of four Ir(III) complexes against MCF-7 cells analyzed by the MTT assay. | ||
3.4 ROS generation
PDT utilizes light of a specific wavelength to excite a photosensitizer molecule to its triplet excited state and leading to the production of cytotoxic ROS species, which are powerful oxidants that can damage biomolecules such as lipids, proteins and nucleic acids, making PDT a successful treatment for superficial cancers. ROS species can be produced by type I (i.e. O2˙− and H2O2 and ˙OH) or type II (i.e.1O2) photochemical reactions.28,29Most of the clinical applications relating to PDT are based on type II PDT. Cyclometalated Ir(III) complexes exhibit high fluorescence quantum efficiency and triplet excited-state lifetimes, which facilitate electron transfer with oxygen, resulting in 1O2 generation quantum yield.30–32 To evaluate the 1O2 generation efficiency of four Ir(III) complexes, extracellular tests using 9,10-anthracenediyl-bis(methylene) dimalonic acid (ABDA) or 1,3-diphenylisobenzo-furan (DPBF) as 1O2 indicator were conducted (Fig. S14†). The air-saturated aqueous solutions of Ir(III) complex and 1O2 indicator were irradiated each with a solar simulator for a total of 100 s, and the variation of the absorbance for ABDA was monitored at 390 nm (410 nm for DPBF) every 10 s during the course of the experiment, Ru(bpy)3Cl2 was using as reference (ΦΔ = 0.56). Inspection of the plot revealed that in the presence of light irradiation from a xenon lamp (400–700 nm, 18.5 mW cm−2), Ir(III) complexes can produce 1O2 with low yield, among which Ir2A showed the largest 1O2 generation of 0.22.
To clarify whether the complexes can generate ROS through type I, DHR 123 is used as an indicator of intracellular superoxide anion free-radical (O2˙−) formation. Nonfluorescent DHR 123 is oxidized by O2˙− to the highly emissive product rhodaminein in vitro, which can be monitored by fluorescence spectroscopy using excitation and emission wavelengths of 500 and 536 nm, respectively. It can be clearly observed from Fig. S13† that all four Ir(III) complexes can also generate O2˙− under experimental conditions, and the comparison shows that Ir1A has the highest efficiency.
3.5 Interactions with DNA and BSA
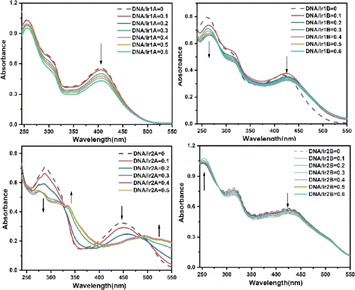
The antitumor activities of Ir(III) complexes are relevant to their intercalating into DNA base pairs to a certain extent.33 The interactions between the complex and calf thymus DNA were further investigated by UV-vis, and the absorption spectra of the complex in the absence and presence of DNA at various concentrations are given in Fig. 4.All the four MLCT bands showed hypochromic effects with the increasing ratio of [DNA]/[complex], as shown in Table S2.† Since the extremity hydroxyl groups have been proved to influence dramatically on the DNA binding efficiency through hydrogen bonding, the four Ir(III) complexes are suggested to interact with DNA mainly through H-bond between the N,N-(2-hydroxyethyl)amino group and the DNA base pairs. The coordination environments of complexes Ir1A and Ir1B are similar and both form monovalent coordination cations, however, their intensity decrease in MLCT band after incubation with DNA are differed in striking ways, which may be related to the free pyridine-N atom in complex Ir1A further forming hydrogen bond with DNA helix. The difference in DNA binding performance between Ir2A and Ir2B may be due to the fact that Ir2A is a positively monovalent cation, and the additional electrostatic attraction increases its binding to DNA compared to neutral Ir2B. It should be noted that the hypochromism in the MLCT band of Ir2A is about twice that of Ir1A, indicating better DNA affinity of Ir2A. The ligand TPYOH in Ir1A requires only bidentate coordination mode and remains one freely rotating pyridine group, while tridentate mode is adopted for Ir2A, resulting in better molecular planarity of Ir2A. Since planar molecules are more conducive to embedding into DNA double helix, there are two isosbestic points located at 324 nm and 486 nm, indicting at least three binding adducts are formed during the intercalating of Ir2A into DNA helix.
Dock molecular modeling method is confirmed to be an important technology to explore the binding site and binding energy of small molecules with bio-macromolecules.23 From the Autodock simulation results (Fig. 5), we can find that the Ir(III) complexes are located in the minor groove of the double-stranded helical DNA. All complexes indeed undergo hydrogen bonding with DNA bases or phosphodiester through two O–H bonds on the bis(hydroxyethyl)amino group. The bond length of these hydrogen bonds are shown in Table S1.† The pyridine nitrogen atom that did not participate in coordination in complex Ir1A forms a strong interaction with DA-17, with a hydrogen bond length of 2.0 Å. However, this additional hydrogen bond was not observed in Ir1B. Due to positively monovalent, enhanced molecular planarity and reduced spatial hindrance, the coordination part of Ir2A was allowed to enter deep into minor grooves of DNA. As for neutral Ir2B, it binds just the periphery of the DNA strand by tailing bishydroxyethyl group through hydrogen bonding.
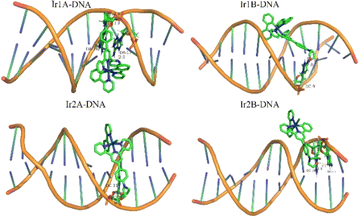 | ||
| Fig. 5 Theoretical simulation of the interaction mode between the Ir(III) complex with double helical DNA. | ||
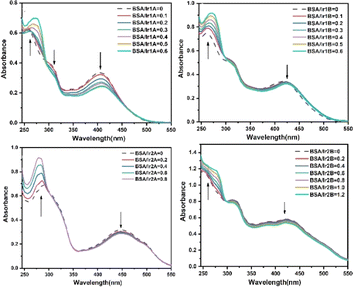
Serum albumin is the most abundant membrane transport protein in plasma, which can combine with most endogenous and exogenous compounds entering the blood, thus playing the role of storage and transport in vivo. Studying the interaction between Ir(III) complex and serum albumin helps to understand the transport and distribution of complex in vivo, and is of great significance for elucidating the antitumor mechanism of Ir(III) complex. The interactions between the complex and bovine serum albumin (BSA) were investigated by UV-vis, and the absorption spectra of the complex in the absence and presence of BSA are given in Fig. 6. Noteworthy hyperchromism at 275 nm is found when BSA added, which is attributed to the characteristic absorption of tryptophan and tyrosine in BSA molecule. Unlike the remarkable influence of DNA on the absorption spectra of Ir(III) complexes, the hypochromism on their MLCT band were no more 10% except Ir1A, suggesting weak interaction between BSA and those three complexes. Nonetheless, there appeared one isosbestic point at 293–303 nm, indicating stable adducts can be produced during the interaction. For complex Ir1a that showing the largest MLCT hypochromism, Ir1a-BSA adduct is formed when it is aggregated onto BSA via multiple interaction modes, including the hydrogen bonding between amino acid residues and the extremity hydroxyl groups or uncoordinated pyridine N-atom, electrostatic forces, etc.
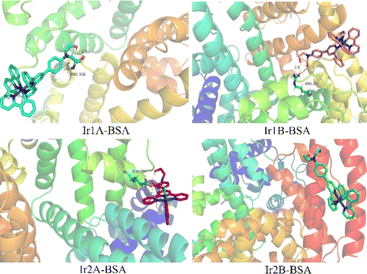
The molecular docking results showed that all four complexes had certain interactions with BSA. Due to the different molecular structures, the four complexes are matched with different subunits of BSA. The hydroxyethyl groups on the cationic complexes Ir1A, Ir1B, and Ir2A interact with amino acid residues, such as PRO338, ARG217, and GLU28 through hydrogen bonding, respectively (Fig. 7, S15†). Neutral Ir2B did not exhibit hydrogen bonding, possibly it can only be combined with BSA through van der Waals forces.
4. Conclusions
Four cyclometalated Ir(III) complexes based on polypyridine ligands (TPYOH and PhbpyOH) were synthesized, the impacts of structural differences on their absorption and emission spectra, cytotoxicity and interactions with biomolecules were studied. Ir2A exhibited the most noteworthy redshift effect of its absorption and emission spectra, in which the main ligand TPYOH adopted {N, N, N} coordination mode. When TPYOH coordinated with {N, N} mode and two phenylpyridine served as auxiliary ligands, complex Ir1A could even exhibit certain two-photon absorption and luminescence effects. All the four complexes exhibited enhanced cell growth inhibitory activity against MCF-7 tumour cells under light stimulation than their dark toxicity, with Ir1B (PhbpyOH as the main ligand) exhibiting the highest PI value (>50). The ROS generation results show that Ir2A has the highest quantum yield of 1O2, while Ir1A is more effective in producing O2˙−. UV-vis titration experiments indicated that complex Ir2A exhibiting the highest DNA binding activity and Ir1A showing better BSA binding activity. Autodok results demonstrated that the planarity of the main ligand and the cationic state of the Ir(III) coordination core have a significant impact on their interactions with DNA and BSA. Since Ir1B showed weak affinity to DNA and BSA, its antitumor activity of Ir1B may be related to targets outside of DNA or BSA, which requires further cell imaging research to clarify. Further studies are required to outline a clearer structure–activity relationship for development of Ir(III) complexes that synergistically enhance optical and biological activity.Data availability
All relevant data are within the manuscript and its ESI.†Author contributions
The manuscript was written through contributions of all authors. All authors have given approval to the final version of the manuscript.Conflicts of interest
The authors declare no competing financial interest.Acknowledgements
We thank the Priority Academic Program Development of Jiangsu Higher Education Institutions (PAPD), the key science and technology project from the Lianyungang city (CGJBGS2303) for financial supports.Notes and references
- H. T. Mao, G. F. Li, G. G. Shan, X. L. Wang and Z. M. Su, Coord. Chem. Rev., 2020, 413, 213283 CrossRef CAS.
- H. Y. Park, S. Ameen, R. Kumaresan, J. Lee, J. Park, D. Song, J. Lee, Y. Heo, B. Kim and S. H. Jin, Adv. Opt. Mater., 2023, 11, 2202641 CrossRef CAS.
- X. L. Yang, S. P. Xu, Y. Zhang, C. Y. Zhu, L. S. Cui, G. J. Zhou, Z. Chen and Y. H. Sun, Angew. Chem., Int. Ed., 2023, 62, e202309739 CrossRef CAS PubMed.
- D. Q. You, T. J. Yang, Y. T. Tao, J. S. Wang, J. Wang, A. H. Zhou and Y. T. Tao, J. Mater. Chem. C, 2024, 12, 2730–2737 RSC.
- Z. Jiang, Q. Zhang, Z. Y. Kong, R. J. Qiao, Z. C. Liu, L. Z. Song, S. Q. Zhu, R. Liu and H. J. Zhu, Dyes Pigm., 2024, 222, 111837 CrossRef CAS.
- L. Di, Y. Xing, Z. X. Yang and Z. Q. Xia, Sens. Actuators, B, 2022, 350, 130894 CrossRef CAS.
- S. Shaikh, Y. H. Wang, F. Rehman, H. Jiang and X. M. Wang, Coord. Chem. Rev., 2020, 416, 213344 CrossRef CAS.
- B. H. Jhun, D. Song, S. Y. Park and Y. M. You, Top. Curr. Chem., 2022, 380, 35 CrossRef CAS PubMed.
- H. D. Shi, Y. Wang, S. M. Lin, J. X. Lou and Q. L. Zhang, Dalton Trans., 2021, 50, 6410–6417 RSC.
- Y. Pei, Y. Sun, M. J. Huang, Z. J. Zhang, D. Y. Yan, J. Cui, D. X. Zhu, Z. B. Zeng, D. Wang and B. Z. Tang, Biosensors, 2022, 12, 1104 CrossRef CAS PubMed.
- B. Liu, J. Long, M. Zhang, K. M. Cheng, X. Gao, Y. B. Zhou, Y. Li, Z. L. Tang and W. Zhang, J. Inorg. Biochem., 2022, 226, 111626 CrossRef CAS PubMed.
- M. Samandarsangari, I. S. Kritchenkov, D. O. Kozina, A. D. Komarova, M. V. Shirmanova and S. P. Tunik, Chemosensors, 2023, 11, 263 CrossRef CAS.
- X. X. Liao, J. C. Shen, W. J. Wu, S. Kuang, M. W. Lin, J. Karges, Z. L. Tang and H. Chao, Inorg. Chem. Front., 2021, 8, 5045–5053 RSC.
- W. J. Li, T. Li, Y. Pan, S. H. Li, G. Xu, Z. L. Zhang, H. Liang and F. Yang, J. Med. Chem., 2024, 67, 3843–3859 CrossRef CAS PubMed.
- C. F. Lu, W. Xu, H. Shah, B. Q. Liu, W. Xu, L. Sun, S. Y. Qian and W. F. Sun, ACS Appl. Bio Mater., 2020, 3, 6865–6875 CrossRef CAS PubMed.
- M. Martinez-Alonso, C. G. Jones, J. D. Shipp, D. Chekulaev, H. E. Bryant and J. A. Weinstein, J. Biol. Inorg. Chem., 2024, 29, 113–125 CrossRef CAS PubMed.
- T. Feng, Z. X. Tang, J. Karges, J. Shu, K. Xiong, C. Z. Jin, Y. Chen, G. Gasser, L. N. Ji and H. Chao, Chem. Sci., 2024, 15, 6752–6762 RSC.
- S. X. Gu, Q. Jiang and P. F. Shi, Prog. Chem., 2022, 34, 1957–1971 CAS.
- B. Joshi and M. Shivashankar, ACS Omega, 2023, 8, 43408–43432 CrossRef CAS.
- X. D. Yang, D. T. Zhang, J. Li, W. H. Ji, N. D. Yang, S. X. Gu, Q. Wu, Q. Jiang, P. F. Shi and L. Li, Chem. Commun., 2020, 56, 9032–9035 RSC.
- P. F. Shi, Q. Jiang, S. Sanchez, X. S. Zhao, Q. Zhang and Y. P. Tian, Dalton Trans., 2015, 44, 8041–8048 RSC.
- S. Sprouse, K. A. King, P. J. Spellane and R. J. Watts, J. Am. Chem. Soc., 1984, 106, 6647–6653 CrossRef CAS.
- M. J. Frisch, Gaussian 09, Revision A.02, Gaussian Inc., Wallingford, CT 2009 Search PubMed.
- J. Eberhardt, D. Santos-Martins, A. F. Tillack and S. Forli, J. Chem. Inf. Model., 2021, 61, 3891–3898 CrossRef CAS PubMed.
- J. Carmichael, W. G. DeGraff, A. F. Gazdar, J. D. Minna and J. B. Mitchell, Cancer Res., 1987, 47, 936–942 CAS.
- E. Garoni, A. Colombo, D. Roberto, C. Dragonetti, V. Guerchais and K. Kamada, Phys. Chem. Chem. Phys., 2024, 26, 7837–7843 RSC.
- P. Kumar, M. Perez-Escribano, D. M. E. Raamsdonk and D. Escudero, J. Phys. Chem. A, 2023, 127, 7241–7255 CrossRef CAS PubMed.
- J. Tong, A. Liu, S. Huang, Y. Yao, G. G. Shan and Z. M. Su, Chem.–Asian J., 2023, 18, e202300175 CrossRef CAS PubMed.
- J. Tong, X. Yang, X. Song, J. Liang, S. Huang, H. Mao, M. Akhtar, A. Liu, G. G. Shan and G. Li, Dalton Trans., 2023, 52, 1105–1112 RSC.
- A. Zamora, G. Vigueras, V. Rodríguez, M. D. Santana and J. Ruiz, Coord. Chem. Rev., 2018, 360, 34–76 CrossRef CAS.
- J. Kasparkova, A. Hernández-García, H. Kostrhunova, M. Goicuría, V. Novohradsky, D. Bautista, L. Markova, M. D. Santana, V. Brabec and J. Ruiz, J. Med. Chem., 2024, 67, 691–708 CrossRef CAS.
- W. W. Qin, Z. Y. Pan, D. H. Cai, Y. Li and L. He, Dalton Trans., 2020, 49, 3562–3569 RSC.
- S. A. Koziel, M. K. Lesiow, D. Wojtala, E. Dyguda-Kazimierowicz, D. Bienko and U. K. Komarnicka, Pharmaceuticals, 2021, 14, 685 CrossRef CAS PubMed.
Footnote |
| † Electronic supplementary information (ESI) available. See DOI: https://doi.org/10.1039/d4ra04408h |
| This journal is © The Royal Society of Chemistry 2024 |

