DOI:
10.1039/D4RA04562A
(Paper)
RSC Adv., 2024,
14, 24703-24711
Electrochemical performance of Cu6Sn5 alloy anode materials for lithium-ion batteries fabricated by controlled electrodeposition†
Received
22nd June 2024
, Accepted 30th July 2024
First published on 7th August 2024
Abstract
Combining electrodeposition and heat treatment is an effective method to successfully fabricate Cu6Sn5 alloy materials, in which the S2 alloy electrode is electrodeposited at 1.2 A dm−2 current density with uniform and compact morphology. The characterization results show that monoclinic η′-Cu6Sn5 and hexagonal η-Cu6Sn5 phases fabricated at the appropriate current density exhibit excellent electrochemical performance. The optimal Cu6Sn5 alloy anode material boasts not just a significantly high discharge specific capacity of 890.2 mA h g−1 with an initial coulombic efficiency (ICE) of 73.96%, but also achieves an adequate discharge specific capacity of 287.1 after 50 cycles at 100 mA h g−1. Moreover, the electrodeposited Cu6Sn5 alloy materials also possessed a lower transfer resistance of 42.45 Ω and an improved lithium-ion diffusion coefficient of 2.665 × 10⁻¹⁵ cm2 s−1 at the current density of 1.2 A dm−2. Therefore, preparing the Cu6Sn5 alloy thin-film electrode could be a cost-effective and straightforward method by electrodeposition from cyanide-free plating baths to develop anode components suitable for lithium-ion battery applications.
1 Introduction
To satisfy the rapidly increasing demands for higher energy density, stable electrochemical performance, and high safety of electrical devices, lithium-ion batteries (LIBs) are universally acknowledged as a favorable choice for energy storage.1,2 The anode material plays a significant role in enhancing the battery performance, but the deployment of graphite-anode LIBs in commercial applications encounters substantial obstacles with a relatively modest theoretical specific capacity of only 372 mA h g−1 as well as poor rate performance.3–5 Consequently, the design and development of innovative anode materials that exhibit enhanced theoretical specific capacity are gaining increasing importance, in which Sn-based materials have garnered significant attention as potential candidates for further investigation due to their exceptional theoretical capacity of 993 mA h g−1, appropriate working voltage, excellent electrical conductivity, and abundance in nature.6 Nevertheless, the rapid capacity loss is a common issue for Sn-based materials due to significant volumetric variations during lithium insertion/extraction processes, which will bring about cracking and pulverization of electrodes with drastic structural collapse and poor cycling stability.7 As a result, some efficient strategies are implemented to overcome these shortcomings, such as constructing the Sn–M (M = Cu, Fe, Sb, Co, etc.) alloy composite structure, where M is an inactive element.8–11 The inactive element can be used to create a conductive and ductile framework for containing the lithiated tin particles, which can withstand some of the damaging expansion/contraction of the LixSn particles during discharge and charge.12 Among traditional Sn alloy systems, the Sn–Cu alloy, specifically Cu6Sn5, which has a theoretical capacity of 605 mA h g−1, has been viewed as a potential alternative anode material for LIBs because it can mitigate the peeling of electrodes and exhibit a lower oxidation potential, which have a positive impact on electrochemical performance.13,14 It is noteworthy that the structural integrity of Cu6Sn5 is strong among the original Sn–Cu intermetallics and their lithium-inserted counterparts, while also providing cost-effective high energy storage.15,16 Furthermore, many methods are employed to fabricate Cu6Sn5 alloys, such as electron beam evaporation deposition,17 solution synthesis,18,19 and electrodeposition,20,21 of which electrodeposition is an efficient method for achieving large-scale manufacturing of alloy electrodes due to its high productivity, simple process, and relative cost-effectiveness.
A facile strategy is proposed to ameliorate the intractable problem of restricted useable discharge capacity and unsatisfactory cycling durability of Sn–Cu alloy electrodes reported, which is mainly due to the diminished effective proportion of active elements and substantial volume fluctuations of alloy electrode substances.20,22,23 Electrodeposition is a simplicity and efficient way to fabricate Cu6Sn5 alloy electrodes at various current densities from cyanide-free plating solution, which has the benefits of straightforwardness, productiveness, and controllability of the surface structure and grain size. Furthermore, the electrodeposition Cu6Sn5 at the appropriate current density can create a uniform and dense surface structure, which can facilitate substantial reduction in ion diffusion distances, thereby improving the cycling stability and rate capability of alloy electrodes. Therefore, Cu6Sn5 alloy particles are prepared from cyanide-free plating solution by electrodeposition at different current densities and controlled heat treatments to further improve the densification of Cu6Sn5 alloy nanoparticles in this work.
2 Experimental
2.1 Materials preparation
After being cut into 5.5 cm × 7.5 cm pieces, the copper foils as substrate are polished with sandpaper, repeatedly pressed with a roller press, and ultrasonically cleaned before use. To prepare the electroplating solution, 30.00 g of K4P2O7·3H2O, 2.00 g of C6H6O2, 1.25 g of KNO3, and 0.10 g of hexadecyl trimethyl ammonium bromide are gradually introduced into 150.0 mL of deionized water, resulting in the formation of a transparent yellow solution. Then 2.25 g of SnCl2·2H2O, 1.25 g of CuSO4·5H2O, and 0.13 g of ethylenediamine are added into the yellow solution as illustrated in Fig. 1. Last, the final plating solution is made clear and transparent with the addition of deionized water and ammonia, in which the pH value is adjusted to 9. Cu6Sn5 anode materials are fabricated by electrodeposition at 1.0, 1.2, 1.5, and 1.7 A dm−2 lasting for 10 min, respectively, and then calcined in a muffle furnace at 200 °C for 10 h. The final calcined products which include monoclinic η′-Cu6Sn5 and hexagonal η-Cu6Sn5 phase are labeled S1, S2, S3, and S4, corresponding to the current density of 1.0, 1.2, 1.5, and 1.7 A dm−2, respectively. The space group of monoclinic Cu6Sn5 is C2/c (15) and the space group of hexagonal Cu6.26Sn5 is P63/mmc (194). Analytical reagents are used in this experiment without any additional purification.
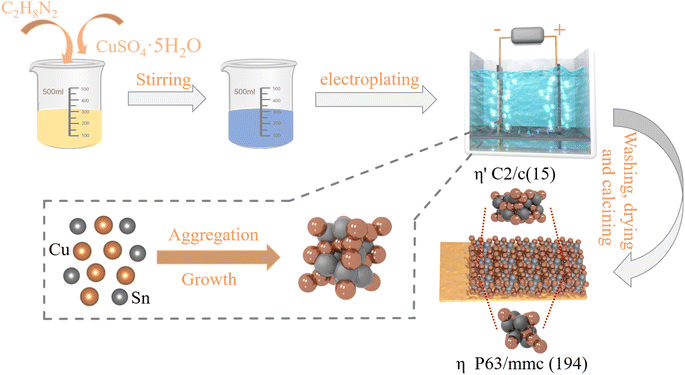 |
| | Fig. 1 Schematic diagram of the fabricated Cu6Sn5 alloy electrodes. | |
2.2 Performance characterization
X-ray diffraction (XRD, PALMERNACO) from 20 to 90° at a scan rate of 10° min−1 is employed to characterize the crystal structure of the obtained samples. The X-ray photoelectron spectroscopy (XPS, Thermo K-Alpha) is used to measure the chemical valence and chemical environment of the elements on the sample surface. The microstructure and elemental composition of the samples are examined using a field emission-scanning electron microscope (FE-SEM, MIRA3, TESCAN) equipped with an energy dispersive spectrometer (EDS, BRUKER). The fabricated Cu6Sn5 alloy electrodes are constructed into CR2025-type coin batteries, in which the copper foil can be punched into a 12 mm diameter disk directly as the working electrode, lithium metal serves as the counter electrode, and the electrolyte is 1.0 mol LiPF6 in EC![[thin space (1/6-em)]](https://www.rsc.org/images/entities/char_2009.gif) :
:![[thin space (1/6-em)]](https://www.rsc.org/images/entities/char_2009.gif) DMC = 1
DMC = 1![[thin space (1/6-em)]](https://www.rsc.org/images/entities/char_2009.gif) :
:![[thin space (1/6-em)]](https://www.rsc.org/images/entities/char_2009.gif) 1 vol% with 10.0% FEC (Suzhou DuoDuo Chemical Technology Co., Ltd). The charge–discharge cycle stability of the coin cells is measured with an operating voltage range from 0.01 to 2.00 V via a battery test system (CT 2001A, Land) at 100 mA g−1. A CHI660E electrochemistry workstation (Shanghai Chenhua Co., Ltd, China) is utilized for recording the voltage variations of cyclic voltammetry (CV) curves to explore the reaction mechanism of the electrodes from 0.01 V to 3.00 V. To compute the Li+ diffusion coefficient, the same workstation is employed to record the electrochemical impedance spectroscopy (EIS) profiles with an amplitude of 5.00 mV from 105 to 10−2 Hz.
1 vol% with 10.0% FEC (Suzhou DuoDuo Chemical Technology Co., Ltd). The charge–discharge cycle stability of the coin cells is measured with an operating voltage range from 0.01 to 2.00 V via a battery test system (CT 2001A, Land) at 100 mA g−1. A CHI660E electrochemistry workstation (Shanghai Chenhua Co., Ltd, China) is utilized for recording the voltage variations of cyclic voltammetry (CV) curves to explore the reaction mechanism of the electrodes from 0.01 V to 3.00 V. To compute the Li+ diffusion coefficient, the same workstation is employed to record the electrochemical impedance spectroscopy (EIS) profiles with an amplitude of 5.00 mV from 105 to 10−2 Hz.
3 Results and discussion
XRD patterns are analyzed to identify the crystal structure of the as-fabricated samples and to measure the chemical valence and chemical atmosphere of the elements, XPS is employed in Fig. 2. Fig. 2(a) reveals that the four samples prepared at varying current densities all display distinctive diffraction peaks at 30.1°, 43.0°, and 43.3°, corresponding to the (101), (110), and (102) planes of Cu6.26Sn5 phase (JCPDS: NO. 47-1575) as well as the (22-1), (132), and (42-2) planes of Cu6Sn5 phase (JCPDS: NO. 45-1488). Moreover, the distinct peaks observed at 43.3°, 50.5°, and 74.1° are ascribed to the Cu foil substrate.24 It is noteworthy that the diffraction peaks of Cu3Sn are present in the XRD patterns of S3 and S4 samples, but the Cu3Sn phase is virtually inactive against lithiation at room temperature.25 Furthermore, the enlarged detail patterns of S1, S2, S3, and S4 samples near the 30.1° diffraction peak in the XRD pattern indicate that the varying current density may indeed lead to fine-tuning of the internal structure of the crystal. Fig. S1† depicts the comprehensive spectra of the prepared S2 sample, revealing that Cu and Sn elements are present in the surface layer, which is in accordance with the outcomes of EDS. As illustrated in Fig. 2(b), the Cu 2p XPS spectra with high resolution can be decomposed into two well-defined peaks, two peaks of 934.3 and 954.4 eV are assigned to Cu 2p3/2 and Cu 2p1/2 of Cu2+, and the peaks of 933.6 and 954.0 eV are ascribed to Cu 2p3/2 and Cu 2p1/2 of Cu0, respectively. The two peaks at 942.4 and 962.2 eV can be identified as the satellite peaks of Cu 2p due to the unfilled 3d9 state. In Fig. 2(c), in the Sn 3d spectra, the peaks positioned at 486.8 eV and 495.2 eV are ascribed to Sn4+, while the peaks situated at 484.7 eV and 493.3 eV are linked to Sn0.
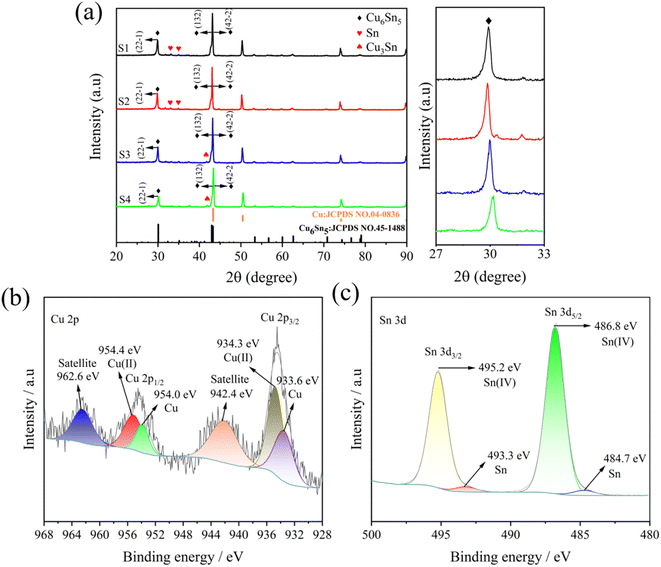 |
| | Fig. 2 XRD patterns (a) of S1, S2, S3, and S4 electrodes as well as their partial enlarged details; Cu 2p (b) and Sn 3d (c) spectra of the S2 sample. | |
In Fig. 3, the SEM images depict the morphological characteristics of S1, S2, S3, and S4 electrodes fabricated at various current densities. The SEM image of S1 presents a loose spherical granular agglomerate structure with a sizeable gap between the grains and visible more defect holes on the surface of S1, as revealed in Fig. 3(a and e). The surface of sample S2 is dense as depicted in Fig. 3(b and f), in which the surface grains are small and the flatness is high. It's worth noting that as current density increases, the surface density decreases on the surfaces of S2, S3 and S4. Fig. 3(c and g) reveals that the grain growth on the surface of S3 is uniform, but the density remains lower compared to sample S2. Furthermore, as depicted in Fig. 3(d and h), the surface roughness of S4 increases and there are evident fluffy pores. This may be attributed to the too rapid crystallization, enhanced concentration polarization, and intensified hydrogen evolution, leading to many large-sized spherical crystal particles appearing on the surface of S4. Fig. 3(i–l) shows the EDS mapping images corresponding to the S1, S2, S3, and S4 samples, indicating that all four samples contain copper and tin. Therefore, it can be inferred that S2 has a uniform and compact interface, which significantly enhances its electrochemical characteristics by strengthening the connection and reducing resistance at the electrode–current collector interface.
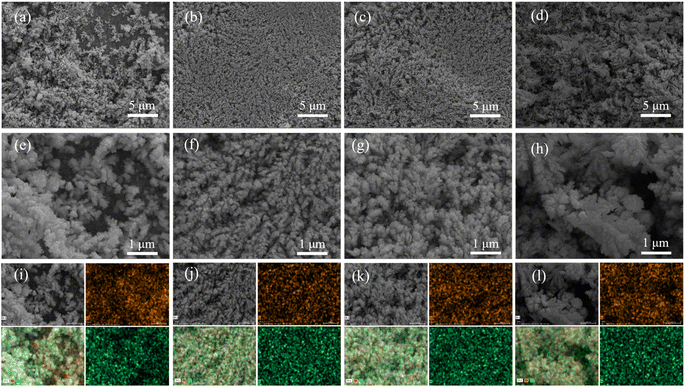 |
| | Fig. 3 SEM images of the fabricated S1 (a and e), S2 (b and f), S3 (c and g), and S4 (d and h); EDS mapping images of S1 (i), S2 (j), S3 (k), and S4 (l). | |
Galvanostatic charging–discharging tests are used to evaluate the electrochemical performance of the Cu6Sn5 alloy electrodes prepared by electrodeposition, as depicted in Fig. 4. Fig. 4(a) depicts the initial curves of galvanostatic charging and discharging, in which the S2 alloy electrode has an initial coulombic efficiency (ICE) of 73.96% and exhibits a remarkable discharge specific capacity of 890.2 mA h g−1, while the coin cells with the S1, S3, and S4 alloy electrodes possess ICE values of 70.06%, 71.57%, and 79.06%, respectively. In Fig. 4(b), it is depicted that the cells that are assembled with the S1, S2, S3, and S4 electrodes exhibit cycling stability during 50 cycles at 100 mA g−1. It's worth noting that the curves show that the S2 alloy electrode has superior charge–discharge performance compared to other electrodes. During the initial 26 cycles, the specific discharge capacity of the S2 alloy electrode exceeds that of the other three electrodes. The specific discharge capacity decreases quickly after 26 cycles, but it remains at 287.1 mA h g−1 after the 50th cycle. To verify the reliability of the results, error bars for the first discharge specific capacity and first cycle efficiency of the four samples are shown in Fig. S2.† To better understand the significance of this work, in Table 1, the comparison of Cu–Sn material battery performance in previous studies and the current work is shown. In this work, Cu6Sn5 has a superior electrochemical property, and a simple and affordable method is proposed to fabricate the Sn-based material directly through electrodeposition, in which the current density can be adjusted to control the size and volume change of Cu6Sn5 particles. When considering the coulombic efficiency as depicted in Fig. 4(c), the four samples demonstrate steady performance with efficiencies exceeding 93% after the first cycle, revealing that these alloy anodes materials have favorable reversibility during the discharge/charge process. The rate cycling tests of the S2 electrode deposited at 1.2 A dm−2 are displayed in Fig. 4(d), in which the S2 electrode consistently exhibits high discharge specific capacities of 580.4, 487.9, 407.7, and 303.2 mA h g−1 at 100, 200, 500, and 1000 mA g−1, respectively. In addition, when the current is suddenly adjusted to 100 mA g−1, the discharge specific capacity of the S2 electrode can rapidly recover to 511.8 mA h g−1 with an exceptional coulombic efficiency, which indicates the structural stability of the S2 sample maintained during various cycling rates.
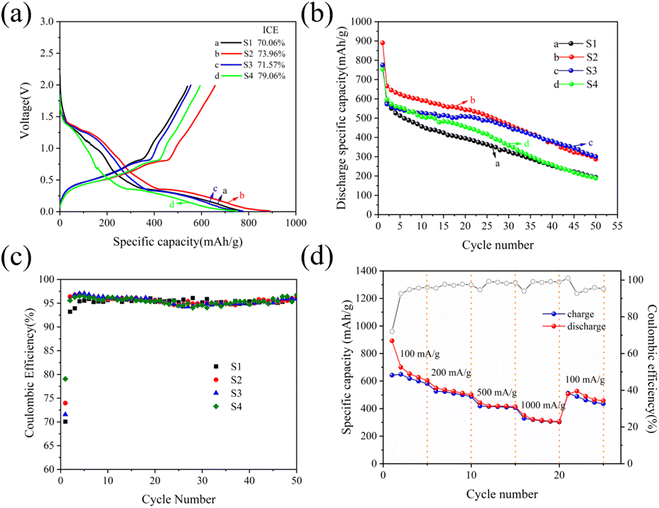 |
| | Fig. 4 Initial galvanostatic charge and discharge curves (a) and cycling performance curves (b and c) of S1, S2, S3 and S4 electrodes at 100 mA g−1; rate performance (d) of the S2 electrode at various current densities. | |
Table 1 Capability comparisons of Cu–Sn alloy materials in previous works and this work
| Samples |
Current density |
Cycle number |
Capacity (mA h g−1) |
Ref. |
| Copper–tin alloy |
200 mA g−1 |
15 |
500 |
26 |
| Sn–Cu thin film |
100 μA cm−2 |
30 |
200 |
27 |
| Cu6Sn5 alloy |
100 mA g−1 |
25 |
448 |
28 |
| Cu6Sn5 |
0.13 mA cm−2 |
10 |
480 |
29 |
| Sn–Zn–Ni film |
300 mA g−1 |
35 |
444 |
30 |
| Sn/Cu6Sn5 alloy |
300 μA cm−2 |
70 |
370 |
17 |
| Cu6Sn5 alloy |
50 mA g−1 |
20 |
400 |
8 |
| Cu6Sn5 alloy |
100 mA g−1 |
50 |
287 |
This work |
The CV curves and galvanostatic discharge and charge profiles are conducted to evaluate the electrochemical reaction mechanism of the S2 electrode in Fig. 5. Five reduction peaks can be observed at 1.23, 0.97, 0.53, 0.22, and 0.02 V during the initial cathodic scan as shown in Fig. 5(a). It is noteworthy that these distinctive peaks observed during the first cycle at 0.97 and 1.23 V correspond to the emergence of other irreversible reactions of some oxides and a solid electrolyte interphase (SEI) film.31 A small amount of SEI film is still formed in each subsequent cycle, but it disappears in the fifth cycle.32–34 Moreover, the reduction peaks about 0.22, 0.31 and 0.53 V signify the emergence of the intermediate LixCu6Sn5 alloy composition and subsequent embedding of Li+ into Li2Cu6Sn5 to form the Li2CuSn compound according to eqn (1) and (2).35,36 Evidently, the peak emerging at 0.02 V can be unequivocally linked to the Li3.5Sn alloy phase, in accordance with eqn (3), which corresponds to the lithium intercalation processes of Cu6Sn5 alloy as described in previous reported.37 Considering the anodic portion, the humps of around 0.53 and 0.81 V are associated with the gradual dementalization process of Li2CuSn from Li3.5Sn and the conversion reaction of Cu6Sn5 from Li2CuSn referring to eqn (1)–(3),38 in which the Cu–Sn alloy remains unaffected by the inactive Cu phase during the lithium insertion/extraction processes. The discharge–charge profiles of the S2 electrode under galvanostatic conditions for initial five cycles at 100 mA g−1 are illustrated in Fig. 5(b). It is worth noting that the charge–discharge curves are markedly different between the first cycle and the next four cycles, indicating that there is a potential association with the emergence of an SEI layer on the S2 electrode. Importantly, all the curves almost overlap except for the first cycle, which shows that the Cu6Sn5 alloy electrode exhibits excellent reversibility during the lithiation and delithiation process.
| | |
xLi+ + xe− + Cu6Sn5 ↔ LixCu6Sn5
| (1) |
| | |
(10 − x)Li+ + (10 − x)e− + LixCu6Sn5 ↔ 5Li2CuSn + Cu
| (2) |
| | |
3Li+ + 3e− + 2Li2CuSn ↔ 2Li3.5Sn + 2Cu
| (3) |
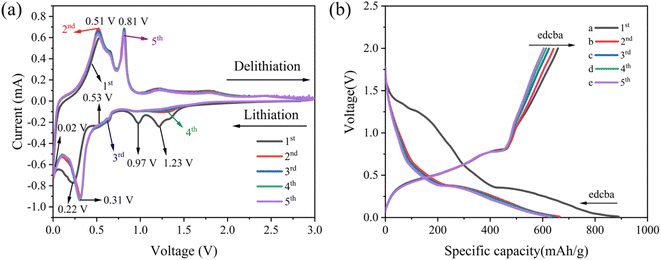 |
| | Fig. 5 CV curves (a) and galvanostatic discharge and charge profiles (b) of the S2 electrode at the first fifth cycles. | |
As depicted in Fig. 6(a), to study the dynamic behavior and investigate the Li+ storage mechanism and electrochemical performance of the S2 electrode, cyclic voltammetry is conducted at various sweep rates. It is obvious that the potential of both cathodic peaks decreases along with an increase in magnitude, while the anodic peaks show a slight upward shift. The redox pseudocapacitance effect can be evaluated by utilizing the eqn (4), where a and b are constants, and the peak current (i) obeys a power-law relationship with the scan rate (v).39 Generally, the yielded b value of 0.5 suggests a diffusion-controlled faradaic intercalation process while b value of 1.0 indicates a complete capacitive behavior via a surface faradaic redox reaction.40 Furthermore, when b is between 0.5 and 1, it can be estimated that capacitive and diffusive contributions are involved in the hybrid charge storage process. The fitted curves in Fig. 6(b) display b values of 0.78 and 0.68, indicating that the electrochemical characteristics are regulated by diffusion-controlled and pseudocapacitive processes, rather than a pure capacitive or faradaic process. To appraise further the influence of capacitance on the overall current response, at a certain potential, the power-law relationship (i = avb) is redefined as the sum of current contributions derived from diffusion-controlled processes (k2v0.5) and capacitive effects (k1v) according to eqn (4) and (5).4 Consecutively, the relative share of currents stemming from pseudocapacitors or diffusion-controlled intercalation can be calculated. Specifically, the pseudocapacitive contribution of the S2 electrode is 86.70% at 0.8 mV s−1 demonstrated in Fig. 6(c). As the scanning speed rises, the pseudocapacitive component resulting from the surface capacitive effect also grows, achieving a significant 86.70% contribution for the Cu6Sn5 alloy thin-film electrode when scanned at 0.8 mV s−1. As depicted in Fig. 6(d), it is evident that the capacitive contributions relative to scan rates of 0.2, 0.4, 0.6, 0.8, and 1.0 mV s−1 are approximately 70.20, 78.10, 82.37, 86.70, and 92.62%, respectively. The significant capacitance contribution of the S2 electrode is primarily attributed to appropriate current density, which can enhance the homogeneous and densified surface of the S2 electrode to deliver the outstanding electrochemical performance.
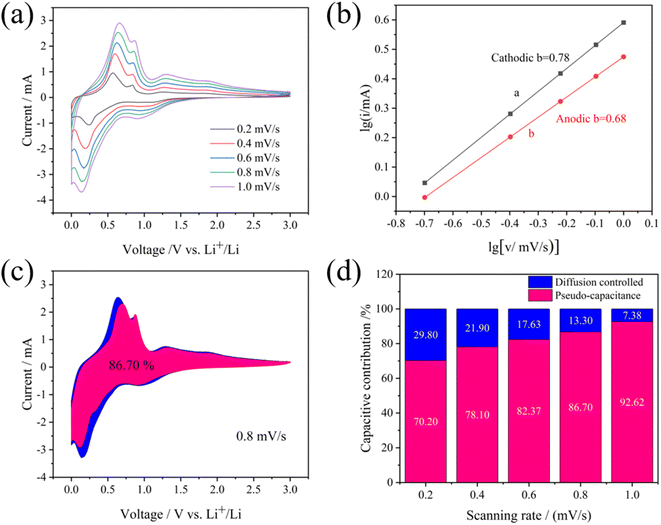 |
| | Fig. 6 CV curves at various scan rates from 0.2 to 1.0 mV s−1 (a), logarithmic relationship between peak currents and scan rates (b), the proportion of pseudocapacitance at 0.8 mV s−1 (c) and contribution ratios of pseudocapacitive and diffusion-controlled process at given scan rates (d) of the S2 electrode. | |
To investigate the Li+ diffusion coefficient of the as-fabricated alloy sample, the EIS measurements are employed. It is important to note that the DLi+ values measured by EIS tests in a stationary state, in which by conceiving of the electrochemical process visualized as an equivalent electrical system, EIS analysis plays a pivotal role in exploring the kinetic variations of electrodes. There is a high frequency semicircle along with a low-frequency diagonal line in all impedance spectra as depicted in Fig. 7(a), in which the semicircle represents the charge-transfer resistance (Rct) and the Li+ diffusion character is associated with the Warburg impedance (Wo). Consequently, the curves can be fitted using equivalent circuit denoted as [Rs(Rct//CPE)Wo] depicted in Fig. 7(a) and the corresponding fitting parameters are detailed in Table 2. Importantly, when compared to the three other electrodes, the S2 sample exhibits a lower Rct value, which can be attracted to the fact that the homogeneous and densified surface may facilitate charge transfer between the electrode and electrolyte. The curves of Z′ vs. ω−0.5 at the low frequency range of fabricated simples at various current densities through electrodeposition are depicted in Fig. 7(b), which the Warburg factor (σ) is determined by fitting Z′ linearly to ω−0.5 using eqn (6). Furthermore, the DLi+ values of the alloy electrodes are determined using eqn (7), in which R, T, A, n, F, and C represent the gas constant, Kelvin temperature in experimental conditions, the surface area of the electrode, the number of transferred electrons per molecules during oxidation, Faraday constant and concentrations of Li+, respectively, and σ is the Warburg factor. It can be seen in Table 2 that the S2 electrode has a higher DLi+ value than the other three electrodes, which can be attributed to the homogeneous and densified surface can decrease the ion migration paths to increase the rate of Li+ insertion and extraction. The cycling performance mentioned in Fig. 4 are consistent with the results, indicating that the properties of the Cu6Sn5 electrode can be significantly enhanced by controlling the current density.
| | |
Z′ = Rs + Rct + σω−0.5
| (6) |
| |
 | (7) |
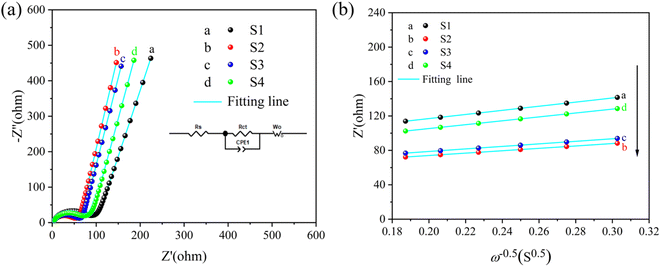 |
| | Fig. 7 Nyquist plots (a) of the as-assembled cells with S1, S2, S3, and S4 electrodes, and the corresponding fitting curves (b) of Z′ vs. ω−0.5 in the low frequency range. | |
Table 2 Relevant fitted values of the as-prepared samples at different current densities simulated from the equivalent circuits
| Current density (A dm−2) |
Rct (Ω) |
σ (Ω cm2 s−0.5) |
DLi+ (cm2 s−l) |
| 1.0 |
72.96 |
239.13 |
8.936 × 10⁻¹⁶ |
| 1.2 |
42.45 |
138.47 |
2.665 × 10⁻¹⁵ |
| 1.5 |
51.20 |
147.36 |
2.353 × 10⁻¹⁵ |
| 1.7 |
56.79 |
225.99 |
1.001 × 10⁻¹⁵ |
The before and after the circulation cross-section SEM images of the S2 electrode and SEM images after the circulation of the S1, S2, S3, and S4 are displayed in Fig. 8. The cross-section SEM images of S2 reveal a dense structure with numerous spherical granular agglomerates and the corresponding EDS mapping images indicate that sample S2 contains copper and tin, as demonstrated in Fig. 8(a and b). From Fig. 8(c and d), it is evident that the cross-section of sample S2 after being circulated with lots of particles remains intact. Clearly, the morphology of the four electrodes after the circulation shows significant differences from those before the circulation displayed in Fig. 3, in which cracks on the surface of the disassembled electrodes are distinct. In Fig. 8(e–h), SEM images after the circulation of S1, S2, S3, and S4 reveal that the coating exfoliating from the current collector phenomenon appears to be mitigated at first and then become severe as the current density increases, in which the surface of S2 electrode maintains a consistent and intact grain with the electrodeposition current density achieving 1.2 A dm−2. The reason for these results is that the optimal current density value of 1.2 A dm−2 is advantageous in forming a uniform and dense interface, which can decrease the resistance and strengthen the contact at the interface between the current collector and the electrode, leading to significant enhancement of battery performance.
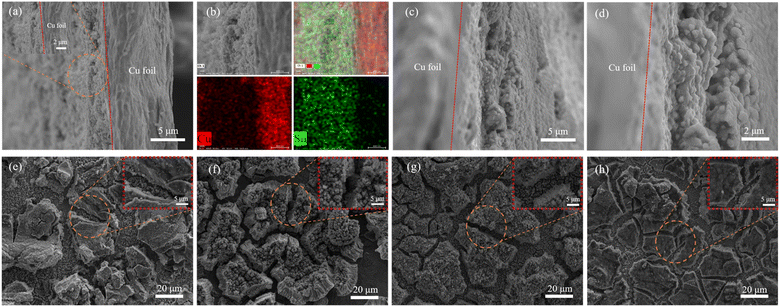 |
| | Fig. 8 The before (a and b) and after (c and d) the circulation cross-section SEM images of S2 electrode and SEM images of S1 (e), S2 (f), S3 (g), and S4 (h) after the circulation. | |
4 Conclusions
A straightforward strategy that combines electrodeposition and thermal treatment is used to fabricate Cu6Sn5 alloy electrodes, which include monoclinic phase η′-Cu6Sn5 and hexagonal phase η-Cu6Sn5. The investigation is focused on the impact of current density on the morphology and properties, in which dense surface of the electrode facilitated liquid electrolyte penetration and Li+ diffusion to evidently improve the cycling stability and reversibility of reactions when the electrodeposition current density is controlled at 1.2 A dm−2. Additionally, the optimized Cu6Sn5 alloy electrode showed a low charge transfer resistance and fast kinetics, which enabled excellent electrochemical lithium storage efficiency and rate capability. Therefore, a tunable strategy for fabricating Cu6Sn5 alloy from cyanide-free plating solution as an optimized-performance anode can be put forward to offer a promising candidate for a Sn-based anode for enhanced performance LIBs.
Data availability
The data that support the findings of this study are available from the corresponding author, [Qiuyu Zeng], upon reasonable request.
Conflicts of interest
The authors declare no competing financial interests.
Acknowledgements
This work was financially supported by the Anhui University of Science and Technology Graduate Innovation Fund Project in 2021 [2021CX1010].
References
- Y. Li, S. Chen, W. Duan, Y. Nan, D. Ding and G. Xiao, Energy Technol., 2024, 12, 2300830 CrossRef CAS
 .
. - L. Wang, L. Xie, Y. Song, X. Liu, H. Zhang and X. He, Battery Energy, 2023, 2, 20220025 CrossRef CAS
 .
. - S. Paul, Md. A. Rahman, Md. S. Islam, Md. R. Islam and S. Siddiqui, Battery Energy, 2022, 1, 20220018 CrossRef CAS
 .
. - R. Fang, C. Miao, H. Mou and W. Xiao, J. Alloys Compd., 2020, 818, 152884 CrossRef CAS
 .
. - Y. Liu, P. A. Russo, L. A. Montoro and N. Pinna, Battery Energy, 2023, 2, 20220037 CrossRef CAS
 .
. - W. Jiang, W. Wang, L. Liu, H. Wang, Z. Xu, F. Li, H. Fu, H. Lv, L. Chen and Y. Kang, J. Alloys Compd., 2019, 779, 856–862 CrossRef CAS
 .
. - Y. Xin, H. Mou, C. Miao, S. Nie, M. Wen, G. He and W. Xiao, J. Alloys Compd., 2022, 922, 166176 CrossRef CAS
 .
. - X. Fan, F. Ke, G. Wei, L. Huang and S. Sun, Electrochem. Solid-State Lett., 2008, 11, A195 CrossRef CAS
 .
. - G. Park, C. Lee, J. Lee, J. H. Choi, Y. Lee and S. Lee, J. Alloys Compd., 2014, 588, 534–539 CrossRef CAS
 .
. - X. Fan, F. Ke, G. Wei, L. Huang and S. Sun, J. Alloys Compd., 2009, 476, 70–73 CrossRef CAS
 .
. - N. Tamura, R. Ohshita, M. Fujimoto, S. Fujitani, M. Kamino and I. Yonezu, J. Power Sources, 2002, 107, 48–55 CrossRef CAS
 .
. - L. Xue, Z. Fu, Y. Yao, T. Huang and A. Yu, Electrochim. Acta, 2010, 55, 7310–7314 CrossRef CAS
 .
. - D. Zhang, C. Wang, Y. Yang, R. Guan, D. Lu, L. Gao, C. Sun and X. Bian, J. Alloys Compd., 2021, 889, 161637 CrossRef
 .
. - Z. Shen, Y. Hu, R. Chen, X. He, Y. Chen, H. Shao, X. Zhang and K. Wu, Electrochim. Acta, 2017, 225, 350–357 CrossRef CAS
 .
. - Q. Han, Z. Yi, Y. Cheng, Y. Wu and L. Wang, RSC Adv., 2016, 6, 15279–15285 RSC
 .
. - R. Hu, G. H. Waller, Y. Wang, Y. Chen, C. Yang, W. Zhou, M. Zhu and M. Liu, Nano Energy, 2015, 18, 232–244 CrossRef CAS
 .
. - R. Hu, M. Zeng and M. Zhu, Electrochim. Acta, 2009, 54, 2843–2850 CrossRef CAS
 .
. - X. Tan, S. Tao, L. Ran, R. Knibbe and K. Nogita, Nano Sel., 2022, 3, 1264–1276 CrossRef CAS
 .
. - T. Sarakonsri, T. Apirattanawan, S. Tungprasurt and T. Tunkasiri, J. Mater. Sci., 2006, 41, 4749–4754 CrossRef CAS
 .
. - X. Tan, S. D. McDonald, Q. Gu, Y. Hu, L. Wang, S. Matsumura, T. Nishimura and K. Nogita, J. Power Sources, 2019, 415, 50–61 CrossRef CAS
 .
. - J. Chen, L. Yang, S. Fang, S. Hirano and K. Tachibana, J. Power Sources, 2012, 199, 341–345 CrossRef CAS
 .
. - Z. Ni, D. Yang, Y. Wang, W. Yang, B. Deng, J. Hou, Y. Zhang, X. Li and Y. Zhang, J. Alloys Compd., 2022, 906, 164307 CrossRef CAS
 .
. - X. Fan, Q. Zhuang, G. Wei, L. Huang, Q. Dong and S. Sun, J. Appl. Electrochem., 2009, 39, 1323–1330 CrossRef CAS
 .
. - S. Ni, X. Lv, T. Li, X. Yang and L. Zhang, Electrochim. Acta, 2013, 109, 419–425 CrossRef CAS
 .
. - A. Kitada, N. Fukuda, T. Ichii, H. Sugimura and K. Murase, Electrochim. Acta, 2013, 98, 239–243 CrossRef CAS
 .
. - Y. Lin, J. Duh and H. Sheu, J. Alloys Compd., 2011, 509, 123–127 CrossRef CAS
 .
. - R. Hu, Y. Zhang and M. Zhu, Electrochim. Acta, 2008, 53, 3377–3385 CrossRef CAS
 .
. - L. Yu, C. Miao, S. Nie, M. Wen, J. Wang, Y. Tan and W. Xiao, Solid State Ionics, 2021, 364, 115625 CrossRef CAS
 .
. - X. Tan, S. D. McDonald, Q. Gu, L. Wang, S. Matsumura and K. Nogita, J. Power Sources, 2019, 440, 227085 CrossRef CAS
 .
. - Z. Du, S. Zhang, F. Li, T. Jiang and Z. Bai, Trans. Inst. Met. Finish., 2012, 90, 197–202 CrossRef CAS
 .
. - S. Nie, Y. Xin, Q. Wang, C. Liu, C. Miao, L. Yu and W. Xiao, Int. J. Miner., Metall. Mater., 2023, 30, 1171–1180 CrossRef CAS
 .
. - A. Patil, V. Patil, D. Wook Shin, J. Choi, D. Paik and S. Yoon, Mater. Res. Bull., 2008, 43, 1913–1942 CrossRef CAS
 .
. - P. Verma, P. Maire and P. Novák, Electrochim. Acta, 2010, 55, 6332–6341 CrossRef CAS
 .
. - L. Su, Z. Zhou and P. Shen, J. Phys. Chem. C, 2012, 116, 23974–23980 CrossRef CAS
 .
. - L. Baggetto, J. Jumas, J. Górka, C. A. Bridges and G. M. Veith, Phys. Chem. Chem. Phys., 2013, 15, 10885–10894 RSC
 .
. - X. F. Tan, W. Yang, K. Aso, S. Matsumura, S. D. McDonald and K. Nogita, ACS Appl. Energy Mater., 2019, 3, 141–145 CrossRef
 .
. - W. Choi, J. Y. Lee and H. S. Lim, Electrochem. Commun., 2004, 6, 816–820 CrossRef CAS
 .
. - Z. Wang, S. Luo, F. Chen, D. Wang, Y. Liu, X. Qi, C. Shi and N. Zhao, RSC Adv., 2016, 6, 54718–54726 RSC
 .
. - J. Li, X. Xu, Z. Luo, C. Zhang, Y. Zuo, T. Zhang, P. Tang, M. F. Infante-Carrió, J. Arbiol, J. Llorca, J. Liu and A. Cabot, ChemSusChem, 2019, 12, 1451–1458 CrossRef CAS PubMed
 .
. - Q. Li, H. Zhang, S. Lou, Y. Qu, P. Zuo, Y. Ma, X. Cheng, C. Du, Y. Gao and G. Yin, Ceram. Int., 2017, 43, 11998–12004 CrossRef CAS
 .
.
|
| This journal is © The Royal Society of Chemistry 2024 |
Click here to see how this site uses Cookies. View our privacy policy here.  Open Access Article
 *b
*b
![[thin space (1/6-em)]](https://www.rsc.org/images/entities/char_2009.gif) :
:![[thin space (1/6-em)]](https://www.rsc.org/images/entities/char_2009.gif) DMC = 1
DMC = 1![[thin space (1/6-em)]](https://www.rsc.org/images/entities/char_2009.gif) :
:![[thin space (1/6-em)]](https://www.rsc.org/images/entities/char_2009.gif) 1 vol% with 10.0% FEC (Suzhou DuoDuo Chemical Technology Co., Ltd). The charge–discharge cycle stability of the coin cells is measured with an operating voltage range from 0.01 to 2.00 V via a battery test system (CT 2001A, Land) at 100 mA g−1. A CHI660E electrochemistry workstation (Shanghai Chenhua Co., Ltd, China) is utilized for recording the voltage variations of cyclic voltammetry (CV) curves to explore the reaction mechanism of the electrodes from 0.01 V to 3.00 V. To compute the Li+ diffusion coefficient, the same workstation is employed to record the electrochemical impedance spectroscopy (EIS) profiles with an amplitude of 5.00 mV from 105 to 10−2 Hz.
1 vol% with 10.0% FEC (Suzhou DuoDuo Chemical Technology Co., Ltd). The charge–discharge cycle stability of the coin cells is measured with an operating voltage range from 0.01 to 2.00 V via a battery test system (CT 2001A, Land) at 100 mA g−1. A CHI660E electrochemistry workstation (Shanghai Chenhua Co., Ltd, China) is utilized for recording the voltage variations of cyclic voltammetry (CV) curves to explore the reaction mechanism of the electrodes from 0.01 V to 3.00 V. To compute the Li+ diffusion coefficient, the same workstation is employed to record the electrochemical impedance spectroscopy (EIS) profiles with an amplitude of 5.00 mV from 105 to 10−2 Hz.


.
.
.
.
.
.
.
.
.
.
.
.
.
.
.
.
.
.
.
.
.
.
.
.
.
.
.
.
.
.
.
.
.
.
.
.
.
.
.
.


