
 Open Access Article
 This Open Access Article is licensed under a Creative Commons Attribution-Non Commercial 3.0 Unported Licence
A study on thermal behaviour of thermal barrier coating: investigation of particle size, YSZ/polysilazane, time and temperature curing effect†
Widyastuti *a,
Liyana Labiba Zulfab,
Wafiq Azhar Rizaldia,
Jauhari Azhara,
Ninik Safridaa,
Azzah Dyah Pratamaa,
Ruri Agung Wahyuonoc,
Sulistijonoa,
Rindang Fajarina and
Arif Nur Hakimd
*a,
Liyana Labiba Zulfab,
Wafiq Azhar Rizaldia,
Jauhari Azhara,
Ninik Safridaa,
Azzah Dyah Pratamaa,
Ruri Agung Wahyuonoc,
Sulistijonoa,
Rindang Fajarina and
Arif Nur Hakimd
aDepartment of Materials and Metallurgical Engineering, Faculty of Industrial Technology and Systems Engineering, Institut Teknologi Sepuluh Nopember, Jl. Arif Rahman Hakim, Kampus ITS Keputih-Sukolilo, Surabaya 60111, Indonesia. E-mail: wiwid@mat-eng.its.ac.id
bDepartment of Chemistry, Faculty of Science and Data Analytics, Institut Teknologi Sepuluh Nopember, Jl. Arif Rahman Hakim, Kampus ITS Keputih-Sukolilo, Surabaya 60111, Indonesia
cDepartment of Engineering Physics, Faculty of Industrial Technology and Systems Engineering, Institut Teknologi Sepuluh Nopember, Jl. Arif Rahman Hakim, Kampus ITS Keputih-Sukolilo, Surabaya 60111, Indonesia
dNational Research and Innovation Agency, Tangerang 15314, Indonesia
First published on 6th August 2024
Abstract
Thermal conductivity and adhesion strength effects were studied for thermal barrier coatings (TBCs) with different particle sizes, YSZ content, time, and temperature curing. The study involves three stages. The first step focuses on the characteristics of YSZ/polysilazane as the TBC, which is characterized using Scanning Electron Microscopy (SEM), Fourier Transform Infrared (FTIR), X-Ray Diffraction (XRD), and Thermal Gravimetric Analysis (TGA). The second and third steps assess thermal conductivity and adhesion strength based on variables such as particle size, YSZ/polysilazane, time, and curing temperature. Results show that there was a synergistic effect between particle size-YSZ content and time–temperature curing to obtain specimens with good thermal properties. SB270/70 showed the lowest temperature compared to other specimens, up to 160 °C. Furthermore, YSZ/polysilazane thermal conductivity and adhesion properties could be enhanced by a prolonged curing time and higher temperature. This study emphasizes that the modification of particle size, YSZ content, time, and temperature curing is a promising strategy to improve the thermal properties of TBCs.
Introduction
With the expansion of the aircraft transport industry, a greater number of aircraft engines have been built. Scientists have extensively researched the satellite-orbiting missile development program, particularly in developing the green aviation concept to reduce fuel consumption emissions and increase energy efficiency.1 One of the innovations to achieve the green aviation concept is by reducing the mass of air transport materials, which can reduce harmful pollutants such as carbon dioxide emissions and increase energy efficiency through operational improvements.2 Metallic materials such as aluminium and titanium are often used as substrates in the fabrication of air transport skins.3–5 However, due to its susceptibility to corrosion and fatigue failure and its heavy mass, the use of metallic materials is beginning to be abandoned and switched to lighter and corrosion resistant materials.6,7 The development of materials with light mass and good thermal resistance is the reason for the increased interest in studying them as a skin plane substrate for applying the concept of green aviation in aerospace.8 Boyer et al. succeeded in 2015 in applying polymeric materials as the framework of aircraft, including the fuselage, wings, and parts of the aircraft skin, to reduce the mass of the aircraft by 20% and save fuel consumption by up to 12%.9Carbon Fiber Reinforced Polymer (CFRP) is a composite material commonly applied as a substrate in the aerospace field due to its advantages over metals such as lightness, high strength, low thermal expansion, and good corrosion resistance.10–12 However, the presence of carbon, which is a dielectric material, can interfere with radar wave transmission. On the other hand, CFRP does not have good resistance at high temperatures because it is composed of an organic polymer matrix that can decompose at a temperature of about 250 °C and when exposed to higher temperatures, the degradation of the composite mass will occur.13 In fact, the operating process in aerospace systems shows an increase in the temperature of the atmosphere up to 1400 °C.14 Furthermore, the low electrical conductivity value of CFRP, in comparison to metallic materials, contributes to its limited capacity when exposed to lightning.15 Lightning will affect structural changes such as aircraft skin cracks and delaminations. Thus, a method is needed to produce aircraft skin using CFRP substrate with good thermal resistance and thermal properties when shaking at high temperatures, as well as dealing with lightning to maintain good efficiency.
Thermal barrier coating (TBC) is a method of thermal protection by depositing ceramic material onto a protected substrate material.16 The TBC process requires certain treatments to be applied to composite substrates, such as producing ceramics with a thin coating method and heat resistance. Luangtriratana, et al. (2015) reported the use of TBC with different types of ceramic particles on a Glass Fiber Reinforced Polymer (GFRP) substrate using the roll coating method.17 In 2019, Golewski et al. successfully coated CFRP using Yttria Stabilized Zirconia (YSZ) as TBC using the high velocity oxygen fuel (HVOF) and atmospheric plasma spraying (APS) methods, demonstrating good thermal resistance properties.18 The curing process is one of the main aspects that could directly affect the composite's performance in HVOF and APS methods. Rossi et al. (2019) investigated the effect of curing temperature on the polysilazane coating process on aluminium substrates at 80, 130, 180, and 230 °C. Because the curing process was conducted below the glass temperature of the polysilazane, which prevented the curing process from proceeding, the 80 °C curing temperature yielded different outcomes than the others. Furthermore, increasing the curing temperature can improve the resilience of the polysilazane coating on the substrate.19 Research on the effect of temperature was also reported by Xinjie (2021) on silica fume, cement, and fly ash coatings. The temperature ranges employed were 5, 20, 35, 50, 65, and 80 °C, with the higher the curing temperature, increasing adhesion and decreasing thermal conductivity due to the increased number of pores created.20 Besides, Liu et al. (2020) analyzed the impact of curing time on polysilazane coatings on polycarbonate substrates with variations in curing times of 1, 24, 72, and 168 h. The increase in curing time results in an increase in maximum coating hardness. Thus, the longer the curing process, the greater the adhesion properties of the substrate and the formation of an oxygen bridge between the polysilazane layer and the substrate.21 However, the use of TBC to protect CFRP from high temperature friction still shows less efficient performance. Both the particle size and the YSZ/polysilazane ratio are critical parameters that must be considered during the coating process. Hu et al. (2017) was demonstrated that reducing the size of the YSZ particles deposited on the aluminum substrate by the plasma spray technique leads to a decrease in the thermal conductivity of the material.22 These results are also consistent with the previous research that particle size of approximately 45–60 μm has an effect on pore formation that is related to the resulting density value.23 The YSZ/polysilazane ratio is another important factor that affected the coating performance of the TBC system. Barroso et al., (2015) successfully coated YSZ filler and ZrSi2 with polysilazane as a binder. Extremely low thermal conductivity and reduced mass loss are the outcomes. Despite this, the adhesive strength obtained remains quite modest.24
Polysilazane is an organic polymer compound with a primary chain consisting of a Si–N–Si backbone. It also has several side groups, such as –H, –CH3, and –CH![[double bond, length as m-dash]](https://www.rsc.org/images/entities/char_e001.gif) CH2, attached to the Si and N atoms.25 Several researchers have proposed practical modifications, such as altering the particle size and modifying the specimen. Zhan et al. reported the moisture-curable polysilazane coatings that may cure at room temperature. These coatings showed excellent hardness and a high level of hydrophobicity.26 Thus, the polysilazane coating showed promise as a viable coating on CFRP. The YSZ/polysilazane combination plays an important role in the field of thermal barrier coating. YSZ/polysilazane has a low thermal conductivity, making it an excellent insulator for resisting thermal diffusion to CFRP.27 This condition can increase the role of YSZ/polysilazane as TBC in a system. It is worth mentioning that optimizing specimen conditions, such as curing time, temperature, and particle size, is an important step that has practical implications for increasing the thermal capacity of the YSZ/polysilazane as a thermal barrier coating.
CH2, attached to the Si and N atoms.25 Several researchers have proposed practical modifications, such as altering the particle size and modifying the specimen. Zhan et al. reported the moisture-curable polysilazane coatings that may cure at room temperature. These coatings showed excellent hardness and a high level of hydrophobicity.26 Thus, the polysilazane coating showed promise as a viable coating on CFRP. The YSZ/polysilazane combination plays an important role in the field of thermal barrier coating. YSZ/polysilazane has a low thermal conductivity, making it an excellent insulator for resisting thermal diffusion to CFRP.27 This condition can increase the role of YSZ/polysilazane as TBC in a system. It is worth mentioning that optimizing specimen conditions, such as curing time, temperature, and particle size, is an important step that has practical implications for increasing the thermal capacity of the YSZ/polysilazane as a thermal barrier coating.
Based on previous studies' analyses, no further research has been conducted on the application of YSZ and polysilazane with a thin coating technique on CFRP for TBC. Thus, this study focused on the preparation of CFRP substrates, replacing metal coated by YSZ/polysilazane into homogeneous material. Analysis of the effect of particle size and composition, as well as adhesion to increase the thermal conductivity and mechanical properties of the resulting composite, will be explained in detail. The coating's characterization is performed to determine its effectiveness. Thermal torch tests are performed to determine the thermal conductivity. Furthermore, an analysis of the composite's structural resistance after heat treatment was performed to determine the effectiveness of the composite's expansion in covering the resulting damage and cracks.
Experimental
Materials
A YSZ ceramic with 8% yttria (Saint-Gobain, Merck, 99.9%) with a melting point 2700 °C was used a bond coating in composite. Carbon fiber (HDC524-3K, PT Justus Kimiaraya Indonesia, 99%) were used as CFRP substrates. Polysilazane (Durazane 1800, Merck, 99%) was applied as binder and the ceramic coatings on YSZ. Dicumyl peroxide (Sigma-Aldrich, 98%) was used as initiator in polysilazane cured. Epoxy LP1Q (Indonesia) was applied as matrix in composite synthesis. MEPOXY (Indonesia) and Cobalt N 6% (Indonesia) was applied as hardener.Synthesis of materials
![[thin space (1/6-em)]](https://www.rsc.org/images/entities/char_2009.gif) :30, 60:40 and 50:50) as well as variations of particle size (140, 200 and 270 mesh or equivalent with 105, 74, and 53 microns) using a sieve for 60 minutes at room temperature until a ready slurry is obtained and poured on the prepared composite CFRP surface. The slury that has been poured is then aligned using the doctor blade coating, followed by the adjustment of the distance between the substrate and the blade of 300 μm. The resulting material is then quantified with SB (particle size variation)/(composition variation) (Table 1). After obtaining optimal conditions of YSZ and polysilazane then performed analysis of the influence of temperature (130, 160 and 190 °C) and freezing time (60, 120 dan 180 min). The resulting specimen is then quoted as TB (time variation/temperature variation) (Table 2).
:30, 60:40 and 50:50) as well as variations of particle size (140, 200 and 270 mesh or equivalent with 105, 74, and 53 microns) using a sieve for 60 minutes at room temperature until a ready slurry is obtained and poured on the prepared composite CFRP surface. The slury that has been poured is then aligned using the doctor blade coating, followed by the adjustment of the distance between the substrate and the blade of 300 μm. The resulting material is then quantified with SB (particle size variation)/(composition variation) (Table 1). After obtaining optimal conditions of YSZ and polysilazane then performed analysis of the influence of temperature (130, 160 and 190 °C) and freezing time (60, 120 dan 180 min). The resulting specimen is then quoted as TB (time variation/temperature variation) (Table 2).
| Particle size (mesh) | YSZ composition | Specimen code |
|---|---|---|
| 140 | 50 | SB140/50 |
| 60 | SB140/60 | |
| 70 | SB140/70 | |
| 200 | 50 | SB200/50 |
| 60 | SB200/60 | |
| 70 | SB200/70 | |
| 270 | 50 | SB270/50 |
| 60 | SB270/60 | |
| 70 | SB270/70 |
| Freezing time (min) | Temperature (°C) | Specimen code |
|---|---|---|
| 60 | 130 | TB60/130 |
| 160 | TB60/160 | |
| 190 | TB60/190 | |
| 120 | 130 | TB120/130 |
| 160 | TB120/160 | |
| 190 | TB120/190 | |
| 180 | 130 | TB180/130 |
| 160 | TB180/160 | |
| 190 | TB180/190 |
Characterization
The crystallinity of material synthesized were analyzed by X-ray diffraction at range 5–50° using Philips X'Pert PN-1830 X-ray (Bridge Tronic Global Inc, USA), with Cu Kα radiation (λ = 15406 Å), at a voltage of 40 kV and current of 30 mA. The bonding structure material synthesized were analyzed FTIR using 8400S SHIMADZU (Shimadzu, Japan) at wavenumbers of 400 to 4000 cm−1. Morphology and element distribution of material synthesized were analyzed by Scanning Electron Microscopy-Energy Dispersive X-Ray (SEM-EDX) images were taken using Zeiss EVO MA10 (Zeiss, Germany). The magnification used varies from 70–500× at a voltage of 2 V. EDX is used to determine the distribution of the elements carbon, nitrogen, oxygen, silicon, and phosphorus. The thermal stability of material composites was determined by thermogravimetric analysis (TGA) using the PerkinElmer Pyris 1 Analyzer (PerkinElmer, America) in the range of 30–900 °C with a heating rate of 10 °C min−1 under an air atmosphere (approximately ± 10 mg of the as-synthesized samples). The thermal conductivity of material composites was studied using quick thermal conductivity meter (QTM-500, Japan). The force required to pull a specified diameter of coating away from its substrate was studied using Portable Adhesive Tester Type II based on the ASTM D4541 standard. The density of each specimen was calculated in kg m−3 using the usual approach (ASTM D792) by determining the weight of the original sample before and after being submerged in water. The thermal torch properties were tested on the specimen's surface. A thermocouple is placed in front of and behind the specimen to measure the temperature of the front and back of the specimen. First, the burner is turned on until it has reached the desired temperature. The specimen is then locked in the holder and the specimen is tested for 120 s at a distance of 45 mm. Thermal conductivity was calculated using QTM-500 using hot wire/probe method. Specimens cut to size 110 × 50 mm are heated to a temperature of 10 °C for 1 minute and then proceed to calculate the average conductivity of 10 test points.
Adhesion strenght
Adhesion experiment has grown in popularity as a way of determining the strength of coatings and substrates CFRP. The quantitative pull-off test using ASTM D4541 is one of the most prominent methods for studying the adhesion strength. This test starts with sample preparation and cutting to 110 × 30 mm. Then fix the dolly to the surface of the sample using glue until it dries, followed by placing a pulling tool on the dolly. Then pull the dolly with a force perpendicular to the surface to remove the dolly and coating from the substrate.Results and discussion
Characterization of materials
The selection of specific particle sizes for YSZ ceramics and HDC524-3K carbon fibers is based on optimizing the composite materials mechanical and thermal properties. Furthermore, maintaining uniformity in particle size is essential to guaranteeing the composite's consistent behavior and performance. Particle size has an impact on processing efficiency during the mixing and molding process stages. Small particles can be more easily dispersed in the matrix, making the mixture more homogeneous. Smaller particle sizes increase the surface area, enhancing the interaction between ceramic particles and the matrix and leading to increased mechanical strength and thermal stability. Studies have shown that reducing particle size can significantly improve the mechanical properties of ceramic composites.29 In the selection of YSZ particle sizes ranging from 40–100 μm, improvements in the sintering and densification processes result in increased mechanical strength and ionic conductivity, which are very important for applications such as thermal barrier coatings and solid oxide fuel cells.19 In a study conducted by Huang Jibo on the effect of YSZ particle size with the plasma sprayed coating method, using YSZ powder with different particle size ranges (15–25 μm and 45–60 μm), it was found that the coating made of coarse particles had a higher thermal shock life compared to that made of fine particles.30 The effect of particle size impacts the structure and orientation of the pores; the coating of coarse particles forms almost the same number of horizontal and vertical pores, while the coating of fine particles mainly forms horizontal pores parallel to the substrate. The size of the CFRP carbon fibre is selected to balance reinforcement efficiency and processability. Additionally, it affects the efficiency of load transfer and mechanical properties such as tensile strength and modulus.19 Larger fibres provide better reinforcement, but very large fibres can hinder the mixing and curing process. Smaller and well-distributed fibres provide more uniform reinforcement, increasing the overall strength and durability of the composite.The composite's composition is carefully chosen to balance mechanical strength, thermal stability, and processability in accordance with the final properties desired.29 A specific weight percentage in YSZ ensures adequate reinforcement while maintaining the composite's processability. Optimal composition is based on previous studies that show the best performance at specific weight percentages.31 In selecting the percentage of Polysilazane Durazane 1800 is chosen because it balances the composite properties with the ability to form ceramic matrices after heating, providing excellent thermal stability.32 To achieve specific functional properties like thermal stability, mechanical strength, and preservation behavior, we choose the material composition, which includes the type and amount of polysilazane and dicumyl peroxide.29 Additionally, using Polysilazane Durazane 1800 in a specific composition provides resistance to environmental degradation. For example, adding 1 wt% dicumyl peroxide to polysilazane aids cross-linking, increasing thermal stability and mechanical properties. The combination of dicumyl peroxide with LP1Q epoxy resin and specific hardeners (MEPOXY and Cobalt N 6%) is chosen to balance curing speed, mechanical properties, and thermal stability. Peroxide initiates the polymerization reaction, ensuring comprehensive and controlled epoxy resin curing while also improving mechanical properties and chemical resistance. Moreover, the optimal percentage selection can affect the strength and durability of the composite structure.33
Curing conditions are optimized through a series of preliminary experiments to ensure the best possible performance of the composite material. The selected curing temperature and time are critical to initiating the desired cross-linking reaction without compromising the material properties. This selection must consider the kinetics of the polymerization reaction and the desired mechanical properties. For example, curing times ranging from 90 to 120 °C are used in epoxy and polysilazane matrices to produce strong and thermally stable composites.29
The curing time is chosen to allow sufficient time for the complete reaction of all components, ensuring uniform and complete curing.34 Curing under controlled atmospheric conditions (e.g., inert atmosphere) is necessary to prevent oxidation and other side reactions that can compromise the material properties.30 For Epoxy LP1Q material with hardener, curing conditions are selected based on the desired mechanical properties and the specific application. Higher temperatures can accelerate the curing process and increase the cross-linking density, which improves mechanical strength and thermal stability. However, excessively high temperatures can cause thermal degradation. Specific hardeners can also affect the curing process, impacting the epoxy resin's final glass transition temperature and mechanical properties.
Optimization of particle size and YSZ/polysilazane composition
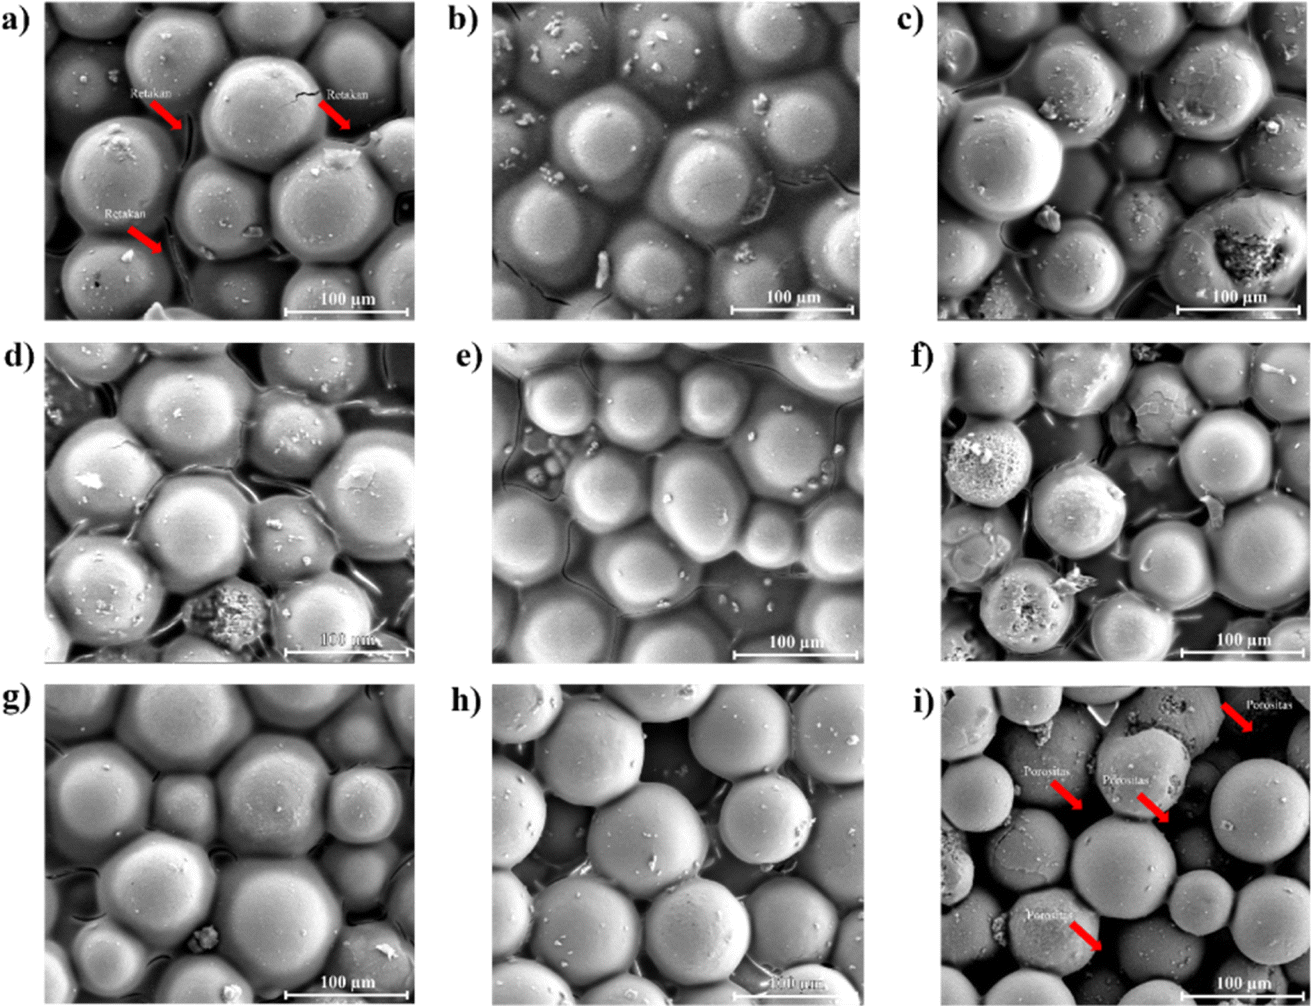
Fig. 1b displays the cross-section of the YSZ/polysilazane (TBC) composite. The composite is composed of a black laminar-shaped CFRP and a white YSZ-polysilazane composite layer positioned on top of the CFRPs. The TBC composite coating has been visually prepared effectively, as evidenced by the complete coverage of the CFRP surface with the TBC composite (Fig. 1a). The morphology of the composite samples with variations in mesh size and composition is shown in Fig. 2. All of the samples showed a spherical shape with no aggregation.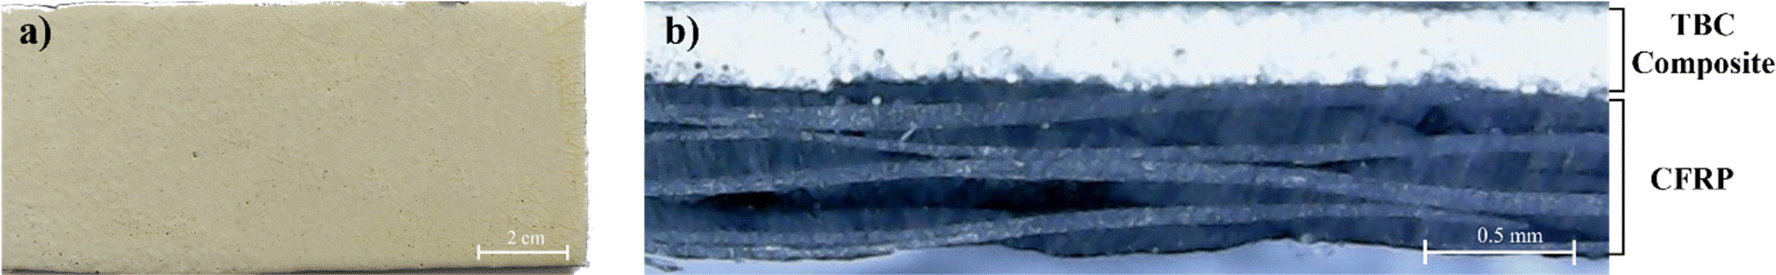 | ||
| Fig. 1 (a) YSZ/polysilazane TBC composite visual. (b) Cross-section of YSZ/polysilazane composite. | ||
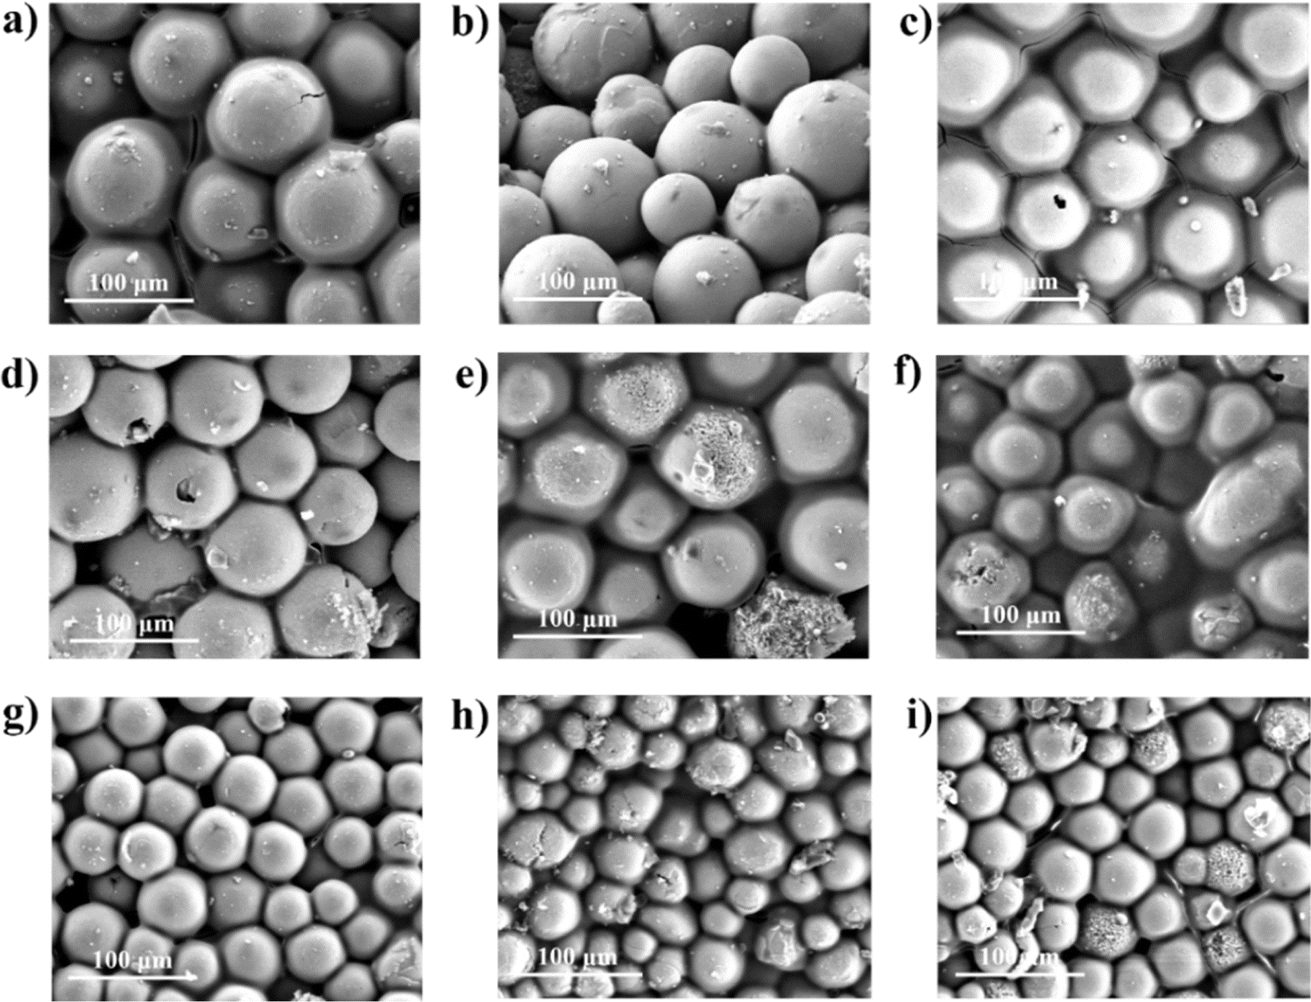 | ||
| Fig. 2 Specimen surface morphology (a) SB140/70, (b) SB140/60, (c) SB140/50, (d) SB200/70, (e) SB200/60, (f) SB200/50, (g) SB270/70, (h) SB270/60, (i) SB270/50. | ||
Using a large mesh size resulted in a decrease in particle size, as demonstrated by SB270, which had the smallest size, and SB200 and SB140, which had medium to largest particle sizes. The smaller the particle size, the easier it is to form porous composites due to the high spatial arrangement flexibility required to produce a pore.35 In addition, variations in composition showed significant morphological differences, with specimens with a composition of 70/30 producing the most pores compared to other variations due to the existence of polysilazane that does not cover the entire surface of the CRFP, leaving still pores on the composite layer. Meanwhile, the 50/50 composition tends to be a denser composite due to the abundance of polysilazane content, which can cause crack formation. The higher the polysilazane content, the more polysilazane fills the empty substrate surface of CFRP, leading to the closure of YSZ pores and the formation of a non-porous composite.24
The cross-sectional morphology of the SB140/70 specimen (Fig. S1†) shows that the thickness of the YSZ/polysilazane layer on the CFRP substrate during the coating process is 358.4 μm. This result is thicker than previous studies that had only a 30 μm layer thickness on CFRP substrates.36 This high thickness has a positive effect on reducing the thermal conductivity of the material, such as producing good thermal insulation to protect CFRP through an optimal heat distribution process. Furthermore, porosity was clearly visible on the YSZ/polysilazane cross-section, which corresponds to the previous morphological analysis. Porosity can also be correlated with the density of the specimen. Low density indicates that there is a lot of free space available, which can be analogous to porosity being formed more and more. Furthermore, the density of the composite YSZ/polysilazane is determined by its fractional density and porosity. Table 3 shows that the more polysalzane, the higher the density of the composite that affects the porosity reduction.37,38 This phenomenon is caused by the success of polysilazane in binding YSZ composite, which produces a denser material with fewer pores on the coating layer. Low porosity is associated with higher conductivity (Table 8) and can also cause cracking.39,40
| Specimen | Density (kg m−3) |
|---|---|
| SB140/70 | 7.4602 |
| SB140/60 | 9.1311 |
| SB140/50 | 12.6812 |
| SB200/70 | 7.1531 |
| SB200/60 | 10.0211 |
| SB200/50 | 10.8959 |
| SB270/70 | 6.8185 |
| SB270/60 | 8.6913 |
| SB270/50 | 10.5705 |
Furthermore, the porosity of a composite is also affected by the particle size, as indicated in Table 3. Increasing the size of particles leads to a decrease in porosity, since larger particles may completely fill the available area, resulting in a reduced number of pores.
The EDX characterization aims to determine the composition of the specimen and the distribution of the elements present on each specimen, as shown in Fig. S2† and Table 4. Based on Fig. S2† and Table 4, each specimen indicates the presence of carbon, nitrogen, oxygen, silicon, and phosphorus derived from the precursor used, and the fact that no other elements were found indicates that the specimen does not contain impurities. The existence of the silicone explains that there is a solid layer of SiO2 and found that the increase in the silicon indicates the amount of oxygen bridges between polysilazane increases.
| Specimen | Element (% wt) | ||||
|---|---|---|---|---|---|
| C | N | O | Si | P | |
| SB140/70 | 14.68 | 5.05 | 30.24 | 11.07 | 38.96 |
| SB140/60 | 16.53 | 4.79 | 34.40 | 11.03 | 30.43 |
| SB140/50 | 15.60 | 5.41 | 25.71 | 27.85 | 25.34 |
| SB200/70 | 13.08 | — | 27.33 | 26.81 | 32.79 |
| SB200/60 | 16.80 | — | 24.16 | 25.49 | 33.54 |
| SB200/50 | 13.29 | 6.54 | 29.91 | 15.17 | 22.14 |
| SB270/70 | 14.34 | — | 26.56 | 39.70 | 19.41 |
| SB270/60 | 15.09 | — | 26.09 | 35.81 | 23.01 |
| SB270/50 | 13.31 | 3.12 | 29.11 | 30.15 | 24.32 |
On the other hand, the presence of nitrogen is found in all specimens with a composition of 50/50, this is caused by the curing process on the polysilazane, which releases ammonia.24
XRD analysis was performed to see the crystalline phase formed on each specimen. The highest intensities in the YSZ/polysilazane 70/30 composite with 140, 200 and 270 mesh, respectively, are at 2θ = 30.1421, 30.1753 and 30.1421° which are characteristic of the tetragonal YSZ phase, while the moderate to low intensities originate from small phases such as monoclinic, tetragonal, and cubic ZrO2 (Fig. 3). The existence of the tetragonal YSZ phase indicates the high stability of YSZ when exposed to high temperatures compared to other phases.41
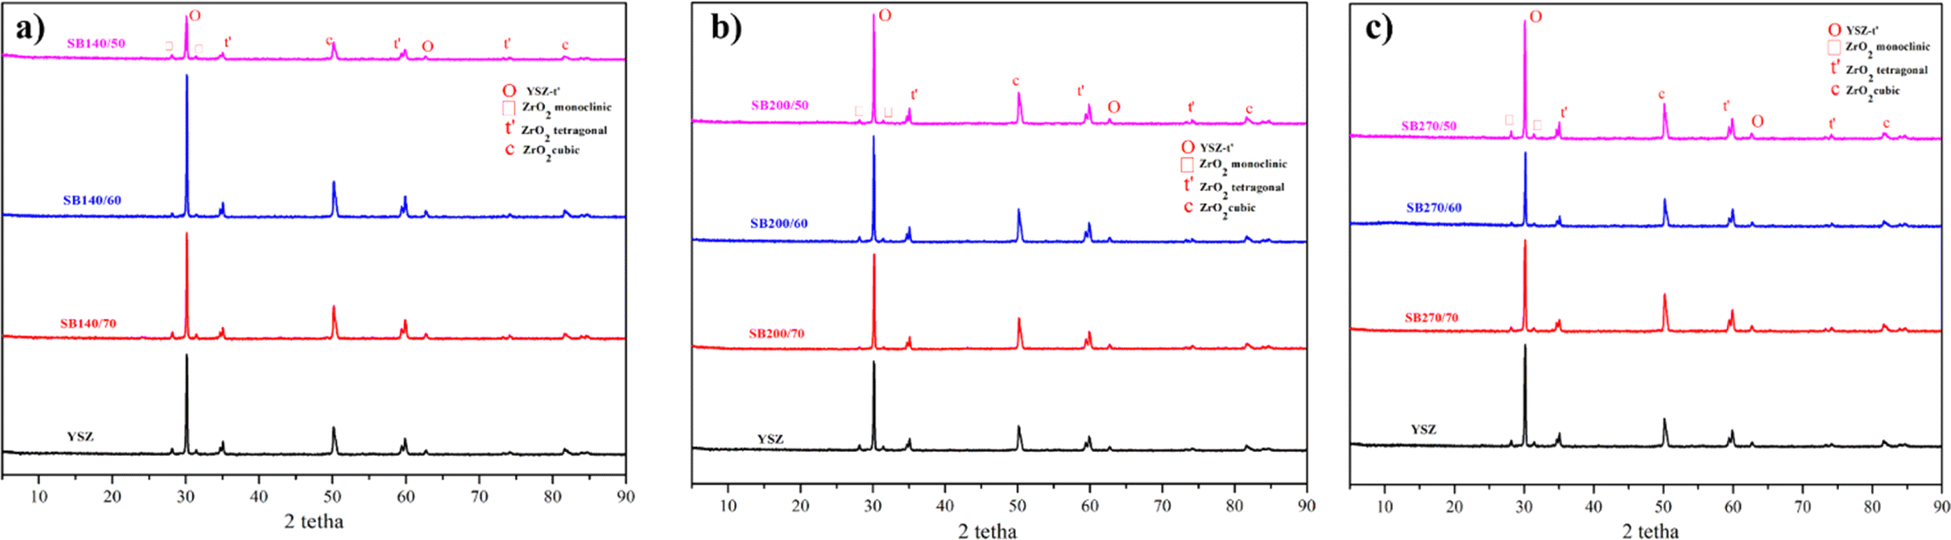 | ||
| Fig. 3 Diffractogram of (a) 140 mesh, (b) 200 mesh, (c) 270 mesh. | ||
Fig. 3 shows that there are two phases in ZrO2, namely t-ZrO2 is the phase required in the coating process and m-ZrO2. The presence of the m-ZrO2 phase is evidenced by the emergence of a strong peak at 30° relative to the (111) crystal lattice.42
Meanwhile, a weak t-ZrO2 phase is present in the region around 70° with the (004) and (400) crystal lattice planes.43 The appearance of two phases of ZrO2 is caused by the polymorphism in the YSZ composite. The presence of many peaks suggests that YSZ exhibits polymorphism. Zirconia, in its pristine form, has distinct phases that vary with temperature fluctuations. The phase will be monoclinic at room temperature, up to 1000 °C. Above 1000 °C, it will start to change into a tetragonal phase. A cubic phase will replace the tetragonal phase when the temperature reaches 2370 °C.44
Polymorphism can disrupt the function of TBC through changes in volume that can cause internal stress as well as the beginning of the appearance of cracks in a composite.45,46 However, polymorphism can also be used to determine the value of stresses and dislocations formed during the coating process. The results of the analysis of stresses and dislocation values are shown in Table 5. The largest tetragonal dislocation of ZrO2 occurs in the SB140/50 specimen with a linear dislocation value of 4572.91 cm, which allows for crack at high temperatures that correlate with the appearance of cracks on SEM morphology. Meanwhile, SB270/70 has the lowest linear dislocation of 2.42 cm, which is correlated with lower cracking in the SEM image (Fig. 2g). The larger particle size results in a larger area dislocation precisely on the SB140/50 specimen with a dislocation value of 12027 cm. This condition is due to the presence of a stable monoclin phase only at room temperature, so that at high temperatures dislocation occurs, which causes cracks on the composite.47
| Specimen | Strain | Area dislocation (cm2) | Linear dislocation (cm) |
|---|---|---|---|
| SB140/70 | 0.00269 | 1.63 × 10¹¹ | 3757.50 |
| SB140/60 | 0.00261 | 1.54 × 10¹¹ | 3550.76 |
| SB140/50 | 0.00303 | 1.9 × 10¹¹ | 4572.91 |
| SB200/70 | 0.00211 | 1.01 × 10¹¹ | 2319.46 |
| SB200/60 | 0.00242 | 1.32 × 10¹¹ | 3051.19 |
| SB200/50 | 0.00207 | 9.73 × 10¹⁰ | 2244.59 |
| SB270/70 | 0.00006 | 1.04 × 10⁸ | 2.42 |
| SB270/60 | 0.00225 | 1.14 × 10¹¹ | 2636.37 |
| SB270/50 | 0.00234 | 1.24 × 10¹¹ | 2860.89 |
After each specimen is characterized, proceed to thermal torch testing on the SB140/70 specimen through direct burning for 2 minutes. In the first minute, the specimens showed good ability to withstand fire directly, without any defects appearing on the specimen. Once the first minute has passed, exposure to fire causes the specimens to discolor to black, which is followed by the detachment of the coating surface. However, at the end of the test, a coating layer on the substrate surface was still detected. Fig. 6 shows the diffractogram and morphology of the specimen after the thermal torch test was performed. According to the diffractogram obtained after the thermal torch process (Fig. 4a), no monoclinic ZrO2 phase was caused by the complete phase transformation to tetragonal ZrO2. Theoretically, above 600 °C, a phase transition from monoclinic to tetragonal ZrO2 occurs based on the stability of the ZrO2 phase at a certain temperature level.48 The thermal torch process at a temperature of 1000 °C can still maintain the morphology of the SB140/70 specimen, which indicates that the specimen has good thermal stability (Fig. 4c). In addition, the thermal torch process still leaves polysilzane on the surface of the CFRP substrate, which indicates the adhesion of the coating layer to the substrate quite well when exposed to high temperatures. Although it has a similar morphology, there is a reduction in particle size between the specimens before and after the thermal torch. This is because when a specimen is exposed to heat, each particle tends to fill the pores, resulting in a reduction in particle size. In addition, the decreasing particle size results in an increase in adhesion force, so the surface morphology of the sample is not as smooth as before the thermal torch was applied.49 The thermal stability of the specimen is characterised using TGA. Fig. 5 shows a decrease in mass that occurs at two steps. The weight loss on the first step on the particle size variation thermogram (Fig. 5a), occurs as polysilazane undergoes a transition from a polymer state to an amorphous ceramic form that begins at a temperature of about 125 °C with the process of elimination of oligomers.
 | ||
| Fig. 4 (a) Diffractogram after thermal torch test. Macro and micro images (b) before (c) after the thermal torch test was performed on the SB140/70 sample. | ||
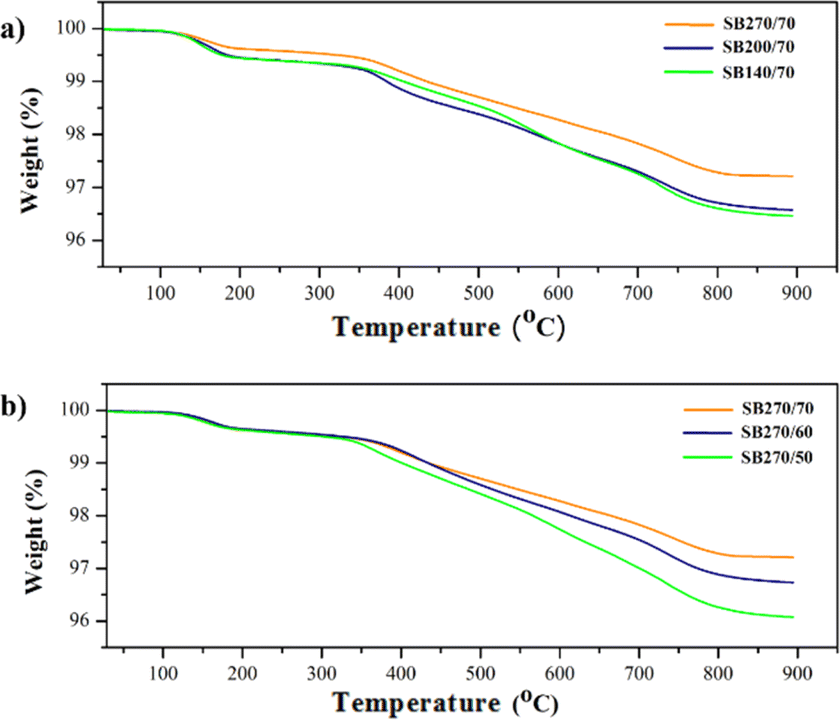 | ||
| Fig. 5 Thermogram (a) variations in particle size for the YSZ/polysilazane 70/30 (b) variations for the YSZ/polysilazane composition for a particle size of 270 mesh. | ||
The decreasing of weight is accompanied by the release of gases NH3, CH4, CO2, and H2O. The second decrease in weight occurs as a result of the appearance of pyrolysis products due to the first decreases in mass such as Si, N, C, and O derived from the formation of amorphous ceramics.24 The SB270/70 specimen has the best thermal stability with a weight loss rate of 2.79% due to its small particle size.
On the other hand, the thermogram of composition variation showed that the more polysilazane in the specimen, the greater the decrease in weight due to the removal of oligomers through gas release (Fig. 5b). The occurrence of a strong exothermic reaction between the evaporation of oligomers from polysilazane supports a large mass decrease.50 Specimen SB270/50 has the largest weight loss of 3.92% compared to other specimens due to the presence of abundant polysilazane. Based on the thermogram in Fig. 5, the activation energy that occurs during the phase transition process can be determined using the following equation:51
| k(T) = Ae−Ea/RT | (1) |
High activation energy indicates increasing instability, which makes the phase transition from monoclinic to tetragonal easier. The results of this calculation are in agreement with the diffractogram on the SB140/70 indicating the highest dislocation values, and the SB270/70 produces the lowest dislocations due to the ease of the resulting phase transformation. The thermogram shows stability after reaching a temperature of 900 °C, which indicates the phase transformation from monoclinic to tetragonal has been completed and a stable bond has been formed.
Effect of time and temperature cured on characteristic composite
The FTIR spectra of polysilazane show an absorption band at around 3380 and 1168 cm−1, which is contributed by the N–H functional groups (Fig. 6). As curing time and temperature increase, the intensity of the absorption band decreases due to the formation of ammonia compounds from a reaction with H2O physically bonded to the composite's surface. Bands in the wavenumber around 2143 and 870 cm−1 were recorded as the Si–H and Si–N–Si functional groups.52 | ||
| Fig. 6 FTIR spectra of YSZ/polysilazane (a) 130 (b) 160 and (c) 190 °C. | ||
The adhesion of polysilazane to CFRP substrates is enhanced by the presence of Si–H and Si–N functional groups, which facilitate the formation of Si–O–Si oxygen bonds.53 Polysilazane was successfully converted into SiO2, as evidenced by the presence of the Si–O–Si functional group at a wavenumber of about 1022 cm−1,52 with the most obvious absorption at a curing temperature of 130 °C and a curing time of 60 minutes, to be precise.
The formation of SiO2 ceramics occurs with increasing curing time and temperature due to oxygen bridges that form cross-links through the continuous release of NH3 and H2 gases, removing nitrogen from the polysilazane structure.54 Furthermore, the interaction between oxygen and hydrogen atoms emanating from the N–H and Si–H functional groups during the interaction reduces the intensity of Si–O–Si as curing time and temperature are increased.27 The occurrence of absorption at wavenumbers around 1260, 2143 and 2900 cm−1 was attributed to the Si–CH3, Si–H and C–H functional groups.55 The FTIR spectra of the composite after the curing process show a decrease in intensity due to the dehydrogenation reaction and are a sign of a successful curing process.56,57
As shown in Fig. 7, the longer the curing time and temperature, the more small molecules like NH3, H2O, and H2 gas are released, and the more YSZ is seen in the polysilazane matrix. Both of these things lead to solidification, which creates pores in the YSZ/polysilazane composite.58 Fig. 9a shows that the TB60/130 specimen has the lowest number of pores due to the curing process not optimally releasing small molecules, resulting in low porosity. Moreover, the TB60/130 specimen exhibits more visible cracks than other specimens, which can be attributed to the thermal conversion-induced mass shrinkage of polysilazane over a large area.59 The cracks that appear will disappear as curing time and temperature increase, as evidenced by the lack of cracks in the TB180/190 specimen (Fig. 9i). The absence of cracks in the TB180/190 specimen demonstrates that the cracks that appear will vanish as curing time and temperature increase. The process of crack removal is caused by increasing cross-linking in the composite, followed by pore expansion.60
 | ||
| Fig. 7 Specimen surface morphology (a) TB60/130, (b) TB60/160, (c) TB60/190, (d) TB120/130, (e) TB120/160, (f) TB120/190, (g) TB180/130, (h) TB180/160, dan (i) TB180/190. | ||
Fig. 8a depicts the cross-sectional morphology of the TB60/130 specimen, which has a thickness of 405.1 μm and a low porosity. The distribution of each specimen's elements is depicted in Fig. S3† and Table 6.
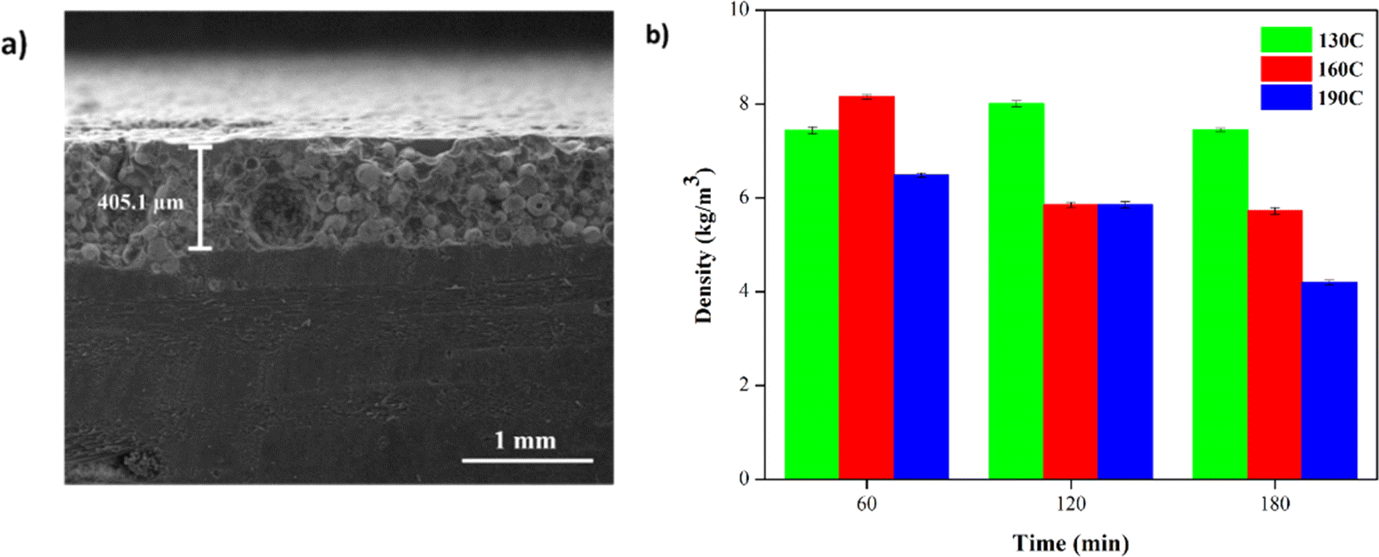 | ||
| Fig. 8 (a) Micro cross-section of YSZ/polysilazane composite TB60/130. (b) Density value of each specimen. | ||
| Specimen | Wt (%) | ||||
|---|---|---|---|---|---|
| C | N | O | Si | P | |
| TB60/130 | 14.68 | 5.05 | 30.24 | 11.07 | 38.96 |
| TB60/160 | 14.72 | — | 30.96 | 15.18 | 39.14 |
| TB60/190 | 12.38 | — | 30.21 | 29.98 | 27.43 |
| TB120/130 | 10.94 | 3.64 | 28.95 | 31.27 | 25.19 |
| TB120/160 | 16.14 | — | 27.09 | 30.61 | 26.16 |
| TB120/190 | 17.63 | — | 24.24 | 31.47 | 26.66 |
| TB180/130 | 14.82 | — | 29.35 | 31.48 | 24.34 |
| TB180/160 | 16.11 | — | 24.78 | 37.58 | 21.52 |
| TB180/190 | 12.96 | — | 28.50 | 38.34 | 20.21 |
Each specimen is composed of carbon (C), nitrogen (N), oxygen (O), silicon (Si), and phosphorus (P) derived from the precursor. Consistent with the previous discussion of the FTIR, as the curing time and temperature increase, the silicon element content increases and the nitrogen element content decreases. The contained elements, such as C, N, O, and Si, are the result of the polysilazane curing process that creates the amorphous ceramic SiO2.24
The density value of a specimen is utilized to indicate the precision of the specimen's pore presence and to validate SEM results. Fig. 8b depicts the density value of each sample, which varies according to curing time and temperature. A decrease in density value results from an increase in curing time and temperature, indicating that density value is inversely proportional to porosity.
The lower the density value indicates the compactness of a high specimen, which indirectly explains the low presence of pores in the specimen,61 and the specimen TB180/190 has the lowest density value at 4.15 kg m−3. Further examination of the TB60/130 reveals abnormalities consistent with the morphology in Fig. 8a.
Fig. 9 depicts the thermogram of the variation in curing time and temperature. In general, each thermogram has four zones. Zone I indicates that the process of weight loss has not yet taken place, but there is an anomaly in the TB180/160 that has undergone weight loss, possibly due to a failure during the curing process that has left small fractures. This result conforms to the morphology depicted in Fig. 9. This condition causes the TBC to fail to fully protect the CFRP, allowing the heat that touches the specimen's surface to swiftly move into the TBC, resulting in initial weight loss.
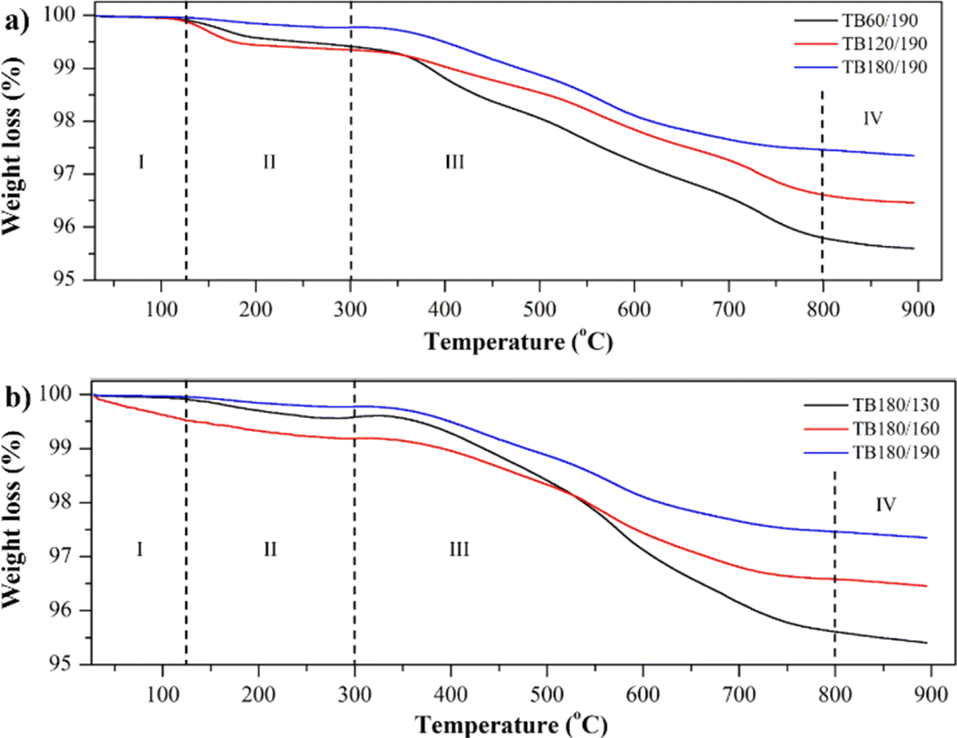 | ||
| Fig. 9 Thermogram (a) time curing (b) temperature curing variations. | ||
When entering zone II, weight loss begins between 130 and 300 °C. The weight loss in specimens TB60/190 and TB120/190 follows the same pattern of approximately 0.6%, which is a consequence of the incomplete curing process that produced NH3 through cross-linking. This reaction results in the evaporation of NH3 gas, which is concurrent with the solidification of polysilazane. Upon completion of the curing procedure, the TB180/190 specimen demonstrated a negligible decrease. Due to exothermic reactions and the evaporation of some polysilazane oligomers, each sample in zone III experienced a significant weight loss up to 800 °C.62 The bonding stability of polysilazane in the formation of SiO2 ceramics means that Zone IV doesn't change much. This means that the thermal stability of the YSZ/polysilazane composite is 800 °C. The TGA curve (Fig. 9) demonstrates the stability and low weight loss of the specimen. Compared to previous research using YSZ coated with (Ni, Pt)Al metallic 1, YSZ/Polysilzane showed more stable weight loss at high temperatures. These results show that using organic materials is more profitable than using inorganic materials.
The activation energy of the composite YSZ/polysilazane to undergo transformation can be determined using the slope of the thermogram curve Table 7. The specimens with the lowest and highest Ea values are TB180/190 (6.72 kJ) and TB180/130 (20.18 kJ). When Ea reaches 20 kJ mol−1, for instance, it is possible to produce ammonia gas at elevated temperatures.63 This circumstance can be attributed to the fact that the curing process at 130 °C was not conducted flawlessly, so TGA testing at high temperatures triggered the process to begin again. On other specimens, however, the process was already operating optimally, as indicated by a low Ea value.
| Specimen | Activation energy (kJ mol−1) |
|---|---|
| TB60/190 | 12.82 |
| TB120/190 | 6.79 |
| TB180/130 | 20.18 |
| TB180/160 | 8.30 |
| TB180/190 | 6.72 |
Analysis of thermal conductivity
The test of thermal conductivity is carried out to determine the properties of a material by measuring the amount of heat flowing on the surface of the material at a certain temperature (Fig. S4a and c†). Based on Fig. S4a,† the highest and lowest conductivity values were found in the specimens SB140/50 and SB270/70, with successive values of 0.2931 and 0.1584 W mK−1, respectively. Indicating that pores of different sorts with varying shapes have distinct impacts on the reduction of thermal conductivity.2 The proper combination of YSZ and polysilzane can produce low thermal conductivity values, so it is suitable when applied as a thermal barrier coating for CFRP surfaces.27The resulting thermal conductivity values correlated with the thermogram curve and TCM testing, which stated that the SB270/70 specimen had the lowest thermal conductivity and weight loss, while the SB140/50 specimen had the highest heat conduction and weight loss. The thermal conductivity values decrease as the curing time and temperature increase. According to Fig. S4c† the TB180/190 specimen exhibits the lowest conductance value of 0.1576 W mK−1.
This state can be attributed to the liberation of diminutive molecules, which exhibit heightened curing durations and temperatures, resulting in an increase in porosity. The presence of porosity leads to an elongation of the heat transfer path through the cell walls, in contrast to solid specimens lacking porosity. Consequently, this elongation causes a deceleration in the rate of heat transfer.64 Low thermal conductivity indicates that the coating layer is able to protect the CFRP substrate from heat passed on the surface of the specimen so that it does not cause weight loss on the specimens. High thermal conductivity signifies that the specimen is unable to withstand the heat that is applied to its surface, leading to a reduction in weight.65
The observed low thermal conductivity can be attributed to the results obtained from the thermal torch testing, as depicted in Fig. S4d.† The TB180/190 specimen has the lowest calculation temperature (107.03 °C) and experimental temperature (139 °C), which explains that the longer the time and temperature of curing, the improved insulation properties of the specimen.66 This observation suggests that increasing the curing time and temperature results in enhanced insulating qualities of the specimen. The study of the TB60/130 specimen's structural stability (Fig. 10) after being exposed to a thermal torch shows that within the first minute, the specimens fail against the applied heat, as shown by the fact that no failures were seen. This is supported by the similarity in morphology to the pre-thermal torch test condition. The morphological pattern changes noticeably after being exposed to a temperature of 613 °C for one minute. This causes the appearance to darken (Fig. 10), which shows that cratering failure has happened. The failure occurs due to the presence of bubble explosions or exothermic pores on the composite as the contact time increases.67 In addition, after passing through the thermal torch process, it is apparent that the resulting porosity has increased.
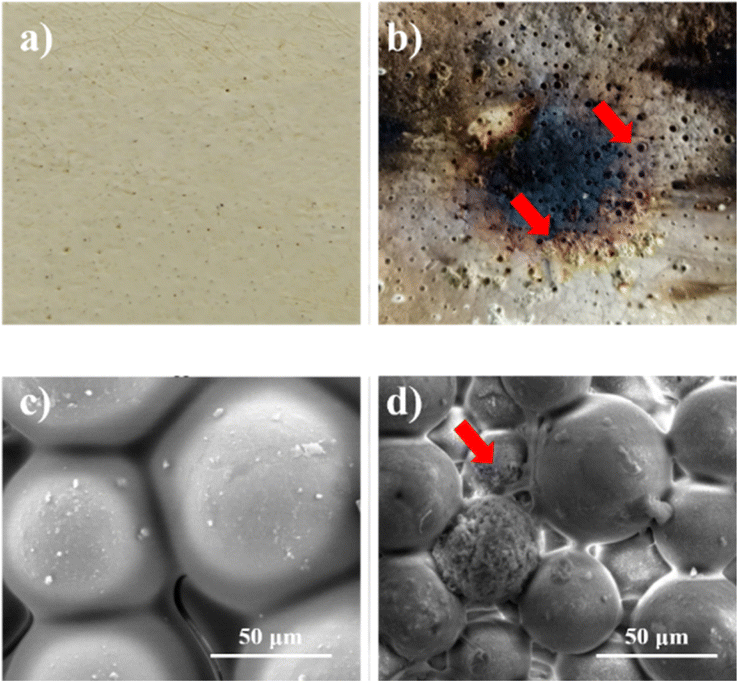 | ||
| Fig. 10 Camera visualization (a) before; (b) after and morphological image of (c) before; (d) after thermal torch testing. | ||
Particle size also affects the value of thermal conductivity. The smaller the particle size, the lower the thermal conductivity value caused by the ease with which the particles can move, resulting in a temperature rise through the phonon scattering mechanism.22,68 In addition, the composition of YSZ and polysilzane used also affects the thermal conductivity. The lowest to highest thermal conductivity values were found in the YSZ/polysilazane 70/30, 60/40 and 50/50 composites due to the presence of pores in the composite.
The higher the YSZ composition, the more pores are formed, resulting in a space that can reduce heat transfer due to the insulating properties obtained from the presence of air in the pores. This insulator property is due to the low air conductivity value of 0.24 W mK−1 which can minimize the amount of energy in the specimen.69,70 As the composition of polysilazane increases, the composition of YSZ decreases, leading to a reduction in the number of pores in the specimen. Increased polysilazane production produces more compact and dense specimens by increasing the effectiveness of binding with YSZ so that it covers the pores in YSZ. This condition leads to the efficient delivery of heat through the specimen, resulting in a high value of thermal conductivity. The SB270/70 specimen exhibited the lowest temperature of 160 °C when heated, indicating its superior insulating properties compared to all other specimens. The results of this test indicate that the coating process to protect CFRP has been successfully proven, with CFRP being resistant to high temperature heat exposure.
Analysis of adhesion strenght
Pull-off tests are performed to determine the value of TBC adhesion to the CFRP substrate shown in Fig. 11a and c. The performance of adhesion and cohesion during the pull-off test helps determine the value of TBC adhesion on the CFRP substrate.71 Based on Fig. 11a, for all compositional variations, it can be seen that the smaller the particle size, the higher the adhesion value due to the compactness of the specimens produced. The small particle size can remove the portion that is closed by the binder by increasing the area width, which can fix the bond formed between the filler and the binders and make it stronger. While, increasing particle size results in damage to the matrix through a decrease in the adhesive strength of the layer.72 Fig. 11c shows the range of adhesion strengths at time and curing temperature variations being between 0.57 until 0.74 MPa higher than in the previous study.73 Increased curing time results in an increase in adhesion resulting from the formation of Si–O–Si oxygen bridges that can increase TBC adherence to CFRP, the more Si–O–Si oxygen bridges generated, the better the curing value will be.26 These results are in accordance with the previous FTIR interpretation. On the other hand, increased curing temperature also affects the increase in adhesive value due to the faster process of transformation of polysilazane into amorphous SiO2 ceramics.19 Similar to the timing, an increase in clamping temperature leads to increased oxygen bridging, thereby enhancing the composite clamping strength of CFRP, a finding that aligns with the FTIR analysis in Fig. 6. On the other hand, the increased curing time and temperature resulted in a decrease in the adhesive.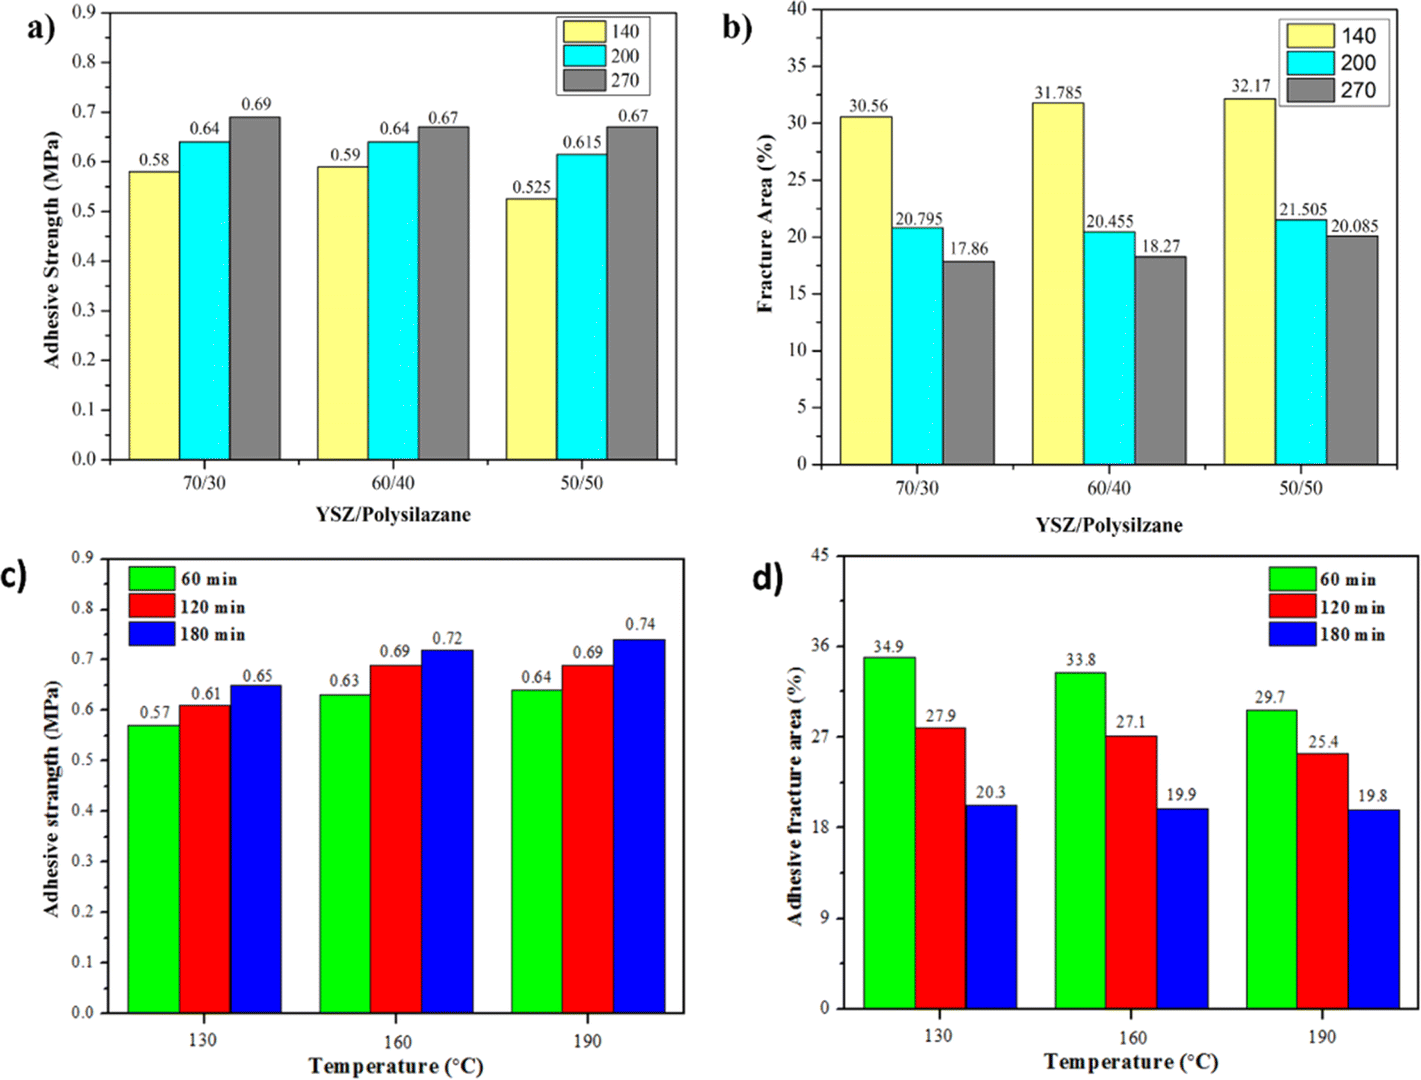 | ||
| Fig. 11 Adhesive strength of (a) particle size and YSZ/polysilazane variations (c) time and temperature curing, fracture area of (b) particle size and YSZ/polysilazane variations (d) time and temperature curing. | ||
Adhesive strength is also influenced by the composition of YSZ/polysilazane, the higher the YSZ composition of YSZ, the greater the increase in adhesive force caused by the compression of the reinforcer particles on YSZ when pulled by the dolly.74 Due to a lack of homogeneity, a decrease in the amount of YSZ leads to a decrease in the value of adhesive power. This means that the spread of binder between YSZ becomes low, which causes an interface bond that isn't at its strongest.75 This makes it easy for polysilazane to separate from the substrate layer. In addition, tests were conducted using Two Way ANOVA to study the influence of variation in particle size and composition of YSZ/polysilazane. The significance values obtained from the two-way ANOVA test on the sequential variation in composition and particle size of 0.126 > alpha (0.05) and 0.002 < alpha (0.05) indicate that the difference that occurred was insignificant. In addition, the variation in the time and temperature of the curing obtained a significance of 0.02 and 0.01, respectively, lower than the alpha (0.05), which indicates the existence of a significant difference in the value of the adhesive strength based on the time and temperature of curing.
The morphology of the fracture results after the pull-off test is shown in Fig. 12 and 13, which show that the fracture that occurs is an adhesive fracture between the YSZ/polysilazane coating layer and the adhesive layer on the dolly and a cohesive fracture on the coating layer. In Fig. 12, a cohesive fracture occurs in the yellow coating layer, where the remaining coating layer remains on the CFRP substrate. This indicates that the bond in the white coating layer, which is left on the CFRP and pulled by the dolly 75, is not strong enough to cause damage to both parts.76
 | ||
| Fig. 12 Pull-off test of (a) SB140/70, (b) SB140/60, (c) SB140/50, (d) SB200/70, (e) SB200/60, (f) SB200/50, (g) SB270/70, (h) SB270/60, (i) SB270/50. | ||
 | ||
| Fig. 13 Pull-off test of (a) TB60/130, (b) TB60/160, (c) TB60/190, (d) TB120/130, (e) TB120/160, (f) TB120/190, (g) TB180/130, (h) TB180/160, and (i) TB180/190. | ||
Meanwhile, on the CFRP substrate, which still contained remnants of the YSZ/polysilazane coating layer, the adhesion of the coating layer was found to be very good. On the other hand, the black part (misposition) shows the CFRP substrate without a coating layer, which indicates that the coating layer detaches from the surface of the substrate when pulled through the dolly. This phenomenon can be attributed to the low adhesion of the coating layer to the substrate. While the cohesive fractures found in Fig. 13 marked in white because they still leave some of the composite structures that are still covering the CFRP substrate, indicate that the bonds within the compound are weak and result in the occurrence of a fracture, this condition demonstrates that the high bond between the TBC composite and the CFRP substrate has excellent adhesive strength. On the other hand, the black part shows that the composite is completely separated from the CFRP substrate. This is due to adhesive fractures, which happen when the bond between the substrates and the TBC composite is not strong enough.
Fig. 11b shows an increasing trend for larger particle sizes and a decreasing YSZ composition, indicating that the low adhesive fracture area results in good adhesion strength of the TBC coating layer to the CRFP substrate. In addition, Fig. 11b also shows that the best adhesion is found in the specimen SB270/70270 mesh with a fracture area of 17.86%. Conversely, when the curing time and temperature were increased, a reduction in the adhesive fracture area was seen in relation to the reverse strength of the composite adhesion (Fig. 11d). The adhesive fracture area of the TB180/190 specimen is recorded to be 19.8%, indicating the lowest value among the specimens examined. The occurrence of adhesive fractures in lower regions leads to enhanced adhesiveness, preventing a decrease in the bonding strength between TBC and CFRP.78
Tabulation result
Table 8 indicates that the sample obtained from the YSZ/polysilazane coating on the CFRP substrate for the thermal barrier coating may provide thermal insulation up to a temperature of 368.18 °C. Given that the substrate employed is CFRP, it is crucial to ensure that the final temperature applied to the CFRP layer occurs prior to the point at which the CFRP undergoes damage as a result of degradation. Prior studies have demonstrated that CFRP has already undergone deterioration at a temperature of 238 °C. The aforementioned findings indicate that samples with a particle size of 140 mesh in all compositions fail to meet the heat resistance requirements of CFRP. Consequently, this modification can be utilised for coating composite materials designed for high temperatures.| Specimen | Density | Thermal conductivity (W mK−1) | Final temperature (°C) | Adhesive strenght (MPa) | |
|---|---|---|---|---|---|
| Theory | This study | ||||
| Standard | — | 0.44–0.04 (ref. 24) | 238 (ref. 77) | 0.3–1.5 (ref. 73) | |
| SB140/70 | 7.46 | 0.27 | 343.54 | 352 | 0.58 |
| SB140/60 | 9.13 | 0.26 | 340.68 | 328 | 0.59 |
| SB140/50 | 12.68 | 0.29 | 368.18 | 357 | 0.525 |
| SB200/70 | 7.15 | 0.17 | 188.91 | 217 | 0.64 |
| SB200/60 | 10.02 | 0.19 | 243.13 | 193 | 0.64 |
| SB200/50 | 10.89 | 0.24 | 311.13 | 326 | 0.615 |
| SB270/70 | 6.82 | 0.16 | 160 | 160 | 0.69 |
| SB270/60 | 8.69 | 0.19 | 233.94 | 208 | 0.67 |
| SB270/50 | 10.57 | 0.21 | 277.28 | 294 | 0.67 |
Limitations of the study
One limitation of this study is the YSZ/polysilazane composite data uncertainty. In a laboratory setting, the thermal behavior parameters have measurement uncertainty. On a laboratory scale, the thermal behavior of thermal barrier coating made with YSZ/polysilazane differs significantly from that on an industrial scale or in real field conditions. To obtain good performance, a variety of tests are carried out on a laboratory scale. Disruptive factors are also minimized to prevent errors. However, very specific controls are not possible on an industrial scale. More generally, in real-life situations, the environment has a highly fluctuating influence. However, we have tried to design a laboratory environment that is not much different from the industrial scale so that this research can be developed.Conclusions
In this study, the YSZ/polysilazane was successfully applied to the surface of the CFRP substrate using the thin coating method by going through curing. The results show that particle size, YSZ/polysilazane composition, time and temperature of curing have positive effects of their performance. Highly effective YSZ/polysilazane coating that may be applied to a CFRP substrate to improve thermal conductivity in aerospace transportation. The higher performance can be attributed to the presence of pores in the composite, increased time and temperature for curing the pores in composites were improved. The lowest thermal conductivity in SB270/70 is 0.1583 W mK−1 at 160 °C and adhesion values of 0.69 Mpa. Specimen with a curing time of 180 minutes at 190 °C yielded the highest adhesion strength of 0.74 MPa and the lowest thermal conductivity of 0.16 W mK−1, which, according to calculations, could reduce the temperature from 613 °C to 107.03 °C and, according to experiments, could reduce the temperature to 139 °C. These results indicate that the protection of CFRP with YSZ/polysilazane using the thin film method has proven effective in improving performance and may be a promising method for the development of aerospace composite materials.Despite the good thermal behavior of the optimized YSZ/polysilazane, there remain challenges and limitations to overcome. One of the main challenges is the accuracy of the sample specimen properties, as well as the synergy created by the interaction of the specimen and the environment (interface effects). In addition, addressing the complexity of the specimen layers, which give rise to various interactions in the thermal insulation process, is a challenge. Therefore, future research is needed that combines computational and experimental studies to obtain perfect specimen modelling so that some of the specimen weaknesses can be minimized. Moreover, future research should delve into the development of YSZ/polysilazane material as a thermal barrier coating, leveraging coating innovations with anti-oxidation materials and environmental sensors to enhance its practical application in the industrial realm. Furthermore, a thorough investigation is required to determine the industrial readiness of YSZ/polysilazane. This research has practical implications for the development of YSZ/Polysilzane specimens modified to function efficiently as TBC. Thus, this research is an important step toward progress in the field of thermal barrier coatings using YSZ/polysilazane.
Abbreviation
| CFRP | Carbon fiber reinforced polymer |
| GFRP | Glass fiber reinforced polymer |
| TBC | Thermal barrier coating |
| YSZ | Yttrium stabilized zirconia |
| HVOF | High velocity oxygen fuel |
| APS | Atmospheric plasma spraying |
Author contributions
Widyastuti: conceptualization, methodology, supervision, writing – review & editing. Liyana Labiba Zulfa: writing – original draft, writing – review & editing. Wafiq Azhar Rizaldi: investigation, writing – original draft. Jauhari Azhar: investigation, writing – original draft. Ninik Safrida: investigation, writing – original draft. Azzah Dyah Pratama: resources, formal analysis. Ruri Agung Wahyuono: methodology, validation, formal analysis. Sulistijono: methodology, validation, formal analysis. Rindang Fajarin: resources, formal analysis. Arif Nur Hakim: resources, formal analysis.Conflicts of interest
There are no conflicts to declare.Acknowledgements
The authors gratefully acknowledge financial support from the National Research and Innovation Agency of Indonesia (BRIN), Indonesia, for this work, under Research and Innovation Program for Developed Indonesia with contract no. 79/IV/KS/11/2022.References
- L. Zhu, N. Li and P. R. N. Childs, Propuls. Power Res., 2018, 7, 103–119 CrossRef.
- W. M. Wan Muhamad, M. Reshid, K. Wahid and M. N. F. Saniman, Int. J. Adv. Sci. Technol., 2020, 29, 4438–4444 Search PubMed.
- S. Y. Park and W. J. Choi, Int. J. Adhes. Adhes., 2019, 95, 102414 CrossRef.
- A. E. Rodríguez-Sánchez, E. Ledesma-Orozco and S. Ledesma, CIRP J. Manuf. Sci. Technol., 2020, 31, 595–606 CrossRef.
- A. Shanyavskiy and A. Soldatenkov, Procedia Struct. Integr., 2022, 39, 327–332 CrossRef.
- S. Kilimtzidis, A. Kotzakolios and V. Kostopoulos, Compos. Struct., 2023, 303, 116268 CrossRef CAS.
- F. Toffol and S. Ricci, Compos. Struct., 2023, 306, 116557 CrossRef.
- C. Soutis, X. S. Yi and J. Bachmann, Sci. China: Technol. Sci., 2019, 62, 1478–1480 CrossRef.
- R. R. Boyer, J. D. Cotton, M. Mohaghegh and R. E. Schafrik, MRS Bull., 2015, 40, 1055–1066 CrossRef.
- J. Zhang, G. Lin, U. Vaidya and H. Wang, Composites, Part B, 2023, 250, 110463 CrossRef CAS.
- E. Dilonardo, M. Nacucchi, F. De Pascalis, M. Zarrelli and C. Giannini, Compos. Sci. Technol., 2020, 192, 108093 CrossRef CAS.
- C. Domínguez-Monferrer, J. Fernández-Pérez, R. De Santos, M. H. Miguélez and J. L. Cantero, J. Manuf. Syst., 2022, 65, 622–639 CrossRef.
- X. Gabrion, V. Placet, F. Trivaudey and L. Boubakar, Composites, Part B, 2016, 95, 386–394 CrossRef CAS.
- B. Shen and W. Liu, Int. J. Heat Mass Transfer, 2019, 138, 314–325 CrossRef.
- O. I. Zhupanska and R. L. Sierakowski, Acta Mech., 2011, 218, 319–332 CrossRef.
- B. Liu, Y. Liu, C. Zhu, H. Xiang, H. Chen, L. Sun, Y. Gao and Y. Zhou, J. Mater. Sci. Technol., 2019, 35, 833–851 CrossRef CAS.
- P. Luangtriratana, B. K. Kandola and P. Myler, Mater. Des., 2015, 68, 232–244 CrossRef CAS.
- P. Golewski and T. Sadowski, Compos. Struct., 2019, 229, 111489 CrossRef.
- S. Rossi, F. Deflorian and M. Fedel, Surf. Eng., 2019, 35, 343–350 CrossRef CAS.
- W. Xinjie, X. U. Donghang, Z. H. U. Pinghua, C. Chunhong and Q. Zhongqiu, J. Wuhan Univ. Technol.-Mat. Sci. Edit., 2021, 93–102 Search PubMed.
- F. Liu, D. Wang, J. Liu, H. Wei and H. Zhang, J. Phys.: Conf. Ser., 2020, 1637, 012027 CrossRef CAS.
- N. Hu, M. Khan, Y. Wang, X. Song, C. Lin, C. Chang and Y. Zeng, Coatings, 2017, 7, 198 CrossRef.
- J. Huang, W. Wang, X. Lu, S. Liu and C. Li, Coatings, 2018, 8(5), 187 CrossRef.
- G. Barroso, W. Krenkel and G. Motz, J. Eur. Ceram. Soc., 2015, 35, 3339–3348 CrossRef CAS.
- S. Marceaux, C. Bressy, F.-X. Perrin, C. Martin and A. Margaillan, Prog. Org. Coat., 2014, 77, 1919–1928 CrossRef CAS.
- Y. Zhan, R. Grottenmüller, W. Li, F. Javaid and R. Riedel, J. Appl. Polym. Sci., 2021, 138, 50469 CrossRef CAS.
- Y. Jia, T. D. Ajayi, K. R. Ramakrishnan, A. Negi, J. Liu, S. Ekkad and C. Xu, Surf. Coat. Technol., 2020, 404, 126481 CrossRef CAS.
- West System Epoxy, Vacuum Bagging Techniques, Gougeon Brother, 2010, vol. 1, pp. 1–56 Search PubMed.
- N. N. Mahmud, S. K. Vajpai and K. Ameyama, Mater. Trans., 2014, 55, 1827–1833 CrossRef CAS.
- J. Huang, W. Wang, X. Lu, D. Hu, Z. Feng and T. Guo, Coatings, 2017, 7, 150 CrossRef.
- Z. Liu, Z. Zhao, L. Shang, D. Ou, D. Cui and B. Tu, J. Energy Chem., 2017, 26, 510–514 CrossRef.
- J. Wang, Q. Zhang, S. Li, J. Zhao, J. Wei, Y. Gao, Z. Jian and Z. Lu, Addit. Manuf. Front., 2024, 3, 200119 CrossRef.
- L. Wu, S. V Hoa, M. Tan and T. That, J. Appl. Polym. Sci., 2006, 99, 580–588 CrossRef CAS.
- D. Lascano, L. Quiles-Carrillo, S. Torres-Giner, T. Boronat and N. Montanes, Polymers, 2019, 11, 1354 CrossRef PubMed.
- Y. Li, D. Zhang, H. Wang and W. Cong, Metals, 2021, 11, 693 CrossRef CAS.
- L. Han, J. Zhang and H. Wang, Composites, Part B, 2023, 258, 110706 CrossRef CAS.
- R. Obmann, S. Schörpf, C. Gorsche, R. Liska, T. Fey and T. Konegger, J. Eur. Ceram. Soc., 2019, 39, 838–845 CrossRef CAS.
- G. Wang, J. Wang, J. Wang, Z. Chi, G. Zhang, Z. Zhou, Z. Feng and Y. Xiong, Coatings, 2020, 10, 552 CrossRef CAS.
- M. Izadinia, R. Soltani and M. H. Sohi, Ceram. Int., 2020, 46, 22383–22390 CrossRef CAS.
- N. Belayachi, C. Mallet and M. El Marzak, J. Build. Eng., 2019, 25, 100806 CrossRef.
- Z. Cao, S. An and X. Song, Sci. Rep., 2022, 12, 1–7 CrossRef PubMed.
- X. Lai, J. Wang, X. Wang, K. Jiang, W. Tian and B. Xu, Corros. Commun., 2023, 12, 58–63 CrossRef.
- M. Bai, H. Maher, Z. Pala and T. Hussain, J. Eur. Ceram. Soc., 2018, 38, 1878–1887 CrossRef CAS.
- M. Gurak, Q. Flamant, L. Laversenne and D. R. Clarke, J. Eur. Ceram. Soc., 2018, 38, 3317–3324 CrossRef CAS.
- N. Nayebpashaee, S. H. Seyedein, M. R. Aboutalebi, H. Sarpoolaky and S. M. M. Hadavi, Surf. Coat. Technol., 2016, 291, 103–114 CrossRef CAS.
- M. Amer, N. Curry, Q. Hayat, R. Sharma, V. Janik, X. Zhang, J. Nottingham and M. Bai, Coatings, 2023, 13, 107 CrossRef CAS.
- X. Song, Y. Ding, J. Zhang, C. Jiang, Z. Liu, C. Lin, W. Zheng and Y. Zeng, J. Mater. Res. Technol., 2023, 23, 648–655 CrossRef CAS.
- J. Sakfali, S. Ben Chaabene, R. Akkari, F. Dappozze, G. Berhault, C. Guillard and M. Saïd Zina, J. Photochem. Photobiol., A, 2022, 430, 113970 CrossRef CAS.
- E. Cañas, M. Vicent, E. Bannier, P. Carpio, M. J. Orts and E. Sánchez, J. Eur. Ceram. Soc., 2016, 36, 837–845 CrossRef.
- V. Y. Filimonov and K. B. Koshelev, Proc. Combust. Inst., 2017, 36, 423–432 CrossRef CAS.
- S. A. El-Sayed, T. M. Khass and M. E. Mostafa, Biomass Convers. Biorefin., 2024, 14, 17779–17803 CrossRef CAS.
- I. A. Channa, A. A. Shah, M. Rizwan, M. A. Makhdoom, A. D. Chandio, M. A. Shar and A. Mahmood, Materials, 2021, 14, 7000 CrossRef CAS PubMed.
- G. Barroso, M. Döring, A. Horcher, A. Kienzle and G. Motz, Adv. Mater. Interfaces, 2020, 7, 1901952 CrossRef CAS.
- A. Morlier, S. Cros, J.-P. Garandet and N. Alberola, Thin Solid Films, 2012, 524, 62–66 CrossRef CAS.
- M. A. Shayed, H. Hund, R. D. Hund and C. Cherif, Fibers Polym., 2016, 17, 229–240 CrossRef.
- R. D'Elia, G. Dusserre, S. Del Confetto, N. Eberling-Fux, C. Descamps and T. Cutard, Polym. Eng. Sci., 2018, 58, 859–869 CrossRef.
- A. Kojima, S. Hoshii and T. Muto, J. Mater. Sci. Lett., 2002, 21, 757–760 CrossRef CAS.
- A. Younsi, R. Cherif, A. Trabelsi, A. E. A. Hamami, R. Belarbi and A. Aït-Mokhtar, Constr. Build. Mater., 2021, 279, 122427 CrossRef CAS.
- T. Konegger, L. F. Williams and R. K. Bordia, J. Am. Ceram. Soc., 2015, 98, 3047–3053 CrossRef CAS PubMed.
- N. K. Dhiman, N. Sidhu, S. Agnihotri, A. Mukherjee and M. S. Reddy, in Micro and Nano Technologies, ed. H. M. N. Iqbal, M. Bilal, T. A. Nguyen and N. Yasin, Elsevier, 2022, pp. 405–475 Search PubMed.
- P. Rodríguez-González, M. Á. Monge, E. Gordo and E. M. Ruiz-Navas, Mater. Charact., 2023, 203, 113048 CrossRef.
- M. F. Gonon, S. Hampshire, J. P. Disson and G. Fantozzi, J. Eur. Ceram. Soc., 1995, 15, 683–688 CrossRef CAS.
- M. Hattori, S. Iijima, T. Nakao, H. Hosono and M. Hara, Nat. Commun., 2020, 11, 2001 CrossRef CAS PubMed.
- Y. Chang, Y. Luo, C. Xu and J. Zhao, R. Soc. Open Sci., 2019, 6, 182119 CrossRef CAS PubMed.
- Z. Fan, C. Xiong, J. Yin, Y. Zhang, Y. Zou and H. Zhou, Surf. Interfaces, 2023, 40, 103064 CrossRef CAS.
- Y. Liu, J. Zhang, J. Chang, S. Xie and Y. Zhao, Materials, 2022, 15(8), 2781 CrossRef CAS PubMed.
- M. Bouslah, M. Salvia, I. Deschères, B. Berthel and S. Benayoun, Effect of Microsphere Content on Fire Performance and Thermomechanical Properties of Phenolic Resole Syntactic, 2013 Search PubMed.
- B. Fu, G. Tang and Y. Li, Phys. Chem. Chem. Phys., 2017, 19, 28517–28526 RSC.
- S.-N. Hong, C.-J. Yu, U.-S. Hwang, C.-H. Kim and B.-H. Ri, Mater. Chem. Phys., 2020, 250, 123146 CrossRef CAS.
- P. Ruckdeschel, A. Philipp and M. Retsch, Adv. Funct. Mater., 2017, 27, 1702256 CrossRef.
- H. Wei, J. Xia, W. Zhou, L. Zhou, G. Hussain, Q. Li and K. (Ken) Ostrikov, Composites, Part B, 2020, 193, 108035 CrossRef CAS.
- C. R. Siviour, M. J. Gifford, S. M. Walley, W. G. Proud and J. E. Field, J. Mater. Sci., 2004, 39, 1255–1258 CrossRef CAS.
- C. Lopes, I. Flores-Colen and L. Silva, J. Adhes., 2015, 91, 150505115444007 CrossRef.
- G. M. Hekal, A. A. Bashandy, E. H. Abdou, A. Elbehiry, X. Dongxi and K. Elbaz, Alexandria Eng. J., 2023, 78, 339–347 CrossRef.
- M. Ali, M. Nion and M. Rahman, J. Eng. Appl. Sci., 2020, 42–51 Search PubMed.
- H. Xia, Y. Ma, C. Chen, J. Su, C. Zhang, C. Tan, L. Li, P. Geng and N. Ma, Compos. Struct., 2022, 285, 115247 CrossRef CAS.
- F. Guilherme, S. Cassu, M. Diniz, T. Faria, N. Sanches and R. Dutra, Polímeros, 2017, 27, 353–361 CrossRef.
- V. K. Champagne, in Woodhead Publishing Series in Metals and Surface Engineering, ed. V. K. B. T.-T. C. S. M. D. P. Champagne, Woodhead Publishing, 2007, pp. 327–352 Search PubMed.
Footnote |
| † Electronic supplementary information (ESI) available. See DOI: https://doi.org/10.1039/d4ra03620d |
| This journal is © The Royal Society of Chemistry 2024 |