 Open Access Article
Fabrication and characterisation of a flexible thermoelectric generator using PANI/graphite/bismuth telluride composites†
Yoshitha P A‡
a,
Manasa. R. Shankar‡a,
A. N. Prabhu *a,
Ramakrishna Nayak*b,
Ashok Raoa and
G. Poojithaa
aDepartment of Physics, Manipal Institute of Technology, Manipal Academy of Higher Education, Manipal, 576104, Karnataka, India. E-mail: ashwatha.prabhu@manipal.edu
bDepartment of Humanities & Management, Manipal Institute of Technology, Manipal Academy of Higher Education, Manipal, 576104, Karnataka, India. E-mail: ramakrishna.nayak@manipal.edu
First published on 23rd December 2024
Abstract
Unique thermoelectric properties of low-cost, widely available conducting polymers and multi-layered graphite structures have motivated the development of flexible thermoelectric generators using screen printing for low-temperature applications. Composites of polyaniline and graphite in different ratios with one weight percentage of bismuth telluride were prepared to fabricate flexible thermoelectric generators. The performance of the devices showed that the addition of graphite to polyaniline reduced the band gap energy from 2.90 to 1.33 eV, which was further reduced to 1.05 eV upon the addition of bismuth telluride. Adding graphite and bismuth telluride to polyaniline increased carrier mobility from 0.12 to 0.41 cm2 V−1 s−1 without affecting carrier concentrations. An optimum concentration of graphite reduced transient thermal conductivity. A flexible thermoelectric generator with a polyaniline to graphite ratio of 1![[thin space (1/6-em)]](https://www.rsc.org/images/entities/char_2009.gif) :
:![[thin space (1/6-em)]](https://www.rsc.org/images/entities/char_2009.gif) 2 and 1 weight percentage of bismuth telluride exhibited superior performance with the maximum Seebeck coefficient, power factor and power output of 39.14 μV K−1, 0.29 nW m−2 K−2 and 0.58 nW, respectively, at a temperature difference of 90 °C, which are 4.0, 5.8 and 6.1 times higher than those of the pure polyaniline-based device. Further increase in the polyaniline to graphite ratio of the composite increased both transient thermal conductivity and resistivity, resulting in the reduction of the Seebeck coefficient and power factor.
2 and 1 weight percentage of bismuth telluride exhibited superior performance with the maximum Seebeck coefficient, power factor and power output of 39.14 μV K−1, 0.29 nW m−2 K−2 and 0.58 nW, respectively, at a temperature difference of 90 °C, which are 4.0, 5.8 and 6.1 times higher than those of the pure polyaniline-based device. Further increase in the polyaniline to graphite ratio of the composite increased both transient thermal conductivity and resistivity, resulting in the reduction of the Seebeck coefficient and power factor.
1. Introduction
Energy harvesting is one of the main goals on a global scale.1 One of the main demands of human beings is the meticulous production of energy with minimum environmental damage.2 Burning of fossil fuels emits greenhouse gasses into the environment.3 Only around 34% of the energy produced by burning fossil fuels has been used effectively. The rest is lost into the environment as waste heat. Therefore, it has become very important to use alternate methods for the production of energy. This waste heat can be converted into electrical power using thermoelectric materials.A wide range of organic and inorganic polymers, including polyaniline (PANI) and polyethylene dioxythiophene (PEDOT), are good thermoelectric materials with good power output. PANI is easily available, cost-effective, and non-toxic as well as exhibits excellent stability and redox recyclability. The pH of PANI can also be changed during synthesis. PANI is usually produced in two different forms: one is a completely reduced form and consists of only benzoid rings, and the other is fully oxidised and contains both benzoid and quinoid rings.4 PANI can be doped with different types of materials such as camphor sulphonic acid, p-toluene sulphonic acid, and hydrochloric acid,5 which makes it excellent for conduction. Graphite is known to have a very high value of both thermal and electrical conductivities.6 Graphite forms a multilayered structure that allows electrons to flow easily, thus increasing its conductivity. Graphite is known to be cheap, easily available, non-toxic and has a high value of electrical conductivity. Its planar structure with gaps between them is the reason for its high electrical conductivity as it allows charge carriers to pass through it.7 Bismuth telluride has emerged as a pivotal material in thermoelectric research owing to its remarkable thermoelectric properties. It exhibited excellent performance, characterized by a high Seebeck coefficient and low thermal conductivity, making it highly effective for low-temperature applications such as thermoelectric refrigeration. To enhance its performance, various engineering strategies such as nanostructuring,8 alloying and doping have been employed to reduce thermal conductivity while maintaining high electrical conductivity. With its high ZT and relatively low cost, Bi2Te3 has become one of the most promising candidates for near-room-temperature thermoelectric applications, offering a balance between efficiency and cost-effectiveness. Additionally, when combined with tellurium, bismuth transitioned from a material with metallic behavior to a highly efficient thermoelectric one, benefiting from properties such as low effective mass and high carrier mobility, which contributed to its high thermoelectric quality factor. Furthermore, bismuth telluride, being a semiconductor material and a topological insulator, exhibited thickness-dependent physical properties and demonstrated electrical anisotropy, further enhancing its unique performance in thermoelectric applications.9 The addition of graphite and bismuth telluride is found to improve the Seebeck coefficient and power factor in the composites.10
Although several studies have been performed on pellet samples, much work has not been done in the areas of thermoelectric generators (TEGs) and the effect of solvents and binders on the thermoelectric properties of the generators. Some of the most used solvents include methanol,11 ethanol, water, and diacetone alcohol.12 The properties of solvents are important for improving the crystalline properties. Our main work was to study the thermoelectric properties of the PANI/graphite/bismuth telluride composites-based flexible thermoelectric generator prepared by the screen-printing method. The screen-printing method has many advantages including low cost, large coverage of the area, high aspect ratio, high throughput, and increase in porosity.
2. Methodology
2.1 Materials
Aniline (spectrochem) was purified by vacuum distillation process. Cellulose acetate propionate (Molychem), and N,N dimethylformamide (Lobachem) were used to prepare the binder. Ammonium persulphate (Molychem), sulphuric acid (Finar), sodium lauryl sulphate (Loba), graphite fine powder (Loba) and diacetone alcohol of analytical grades were also used without further purification. Laboratory-grade bismuth and tellurium were used to prepare bismuth telluride. A polyester film (PET) of thickness 100 μm was used as the substrate during the preparation of the device. Silver ink (Loctite) was used to connect the legs of FTEGs.132.2 Synthesis of PANI
5 mL of aniline was dissolved in 98 mL of H2SO4 with 1 N concentration14 by stirring using a magnetic stirrer. About 1.25 g of sodium lauryl sulphate was added to this as a surfactant. This solution was then stirred for 30 minutes. This was then cooled to a temperature of about 0–5 °C. To this ammonium per sulphate (44.325 mmol, 10.115 g) solution, 20 mL of 1 N H2SO4 was added. This mixture was then stirred continuously for 5 hours and then made to stand at a temperature of 0–5 °C for about 17 hours. The precipitate was collected, washed, many times with distilled water and then dried in a hot air oven at a temperature of 55 °C.2.3 Synthesis of bismuth telluride
The samples were prepared by a solid-state reaction technique. Bismuth (99.99%) and tellurium (99.99%) were mixed in a stoichiometric ratio in an agate mortar and ground for 2 h into a finely ground powder. The powder was compressed using a pressure of 5 tons15 and was pelletized.16 The pellets were enclosed in a quartz tube17 with a vacuum of 10−4 Torr.18 The pellet samples were then sintered for 24 hours at a temperature of 250 °C.192.4 Preparation and characterisation of composites of PANI, graphite and bismuth telluride
PANI, graphite, and bismuth telluride were taken in different ratios ground into a fine powder and then sieved. The composites prepared had the properties of the constituent materials.20To study the influence of individual constituent materials on the thermoelectric performance, five different PANI, graphite, and bismuth telluride-based composites, CP100, CP1G1, CP1G1B, CP1G2B, and CP1G3B, using these screen printable inks, P100, P1G1, P1G1B, P1G2B, and P1G3B, respectively, were prepared. The various compositions of these composites and inks are tabulated in Table 1.
| Sample | PANI (wt%) | Graphite (wt%) | Bismuth telluride (wt%) |
|---|---|---|---|
| CP100 | 100 | 0 | 0 |
| CP1G1 | 50 | 50 | 0 |
| CP1G1B | 49.5 | 49.5 | 1.0 |
| CP1G2B | 33.0 | 66.00 | 1.0 |
| CP1G3B | 24.75 | 74.25 | 1.0 |
| P100 | 100 | 0 | 0 |
| P1G1 | 50 | 50 | 0 |
| P1G1B | 49.504 | 49.504 | 0.990 |
| P1G2B | 33.112 | 66.225 | 0.663 |
| P1G3B | 24.875 | 74.626 | 0.499 |
Bi2Te3 is well-regarded for its thermoelectric properties, particularly in the context of high-performance materials. However, in our formulation, the Bi2Te3 content was kept at nearly 1 wt% to optimize the balance between enhancing thermoelectric performance and maintaining material stability. Higher concentrations of Bi2Te3 can lead to increased phonon scattering and reduced carrier mobility, which may adversely affect the material's overall thermoelectric efficiency. By limiting the Bi2Te3 content, we aimed to maximize the beneficial effects while minimizing potential detrimental impacts on the material's performance. The binder used to prepare the inks consisted of 80% DMF and 20% of cellulose acetate propionate. The crystallinity of the composites and inks was analysed by performing XRD using the Rigaku Miniflex 600 instrument at a scanning range of 5–80° and scanning speed of 2° min−1 with a step size of 0.02°. SEM and EDS analysis were also performed on the composites to study the morphological and structural properties such as porosity. The porosity of the samples was studied using ImageJ software. The optical properties were studied by UV-visible spectroscopy (UV Shimadzu 1900I) for all the inks prepared. The measurements were performed using DMF as the solvent. From the obtained results, the direct band gap energy of all the ink samples was calculated from Tauc plot. FTIR spectra of all the inks were also collected using the Shimadzu IRSpirit QATR-S FTIR spectrometer.
To calculate the Hall coefficient of the composites, the printed ink films were tested on an Ecopia HMS 5500 Hall measurement system using the four-probe van der Pauw method. Thermoelectric properties such as Hall coefficient, mobility, carrier concentration, and electrical conductivity were analyzed.
2.5 Preparation and characterisation of FTEG
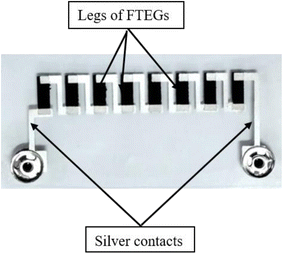
The prepared thermoelectric generators have 8 legs with a dimension of 10 mm × 3 mm. For the connection between the legs, silver ink was used. The overall dimensions of the flexible thermoelectric generator (FTEG) are 20 mm × 60 mm. The structure of one of the prepared FTEGs is shown in Fig. 1. The legs were prepared by the method of screen printing on a PET substrate of thickness of about 100 μm. For this, a flat wedge-shaped rubber squeeze having a hardness of about 75 shore A was used. The legs had 12 overprints and the silver ink had 4 overprints. These dimensions were chosen to balance electrical and thermal performances, fabrication ease, and mechanical flexibility. Longer elements would increase resistance, reducing power output, while shorter ones might limit the temperature gradient, affecting voltage generation. These dimensions are also ideal for the screen-printing process on PET substrates, ensuring precise fabrication, good adhesion, and the required flexibility for wearable applications.To study the thermoelectric properties, the FTEG (Fig. 1) device was clamped between 2 copper plates and heated between 35 °C to 100 °C using a hot plate setup, which is controlled digitally. One end of FTEG is exposed to room temperature and the other end to the given temperature range. The temperature was monitored by an electronic thermocouple (Lutron TM-902C). The voltage and current across the device were measured using a Keithley 2001 multimeter. The structure of one of the prepared FTEGs is shown in Fig. 1.
3. Results and discussion
3.1 XRD analysis of the composites and ink
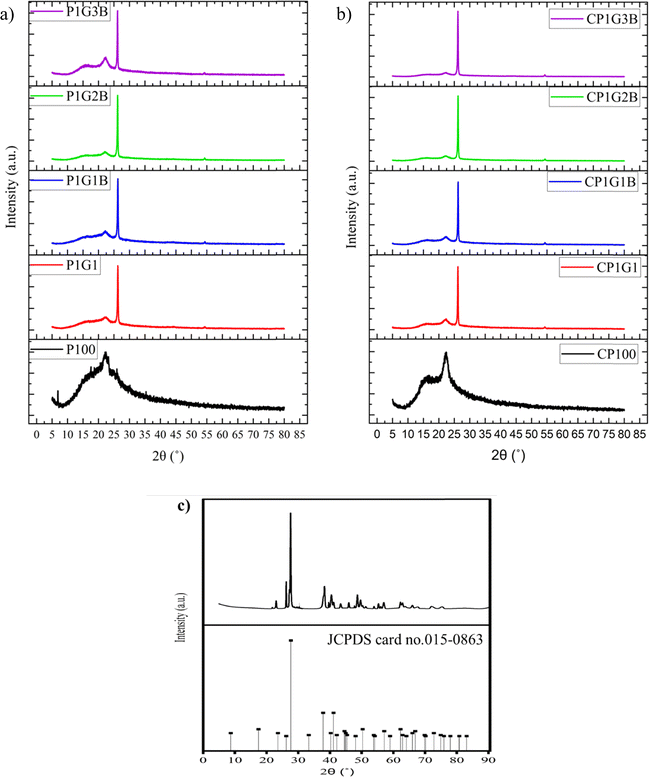
The XRD plots of all the composites and inks are shown in Fig. 2. A broad peak was observed for both P100 and CP100 around 23°, 2θ. A broad peak indicating the presence of PANI was observed around 23°, 2θ in all the samples which corresponds to the (200) plane.21 A single peak was observed for graphite around 26°, 2θ which indicated the presence of the (002) plane; upon adding graphite and bismuth telluride, the semicrystalline nature of PANI improved drastically.22 This is due to the conductive nature of PANI because of the benzoid and quinoid groups.23 The average crystallite size was calculated using the Debye–Scherrer eqn (1),
 | (1) |
The average crystallite size of bismuth telluride in powdered form was calculated to be 38.71 nm. Similar results have been reported elsewhere.24 The XRD pattern was found to exhibit multiple peaks.25 The peaks observed at 21°, 26.24°, 27.58°, 29.92°, 38.34°, and 40.44° are corresponding to (006), (101), (015), (018) planes, respectively.16,26 The average crystallite size of all the inks and composites is shown in Table 2. The crystallite size was found to increase drastically with the addition of graphite in the P1G1 ink, which was observed to be 22.72 nm. This might be due to the hexagonal planes, which were presented in graphite. On adding bismuth telluride, crystallite size increased to 24.06 nm. The dislocation density of all the samples showed a trend similar to the crystallite size. An increase in the crystallite size indicates improvement in the crystalline properties making them good generators as their thermoelectric properties would improve.27 This indicates an improvement in electrical conductivity. The crystallite size was found to improve in inks when compared to their corresponding composites. Therefore, the binder which consisted of DMF and cellulose acetate propionate was found to have a positive impact on the crystallite size, thereby improving thermoelectric properties.
| Sample name | Average crystallite size, D (nm) | Dislocation density, 1/D2 (nm−2) |
|---|---|---|
| P100 | 6.15 | 0.023 |
| P1G1 | 22.72 | 0.0023 |
| P1G1B | 24.06 | 0.0017 |
| P1G2B | 20.17 | 0.0024 |
| P1G3B | 18.77 | 0.0028 |
| CP100 | 4.64 | 0.046 |
| CP1G1 | 20.91 | 0.0022 |
| CP1G1B | 18.83 | 0.0028 |
| CP1G2B | 19.87 | 0.0025 |
| CP1G3B | 18.40 | 0.0029 |
3.2 Scanning electron microscopy (SEM) and energy dispersive x-ray analysis (EDS)
SEM images (Fig. 3) of the composites (P100, P1G1, P1G1B, P1G2B, and P1G3B) were taken under a magnification of 1k×. A considerable increase in the concentration of granular structure was observed while increasing the graphite concentration in the composites. The size of the granules was also found to be increased. The porosity of these composite-ink films was calculated using ImageJ software and is shown in Table 3.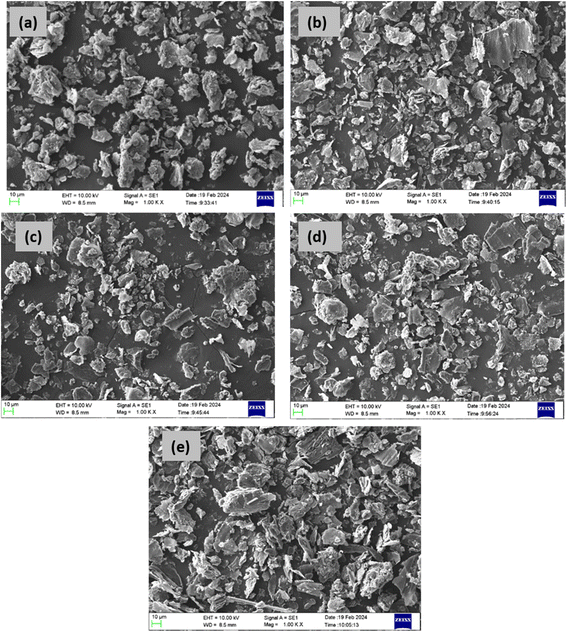 | ||
| Fig. 3 Surface morphological features of (a) P100, (b) P1G1, (c) P1G1B, (d) P1G2B and (e) P1G3B FTEGs. | ||
| Name of inks | Porosity (%) |
|---|---|
| P100 | 16.88 |
| P1G1 | 18.00 |
| P1G1B | 21.01 |
| P1G2B | 21.76 |
| P1G3B | 22.50 |
The porosity of a material is significant while analysing its durability. It is also an indicator of the resistance to adverse conditions. The maximum porosity was observed for P1G3B, which showed a wt% of 22.5%. It has been reported that graphite is a porous substance and has a porosity of about 16%.28 Compared to P1G1, P1G1B showed an increase in porosity. This is due to the addition of bismuth telluride, which helps in improving the thermoelectric properties of the generators.29 In many materials, a large pore size indicates a low value of thermal conductivity, therefore, it acts like a good thermoelectric material.30 In these materials, as porosity increases, the total specific volume as well as the pore volume also increases. These factors influence the mass transportation of charge carriers and can be used in many applications such as being used as a material for electrodes and redox supercapacitors as they show good capacitance.31 An increase in porosity implies that a large number of cracks and pores are introduced compared to the gas or solid medium. An increase in porosity leads to an increase in the number of grain scattering boundaries. It has been reported that an increase in porosity has led to a reduction in thermal conductivity.32 It has a direct relationship with the Seebeck coefficient as it causes a reduction in thermal conductivity.33
Fig. S1† shows the elemental distribution of FTEGs. The weight percentage of different elements present in the composites is provided in Table S1.† Among all the elements, carbon has the highest weight percentage. As PANI was doped with H2SO4, the presence of sulphur and oxygen was also observed. Among all the composites, oxygen has shown a weight percentage ranging from 15 to 25%, the highest being for P1G1B. As the percentage of bismuth telluride added was very small compared to the amount of PANI and graphite added, the weight percentage of bismuth and tellurium was low, which was less than 0.25%.
3.3 FTIR spectra of ink
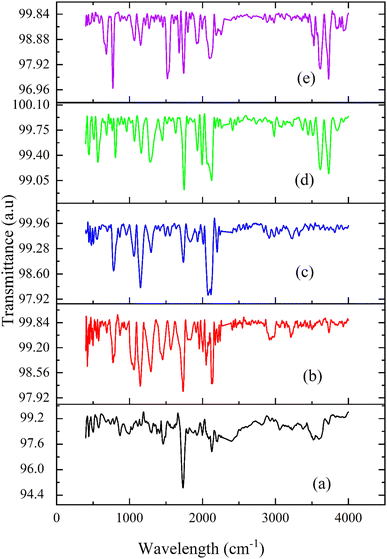
FTIR spectroscopy is an analytical technique used to identify functional groups depending on the absorption of radiation in the IR region. The functional groups can be organic, inorganic, or polymeric materials. It provides high-resolution spectral data34The FTIR spectra of the composites are given in Fig. 4. The stretching of quinoid bands in PANI was observed at 1622 cm−1. The quinoid stretching bands were found around 1413 cm−1.35 The peak corresponding to 1301 cm−1 represents C–N stretching vibrations, which indicate the doped nature of PANI. N![[double bond, length as m-dash]](https://www.rsc.org/images/entities/char_e001.gif) Q
Q![[double bond, length as m-dash]](https://www.rsc.org/images/entities/char_e001.gif) N ring variation was observed at 1173 cm−1. The peak at 697 cm−1 indicated the presence of H2SO4−1. As PANI was doped with H2SO4, it improved the oxidative state, thereby improving proton doping. The peak at 571 cm−1 was assigned to SO4−1. The peaks observed at 1173 cm−1 and 1187 cm−1 represented a constructed protonated form of PANI, which was due to the presence of dopants.36 At 869 cm−1, an emeraldine form of PANI substituted ring structure was observed. A peak was observed at 1036 cm−1, which is linked to the vibration of the hydrogen sulphate counter ion and was attributed to symmetric SO3 stretching.37
N ring variation was observed at 1173 cm−1. The peak at 697 cm−1 indicated the presence of H2SO4−1. As PANI was doped with H2SO4, it improved the oxidative state, thereby improving proton doping. The peak at 571 cm−1 was assigned to SO4−1. The peaks observed at 1173 cm−1 and 1187 cm−1 represented a constructed protonated form of PANI, which was due to the presence of dopants.36 At 869 cm−1, an emeraldine form of PANI substituted ring structure was observed. A peak was observed at 1036 cm−1, which is linked to the vibration of the hydrogen sulphate counter ion and was attributed to symmetric SO3 stretching.37
Graphite has a two-dimensional structure made up of hexagonal rings consisting of carbon atoms. They are arranged parallel to each other in planes.36 For graphite, an absorption peak was observed at 1616 cm−1, which indicated the presence of C![[double bond, length as m-dash]](https://www.rsc.org/images/entities/char_e001.gif) C stretching vibrations.38 Nandi Yanto et al. reported that the absorption peak for the C
C stretching vibrations.38 Nandi Yanto et al. reported that the absorption peak for the C![[double bond, length as m-dash]](https://www.rsc.org/images/entities/char_e001.gif) C bond is from 1510 cm−1 – 1620 cm−1.39 In all the composites, absorption peaks were observed for 3727 cm−1, 3871 cm−1, 3733 cm−1, 3729 cm−1 and 3728 cm−1 for the composites P100, P1G1, P1G1, P1G2B and P1G3B, respectively, which specified the presence of O–H functional group as PANI was prepared by doping with H2SO4, which has an O–H group.40
C bond is from 1510 cm−1 – 1620 cm−1.39 In all the composites, absorption peaks were observed for 3727 cm−1, 3871 cm−1, 3733 cm−1, 3729 cm−1 and 3728 cm−1 for the composites P100, P1G1, P1G1, P1G2B and P1G3B, respectively, which specified the presence of O–H functional group as PANI was prepared by doping with H2SO4, which has an O–H group.40
3.4 UV-visible spectra of the ink
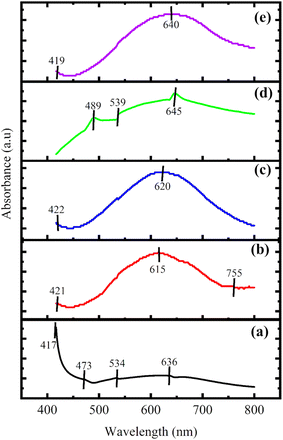
UV visible spectroscopy shows the absorption and transmission of radiation over UV and visible regions of the electromagnetic spectra. The absorption of wavelength is based on Beer's law.41 The UV-visible spectra of the ink were studied in the wavelength range of 400–800 nm by taking DMF as the solvent. The UV-visible spectra of all the composites are shown in Fig. 5.For P100, prominent peaks were observed at 417 nm, 473 nm, 534 nm and 636 nm. The peak observed at 636 nm corresponds to the polaron to the π* electronic transition of aniline.42 In P1G1, the peak corresponding to polaron to the π* electronic transition of aniline was observed as 615 nm showing that they had undergone a redshift. The π to polaron electronic transition was observed in the case of P1G1 and P1G1B at 755 nm and 747 nm, respectively, which indicates a blue shift.43 The band gap energy of the composites is depicted in Table 4. From the values of the calculated band gap energy, P1G3B shows the lowest value while P100 displays the highest value. It has been observed that an increase in the graphite concentration resulted in the lowering of the energy band gap. Graphite has a high value of electrical conductivity along with the presence of basal planes, which allows the charge carriers to flow in between them. The band gap energy of the composites was calculated using Tauc's eqn (2).41
| (αhν)1/ϒ = B(hν − Eg) | (2) |
| Name of the composite | Energy band gap (eV) |
|---|---|
| P100 | 2.90 |
| P1G1 | 1.33 |
| P1G1B | 1.27 |
| P1G2B | 1.25 |
| P1G3B | 1.05 |
The highest value of the direct band gap energy (2.90 eV) was observed for P100. Then, it was reduced drastically for P1G1 to 1.35 eV because of the presence of graphite as basal planes present in graphite easily allow the movement of charge carriers. On adding bismuth telluride in P1G1B, the band gap energy was reduced further to 1.27 eV. The minimum band gap energy (1.05 eV) was observed for P1G3B, which had the highest concentration of graphite.45
3.5 Analysis of ink film thickness
The thickness of the FTEGs prepared by the screen printing technique was measured using a digital screw gauge setup and the data are provided in Table 6. All the generators had 12 overprints and their thickness was between 0.03–0.038 mm. This thickness imparts enough flexibility to the generators. The number of overprints was selected in such a way that it provides the necessary flexibility to the FTEGs and at the same time keeps the generators stable, so that no cracks or damages appear. The amount of the pressure applied while printing should also be considered.3.6 HALL effect measurements
The FTEGs (P100, P1G1, P1G1B, P1G2B, P1G3B) were subjected to Hall effect measurements at room temperature (300 K). The probes were connected across the device by making silver contacts along the corners. The values of the carrier concentration, resistivity, conductivity, mobility, and nature of charge carriers are present in Table 5 and Fig. 6.| Sample | Carrier concentration (n) (cm−3) | Resistivity (ρ) (Ω cm) | Conductivity (σ) (S cm−1) | Mobility (μ) (cm2 V−1 s−1) | Nature of sample |
|---|---|---|---|---|---|
| P100 | 2.02 × 10¹⁸ | 8.69 | 0.115 | 0.124 | p-type |
| P1G1 | 6.08 ×10¹⁸ | 5.68 | 0.176 | 0.130 | p-type |
| P1G1B | 1.97 ×10¹⁸ | 17.2 | 0.058 | 0.124 | p-type |
| P1G2B | 8.3 ×10¹⁸ | 4.73 | 0.211 | 0.435 | p-type |
| P1G3B | 2.69 ×10¹⁸ | 7.87 | 0.127 | 0.410 | p-type |
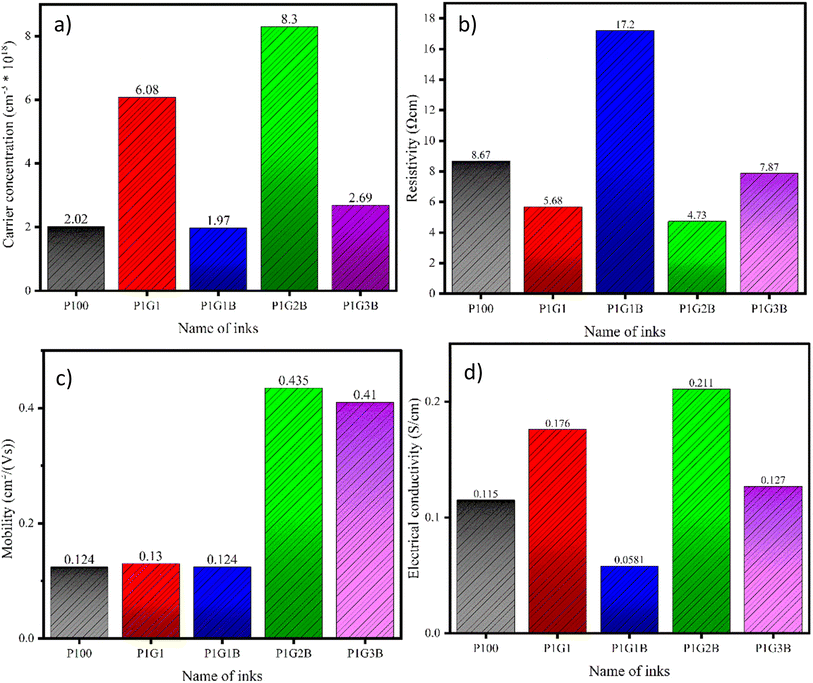 | ||
| Fig. 6 (a) Carrier concentration, (b) conductivity, (c) mobility, and (d) resistivity of the ink samples. | ||
Transport studies are useful in explaining the conductivity characteristics of materials. Temperature-dependent direct current conductivity studies can be very useful in probing conduction mechanisms.7
The carrier concentration of all the printed FTEGs was of the order of 1018 cm−3. As the Hall effect measurements indicated them to be p-type, the majority of charge carriers were holes. The carrier concentration of undoped PANI was low compared to that in the samples doped with protonic acids such as H2SO4 and HCl. In the doped state, the charge carriers are found to be in the localized state, therefore, they can participate in the transport mechanism. As the conduction is carried out by majority charge carriers, they cross the energy barrier by jumping from one point to another. This procedure is the main reason for the localisation of charge carriers in polymers.
These charge carriers usually follow the variable range hopping mechanism (VRH) in which electrons hop from one localised state of similar energy to another state, even if there is a shorter path, as observed in the case of ICP (Intrinsically Conducting Polymers) or a planar structure in the case of graphite.
Electrical conductivity and the mobility of P100 were observed to be 0.115 S cm−1 and 0.124 cm2 V−1 s−1, respectively. The conductivity and mobility of the charge carriers in PANI were determined from numerous defects present in the polymer.46 The value of conductivity mainly depends on various parameters such as shape, size, presence of conductive fillers, and the orientation of the components. The improvement in conductivity was observed in PANI after doping with protonic acids such as H2SO4 and HCl and is similar to the conductivity observed in semiconductors and metal-like materials.47 This is because doping with protonic acids incorporates charge carriers such as polarons and bipolarons into the polymer.48 When the doping level increases, these localised polarons and bipolarons can overlap with the energy level of dopants, which leads to the production of new energy band gaps that lie between the valence band and the conduction band. This helps in the flow of electrons.48
When graphite was added to PANI, the carrier concentration was found to increase to 6.08 × 1018 cm−3. For the P1G1 device, resistivity, conductivity and mobility were measured to be 5.68 Ω cm, 0.176 S cm−1 and 0.13 cm2 V−1 s−1, respectively. Compared to P100, the P1G1 device showed improvement in these values. In graphite, the presence of the staked planar sp2 hybridised C-6 ring structure promotes the electrical, thermal and mechanical properties in the compounds and composites. It has hexagonal rings made of carbon atoms forming a two-dimensional layer. Each carbon atom is bonded to three other carbon atoms with strong covalent bonds. As these carbons are sp2 hybridised, they produce delocalised electrons.49 These electrons are free to move between the hexagonal layers as they are loosely packed. Apart from these, graphite also has weak van der Waal forces and low electron–phonon coupling which contribute to their high electrical conductivity.50 However, in the case of P1G1B, a reduction in carrier concentration, electrical conductivity and mobility was observed whereas an increase in resistivity was found. P1G2B showed the highest value of carrier concentration, electrical conductivity and mobility among all other printed FTEGs.
3.7 Transient thermal conductivity
In solids, the transmission of heat energy occurs in different ways. In metals, charge carriers are responsible for transmission while in non-metals and crystalline solids, phonons or lattice waves play the dominant role. In solids, thermal conductivity varies due to changes in the grain size, variations in carrier concentration, anharmonicity in lattice forces, phonon and electron interactions, and magnetic field.51 For any solid, the total thermal conductivity is given by| κ = Σκα | (3) |
| κ = κele + κlat | (4) |
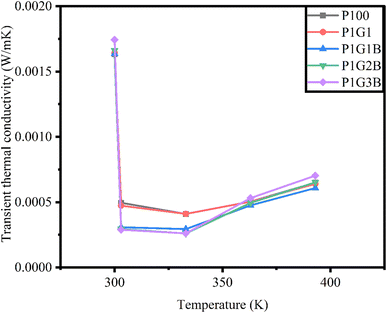
For all the generators, a particular thermoelement of all FTEGs having minimum resistance was subjected to different temperatures (300 K, 303 K, 333 K, 363 K, and 393 K). Transient thermal conductivity measures the heat transfer at the interface.53 The transient conductance was calculated using Wiedemann Franz law and is given by
| κ = LσT | (5) |
The transient thermal conductivity of the generators is depicted in Fig. 7. Among the different ink compositions, the highest value of the transient thermal conductivity was observed for P100, which is pure PANI.54 Then in P1G1, transient thermal conductivity was reduced 4 times. P1G1B showed a reduction in transient thermal conductivity compared to P1G1. Lattice thermal conductivity can be controlled by incorporating a heavy element into the lattice. Heavy element reduces lattice vibration. Bismuth telluride is one of the heaviest thermoelectric compounds.55 However, in P1G2B and P1G3B, transient thermal conductivity was found to increase because graphite is a material with very high values for both thermal conductivity and electrical conductivity. The reason is the layered structure of graphite. The thermal conductivity of graphite ranges between 800 W m−1 K−1 to 2000 W m−1 K−1 along the basal plane. Each of these carbon atoms present on each layer is connected to the other three carbon atoms of neighbouring layers. The spacing between them is 1.42 Å.56 These planes are referred to as basal planes. This is the reason for the high thermal conductivity of graphite.
For all the generators, the value of transient thermal conductivity showed a reduction between 303 K and 333 K compared to higher temperatures. This means that generators were preferred to operate near room temperature conditions. When the temperature increased from 333 K to 393 K, transient thermal conductivity also increased. For all the generators, the highest value of transient thermal conductivity was observed at 393 K.
3.8 Performance of FTEGs
When a temperature difference of ΔT was applied across the ends of an FTEG, a potential difference of ΔV was formed. Using these, the Seebeck coefficient was calculated from the slope of the plot between ΔV and ΔT using the equation.
 | (6) |
The maximum power output of these generators was calculated using the formula.
 | (7) |
| Power factor = S2σ | (8) |
In the case of printed FTEGs, the power factor is given by
 | (9) |
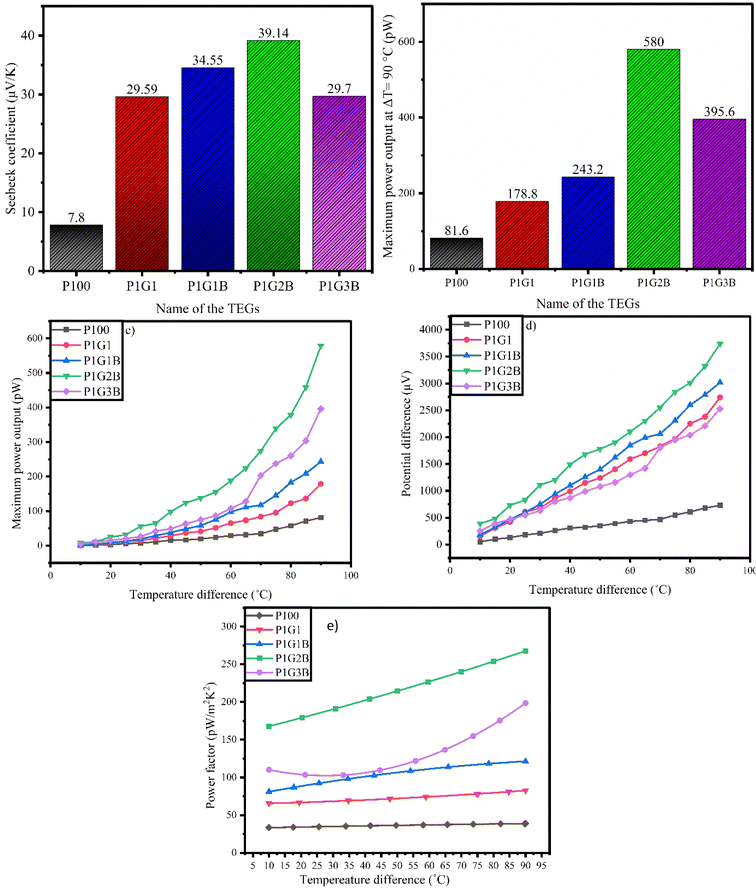
The values of the Seebeck coefficient, power factor and maximum power output at ΔT = 90 °C are depicted in Table 6
| Name of the device | Seebeck coefficient (μV K−1) | Power factor at ΔT = 90 °C (pW m−2 K−2) | Maximum power output at ΔT = 90 °C (pW) | Thickness (mm) |
|---|---|---|---|---|
| P100 | 7.80 | 43.2 | 81.6 | 0.032 |
| P1G1 | 29.59 | 92.4 | 178.8 | 0.036 |
| P1G1B | 34.55 | 128.0 | 243.2 | 0.038 |
| P1G2B | 39.14 | 294.4 | 580.0 | 0.038 |
| P1G3B | 29.70 | 203.6 | 395.6 | 0.030 |
The value of the Seebeck coefficient was found to be positive for all the samples indicating p-type materials. For FTEG P1G2B, the maximum values of the Seebeck coefficient (Fig. 8(a)), power factor, and maximum power output (Fig. 8(b–c)) were observed as 39.14 μV K−1, 294.4 pW m−2 K−2 and 580 pW, while the minimum values witnessed for the device P100 were 7.8 μV K−1, 43.2 pW m−2 K−2 and 81.6 pW, respectively. Fig. 8(d) indicates that the plot was linear for all the samples and the production of positive thermopower. This is due to the presence of the delocalised electrons in graphite due to sp2 hybridisation.57 In the FTEG P1G3B, both the Seebeck coefficient and power output were found to be reduced when compared to those in P1G2B. This might be due to the larger value of the transient thermal conductivity in P1G3B among all the generators.35 In FTEG P1G1, the addition of graphite increased the value of the Seebeck coefficient from 7.8 μV K−1 to 29.89 μV K−1, which was almost 3 times when compared to that in P100 due to the addition of graphite as it has a staked sp2 hybridised C-6 ring structure that improves the thermoelectric properties. They produce delocalised electrons that move easily between the loosely packed hexagonal layers.58
For P1G1B, the addition of bismuth telluride improved the Seebeck coefficient from 29.59 μV K−1 to 34.57 μV K−1. The power output and power factor improved from 92.4 pW to 128 pW and from 178.8 pW m−2 K−2 to 243.2 nW m−2 K−2, respectively (Fig. 8(e)), due to the addition of Bi2Te3. Bi2Te3 has a large value of the thermoelectric figure of merit (ZT), high band degeneracy, high carrier mobility and comparatively low value of lattice thermal conductivity. Bi2Te3 exhibits a layered structure. The weak bond between two telluride ions (TE(1)–TE(1) bonds) leads to anisotropy as it is the reason for easy cleavage along the a and b crystallographic axes rather than along the c axis. Due to this, electrical conductivity along basal planes is high. Anisotropy indicates that conductivity perpendicular to basal planes i.e. along the c-axis is low.59 The thermoelectric properties of bismuth telluride are due to band structure and spin-orbit interactions.19 Spin-orbit interaction affects the band, causing band inversion. As the states mix and an anti-crossing occurs, a new band gap is opened. Spin-orbit interactions develop a multi-valley band structure in Bi2Te3. It increases degeneracy in the band structure. The number of states available for the electrons to occupy increases, which indicates an increase in electrical and thermal conductivities.
The analysis suggests that the low power output is due to the excess amount of binder (cellulose acetate propionate and DMF), which has low conductivity and reduces power generation. The thermoelectric performance of P1G2B ink-based FTEGs can be enhanced by connecting multiple FTEGs in series or parallel, as well as utilizing a step-up DC-to-DC converter, as reported by Wang et al. (2013). Incorporating a transformer may further enhance the power factor for real-life applications.60 Additionally, optimizing load resistance and increasing the temperature gradient could boost efficiency and power output.61
3.9 Internal resistance and power measurements of P1G2B
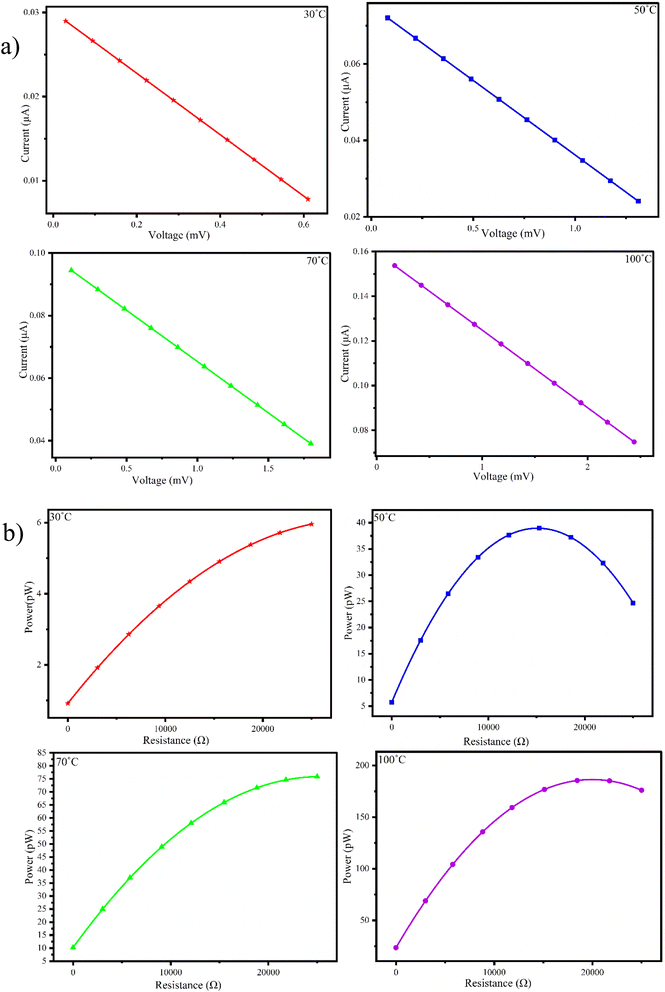
Since the maximum values of power factor and power output were observed for the P1G2B generator, we conducted a detailed performance analysis of the P1G2B device under various external loads and temperatures. Fig. 9(a) presents the I–V plot of P1G2B FTEG. The plot shows a linear relationship between voltage and current representing the ohmic behaviour of the composite at all four ΔT values. The current produced decreased as the voltage increased leading to a negative slope, which could be due to the presence of graphite and polyaniline in equal proportions in the composite. The relationship between the internal resistance and power was measured for P1G2B at different temperatures (30 °C, 50 °C, 70 °C and 100 °C). The power was calculated using the values of voltage and current. When the applied external resistance becomes equal to internal resistance, the power obtained is the maximum. Here, the maximum power transfer condition is reached. It allows power transfer to be efficient. When external resistance is too high, only a small amount of current passes through the circuit and vice versa. But most of the power is dissipated through the resistance. Therefore, when external resistance is equal to internal resistance, the maximum amount of current flows through the generator, resulting in the maximum amount of power transfer. In terms of energy, the internal resistance of the source and external resistance together act like a voltage divider circuit. When they become equal, half of the source drops across these two resistances, maximizing the power transfer.The measurements indicated that when the temperature is increased (30 °C, 50 °C, 70 °C and 100 °C), there was a gradual increase in power (Fig. 9(b)). Therefore, for the device P1G2B, the internal resistance is around 22 kΩ. Here, power was observed to be maximum. The maximum power (0.2133 nW) was generated at a temperature difference of 100 °C, which was about 2.5 times the power generated at a temperature difference of 70 °C.
3.10 Bending test
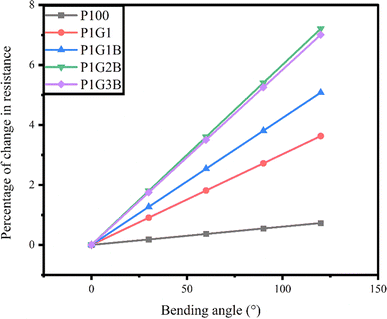
The bending test was carried out on the devices to check the flexibility of the printed FTEGs over the bending angles 0°, 30°, 60°, 90° and 120°. It was calculated by taking the length of the device and the maximum height attained during bending. The length of the device was 7.7 cm. The resistance was measured using a two-probe multimeter at these angles. The percentage of change in the resistance was found by dividing the change in the resistance by the original resistance and it is presented in Fig. 10.The percentage of change in the resistance at different bending angles is shown in Table 7.
| Name of the device | P100 | P1G1 | P1G1B | P1G2B | P1G3B | |
|---|---|---|---|---|---|---|
| Bending angle (°) | Length (cm) | % Of the change in resistance | % Of the change in resistance | % Of the change in resistance | % Of the change in resistance | % Of the change in resistance |
| 0° | 7.7 | 0 | 0 | 0 | 0 | 0 |
| 30° | 7.5 | 0.1824 | 0.9072 | 1.2694 | 1.8015 | 1.7514 |
| 60° | 5.3 | 0.3649 | 1.8144 | 2.5389 | 3.603 | 3.5029 |
| 90° | 4.3 | 0.5474 | 2.7216 | 3.8084 | 5.4046 | 5.2544 |
| 120° | 3.7 | 0.7299 | 3.6288 | 5.0779 | 7.206 | 7.0058 |
It was found that the percentage of change in resistance of the devices is less than 8%. Therefore, there was no considerable change occurring in the percentage of resistance observed in all the generators. For the bending angle of 120°, maximum change in resistance was observed in all the FTEGs. As such, for 120°, the percentage of change in resistance for P100 was 0.7299%, which is the smallest, while the highest change was shown for the device P1G2B, which was 7.206%. The percentage of change in resistance was found to reduce slightly for the device P1G3B when compared to the device P1G2B. It showed that all the FTEGs had good bending properties, indicating excellent flexibility.62
3.11 Folding test
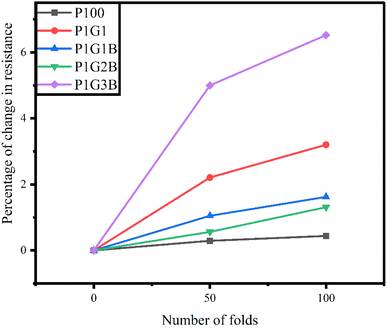
The folding test was performed on FTEGs to evaluate the flexibility of the FTEGs.63 The resistance was measured for all the devices using a two-probe multimeter without folding, and after folding 50 times and 100 times. It was found that the percentage of change in resistance is less than 10% (Table 8). For the device P100, the percentage of change in resistance was around 1.5 times while for the device P1G3B, it was around 1.3 times when the number of folds increased from 50 to 100. Compared to all four generators, P1G3B showed an increase in the percentage of resistance for both cases (4.98% and 6.52% for 50 and 100 folds, respectively) compared to all other generators indicating P1G3B had shown the least stability among them (Fig. 11).| Number of folds | Percentage change in the internal resistance of different FTEGs | ||||
|---|---|---|---|---|---|
| P100 | P1G1 | P1G1B | P1G2B | P1G3B | |
| 0 | 0 | 0 | 0 | 0 | 0 |
| 50 | 0.29 | 2.21 | 1.05 | 0.56 | 4.98 |
| 100 | 0.44 | 3.20 | 1.62 | 1.31 | 6.52 |
Table 9 shows the thermoelectric performance of P1G2B FTEG in comparison with the previously reported works.
| Materials | Substrate | Fabrication method | TEG thickness | No, of legs | Seebeck coefficient (μV K−1) | Power output (nW) | ΔT (K) | Ref |
|---|---|---|---|---|---|---|---|---|
| a Present work. | ||||||||
| Se doped MA Bi2Te3 and Te doped MA Bi0.5Sb1.5Te3 | Polyimide | Dispenser printer | 100 μm | 50 | 280 (Se-doped), 180 (Te doped) | 330 | 20 | 63 |
| KOH-treated PEDOT:PSS | Polyimide | Dispenser printer | — | 61 | 15–90 | 100 | 90 | 64 |
| Silver/nickel | Silica | Thermal evaporation | 0.24 | 7 | 19.6 | 2 | 6.6 | 65 |
| PANI/graphite | PET | Screen printing | — | 6 | 22.51 | 0.002 | 84 | 13 |
| MWCNT/CuO | PET | Screen printing | — | 15 | 47.77 | 1.06 | 100 | 66 |
| MWCNT/Fe2O3 | PET | Screen printing | — | 15 | 43.37 | 0.32 | 100 | 66 |
| Graphite/NiO | PET | Screen printing | — | 15 | 47.06 | 0.80 | 100 | 12 |
| PANI/graphite/Bi2Te3 composite | PET | Screen printing | 30–40 | 8 | 39.14 | 0.58 | 90 | a |
4. Conclusions
Upon adding graphite, the thermoelectric performance of the generators improved considerably. For all the composites, the Seebeck coefficient was positive indicating that they are p-type materials. The transient thermal conductivity of all the generators was reduced when the temperature was between 303 K to 333 K. P1G2B shows the highest value for the Seebeck coefficient (39.147 μV K−1), power factor of 0.0736 nW m−2 K−2, and power output of 0.0145 nW under external load conditions. The thickness of these generators are found to be between 0.03 mm and 0.04 mm. A bending test was performed and the percentage of change in resistance was calculated to be below 10%. Therefore, the devices are stable up to a bending angle of 120°. A flexibility test was performed and the percentage of change in resistance was calculated for all the generators for 0, 50 and 100 folds. It was found to be below 10%. The flexibility of the generators indicates their suitability for various flexible applications. These screen-printed FTEGs provide a new approach to power generation at low-temperature ranges.Data availability
The data given in the current research are available upon request from the corresponding author.Conflicts of interest
There is no conflict of interest to declare.Acknowledgements
The authors express their sincere gratitude to the Manipal Institute of Technology, MAHE, Manipal, for the laboratory facility, PG-seed money support, and faculty seed money support (ID: 000000611) for this research work. Ashok Rao acknowledges DST-FIST, Government of India (Grant No. FST/PS-I/2017/8).References
- G. S. Hegde, A. N. Prabhu, Y. H. Gao, Y. K. Kuo and V. R. Reddy, Potential thermoelectric materials of indium and tellurium co-doped bismuth selenide single crystals grown by melt growth technique, J. Alloys Compd., 2021, 866, 1–14 CrossRef.
- Y. Du, S. Z. Shen, W. Yang, R. Donelson, K. Cai and P. S. Casey, Simultaneous increase in conductivity and Seebeck coefficient in a polyaniline/graphene nanosheets thermoelectric nanocomposite, Synth. Met., 2012, 161, 23–24 CrossRef.
- G. S. Hegde and A. N. Prabhu, Improved electrical conductivity and power factor in Sn and Se co-doped melt-grown Bi2Te3 single crystal, J. Mater. Sci.:Mater. Electron., 2021, 32, 24871–24888 CrossRef.
- N. Gospodinova and L. Terlemezyan, Conducting polymers prepared by oxidative polymerization: Polyaniline, Prog. Polym. Sci., 1998, 23(8), 1443–1484 CrossRef.
- J. Li, X. Tang, H. Li and Y. Yan, Synthesis and thermoelectric properties of hydrochloric acid-doped polyaniline, Synth. Met., 2010, 160(11–12), 1153–1158 CrossRef.
- A. Agarwal, T. Banerjee, J. Gockel, S. LeBlanc, J. Walker, J. Middendorf. Predicting Thermoelectric Power Factor of Bismuth Telluride during Laser Powder Bed Fusion Additive Manufacturing. 2023; vol. 1: pp. 1–8 Search PubMed.
- S. E. Bourdo, B. A. Warford and T. Viswanathan, Electrical and thermal properties of graphite/polyaniline composites, J. Solid State Chem., 2012, 196, 309–313 CrossRef.
- Y. H. Zhang, T. J. Zhu, J. P. Tu and X. B. Zhao, Flower-like nanostructure and thermoelectric properties of hydrothermally synthesized La-containing Bi2Te3 based alloys, Mater. Chem. Phys., 2007, 103, 484–488 CrossRef.
- N. Chen, D. Ao, J. Guo, W. Bao, Y. Chen and Z. Zheng, In Situ Synthesis of High Thermoelectric Performance Bi2Te3 Flexible Thin Films through Thermal Diffusion Engineering, Coatings, 2023, 13(12), 1–8 Search PubMed.
- H. Mamur, M. R. A. Bhuiyan, F. Korkmaz and M. Nil, A review on bismuth telluride (Bi2Te3) nanostructure for thermoelectric applications, Renewable Sustainable Energy Rev., 2018, 82, 4159–4169 CrossRef.
- S. A. Othman, S. Radiman and K. K. Siong, Methanol as a suitable solvent for polyaniline emeraldine base (PANI-EB), AIP Conf. Proc., 2010, 1250(1), 357–360 CrossRef.
- R. Nayak, P. Shetty, M. Selvakumar, A. Rao, M. K. Rao and M. M. Subrahmanya, et al., Enhanced performance of graphite/NiO ink-based flexible thermoelectric generators via compositional gradient and annealing of NiO nanoparticles, J. Mater. Sci., 2023, 58(11), 4901–4921 CrossRef.
- R. Nayak, P. Shetty, S. M, A. Rao, K. M. Rao and G. K, et al., Enhancement of power factor of screen printed polyaniline/graphite based flexible thermoelectric generator by structural modifications, J. Alloys Compd., 2022, 922, 1–10 CrossRef.
- H. F. Alesary, H. K. Ismail, A. F. Khudhair and M. Q. Mohammed, Effects of Dopant Ions on the Properties of Polyaniline Conducting Polymer, Orient. J. Chem., 2018, 34, 2525–2533 Search PubMed.
- Q. Zhang, Y. Sun, W. Xu and D. Zhu, Organic Thermoelectric Materials: Emerging Green Energy Materials Converting Heat to Electricity Directly and Efficiently, Adv. Mater., 2014, 26(40), 6829–6851 CrossRef PubMed.
- H. Qureshi and S. Singh, Growth and X-Ray Diffraction Studies of Bismuth Telluride – A Novel Material for Thermoelectric Cooling Applications, Int. J. Mech. Struct., 2017, 7(1), 7–11 Search PubMed.
- M. S. Akhanda, S. E. Rezaei, K. Esfarjani, S. Krylyuk, A. V. Davydov and M. Zebarjadi, Thermomagnetic properties of Bi2Te3 single crystal in the temperature range from 55 K to 380 K, Phys. Rev. Mater., 2021, 5, 1–25 Search PubMed.
- M. M. Rashad, A. El-Dissouky, H. M. Soliman, A. M. Elseman, H. M. Refaat and A. Ebrahim, Structure evaluation of bismuth telluride (Bi2Te3) nanoparticles with enhanced Seebeck coefficient and low thermal conductivity, Mater. Res. Innovations, 2018, 22(6), 315–323 Search PubMed.
- I. T. Witting, T. C. Chasapis, F. Ricci, M. Peters, N. A. Heinz and G. Hautier, et al., The Thermoelectric Properties of Bismuth Telluride, Adv. Electron. Mater., 2019, 5, 1–66 Search PubMed.
- G. Shridhar, V. Parol, A. Rao, A. N. Prabhu, J. J. B. Levinsky and G. R. Blake, graphene oxide composites prepared by solid-state reaction, Mater. Res. Bull., 2022, 145, 1–13 Search PubMed.
- I. O. P. C. Series and M. Science, Dielectric Properties of PANI/CuO Nanocomposites Dielectric Properties of PANI/CuO Nanocomposites, Adv. Electron. Mater., 2018, 310, 1–8 Search PubMed.
- K. I. Ajeel and Q. S. Kareem, Synthesis and Characteristics of Polyaniline (PANI) Filled by Graphene (PANI/GR) nano-Films, J. Phys.:Conf. Ser., 2019, 1234(1), 1–12 Search PubMed.
- E. Rusen, A. Diacon, C. Damian, R. Gavrila, A. Dinescu and A. Dumitrescu, et al., Electroconductive materials based on carbon nanofibers and polyaniline, J. Appl. Polym. Sci., 2018, 135(48), 1–7 CrossRef.
- G. S. Hegde, A. N. Prabhu, A. Rao and P. D. Babu, Enhancement of thermoelectric performance of In doped Bi2Te2.7Se0.3 compounds, Phys. B, 2020, 584, 1–10 CrossRef.
- M. Takashiri, K. Miyazaki, S. Tanaka, J. Kurosaki, D. Nagai and H. Tsukamoto, Effect of grain size on thermoelectric properties of n -type nanocrystalline bismuth-telluride based thin films, J. Appl. Phys., 2008, 104(8), 1–7 CrossRef.
- A. M. Adam, A. El-Khouly, E. Lilov, S. Ebrahim, Y. Keshkh and M. Soliman, et al., Ultra thin bismuth selenide-bismuth telluride layers for thermoelectric applications, Mater. Chem. Phys., 2019, 224, 264–270 CrossRef.
- R. Matsumoto, Y. Hoshina and N. Akuzawa, Thermoelectric properties and electrical transport of graphite intercalation compounds, Mater. Trans., 2009, 50(7), 1607–1611 CrossRef.
- T. D. Burchell and T. R. Pavlov, Graphite: Properties and Characteristics, Compr Nucl Mater, 2020, 355–381 Search PubMed.
- G. Chen, F. Li, J. Geng, P. Jing and Z. Si, Identification, generation of autoclaved aerated concrete pore structure and simulation of its influence on thermal conductivity, Constr. Build. Mater., 2021, 294, 1–27 Search PubMed.
- F. G. Cuevas, J. M. Montes, J. Cintas and P. Urban, Electrical conductivity and porosity relationship in metal foams, J. Porous Mater., 2009, 16(6), 675–681 CrossRef.
- J. Liu, M. Zhou, L. Z. Fan, P. Li and X. Qu, Porous polyaniline exhibits highly enhanced electrochemical capacitance performance, Electrochim. Acta, 2010, 55(20), 5819–5822 CrossRef.
- M. Gunes and M. Ozenbas, Effect of grain size and porosity on phonon scattering enhancement of Ca3Co4O9, J. Alloys Compd., 2015, 626, 360–367 CrossRef.
- J. Wei, Y. Wang, X. Li, Z. Jia, S. Qiao and Q. Zhang, et al., Effect of porosity and crack on the thermoelectric properties of expanded graphite/carbon fiber reinforced cement-based composites, Int. J. Energy Res., 2020, 44(8), 6885–6893 CrossRef.
- D. Peak Fourier transform infrared spectroscopic methods of soil analysis. 2nd edn. Encyclopedia of Soils in the Environment. 2023; vol. 2: pp. 510–518 Search PubMed.
- K. P. Kakde, Synthesis and Characterization of Polyaniline Doped with HCl, H2SO4 and PVA as Secondary Dopant for Toxic Gas (Ammonia) Sensor, Indian J. Sci. Technol., 2017, 10(20), 1–4 CrossRef.
- V. Ţucureanu, A. Matei and A. M. Avram, FTIR Spectroscopy for Carbon Family Study, Crit. Rev. Anal. Chem., 2016, 46(6), 502–520 CrossRef PubMed.
- I. Šeděnková, M. Trchová and J. Stejskal, Thermal degradation of polyaniline films prepared in solutions of strong and weak acids and in water - FTIR and Raman spectroscopic studies, Polym. Degrad. Stab., 2008, 93(12), 2147–2157 CrossRef.
- G. Bharath, B. S. Latha, E. H. Alsharaeh, P. Prakash and N. Ponpandian, Enhanced hydroxyapatite nanorods formation on graphene oxide nanocomposite as a potential candidate for protein adsorption, pH controlled release and an effective drug delivery platform for cancer therapy, Anal. Methods, 2017, 9(2), 240–252 RSC.
- R. Visca, M. N. Dewi, A. Liviani and B. D. Satriawan, Characterisation of FTIR in graphite from palm oil, Interdisciplinary Social Studies, 2022, 1(11), 1355–1358 CrossRef.
- J. Klein, L. Kampermann, B. Mockenhaupt, M. Behrens, J. Strunk and G. Bacher, Limitations of the Tauc Plot Method, Adv. Funct. Mater., 2023, 33(47), 1–19 CrossRef.
- S. Patel, A. Raulji, D. Patel, D. Panchal, M. Dalwadi and U. Upadhyay, A Review on Uv Visible Spectroscopy, Int. J. Pharm. Res. Appl, 2022, 7(10), 1144–1151 Search PubMed.
- D. F. Perepichka, F. Wudl, S. R. Wilson, Y. Sun and D. I. Schuster, The dissolution of carbon nanotubes in aniline, revisited, J. Mater. Chem., 2004, 14(18), 2749–2752 RSC.
- N. M. S. Hidayah, W. W. Liu, C. W. Lai, N. Z. Noriman, C. S. Khe and U. Hashim, et al., Comparison on graphite, graphene oxide and reduced graphene oxide: Synthesis and characterization, AIP Conf. Proc., 2017, 1892, 1–9 CrossRef.
- P. Makuła, M. Pacia and W. Macyk, How To Correctly Determine the Band Gap Energy of Modified Semiconductor Photocatalysts Based on UV-Vis Spectra, J. Phys. Chem. Lett., 2018, 9(23), 6814–6817 CrossRef.
- M. Shaik and I. A. Motaleb, Effect of growth temperature on the material properties of PLD-grown Bi2Te3 and Sb2Te3, IEEE Int. Conf. Electro Inf. Technol, 2013, 1–6 Search PubMed.
- V. N. Prigodin and K. B. Efetov, Localization transition in a random network of metallic wires: A model for highly conducting polymers, Phys. Rev. Lett., 1993, 70(19), 2932–2935 CrossRef PubMed.
- H. Song, K. Cai, J. Wang and S. Shen, Influence of polymerization method on the thermoelectric properties of multi-walled carbon nanotubes/polypyrrole composites, Synth. Met., 2016, 211, 58–65 CrossRef.
- P. S. Rao, J. Anand, S. Palaniappan and D. N. Sathyanarayana, Effect of sulphuric acid on the properties of polyaniline-HCl salt and its base, Eur. Polym. J., 2000, 36(5), 915–921 CrossRef.
- S. B. Utomo, W. A. S. Winarto and I. N. G. Wardana, The role of mineral sea water bonding process with graphite-aluminum electrodes as electric generator, Sci. World J., 2019, 4, 1–12 Search PubMed.
- A. D. Jara, A. Betemariam, G. Woldetinsae and J. Y. Kim, Purification, application and current market trend of natural graphite: A review, Int. J. Min. Sci. Technol., 2019, 29, 671–689 CrossRef.
- A. L. D. Hung and Z. Pásztory, An overview of factors influencing thermal conductivity of building insulation materials, J. Build. Eng, 2021, 44, 1–16 Search PubMed.
- J. Yang. Theory of Thermal Conductivity. 2006;pp. 1–20 Search PubMed.
- N. Mathis, Transient thermal conductivity measurements: Comparison of destructive and nondestructive techniques, High Temp. - High Pressures, 2000, 32(3), 321–327 CrossRef CAS.
- S. Hadjipanteli, P. S. Ioannou, T. Krasia-Christoforou and T. Kyratsi, Thermoelectric Properties of Polyaniline/Bismuth Antimony Telluride Composite Materials Prepared via Mechanical Mixing, Appl. Sci., 2023, 13(17), 1–17 Search PubMed.
- W. M. Haynes, J. Am. Pharm. Assoc., Sci. Ed., 1946, 7, 52–97 Search PubMed.
- L. Zhang, K. K. Deng, K. B. Nie, C. J. Wang, C. Xu and Q. X. Shi, et al., Thermal conductivity and mechanical properties of graphite/Mg composite with a super-nano CaCO3 interfacial layer, iScience, 2023, 26(4), 1–24 Search PubMed.
- J. P. Moore, R. S. Graves and D. L. McElroy, Thermal and electrical conductivities and Seebeck coefficients of unirradiated and irradiated graphites from 300 to 1000°K, Nucl. Technol., 1974, 22(1), 88–93 CrossRef.
- G. Yuan, X. Li, Z. Dong, A. Westwood, Z. Cui and Y. Cong, et al., Graphite blocks with preferred orientation and high thermal conductivity, Carbon, 2012, 50(1), 175–182 CrossRef.
- D. L. Greenaway and G. Harbeke, Band structure of bismuth telluride, bismuth selenide and their respective alloys, J. Phys. Chem. Solids, 1965, 26(10), 1585–1604 CrossRef.
- W. Wang, V. Cionca, N. Wang, M. Hayes, B. O'Flynn and C. O'Mathuna, Thermoelectric energy harvesting for building energy management wireless sensor networks, Int. J. Distrib. Sens. Netw., 2013, 2013(6), 1–14 Search PubMed.
- N. Jaziri, A. Boughamoura, J. Müller, B. Mezghani, F. Tounsi and M. Ismail, A comprehensive review of Thermoelectric Generators: Technologies and common applications, Energy Rep., 2020, 6, 264–287 CrossRef.
- H. Li, Y. Liu, S. Liu, P. Li, C. Zhang and C. He, Wet-spun flexible carbon nanotubes/polyaniline fibers for wearable thermoelectric energy harvesting, Composites, Part A, 2023, 166, 1–8 Search PubMed.
- C. J. An, Y. H. Kang, A. Y. Lee, K. S. Jang, Y. Jeong and S. Y. Cho, Foldable Thermoelectric Materials: Improvement of the Thermoelectric Performance of Directly Spun CNT Webs by Individual Control of Electrical and Thermal Conductivity, ACS Appl. Mater. Interfaces, 2016, 8(34), 22142–22150 CrossRef PubMed.
- L. Stepien, A. Roch, S. Schlaier, I. Dani, A. Kiriy and F. Simon, Investigation of the Thermoelectric Power Factor of KOH-Treated PEDOT: PSS Dispersions for Printing Applications, Energy Harvest. Systems, 2016, 3(1), 101–111 CrossRef.
- A. Yadav, K. P. Pipe and M. Shtein, Fiber-based flexible thermoelectric power generator, J. Power Sources, 2008, 175(2), 909–913 CrossRef.
- R. Nayak, P. Shetty, M. Selvakumar, B. Shivamurthy, A. Rao and K. V. Sriram, et al., Influence of microstructure and thermoelectric properties on the power density of multi-walled carbon nanotube/metal oxide hybrid flexible thermoelectric generators, Ceram. Int., 2023, 49, 39307–39328 CrossRef CAS.
Footnotes |
| † Electronic supplementary information (ESI) available. See DOI: https://doi.org/10.1039/d4ra04565c |
| ‡ Co-first authors (equal contribution from first and second author). |
| This journal is © The Royal Society of Chemistry 2024 |

