DOI:
10.1039/D4RA04585H
(Paper)
RSC Adv., 2024,
14, 27980-27989
Effects of alcohols as sacrificial reagents on a copper-doped sodium dititanate nanosheets/graphene oxide photocatalyst in CO2 photoreduction†
Received
23rd June 2024
, Accepted 20th August 2024
First published on 2nd September 2024
Abstract
Carbon dioxide (CO2) photoreduction is an intriguing approach that converts CO2 into high-value substances with the assistance of a photocatalyst. Key to effective photoreduction is to promote the interaction of photo-induced holes and a sacrificial reagent (SCR), separating the holes from photoelectrons and enhancing the rate of the subsequent product generation. Methanol, ethanol, isopropanol, and water SCRs were tested for their ability to assist a copper-doped sodium dititanate nanosheets/graphene oxide heterostructure (CTGN) in CO2 photoreduction. The CTGN photocatalyst was suspended in a CO2-saturated aqueous solution with the assigned SCR while illuminated by a mercury lamp. Product samples from the gas and liquid phases were analyzed for targeted product compositions. Methanol SCR exhibited the best performance in facilitating CO2 photoreduction, producing ethanol as the main product at a total carbon consumption (TCC) of 6544 μmol gcat−1. The remarkable performance of methanol is attributed to the high diffusivity and excellent stability of the hydroxymethyl radical that developed during the photoreduction. The kinetics studies revealed the first and second order for the CO2 depletion and product generation rates, respectively, for the alcohol SCRs.
1 Introduction
Reduction of the CO2 emissions has become a public issue due to its significant impact on climate change and environmental-related problems. The issue has been recognized and promoted strongly by the United Nations through the Climate Program Office (CPO). The goal is to realize a global achievement of a 50% reduction in emissions by 2030 and net-zero emissions by 2050.1,2 Much effort has been spent by researchers and industrial personnel to mitigate the issue by exploring low-carbon emission technologies, switching to alternative energy sources, and developing CO2 capture and storage technologies. Current technologies involve capturing CO2 using amines or solid adsorbents, followed by CO2 desorption, utilization, or underground storage.
One emerging technology, CO2 conversion, is concerned with transforming CO2 into high-value products, such as carbon nanostructures, hydrocarbon fuels, and alcohols,3–9 which can be used onsite or sold as commodities. CO2 photoreduction is a CO2 conversion technique that uses photoactive materials such as zinc oxide (ZnO) and titanium dioxide (TiO2) as photocatalysts. Brief mechanisms for a TiO2-catalyzed CO2 photoreduction start with TiO2 activation, in which photoelectrons and photo-induced holes are isolated in ultraviolet-to-visible light. Photoelectrons are transferred from a valence band (VB) to a conductive band (CB) of the TiO2 (eqn (1)). On one hand, the CB photoelectrons incorporate CO2 and create the CO2− active radical (eqn (2)). Subsequent reactions of the CO2−, protons, and other radicals generate a wide range of products, such as methane, methanol, ethanol, and acetaldehyde.10–12 On the other hand, photo-induced holes at VB interact with a sacrificial reagent (SCR), a group of hole scavenger or electron donor substances, to stay isolated from the photoelectrons. Water is the most common SCR. It provides the hydroxyl group (OH−) to quench the VB photo-induced holes (h+) and releases them as protons (H+) (eqn (3) and (4)).
| | |
2CO2 + 2e− (CB) → 2CO−2
| (2) |
An SCR influences the production of diverse substances. For instance, Qin S and their team13 used methanol SCR to assist a copper–TiO2 photocatalyst in CO2 photoreduction. They demonstrated that the role of the methanol SCR was to attract photo-induced protons from TiO2 and generate intermediates for subsequent formaldehyde and methyl formate production. López C. R. et al.14 studied the effects of methanol and ethanol SCRs in facilitating platinum–TiO2 for CO2 photoreduction. The uses of methanol and ethanol SCRs led to the formation of formic acid and acetaldehyde, respectively. The group of Tsukamoto D.15 studied the role of ethanol SCR in supporting a gold–silver/TiO2 photocatalyst in hydrogen peroxide production. They reported acetaldehyde and CO2 as by-products from the photooxidation. Wang Y. and their team16 used isopropanol SCR to assist bismuth sulfide (Bi2S3) quantum dots/TiO2 nanosheets. The CO2 photoreduction yielded methanol and acetone, which were reported to originate from CO2 and the isopropanol SCR, respectively.
The copper-doped sodium dititanate nanosheets/graphene oxide heterostructure (CTGN) is a photocatalyst that integrates the high surface activity of dititanate nanosheets,17 charge transfer ability of graphene oxide (GO),10,11,18 and charge separation ability of copper.10,13 The heterostructure contains n–p heterojunctions between the nanosheets and GO, which promotes charge separation and enhances photoactivity. Our team11 synthesized CTGN using a hydrothermal technique with an alkali soft template. The heterostructure combined two 2-dimensional nanostructures, sodium dititanate nanosheets (Na2Ti2O5) and GO. The CTGN proved to be an excellent photocatalyst in CO2 photoreduction with water SCR, giving methanol, ethanol, isopropanol, and acetone at a total carbon consumption (TCC) of ∼1 mM.
This research studied the effects of methanol, ethanol, and isopropanol SCRs on CTGN-catalyzed CO2 photoreduction. We investigated the roles of the alcohol SCRs, focusing on the type of active radicals, kinetic reactions, type of products, and CO2 photoreduction rates. Various targeted products from the photoreduction, including acetaldehyde, ethanol, isopropanol, acetone, and methane, were detected and monitored using Gas Chromatography (GC). Electron spin resonance (ESR) and photoluminescence (PL) were used for the time-dependent analysis of active radicals involved in photoreduction and the rate of electron–hole recombination. Physical, optical, and chemical properties of CTGN were characterized using various techniques such as high-resolution transmission electron microscopy (HR-TEM), UV-visible spectroscopy (UV-vis), X-ray diffractometer (XRD), and Fourier transform spectroscopy (FTIR).
2 Experimental
2.1 Materials
Graphite flakes (99.9%, 325 mesh), sodium nitrate (99%, NaNO3), and hydrogen peroxide (30%, H2O2) were purchased from Alfa Aesar, Fluka Chemika, and Merck, respectively. Potassium permanganate (99.0%, KMnO4) and sodium hydroxide (analytical grade, NaOH) were obtained from Ajax FineChem and used as received. Titanium(IV) butoxide (TBOT) (reagent grade, Ti(C4H9O)4) and copper(II) nitrate (Cu(NO3)2·3H2O) were supplied by Sigma-Aldrich. The solvents, including sulfuric acid (98%, concentrated H2SO4), hydrochloric acid (37%, HCl), methanol (99.9%, CH3OH), ethanol (99.9%, C2H5OH), and isopropanol (99.8%, C3H7OH) were obtained from RCI Labscan. Lor Ching Tong Oxygen (Thailand) supplied CO2 gas (99.9%, CO2). N-tert-Butyl-α-phenylnitrone (98.0%, PBN) was purchased from the Tokyo Chemical Industry Co., Ltd, Japan, and used without further treatment.
2.2 GO synthesis
GO was synthesized following a chemical exfoliation method. The method started by mixing 2 g graphite flakes (Alfa Aesar, 99.9%, −325 mesh), 0.6 g NaNO3, and 20 mL H2SO4 in a 250 mL flask in an ice bath (0 °C). 10 g KMnO4 was gradually added to the blend throughout 2 h while the mixture was held below 4 °C. The mixture was brought to room temperature and stirred for 2 h before adding 20 mL of 30% H2O2 and 180 mL of DI water. GO suspension was filtered using a vacuum filtration apparatus, and a brown paste was obtained. The paste was re-suspended in DI water and centrifuged at 9600 rpm for 15 min using the Eppendorf 5804R laboratory centrifuge machine. The supernatant was drained, and fresh DI water was added to re-suspend the precipitated GO. The cycle was repeated several times to remove chemical residues. The GO paste was, then, dried in an oven at 70 °C for 12 h and kept in a desiccator for the following experiments.
2.3 Photocatalyst synthesis
To synthesize CTGN, 0.71 mL TBOT, 20 mL ethanol, and 10 mL DI water were mixed and added to 3.84 mg Cu(NO3)2·3H2O and 10 mL of 1 M NaOH. The solution was blended with GO suspension, consisting of 15 mg GO and 20 mL DI water. The blend was preheated at 60 °C for 30 min and transferred to a Teflon-lined hydrothermal reactor. The reactor was heated at 180 °C for 8 h, and cooled to room temperature. The CTGN powder was obtained and kept in a dry environment for future use. Several samples were also synthesized to be compared with the CTGN, including sodium dititanate nanosheets (TiN), copper-doped TiN (CTN), and TiN/GO (TGN). For TiN, 10 mL of 1 M NaOH was added to the solution of 0.71 mL TBOT, 20 mL ethanol, and 10 mL water. The mix was transferred to the hydrothermal reactor and heated at 180 °C for 8 h. For CTN, 10 mL of 1 M NaOH and 3.84 mg Cu(NO3)2·3H2O was mixed with the TOBOT solution (0.71 mL TBOT, 20 mL ethanol, and 10 mL water). The mix was heated in the hydrothermal reactor at 180 °C for 8 h. The TiN/GO was synthesized by adding 10 mL of 1 M NaOH with 0.71 mL TBOT, 20 mL ethanol, 10 mL water, and 20 mL of GO suspension (0.75 mg mL−1 GO). The mix was heated in the hydrothermal reactor at 180 °C for 8 h.
2.4 Photoreduction of CO2
CTGN suspension in DI water (0.1 mg mL−1, 20 mL) was purged by a CO2 gas stream at 0.2 L min−1 for 20 min. The CO2-saturated suspension was added to the 0.5 mM alcohol SCR (methanol, ethanol, or isopropanol) and transferred to an air-tight quartz reactor. The reactor has a total volume of ∼30 mL, leaving the head spacing of ∼6 mL, excluding the reactor cap. During a 6 h period of photoreduction, the suspension was illuminated by a mercury lamp (Phillips, Mercury-lamp 160 W), allowing the CTGN to be activated and to catalyze the photoreduction. Liquid and gas samples were collected in GC vials at the end of the operation. The samples were analyzed using a GC-FID analysis (DB WAX column, Agilent Technologies) to determine the composition of the targeted products.
2.5 Measurement of CO2 dissolution in water
A 20 mL CO2-saturated CTGN suspension (0.1 mg mL−1) was prepared and illuminated for photoreduction. The concentration of the dissolved CO2 was analyzed by titrating the suspension with 0.1 M NaOH titrant and a phenolphthalein indicator. The volume of the NaOH solution was recorded and used to quantify the dissolved CO2 concentration.
2.6 ESR analysis
The CTGN suspension (1 mg mL−1) was prepared in an 80% v/v water-SCR mixture and purged by the CO2 gas stream. 50 mg PBN was added to the suspension as a spin trap and transferred to an ESR flat cell. The cell was irradiated by a 500 W Xe lamp (USHIO, SX-UI501XQ), inserted into the ESR (Bruker EMX ESR), and operated at a center field of 3500 G, sweep width of 100 G, receiver gain of 2 × 10⁴–1 × 10⁵, modulation frequency of 100 kHz, modulation amplitude of 2.35 to 5.35, modulation phase of 0–20, time constant of 20.48 ms, and conversion time of 4 to 20.48 ms.
2.7 Material characterizations
The physical, optical, and chemical properties of the CTGN composite were analyzed using the XRD (Bruker, Germany), FTIR (JASCO FT/IR-6800, Japan), UV-vis (1800 Shimadzu, Japan), HR-TEM (G2 20s TWIN, FEI, USA), and Spectrofluorometer (Jasco, FP-6200, PL experiments).
3 Results and discussion
3.1 CTGN characterizations
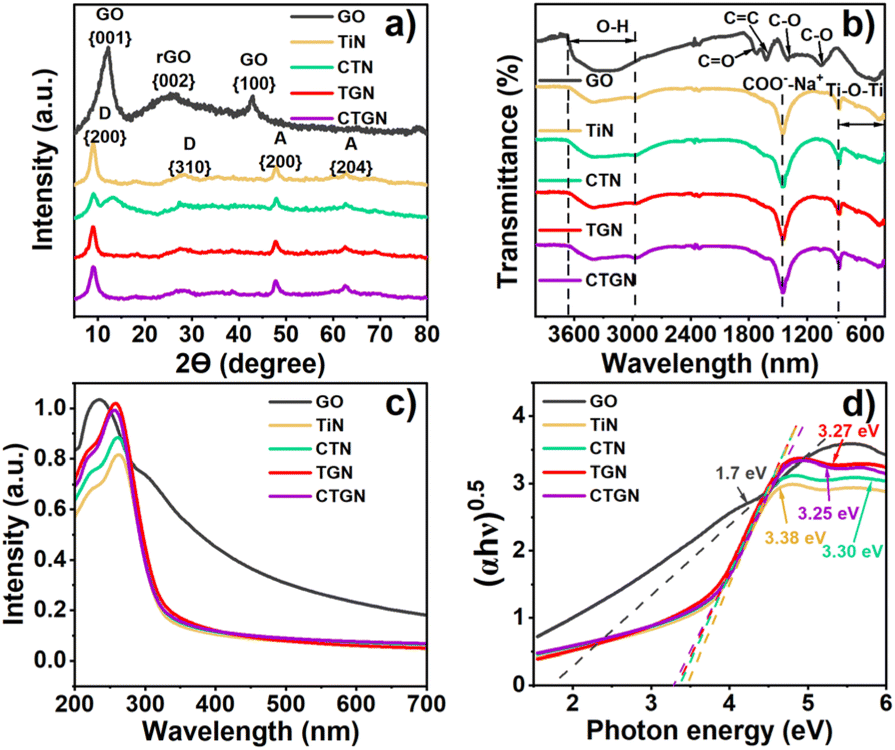
The complete characterizations of the CTGN, GO, TiN, CTN, and TGN were reported in our previous work and are partly provided here to show the consistency of our synthesis and analysis techniques.14 The prime purpose of this research is to investigate the role of alcohol SCRs in CO2 photoreduction using CTGN as a photocatalyst model. HR-TEM revealed the physical structure of CTGN (Fig. 1(a)) as the sodium dititanate nanosheets on the GO support. The d-spacing is determined from Fig. 1(b) to be 0.72 nm, ascribed to the distance between the {200} planar of sodium dititanate.19 The sheets have an average size of 49.19 ± 20.06 × 35.99 ± 16.12 nm2 (Fig. 1(c and d)). The electron diffraction pattern (Fig. 1(b), Inset) reveals crystal structures for the nanosheets to be a combination of polycrystalline with small grain sizes and amorphous structures. The structures agree well with reports from our previous studies.14 Atomic composition, as analyzed by the Energy Dispersive X-ray Spectrometer (EDS), indicates the presence of Cu, sodium (Na), titanium (Ti), oxygen (O), and carbon (C) elements (Fig. S1 and S2†). The result suggests that the CTGN composite contains sodium dititanate nanosheets and GO.
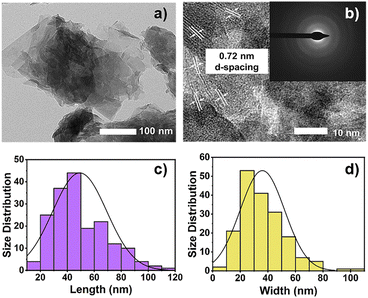 |
| | Fig. 1 HR-TEM images showing (a) CTGN and (b) zoom-in CTGN with the d-spacing and light diffraction pattern (Inset): distribution of the length (c) and width (d) of the sodium dititanate nanosheets. | |
The XRD pattern (Fig. 2(a)) presents crystallographic information on the solid powders. For GO, the pattern exhibits diffraction peaks at 12.24° and 42.9°, correlating to the {001} and {100} planes of the graphite.20 A broad peak at 25.6° is related to the {002} plane of reduced graphene oxide (rGO),20 suggesting the presence of a partial reduction state of the GO. The TiN was synthesized following the same hydrothermal chemistry as CTGN with no GO substrate and without the copper precursor. XRD pattern shows peaks at 9° and 28.25°, corresponding to the {200} and {310} planes of the sodium dititanate (Na2Ti2O5).21,22 Extra peaks at 48° and 62.52° are assigned to {200} and {204} planes of TiO2 anatase.17,19 CTN provides a similar anatase. XRD patterns for the TGN and CTGN present dititanate pattern to TiN, displaying peaks for the sodium dititanate and TiO2 crystallinity at 9° and 28.25°, ascribed to the {200} and {310} planes of the sodium dititanate. TiO2 anatase peaks were located at 48° and 62.52°, correlating with the presence of {200} and {204} planes. TGN and CTGN show no signal from copper and GO. We believe the mixed sodium dititanate and TiO2 anatase phases create interfacial defects that function as heterostructure.13 The heterostructure accommodates active radicals and assists in charge separation for the CTGN, which leads to promoted photoactivity.11
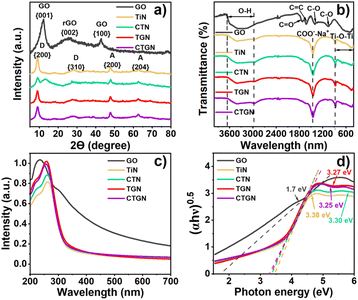 |
| | Fig. 2 XRD spectra (a), FTIR transmittances (b), UV-vis spectra (c), and Tauc plot showing bandgap energy (d) of GO, TiN, CTN, TGN, and CTGN. | |
Chemical functionalities of GO, TiN, CTN, TGN, and CTGN were analyzed using FTIR (Fig. 2(b)). For GO, a broad transmittance peak for the hydroxyl group (–OH) appears at 3669 cm−1 to 2925 cm−1. The stretching C![[double bond, length as m-dash]](https://www.rsc.org/images/entities/char_e001.gif) O and CC bonds occur at 1732 cm−1 and 1608 cm−1, respectively.23–25 The 1392 cm−1 and 1054 cm−1 peaks correspond to the stretching C–O bonds. The IR transmittances of TiN, CTN, TGN, and CTGN are identical, revealing broad peaks at 3413 cm−1 to 2954 cm−1, correlated to the hydroxyl group (–OH). The sharp peak at 1455 cm−1 is interpreted as carboxyl and sodium ions stretching (–COO– and Na+), indicating the presence of sodium dititanate.26 The other broad peak from 500 to 800 cm−1 represents Ti–O–Ti and Ti–O interactions.22
O and CC bonds occur at 1732 cm−1 and 1608 cm−1, respectively.23–25 The 1392 cm−1 and 1054 cm−1 peaks correspond to the stretching C–O bonds. The IR transmittances of TiN, CTN, TGN, and CTGN are identical, revealing broad peaks at 3413 cm−1 to 2954 cm−1, correlated to the hydroxyl group (–OH). The sharp peak at 1455 cm−1 is interpreted as carboxyl and sodium ions stretching (–COO– and Na+), indicating the presence of sodium dititanate.26 The other broad peak from 500 to 800 cm−1 represents Ti–O–Ti and Ti–O interactions.22
The optical properties and bandgap energy were analyzed using UV-vis spectrum (Fig. 2(c)) and Tauc's correlation (Fig. 2(d)). GO exhibits good light absorbance from UV to visible regions, with an absorption peak at 234 nm. The bandgap energy was determined to be 1.7 eV. TiN and CTN absorb UV light, showing absorption peaks at 263 and 261 nm and bandgap energy of 3.38 and 3.30 eV. CTN shows a slight improvement from a red shift in absorption peak and reduced bandgap energy due to copper addition to the dititanate nanosheets. TGN and CTGN provide improved optical properties due to the composition of dititanate nanosheets with GO sheets. Absorption peaks of 256 and 259 nm and energy bandgaps of 3.27 and 3.25 were indicated.22 A narrow bandgap suggests enhanced charge mobility and increased charge carriers engaged in the photoreactions.8
3.2 CO2 photoreduction
The photoreduction experiments were conducted in a quartz reactor containing CTGN suspension (0.1 mg mL−1) in a CO2-saturated aqueous medium. Methanol, ethanol, or isopropanol was added to the suspension as the SCR. In the case of no added alcohol, water functions as the SCR. The reactor was gas-tight and illuminated by a mercury lamp for 6 h. After the operation, liquid and gas samples were collected and analyzed for the composition of the targeted products, which include acetaldehyde, acetone, ethanol, and isopropanol (Fig. 3), using GC analysis (Fig. S3†). Methane was detected in the gas phase sample only at a few nmol gcat−1 h−1 (Fig. S4†) and was discarded from our study. The amount of the targeted products subtracted by the amount of SCR was reported in the production rate (μmol gcat−1 h−1) and TCC (μmol gcat−1) (eqn (5)), where| | |
TCC (μmol gcat−1) = [(acetaldehyde production rate × 2) + (acetone production rate × 3) + (ethanol production rate × 2) + (isopropanol production rate × 3)] × 6
| (5) |
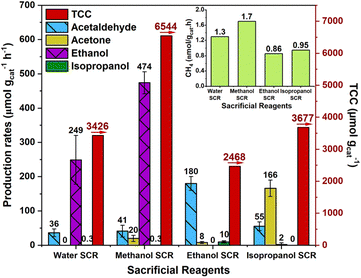 |
| | Fig. 3 Production rate of targeted products (Left ordinate) and TCC (Right ordinate) corresponding to water, methanol, ethanol, and isopropanol SCRs. | |
The TCC represents the normalized product generation, the total number of carbon atoms, contained in the target products. For the water SCR, CTGN yielded only acetaldehyde and ethanol as products from CO2 photoreduction. The production rates were 36.0 and 249.0 μmol gcat−1 h−1, and the TCC was 3426.0 μmol gcat−1. For the methanol SCR, production rates for acetaldehyde and ethanol increased to 41.0 μmol gcat−1 h−1 and 474.0 μmol gcat−1 h−1, while acetone and isopropanol were generated at 20.0 and 0.3 μmol gcat−1 h−1. The TCC was 6544.0 μmol gcat−1. For ethanol SCR, the photoreduction provided mainly acetaldehyde at 180.0 μmol gcat−1 h−1, and acetone and isopropanol at 8.0 and 10.0 μmol gcat−1 h−1. The TCC was determined to be 2468.0 μmol gcat−1. For the isopropanol SCR, acetone became a primary product with a production rate of 166.0 μmol gcat−1 h−1, while acetaldehyde and ethanol were produced at 55.0 and 2.0 μmol gcat−1 h−1. The TCC of 3677.0 μmol gcat−1 was determined.
3.3 Kinetics of CO2 photoreduction
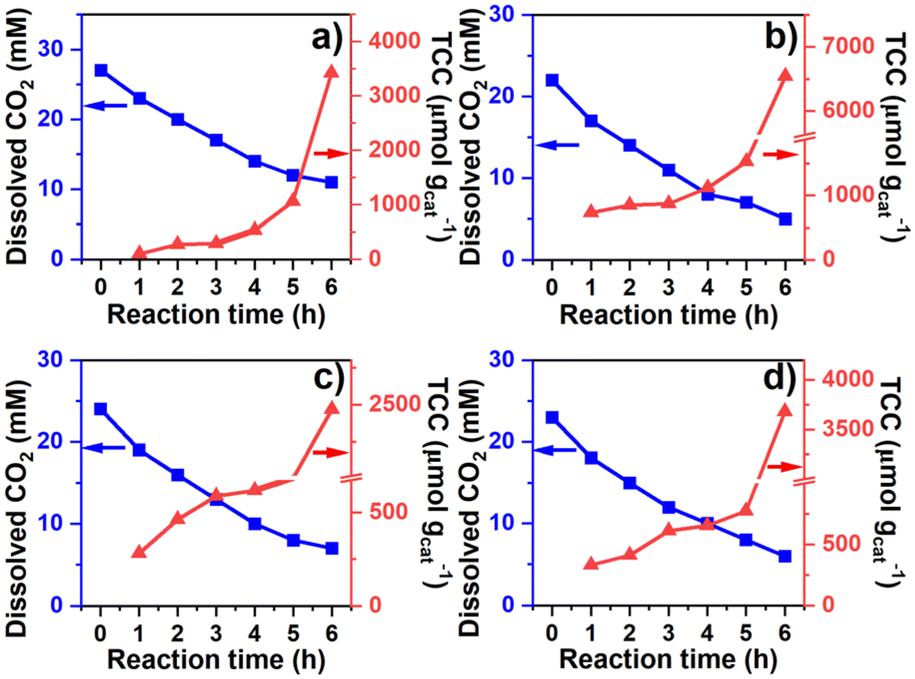
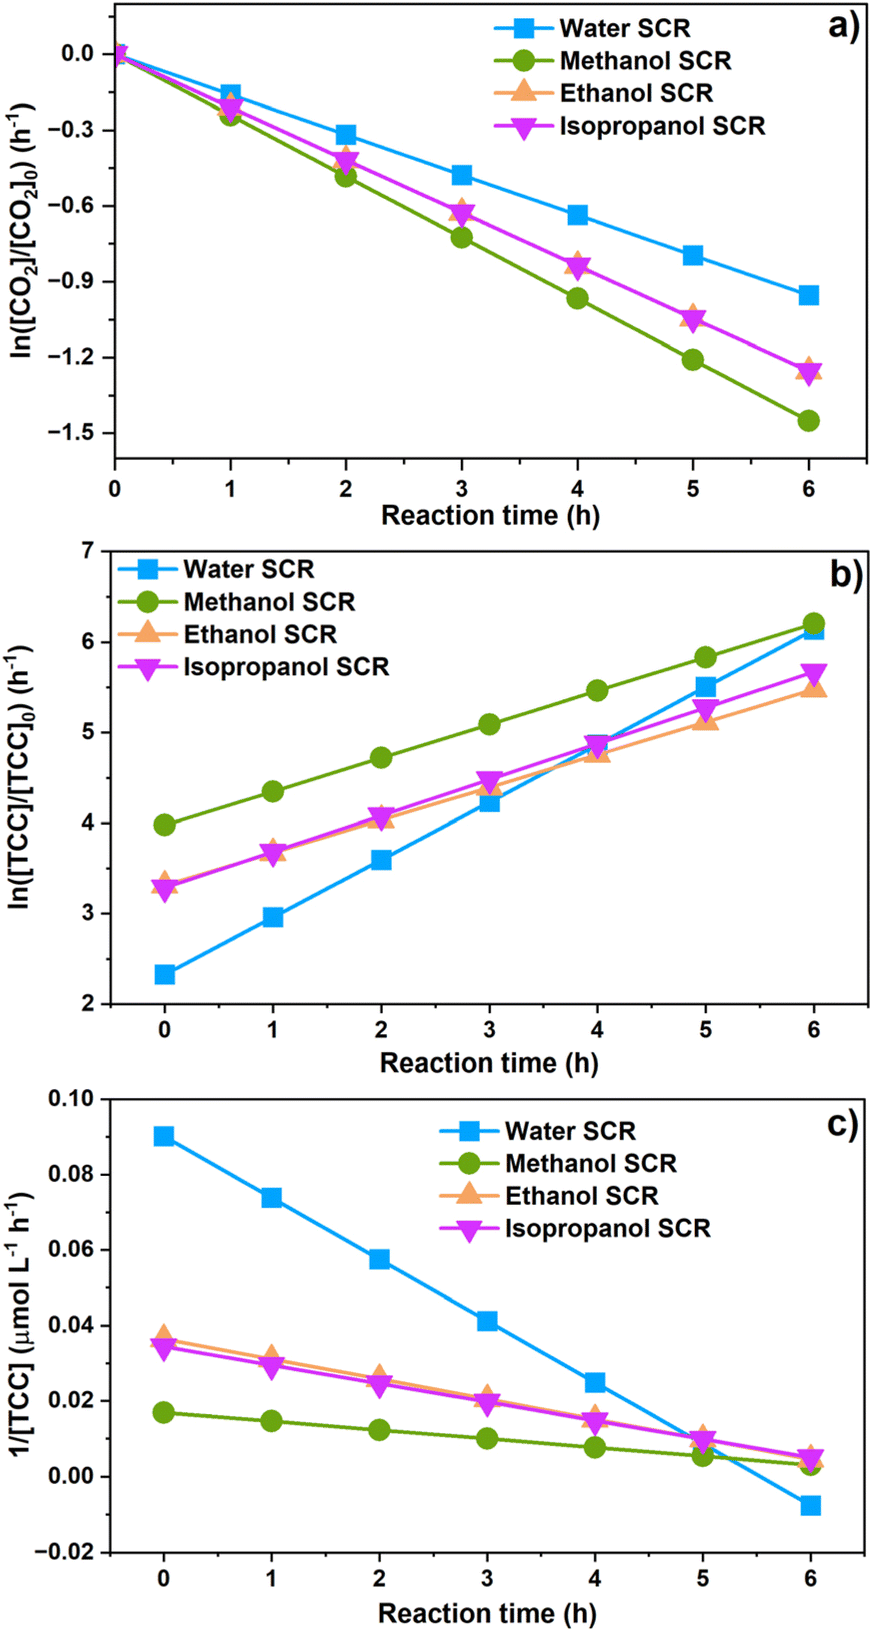
The correlation between dissolved CO2 concentration and TCC was further analyzed concerning the time of operation (Fig. 4). The concentration was determined hourly via sodium hydroxide (0.1 M NaOH) titration, while the gas and liquid product compositions were determined using GC analysis. For the water SCR (Fig. 4(a)), the initial dissolved CO2 concentration was 27 mM and dropped to 11 mM after 6 h of photoreduction. TCC was 103, 272, 293, 532, 1,063, and 3426 μmol gcat−1 after the 1st, 2nd, 3rd, 4th, 5th, and 6th h, respectively. For the methanol SCR, dissolved CO2 stabilized at 22 mM initially and reduced to 5 mM (Fig. 4(b)) after the operation. TCC increased sharply concerning time, providing 729, 851, 873, 1,116, 1,529, and 6544 μmol gcat−1, corresponding to the 1st, 2nd, 3rd, 4th, 5th, and 6th h of operation. For the ethanol SCR, the CO2 concentration decreased from 24 to 7 mM (Fig. 4(c)) during photoreduction. TCC was determined to be 281, 463, 588, 620, 818, and 2468 μmol gcat−1 after 1, 2, 3, 4, 5, and 6 h of photoreduction. For the isopropanol SCR, the dissolved CO2 was initially monitored at 23 mM and 6 mM after the 6th h (Fig. 4(d)). The TCCs were 329, 411, 612, 654, 773, and 3677 μmol gcat−1 after 1st, 2nd, 3rd, 4th, 5th, and 6th h of photoreduction. Each product obtained from water and alcohol SCRs was tracked for 6 h and shown in Fig. S4(a–d).† SCR concentrations were relatively unchanged concerning the time of the operation (Fig. S5†). The depletion of dissolved CO2 concentration was analyzed for the kinetics of the reactions, as shown in Fig. 5(a). The depletion was determined to be the first order (eqn (6)), in which| |
 | (6) |
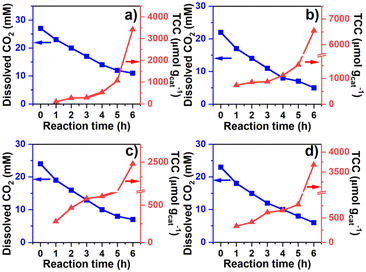 |
| | Fig. 4 Effect of reaction time to dissolved CO2 concentration and TCC corresponding to (a) water, (b) methanol, (c) ethanol, and (d) isopropanol SCRs. | |
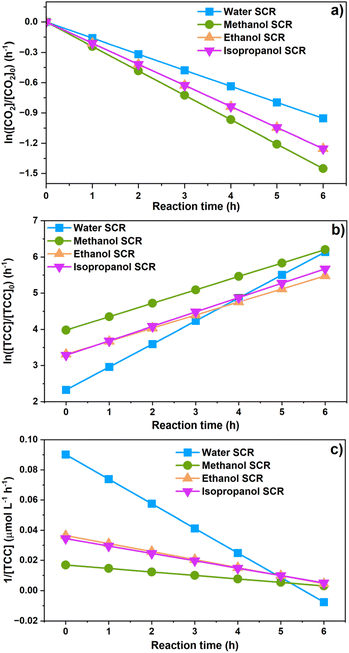 |
| | Fig. 5 The kinetics of dissolved CO2 concentration (a); product generations in water, methanol, ethanol, and isopropanol SCRs as analyzed by (b) the first-order reaction and (c) second-order reaction. | |
The [CO2] denotes dissolved CO2 concentration (mmol L−1), k denotes the first-order reaction rate constant (mmol L−1 h−1), and [CO2]0 is the initial dissolved CO2 concentration (mmol L−1). The reaction rates (k) for water, methanol, ethanol, and isopropanol SCRs were −1.59 × 10⁻¹, −2.42 × 10⁻¹, −2.09 × 10⁻¹, and −2.09 × 10⁻¹ h−1, respectively. The results suggest a slightly faster depleting rate in the case of methanol SCR. The product generation rate was also analyzed by relying on in which [TCC] denotes the total carbon consumption from the CO2 photoreduction, and k′ and k′′ is the first- and second-order product generation rate constant. Production rates from the water SCR agree well with the first-order (eqn (7)) kinetic curve (Fig. 5(b)), showing the  of 6.35 × 10⁻¹ h−1 with R2 = 0.95. The
  ,
,  , and
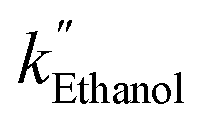
, and  are 3.71 × 10⁻¹ h−1, 3.61 × 10⁻¹ h−1, and 3.98 × 10⁻¹ h−1 with the R2 of 0.72, 0.86, and 0.76, respectively (Table 1). Alcohol SCRs display the production rates for the second-order reaction (eqn (8) and Fig. 5(c)), providing the
  ,
,  , and
, and  values of −2.3 × 10⁻³, −5.3 × 10⁻³, and −4.9 × 10⁻³ μmol L−1 h−1 at the R2 of 0.92, 0.90, and 0.94, respectively. The water SCR exhibits
  of −1.6 × 10⁻² with the R2 of 0.80. The results indicate the first-order product generation for water SCR and the second-order generation for the alcohols.
| |
 | (7) |
| |
 | (8) |
Table 1 Kinetic constants and R2 values from the CO2 depletion and product generation rates
| SCRs |
CO2 depletion |
Product generation (1st order) |
Product generation (2nd order) |
| k′ (h−1) |
R2 |
k′ (h−1) |
R2 |
k′′ (μmol L−1 h−1) |
R2 |
| Water |
−1.59 × 10⁻¹ |
0.99 |
6.35 × 10⁻¹ |
0.95 |
−1.6 × 10⁻² |
0.80 |
| Methanol |
−2.45 × 10⁻¹ |
0.99 |
3.71 × 10⁻¹ |
0.72 |
−2.3 × 10⁻³ |
0.92 |
| Ethanol |
−2.09 × 10⁻¹ |
1.00 |
3.61 × 10⁻¹ |
0.86 |
−5.3 × 10⁻³ |
0.90 |
| Isopropanol |
−2.09 × 10⁻¹ |
1.00 |
3.98 × 10⁻¹ |
0.76 |
−4.9 × 10⁻³ |
0.94 |
The CO2 depletion and product generation rates were also tested for the highest R2 value using fractional order (Table 2), which relies on the differential method. The method is more flexible than the integral analysis used for the integer order and yields a relatively higher R2 value. The fractional reaction orders for the CO2 depleting rate were 1.13, 1.55, 1.10, and 1.05 for water, methanol, ethanol, and isopropanol SCRs. The orders provided the best fit, yielding R2 values of 1.00, 0.94, 1.00, and 1.00, respectively. For the product generation rate, the fractional orders were determined to be 1.42, 2.21, 2.53, and 2.54 for water, methanol, ethanol, and isopropanol SCRs. The R2 values were 0.95, 0.94, 0.83, and 0.93. Several factors could contribute to the fractional order of the reactions, mainly the transitioning state and dynamic equilibrium. For example, the CO2 dissolution concerns the equilibrium of CO2 gas and dissolved CO2 (CO2(g) ↔ CO2(dissolved)). The CO2(dissolved) produces the CO2− radical, which reacts with other active species to form intermediates, causing the equilibrium shift to the right-hand side (more CO2(dissolved)). On the other hand, CO2 dissolution is an exothermic process, suggesting the equilibrium shift to the left (more CO2(g)) during light illumination. More studies are needed to elucidate this part, and it could be beyond the scope of this work.
Table 2 Kinetic constants and R2 values, as corresponded to the fractional order from the CO2 depletion rate and product generation rate
| SCRs |
CO2 depletion |
Product generation |
| Order (n) |
kn |
R2 |
Order (n) |
kn |
R2 |
| Water |
1.13 |
69.81 |
1.00 |
1.42 |
−1.98 × 10⁻² |
0.95 |
| Methanol |
1.55 |
3.71 × 10⁻² |
0.94 |
2.21 |
−6.10 × 10⁻⁵ |
0.94 |
| Ethanol |
1.10 |
1.68 × 10⁻² |
1.00 |
2.53 |
−2.85 × 10⁻⁵ |
0.83 |
| Isopropanol |
1.05 |
9.60 × 10⁻³ |
1.00 |
2.54 |
−2.36 × 10⁻⁵ |
0.93 |
Water is considered more acidic, which should result in less CO2 solubility compared to alcohols. However, alcohol interacts with water through hydrogen bonds at a low alcohol concentration,27 reducing the strength of the CO2–water and CO2–alcohol interactions and decreasing dissolved CO2 concentration. Of the selected alcohols, methanol is the weaker nucleophile (pKa = 15.5) than ethanol (pKa = 16.0) and isopropanol (pKa = 17.0),28 resulting in a lowered dissolved CO2 concentration in methanol solution. Two major factors affect the ability of the SCRs: electron-donating ability (nucleophilicity) and mass diffusivity. Considering nucleophilicity, isopropanol should be the best SCR since it provides higher pKa values than ethanol, methanol, and water (pKa = 14.0). Concerning the diffusivity, a small molecule like methanol gives a greater diffusivity of 2.27 × 10⁻⁹ m2 s−1 (298 K, 1 bar), compared to ethanol (1.01 × 10⁻⁹ m2 s−1 (298 K, 1 bar)) and isopropanol (0.65 × 10⁻⁹ m2 s−1 (298 K, 1 bar)).29 The results from CO2 photoreduction revealed the best photoactivity with methanol as an SCR (TCC = 6544.0 μmol gcat−1), indicating that SCR diffusivity is the dominant factor in enhancing the product generation rate. As the size of the SCR molecules rose for ethanol and isopropanol, the electron-donating ability became the dominant factor. This analysis was evident by the total product generation since the isopropanol showed a higher TCC of 3677.0 μmol gcat−1 than the ethanol's TCC of 2468.0 μmol gcat−1.
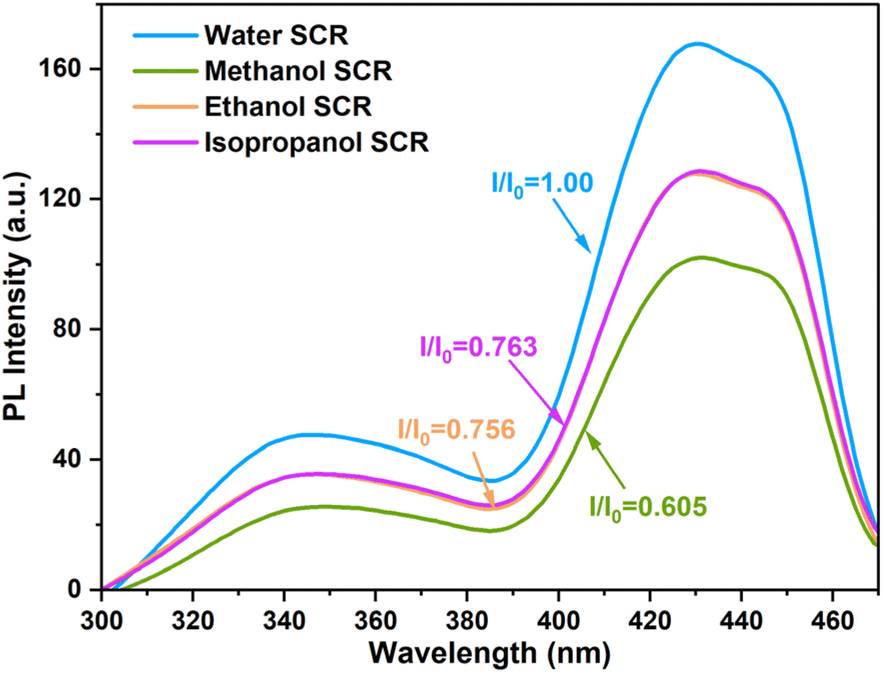
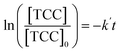
3.4 PL analysis
Photoactivity of the CTGN was analyzed using a Spectrofluorometer when water, methanol, ethanol, and isopropanol were the SCRs (Fig. 6). In our system, the PL signal correlates to the electron–hole recombination phenomenon, which reduces the number of potential charge carriers that facilitate the photoreduction. The higher the signal, the higher the recombination rate, and the lower the photoactivity.11,30 The CTGN suspension was excited at 254 nm, and photon emissions were collected in the 300–500 nm window. The PL spectra appear to be a double-peak emission curve, showing a UV emission peak at 340 nm and a visible emission peak at 430 nm (Fig. 6). The spectra were analyzed by determining a quenching factor, defined as a ratio of emission intensity of any SCR operation (I) divided by the intensity of the water-SCR operation (I0).29 Quenching factors were 1.0, 0.61, 0.76, and 0.76 for water, methanol, ethanol, and isopropanol SCR, respectively. The factors indicate that the electron–hole recombination rate is the lowest for the methanol SCR compared to ethanol, isopropanol, and water SCR.29–32 The results concur with the CO2 photoreduction experiment since CTGN gives the highest photoactivity with the methanol SCR.
 |
| | Fig. 6 PL spectra from CTGN photocatalyst when water, methanol, ethanol, or isopropanol was used as SCR. | |
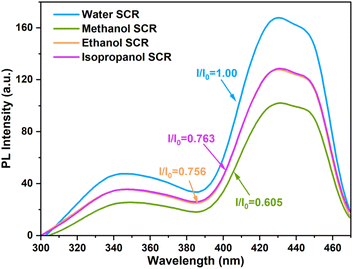
3.5 ESR spectra
ESR analyzed the role of the SCR by indicating and monitoring active radicals involved in CO2 photoreduction. The radicals were examined using PBN as a spin trap and relying on hydrogen and a nitrogen hyperfine splitting constant (aH and aN) for the analysis.33,34 Fig. 7(a) shows ESR spectra when methanol, ethanol, and isopropanol facilitate CO2 photoreduction. The spectra reveal hydroxymethyl radicals (˙CH2OH, aN = 15.34 G and aH = 3.88), 1-hydroxyethyl radicals (˙CH3CHOH, aN = 15.34 G, aH = 3.66 G), and hydroxypropyl radicals (˙(CH3)2COH, aN = 15.38, aH = 3.56) as corresponding to methanol, ethanol, and isopropanol SCR, respectively.33–35 In the case of water SCR, we expected the occurrence of the ˙OH, due to water photolysis.36 However, the ˙OH signal was not detected in our system. The water, methanol, ethanol, and isopropanol SCRs are hole scavengers to the CTGN. Their role is to quench the photo-induced holes and generate protons. The reactions yield ˙OH, ˙CH2OH, ˙CH3CHOH, and ˙(CH3)2COH as presented in eqn (4) and (9)–(11).12| | |
CH3OH + h+ → ˙CH2OH + H+
| (9) |
| | |
CH3CH2OH + h+ → ˙CH3CHO + 2H +
| (10) |
| | |
(CH3)2CHOH + 2h+ → ˙(CH3)2CO + 2H +
| (11) |
 |
| | Fig. 7 (a) ESR spectra corresponding to CO2 photoreduction in the presence of methanol, ethanol, and isopropanol SCRs, and (b) ESR peak intensity changes with respect to time. | |
We also studied the stability of the radicals by conducting ESR analysis for 6 h during the CO2 photoreduction (Fig. 7(b)). For methanol SCR, the signal from the ˙CH2OH radical rose significantly during the 1st to 40th min and lasted for 240 min. The signal was relatively more intense than the ethanol and isopropanol SCR. For ethanol SCR, the ˙CH3CHOH radical occurred during the 1st to the 60th min and was present in the operation until the 240th min. For isopropanol SCR, the ˙(CH3)2COH radical peaked during the 1st to 40th min and lasted for 240 min. In all the cases with alcohol SCRs, PBN-abducted radicals were detected and yielded intensive signals during the first 40 to 60 min of the operation. For water SCR, a small bump was observed within the 1st to 10th min of the operation. The signal was relatively flat compared to the other experiments and disappeared after 10 min. The exceptional increase in ESR spectra suggested conversion of the added SCR to its corresponding active radicals, in which the conversion of methanol, ethanol, and isopropanol yielded ˙CH2OH, ˙CH3CHOH, and ˙(CH3)2COH, respectively.34,35 The ESR signal from the first 20 min (Fig. 7(b), Inset) of the operation showed a similar trend, giving a much stronger signal for ˙CH2OH compared to ˙CH3CHOH and ˙(CH3)2COH. The ˙CH2OH occurred more rapidly and intensely and lasted longer at a higher magnitude compared to the other active radicals.28 The ESR results agree well with the PL and CO2 photoreduction, indicating that methanol is the best SCR in the system.
3.6 Mechanistic discussion of CO2 photoreduction
Mechanistic studies for CO2 photoreduction were discussed in our previous work and are analyzed further here.5,10 In all the CO2 photoreduction experiments, CO2− radicals were produced through the coupling of CO2 and photoelectrons at the CB of the photocatalyst (eqn (1) and (2)). Water is abundant in an aqueous solution and contributes as an SCR by providing electrons at the VB and releasing protons and O2 (eqn (3)). Various products can be generated relying on the reactions between the CO2−, protons, and photoelectrons. For example, CO2− incorporates 8 protons and 7 electrons to form methane, and 6 protons and 5 electrons to obtain methanol. 2 CO2− combines with 12 protons and 10 electrons to form ethanol (eqn (12)–(14)), and 10 protons and 8 electrons to form acetaldehyde (eqn (15)). 3 CO2−, 18 protons and 15 electrons and 3 CO2−, 16 protons and 13 electrons create isopropanol (eqn (16)), and acetone (eqn (17)), respectively. Total reactions are described in List S1 (eqn (S1-1) to (S1-6)),† displaying the formation of methane, methanol, ethanol, acetaldehyde, isopropanol, and acetone.| | |
CO−2 + 8H+ + 7e− → CH4 + 2H2O
| (12) |
| | |
CO−2 + 6H+ + 5e− → CH3OH + H2O
| (13) |
| | |
2CO−2 + 12H+ + 10e− → C2H5OH + 3H2O
| (14) |
| | |
2CO−2 + 10H+ + 8e− → CH3COH + 3H2O
| (15) |
| | |
3CO−2 + 18H+ + 15e− → C3H7OH + 5H2O
| (16) |
| | |
3CO−2 + 16H+ + 13e− → (CH3)2CO + 5H2O
| (17) |
Considering the redox potential of the reactions (E0redox), E0redox values for the production of methane (List S1, eqn (S1-1)†), methanol (List S1, eqn (S1-2)†), ethanol (List S1, eqn (S1-3)†), acetaldehyde (List S1, eqn (S1-4)†),37 isopropanol (List S1, eqn (S1-5)†), and acetone (List S1, eqn (S1-6)†) are −0.24, −0.38, −0.329, −0.31, and −0.36 V, respectively. A negative E0redox indicates a favored thermodynamic reaction path, revealing that acetone production is preferred to ethanol, isopropanol methane, and acetaldehyde. Our results support the assumption that thermodynamic stability is not the only factor controlling the type and production rate of the photoreduction. Fig. S3† shows that the product type and the production rates vary significantly, corresponding to the SCR. For water SCR (Fig. S4(a)†), ethanol is the main product and occurs at a higher concentration as the operating time increases.10,11 Acetaldehyde, isopropanol, and acetone were produced but exhibited no specific trend concerning operating time. For methanol SCR, CO2 photoreduction yields ethanol, acetone, and acetaldehyde, showing higher product concentration trends with increased operating time. Isopropanol was detected, but its production rate did not correlate with operating time. For ethanol SCR, methanol, isopropanol, acetone, and acetaldehyde were analyzed, but only acetaldehyde correlated with increased operating time.38 For isopropanol SCR, the production rates of acetone and acetaldehyde increase as the operating time increases. Ethanol was present in the solution but displayed no correlation with the operating time. The results from Fig. S4† and 3 were consistent, indicating the main products for water, methanol, ethanol, and isopropanol SCR to be ethanol, ethanol, acetaldehyde, and acetaldehyde and acetone, respectively. Variations in the type and the production rate of the products can be attributed to the involvement of the active radicals obtained from the SCRs (eqn (9)–(12)) or the light-activating conditions inside the suspension. More studies are needed to elucidate this part.
CTGN performed well in photo-catalyzing the CO2 conversion, giving mainly acetaldehyde in the gas phase and ethanol, isopropanol, and acetone in the liquid phase. The heterostructure of CTGN provides a 2D-2D nanostructure interior between the copper-doped dititanate nanosheets and GO with enhanced charge separation and great photoactivity.11 Results from the CO2 photoreduction exhibit synergic effects of CTGN and methanol SCR, showing an outstanding CO2 conversion rate with the TCC of 6544.0 μmol gcat−1. The analysis from PL and ESR supported the photoreduction results. PL showed the lowest electron–hole recombination rate, and ESR indicated high stability of the ˙CH2OH radical for the CTGN with methanol SCR. Reaction kinetics studies revealed the first and second order kinetics for the CO2 depletion and product formation rates for the alcohol SCRs.
4 Conclusions
The CTGN heterostructure was used to study the roles of water, methanol, ethanol, and isopropanol SCRs in assisting CO2 photoreduction. Alcohol SCR functions effectively as a proton scavenger, stealing protons from the CB of the dititanate nanosheets and enhancing charge separation for the CTGN. Different SCRs lead to the formation of different CO2 photoreduction products. The products of methanol, ethanol, isopropanol, acetaldehyde, and acetone were detected, corresponding to the water, methanol, ethanol, and isopropanol SCRs. Methanol performed best as the SCR, providing a TCC of 6544 μmol gcat−1. The great photoactivity for methanol SCR was due to the high mobility of methanol and the excellent stability of the ˙CH2OH radical. Reaction kinetics studies revealed the first and second order kinetics for the CO2 depletion and product formation rates for the alcohol SCRs.
Data availability
The data supporting this article have been included as part of the ESI.†
Author contributions
Nutkamol Kitjanukit performs the experiments, contributes to data analysis, and writes the original draft of the manuscript. Wannisa Neamsung, Apisit Karawek, Napat Lertthanaphol, and Napatr Chongkol assist in data validation, data analysis, and experimental design. Koki Hiramatsu, Tomoya Sekiguchi, Soraya Pornsuwan, and Takahiro Sakurai contribute to data analysis and experimental design. Woranart Jonglertjunya, Poomiwat Phadungbut, and Yuichi Ichihashi, yield their expertise in data analysis, validation, and manuscript editing. Sira Srinives is the main contributor in writing, reviewing, and editing the manuscript. Sira is also responsible for funding acquisition, supervision, and project administration.
Conflicts of interest
The authors declare no financial or personal interest that affects professional judgment regarding the validity and analysis of this research.
Acknowledgements
Sira thanks the MU Talent Program, Faculty of Engineering, Mahidol University, and the Malaysia-Thai Joint Administration (MTJA) (Research CESS fund) for financial support. Sira is grateful to staff from the Mahidol University Frontier Research Facility (MU-FRF) and the Department of Chemical Engineering Central lab for material characterizations and photoreduction product analysis. Sira credits Graham K. Rogers for his contribution to manuscript editing. Nutkamol acknowledges the 60th Year Supreme Reign of His Majesty King Bhumibol Adulyadej Scholarship and scholarship from the postgraduate mobility program for financial support. Nutkamol conveys her gratitude to the Research Facility Center for Science and Technology staff at Kobe University for their kind assistance and hospitality during her stay.
Notes and references
- E. Yáñez, H. Meerman, A. Ramírez, E. Castillo and A. Faaij, Biofuels, Bioprod. Biorefin., 2021, 15, 305–333, DOI:10.1002/bbb.2163.
- A. Rahman, P. Dargusch and D. Wadley, Renewable Sustainable Energy Rev., 2021, 144, 111027, DOI:10.1016/j.rser.2021.111027.
- Z. Fu, Y. Zhong, Y. Yu, L. Long, M. Xiao, D. Han, S. Wang and Y. Meng, ACS Omega, 2018, 3, 198–207, DOI:10.1021/acsomega.7b01475.
- A. Karawek, K. Kittipoom, L. Tansuthepverawongse, N. Kitjanukit, W. Neamsung, N. Lertthanaphol, P. Chanthara, S. Ratchahat, P. Phadungbut, P. Kim-Lohsoontorn and S. Srinives, Nanomaterials, 2023, 13, 320, DOI:10.3390/nano13020320.
- A. Karawek, N. Kitjanukit, W. Neamsung, C. Kinkaew, P. Phadungbut, P. Seeharaj, P. Kim-Lohsoontorn and S. Srinives, ACS Appl. Energy Mater., 2023, 6, 10929–10942, DOI:10.1021/acsaem.3c01675.
- M. Hasan, S. Hamid, W. Basirun, S. Suhaimy and A. Mat, RSC Adv., 2015, 95, 77803–77813, 10.1039/C5RA12525A.
- F. Galli, M. Compagnoni, D. Vitali, C. Pirola, C. Bianchi, A. Villa, L. Prati and I. Rossetti, Appl. Catal., B, 2017, 200, 386–391, DOI:10.1016/j.apcatb.2016.07.038.
- Q. Zhang, J. Wang, C. Lin, Y. Jing and C. Chang, Mater. Sci. Semicond. Process., 2015, 30, 162–168, DOI:10.1016/j.mssp.2014.09.049.
- P. Seeharaj, N. Vittayakorn, J. Morris and P. Kim-Lohsoontorn, Nanotechnology, 2021, 32, 375707, DOI:10.1088/1361-6528/ac08be.
- N. Lertthanaphol, N. Pienutsa, K. Chusri, T. Sornsuchat, P. Chanthara, P. Seeharaj, P. Kim-Lohsoontorn and S. Srinives, ACS Omega, 2021, 6, 35769–35779, DOI:10.1021/acsomega.1c05799.
- N. Lertthanaphol, N. Prawiset, P. Soontornapaluk, N. Kitjanukit, W. Neamsung, N. Pienutsa, K. Chusri, T. Sornsuchat, P. Chanthara, P. Phadungbut, P. Seeharaj, P. Kim-Lohsoontorn and S. Srinives, RSC Adv., 2022, 12, 24362–24373, 10.1039/D2RA04283E.
- E. Karamian and S. Sharifnia, J. CO2 Util., 2016, 16, 194–203, DOI:10.1016/j.jcou.2016.07.004.
- S. Qin, F. Xin, Y. Liu, X. Yin and W. Ma, J. Colloid Interface Sci., 2011, 356, 257–261, DOI:10.1016/j.jcis.2010.12.034.
- C. R. López, E. P. Melián, J. O. Méndez, D. E. Santiago, J. D. Rodríguez and O. G. Díaz, J. Photochem. Photobiol., A, 2015, 312, 45–54, DOI:10.1016/j.jphotochem.2015.07.005.
- D. Tsukamoto, A. Shiro, Y. Shiraishi, Y. Sugano, S. Ichikawa, S. Tanaka and T. Hirai, ACS Catal., 2012, 2, 599–603, DOI:10.1021/cs2006873.
- Y. Wang, F. Xin, J. Chen, T. Xiang and X. Yin, J. Nanosci. Nanotechnol., 2017, 17, 1863–1869, DOI:10.1166/jnn.2017.12871.
- B. Zhao, L. Lin and D. He, J. Mater. Chem. A, 2013, 5, 1659–1668, DOI:10.1002/asia.201000018.
- N. R. Khalid, E. Ahmed, Z. Hong, M. Ahmad, Y. Zhang and S. Khalid, Ceram. Int., 2013, 39, 7107–7113, DOI:10.1016/j.ceramint.2013.02.051.
- B. Zhao, F. Chen, X. Gu and J. Zhang, Chem.–Asian J., 2010, 5, 1546–1549, DOI:10.1002/asia.201000018.
- M. S. A. Faiz, C. A. C. Azurahanim, S. A. Raba'ah and M. Z. Ruzniza, Results Phys., 2020, 16, 102954, DOI:10.1016/j.rinp.2020.102954.
- J. Xu, H. Zhang, T. Liu and J. Zhang, J. Chem. Soc. Pak., 2014, 36, 388–393 CAS . Available from: https://jcsp.org.pk/issueDetail.aspx?aid=113cbe62-01ca-44cc-a3c4-8beeb2a0bed4.
- B. G. T. Keerthana, T. Solaiyammal, S. Muniyappan and P. Murugakoothan, Mater. Lett., 2018, 220, 20–23, DOI:10.1016/j.matlet.2018.02.119.
- T. F. Emiru and D. W. Ayele, Egypt. J. Basic Appl. Sci., 2017, 4, 74–79, DOI:10.1016/j.ejbas.2016.11.002.
- H. Zhang, B. Chen, T. Liu, G. W. Brudvig, D. Wang and M. M. Waegele, J. Am. Chem. Soc., 2023, 146, 878–883, DOI:10.1021/jacs.3c11206.
- H. Ming, D. Wei, Y. Yang, B. Chen, C. Yang, J. Zhang and Y. Hou, Chem. Eng. J., 2021, 424, 130296, DOI:10.1016/j.cej.2021.130296.
- X. Niu, L. Sun, X. Zhang, Y. Sun and J. Wang, Appl. Microbiol. Biotechnol., 2020, 104, 2947–2955, DOI:10.1007/s00253-020-10446-w.
- P. Kruus and C. A. Hayes, Can. J. Chem., 1985, 63, 3403–3410, DOI:10.1139/v85-561.
- K. Sathiyan, R. Bar-Ziv, V. Marks, D. Meyerstein and T. Zidki, Chem.–Eur. J., 2021, 27, 15936–15943, DOI:10.1002/chem.202103040.
- S. Bhogal, P. Sharma, P. Rani, K. Kaur and A. K. Malik, J. Fluoresc., 2022, 32, 359–367, DOI:10.1007/s10895-021-02855-5.
- S. Pawar, U. K. Togiti, A. Bhattacharya and A. Nag, ACS Omega, 2019, 4, 11301–11311, DOI:10.1021/acsomega.9b01208.
- S. S. Alarfaji, A. G. Al-Sehemi and M. Pannipara, Open Chem., 2022, 20, 1494–1501, DOI:10.1515/chem-2022-0248.
- A. A. Salim, S. K. Ghoshal, L. P. Suan, N. Bidin, K. Hamzah, M. Duralim and M. Bakhtiar, Malays. J. Fund. Appl. Sci., 2018, 14, 447–449, DOI:10.11113/mjfas.v14n0.1276.
- C. M. DuBose, D. Rehorek, U. M. Oehler and E. G. Janzen, Free Radical Biol. Med., 1988, 5, 55–56, DOI:10.1016/S0891-5849(87)80033-3.
- N. J. F. Dodd and A. N. Jha, Photochem. Photobiol., 2011, 87, 632–640, DOI:10.1111/j.1751-1097.2011.00897.x.
- B. Aurian-Blajeni, M. Halmann and J. Manassen, Photochem. Photobiol., 1982, 35, 157–162, DOI:10.1021/j100494a024.
- D. T. Glatzhofer and R. S. Kadam, Int. Scholarly Res. Not., 2012, 2012(1), 847102, DOI:10.5402/2012/847102.
- K. P. Kuhl, E. R. Cave, D. N. Abram and T. F. Jaramillo, Energy Environ. Sci., 2012, 5, 7050–7059, 10.1039/C2EE21234J.
- S. Mostrou, A. Nagl, M. Ranocchiari, K. Föttinger and J. A. van Bokhoven, Chem. Commun., 2019, 11833–11836, 10.1039/c9cc05813c.
|
| This journal is © The Royal Society of Chemistry 2024 |
Click here to see how this site uses Cookies. View our privacy policy here. 
 Open Access Article
 This Open Access Article is licensed under a Creative Commons Attribution-Non Commercial 3.0 Unported Licence
 a,
Wannisa Neamsunga,
Apisit Karaweka,
Napat Lertthanaphol
a,
Wannisa Neamsunga,
Apisit Karaweka,
Napat Lertthanaphol


 of 6.35 × 10⁻¹ h−1 with R2 = 0.95. The
 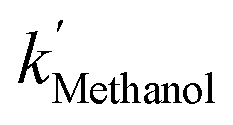 ,
,  , and
, and  are 3.71 × 10⁻¹ h−1, 3.61 × 10⁻¹ h−1, and 3.98 × 10⁻¹ h−1 with the R2 of 0.72, 0.86, and 0.76, respectively (Table 1). Alcohol SCRs display the production rates for the second-order reaction (eqn (8) and Fig. 5(c)), providing the
 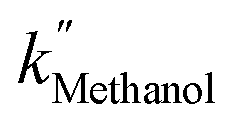 ,
,  , and
, and 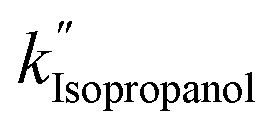 values of −2.3 × 10⁻³, −5.3 × 10⁻³, and −4.9 × 10⁻³ μmol L−1 h−1 at the R2 of 0.92, 0.90, and 0.94, respectively. The water SCR exhibits
  of −1.6 × 10⁻² with the R2 of 0.80. The results indicate the first-order product generation for water SCR and the second-order generation for the alcohols.