DOI:
10.1039/D4RA04640D
(Paper)
RSC Adv., 2024,
14, 28320-28331
Enhancing Cr(VI) removal performance of Ti3C2Tx through structural modification by using a spray freezing method
Received
25th June 2024
, Accepted 16th August 2024
First published on 5th September 2024
Abstract
Structural modification is expected to be a facile way to enhance the adsorption performance of MXene. In this work, the structural modification of Ti3C2Tx was carried out by a spray freezing method, and two kinds of nano-structure (spherical and flaky) of Ti3C2Tx were prepared by adjusting the solution concentration of Ti3C2Tx. Then the Cr(VI) adsorption capacity and removal efficiency of the spherical and flaky Ti3C2Tx was investigated, respectively. It is found that flaky Ti3C2Tx was produced with a Ti3C2Tx concentration of 3 mg mL−1, while spherical Ti3C2Tx was obtained with a concentration of 6 mg mL−1. The long diameter of flaky Ti3C2Tx is about 8–10 μm, and the specific surface area is 17.81 m2 g−1. While spherical Ti3C2Tx had a diameter of about 1–4 μm and a specific surface area of 17.07 m2 g−1. The optimized structure of flaky and spherical Ti3C2Tx improves the maximum adsorption capacity by 97% and 33%, respectively, compared with the few-layer Ti3C2Tx. The maximum adsorption capacity of flaky Ti3C2Tx was 928 mg g−1, while that of spherical Ti3C2Tx was 626 mg g−1. The adsorption capacity of both Ti3C2Tx structures decreased with the increase of pH, and reached the maximum value at pH = 2; meanwhile, the adsorption capacity of both Ti3C2Tx structures increased with the increase of Cr(VI) concentration. The adsorption of Cr(VI) on flaky Ti3C2Tx was very fast, reaching equilibrium in 3 min, while spherical Ti3C2Tx took 5 min. The adsorption of Cr(VI) on both Ti3C2Tx structures belonged to the monolayers, heat-absorbing chemical adsorption, and the diffusion process of Cr(VI) was regulated by the external diffusion and internal diffusion of particles. Its adsorption mechanism was the combination of reductive adsorption and electrostatic adsorption.
1. Introduction
Heavy metal ions pose a great threat to human health because of their toxicity and high migration and enrichment in living organisms.1 With the rapid advancement in metallurgy, electroplating, and tanning, a large amount of wastewater containing Cr(VI) has been produced.2 Cr(VI) is not only toxic and carcinogenic, but it also causes a variety of health problems, including liver damage,3 vomiting,4 and lung congestion.5 Therefore, effective removal of Cr(VI) from water is essential. In modern industry, the standard treatment method for wastewater containing Cr(VI) consists of two steps: reducing Cr(VI) to Cr(III) using a chemical agent such as sodium bisulfite or sulfur dioxide gas, and then adjusting the pH to promote the precipitation of Cr(III).6 However, the process is complex and requires the use of large amounts of acids and bases, which can lead to serious secondary wastewater problems. In addition, other treatment methods have also been widely reported, such as electrolysis,7 ion exchange,8 membrane separation,9 chemical precipitation,10 adsorption,11 photocatalysis,12 etc., among which the adsorption method has attracted much attention due to its low cost and simplicity of operation.
The selection of adsorbent is key to the removal of heavy metal ions by adsorption. Compared with other adsorbent materials, two-dimensional materials have the advantages of large specific surface area and abundant active centers, and are ideal adsorbents.13 Typical 2D carbon nanomaterials such as graphene,14 graphene oxide15 and their derivatives16 show excellent properties in ion adsorption and organic pollution treatment. However, the disadvantages such as high cost and single surface functional groups greatly limit their practical application.17 MXene is a novel two-dimensional material composed of transition metal carbides or nitride, which has many similar properties to graphene. Simultaneously, it has the advantages of large layer spacing, abundant surface functional groups, large specific surface area, strong affinity with metal ions, and good hydrophilicity, etc.,18 which shows unique advantages in the treatment of heavy metal ion wastewater by photocatalysis19 and adsorption. It is considered to be an ideal material for removing heavy metal ions.
Ti3C2Tx is the earliest MXenes material prepared due to its relatively simple preparation method, stable mechanical properties and excellent physical and chemical properties, Ti3C2Tx has become a widely studied and applied material. Ti3C2Tx and its composites demonstrated excellent adsorption properties on Cr(VI) treatment. In 2018, Tang et al. prepared organ-like multilayer Ti3C2Tx solution by HF etching, with a maximum adsorption capacity (MAC) of 80 mg g−1 for Cr(VI).20 In 2019, He et al. prepared Ti3C2Tx with zero-valent iron intercalation nanoparticles, its MAC for Cr(VI) is 194.87 mg g−1.21 The MAC of Ti3C2Tx for Cr(VI) obtained using trifluoroacetic acid (TFA) etching by Zhu et al. in 2022 was 351 mg g−1.22 Howerver, despite exhibiting remarkable adsorption capabilities for heavy metal ions, MXene is not immune to the inherent self-stacking problem of two-dimensional materials.23 This self-stacking significantly reduces the accessible specific surface area of MXene, thereby limiting its adsorption capacity.24
To solve the problem of self-stacking in MXene, a common approach involves the introduction of interlayer “pillars” such as polymers,25 nanoparticles,26 nanotubes,27 and nanosheets.28 These pillars ensure adequate spacing between the layers. Gogotsi and colleagues also proposed a templatie method to build three-dimensional structures from 2D materials to synthesize MXene with a large specific surface area.29 However, these methods are highly complex. Therefore, it is highly necessary to explore simple and efficient methods to prevent the self-stacking.
In our previous work, the heavy metal ion Cr(VI) have been tried to be removed by 2D material, such as LDH30 or Ti3C2Tx (ref. 4) or Ti2CTx (ref. 31) and we found that the Cr(VI) adsorption capacity can be further enhanced by adjusting the functional groups or modifying the structure of Ti3C2Tx.
In this paper, a simple spray freezing technique has been used to prepare spherical and flaky structures of Ti3C2Tx, both of which effectively increase the specific surface area. The adsorption performance of these two structures was investigated, and the adsorption process of Cr(VI) on Ti3C2Tx was analyzed using adsorption kinetic models, isotherm models, and intraparticle diffusion models. Additionally, the effects of temperature, pH and other parameters on the adsorption characteristics were also discussed. The changes of binding energy before and after adsorption were also analyzed using XPS, shedding light on the adsorption mechanism.
2. Experimental methods
2.1 Chemicals
The raw materials for this study are used directly after purchase without further treatment. Ti3AlC2 (>98 wt%, 200 mods) was bought from Fussman, lithium fluoride (LiF, 99%), hydrochloric acid (HCl, 9 M), sodium hydroxide (NaOH, 5 M), nitric acid (HNO3, 70%) and potassium dichromate (K2Cr2O7, 99.9%) from Shanghai Aladdin Co., LTD.
2.2 Preparation of few-layer Ti3C2Tx
The few-layer of Ti3C2Tx were obtained by etching the precursor Ti3AlC2 with a mixture of HCl and LiF. Ti3AlC2![[thin space (1/6-em)]](https://www.rsc.org/images/entities/char_2009.gif) :
:![[thin space (1/6-em)]](https://www.rsc.org/images/entities/char_2009.gif) HCl
HCl![[thin space (1/6-em)]](https://www.rsc.org/images/entities/char_2009.gif) :
:![[thin space (1/6-em)]](https://www.rsc.org/images/entities/char_2009.gif) LiF was mixed according to the ratio of 1 g
LiF was mixed according to the ratio of 1 g![[thin space (1/6-em)]](https://www.rsc.org/images/entities/char_2009.gif) :
:![[thin space (1/6-em)]](https://www.rsc.org/images/entities/char_2009.gif) 20 mL
20 mL![[thin space (1/6-em)]](https://www.rsc.org/images/entities/char_2009.gif) :
:![[thin space (1/6-em)]](https://www.rsc.org/images/entities/char_2009.gif) 1.6 g, stirred magnetically at 50 °C with 1000 rpm for 24 h, and then the mixture was washed and centrifuged multiple times with deionized (DI) water until the pH of solution reached 6. After ultrasonic treatment for 3 h, the upper layer solution was collected by further centrifugation at 3500 rpm for 30 min. The collected solution turned green after dilution and formed a stable and uniform suspension, indicating successful preparation of Ti3C2Tx with few layers. A solution sample (20 mL) was filtered, dried, and weighed to determine a concentration of 6 mg mL−1 before being stored in the refrigerator.
1.6 g, stirred magnetically at 50 °C with 1000 rpm for 24 h, and then the mixture was washed and centrifuged multiple times with deionized (DI) water until the pH of solution reached 6. After ultrasonic treatment for 3 h, the upper layer solution was collected by further centrifugation at 3500 rpm for 30 min. The collected solution turned green after dilution and formed a stable and uniform suspension, indicating successful preparation of Ti3C2Tx with few layers. A solution sample (20 mL) was filtered, dried, and weighed to determine a concentration of 6 mg mL−1 before being stored in the refrigerator.
2.3 Preparation of spherical and flaky Ti3C2Tx
1 L of liquid nitrogen was added to the beaker, and few-layer Ti3C2Tx with a density of 6 mg mL−1 was sprayed evenly into the liquid nitrogen using a sprayer. The ejected droplet was instantly frozen into a ball in the liquid nitrogen at −160 °C, and the two-dimensional Ti3C2Tx sheet was also frozen into a Ti3C2Tx ball under the action of the droplet freezing stress. The preparation process of flaky Ti3C2Tx is similar to that of spherical Ti3C2Tx, except that the concentration of few-layer Ti3C2Tx changes from 6 mg mL−1 to 3 mg mL−1. The preparation process is shown in the Fig. 1.
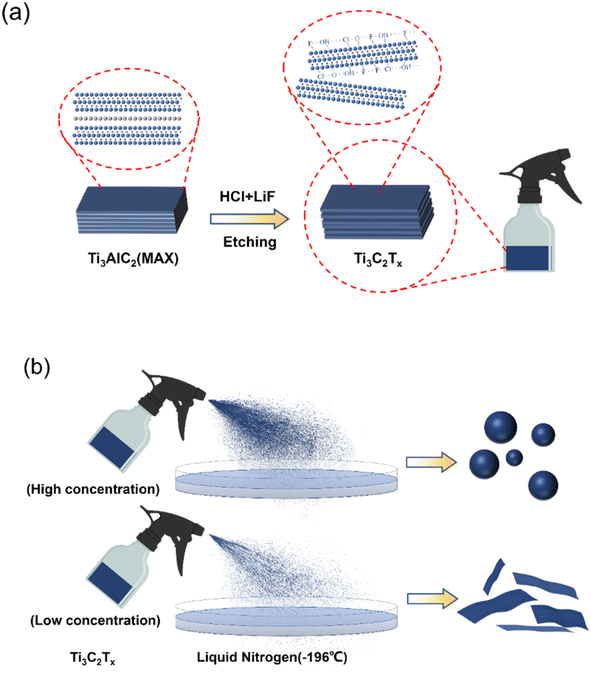 |
| | Fig. 1 (a) Preparation process of the few-layer Ti3C2Tx; (b) preparation of the flaky and spherical Ti3C2Tx by spray freezing method. | |
2.4 Characterization
The crystal structure of the samples was analyzed by an X-ray diffractometer (XRD, X'Pert Powder X, PANalytical) with the testing angles of 5–80° and a scanning speed of 2° min−1, the morphology was examined by an scanning electron microscope (SEM, JSM-6800F, JEOL), the surface charge was assessed by the zeta potential analyzer (NanoBrook Omni, Brookhaven), the binding energy and valence change were measured by an X-ray photoelectron spectroscope (XPS, ESCALAB 250Xi, Thermo Fisher Scientific), the nitrogen adsorption and desorption isotherms were determined with a fully automatic multi-station specific surface and aperture analyzer (BELSORP-max II), and the concentration of Cr(VI) solution was determined by a UV-vis spectrophotometer (UV-3600, Shimadzu).
2.5 Cr(VI) adsorption experiments
The K2Cr2O7 powder was dissolved in DI water to obtain Cr(VI) solutions with different concentrations. During the adsorption process, 100 mL of K2Cr2O7 solution was used and the pH of the solution was pre-adjusted with nitric acid or sodium hydroxide. Except for the pH effect study, the pH value of other adsorption experiments was maintained at 2. The mass of Ti3C2Tx used in all experiments was 20 mg. The prepared adsorbent solution was dropped into the K2Cr2O7 solution at a magnetic stirring rate of 600 rpm. The experimental temperature was maintained at 25 °C. After different adsorption time, the middle part of the mixed solution was extracted and filtered to test the concentration of residual Cr(VI) in the solution. The adsorption capacity qe (mg g−1) and removal rate R (%) at different times were calculated using the equations as follows (1)–(3):32| |
 | (1) |
| |
 | (2) |
| |
 | (3) |
where qt (mg g−1) is the adsorption capacity at time t, qe (mg g−1) is the adsorption capacity at equilibrium moment, R is the removal efficiency, C0 (mg g−1) is the initial concentration of the solution, Ct (mg g−1) is the solution concentration at time t, Ce (mg g−1) is the concentration of the solution at equilibrium moment, V (L) is the volume of the solution, m (g) is the mass of the adsorbent used. The specific experimental parameters of this work are shown in the Table 1.
Table 1 Experimental parameters for Cr(VI) adsorption by Ti3C2Tx
| Category |
pH |
Adsorption time (min) |
Adsorbent concentration (mg L−1) |
Temperature (K) |
| pH |
1/2/4/6/8 |
60 |
120 |
298 |
| Adsorption time |
2 |
0.5/1/2/5/10/20/30/60 |
150/200/250; 175/250/300 |
298 |
| Adsorbent concentration |
2 |
60 |
100/125/150/175/200/225/250/275 |
298 |
| Temperature |
2 |
60 |
200 |
298/313/328 |
3. Results and discussion
3.1 Structure and morphology characterization
The XRD patterns of precursor Ti3AlC2, few layer, flaky and spherical Ti3C2Tx are shown in Fig. 2(a). It is found that before etching, the diffraction peaks of the precursor Ti3AlC2 were distributed in 9.5° (002), 34° (100), 38.8° (006) and 52.3° (106). After 24 h of etching, the diffraction peak of (002) moved to a smaller angle, from 9.5° to 7.6°, and the remaining diffraction peaks disappeared. It can be proved that the Al layer were completely etched away. After spray freezing in liquid nitrogen, compared with that of few-layer Ti3C2Tx, the (002) diffraction peak of the prepared spherical Ti3C2Tx continues to move to a smaller angle, (6.3°). The prepared flaky Ti3C2Tx has the smallest (002) diffraction peak with an angle of 5.5°. The shift of the diffraction peak to a smaller angle indicates that the lattice spacing of the sample increases after liquid nitrogen spray freezing.
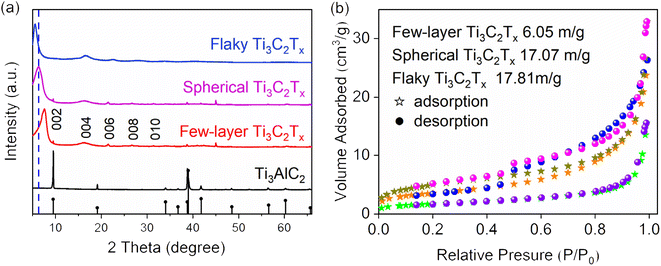 |
| | Fig. 2 (a) XRD patterns of precursor Ti3AlC2, few-layer Ti3C2Tx, spherical and flaky Ti3C2Tx; (b) N2 adsorption–desorption isotherm diagram of the few-layer Ti3C2Tx, spherical Ti3C2Tx and flaky Ti3C2Tx. | |
The N2 adsorption–desorption isotherms of few-layer Ti3C2Tx, spherical Ti3C2Tx and flaky Ti3C2Tx are given in Fig. 2(b). The specific surface area of few-layer Ti3C2Tx, spherical Ti3C2Tx and flaky Ti3C2Tx is 6.05 m2 g−1, 17.07 m2 g−1 and 17.81 m2 g−1, respectively. The results show that the specific surface area of spheroidal Ti3C2Tx and flaky Ti3C2Tx increased by 1.82 times and 1.94 times, respectively, compared with few-layer Ti3C2Tx after spray freezing. A larger specific surface area means that more active sites can be exposed, which is more conducive to adsorption.
The morphology and microstructure of the samples were characterized by scanning electron microscopy (SEM). As displayed in Fig. 3(a), the precursor Ti3AlC2 is a tightly packed massive structure. Fig. 3(b) shows that after etching, few-layer Ti3C2Tx with an average diameter of about 16 μm is obtained. Then few-layer Ti3C2Tx was spray frozen in liquid nitrogen with differnet Ti3C2Tx concentrations and freeze-dried at low temperature. Fig. 3(c) shows that spherical Ti3C2Tx was successfully prepared by spray freezing technology with a Ti3C2Tx concentration of 6 mg mL−1. After spray freezing, Ti3C2Tx basically formed a very regular round sphere with a diameter of 1–4 μm, and the sheet structure was almost invisible. Fig. 3(d) exhibits that the surface of the sphere is as smooth as that of Ti3C2Tx. Because the spray is not uniform, the size of the prepared sphere is also not uniform. Fig. 3(e) shows that flaky Ti3C2Tx with better dispersion was successfully prepared with low concentration (3 mg mL−1) Ti3C2Tx spray. From Fig. 3(f) it can be seen that the flaky Ti3C2Tx of 3 × 3 μm distribute in a gauzy manner, and the dispersion of the flaky Ti3C2Tx after spray freezing is significantly higher than that of the few-layer Ti3C2Tx. It indicates that the low concentration of Ti3C2Tx dispersion can effectively disperse Ti3C2Tx by spray freezing treatment and prevent the stacking of Ti3C2Tx.
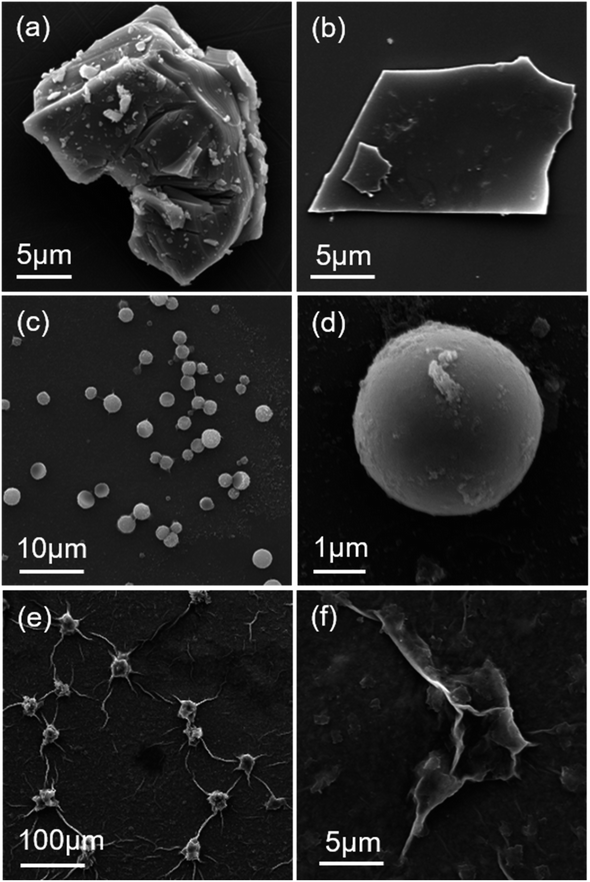 |
| | Fig. 3 SEM images of (a) precursor Ti3AlC2, (b) few-layer Ti3C2Tx, (c and d) spherical Ti3C2Tx, and (e and f) flaky Ti3C2Tx. | |
3.2 Adsorption capacity
The time dependent adsorption performance of the spherical and flaky Ti3C2Tx are exhibited in Fig. 4(a) and (b), respectively. It can be seen that the spherical and flaky Ti3C2Tx solution reached the adsorption equilibrium at about 5 min and 3 min respectively. In order to discuss the effect of Ti3C2Tx structures on the adsorption performance of Cr(VI), The adsorption properties of 20 mg untreated few layer, spherical and flaky Ti3C2Tx for 100 mL Cr(VI) solution at 250 mg L−1 were studied. The adsorption capacity at equilibrium was compared and shown in Fig. 4(c). It is found that the MAC of 20 mg few-layer, spherical and flaky Ti3C2Tx at equilibrium reached 472, 626 and 928 mg g−1, respectively, means that the adsorption capacity of spherical and flaky Ti3C2Tx was 33% and 97% larger than that of few-layer Ti3C2Tx, respectively. The reason for this phenomenon is that the specific surface area of flaky Ti3C2Tx is larger than that of spherical structures, and the flaky ones are more dispersed.
 |
| | Fig. 4 (a) The change of adsorption capacity and removal rate of spherical Ti3C2Tx with time; (b) the change of adsorption capacity and removal rate of flaky Ti3C2Tx with time; (c) comparison diagram of Cr(VI) maximum adsorption capacity of the few-layer Ti3C2Tx, the spherical Ti3C2Tx and the flaky Ti3C2Tx. | |
3.3 Adsorption kinetics
The pseudo-first-order kinetic model33 is as follows:| |
 | (4) |
The pseudo-second-order kinetic model34 is:
| |
 | (5) |
The in-particle diffusion model35 is:
| |
 | (6) |
where
k1 and
k2 are the constants of the corresponding kinetic model respectively, and
ki is the coefficient of stage i in the intra-particle diffusion model. In this study, 20 mg spherical Ti
3C
2T
x and flaky Ti
3C
2T
x were used as adsorbents, and the adsorption results of Cr(
VI) at different initial concentrations were fitted according to the above three models. As shown in
Fig. 5a and b, the fitting results show that the correlation coefficients of the pseudo-second-order kinetic model for Cr(
VI) adsorption by spherical and flaky Ti
3C
2T
x are closer to 1. By comparing the fitted parameters of kinetic model in
Table 2, the theoretical equilibrium adsorption capacity calculated by pseudo-second-order kinetic model is closer to the experimental results. Therefore, the pseudo-second-order kinetic model is more consistent with the adsorption process of Cr(
VI) by the spherical and flaky Ti
3C
2T
x. The pseudo-second-order kinetic model indicates that the adsorption rate is controlled by the bonding rate of the chemical bond between the adsorbent and the adsorbed object, which also indicates that the adsorption of Cr(
VI) by the spherical and flaky Ti
3C
2T
x belongs to chemical adsorption.
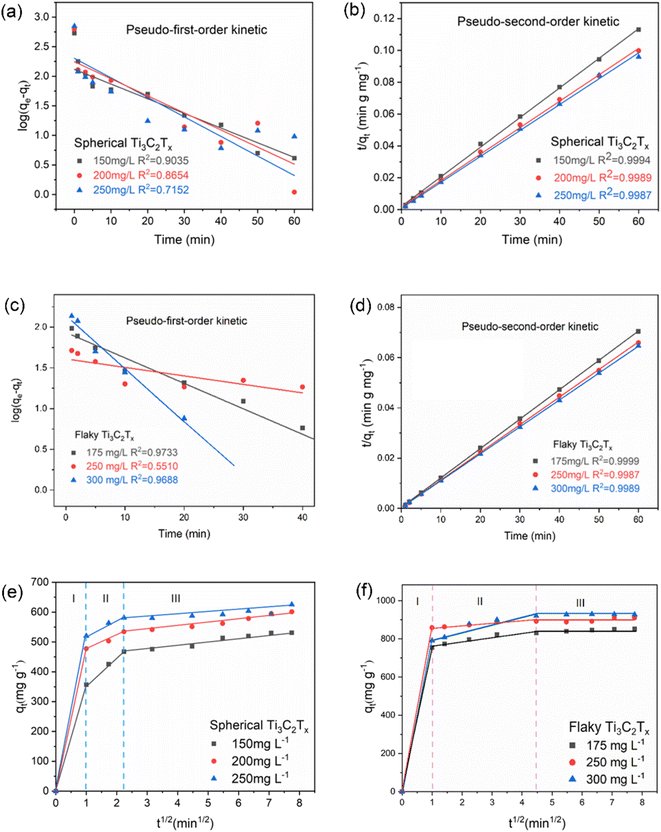 |
| | Fig. 5 (a–d) Kinetic models of spherical Ti3C2Tx and flaky Ti3C2Tx; (e and f) Weber–Morris intraparticle diffusion model of spherical Ti3C2Tx and flaky Ti3C2Tx. | |
Table 2 Fitting results of pseudo-first-order kinetics and pseudo-second-order kinetics
| |
C0 (mg L−1) |
qe exp. (mg g−1) |
Pseudo-first-order model |
Pseudo-second-order model |
| qe cal. (mg g−1) |
k1 |
R2 |
qe cal. (mg g−1) |
k2 |
R2 |
| S–Ti3C2Tx |
100 |
535 |
131 |
0.057 |
0.90 |
538 |
0.0018 |
0.99 |
| 125 |
626 |
177 |
0.067 |
0.86 |
602 |
0.0017 |
0.99 |
| 175 |
705 |
202 |
0.076 |
0.71 |
613 |
0.0030 |
0.99 |
| F–Ti3C2Tx |
175 |
804 |
81 |
0.054 |
0.97 |
850 |
0.0012 |
0.99 |
| 250 |
884 |
177 |
0.102 |
0.55 |
863 |
0.0012 |
0.99 |
| 300 |
928 |
253 |
0.156 |
0.96 |
899 |
0.0011 |
0.99 |
The intraparticle diffusion model holds that adsorption is a complex multi-stage process, namely external diffusion, in-particle diffusion, and adsorption at the adsorption site within the adsorbents. As shown in Fig. 5(e), the first stage of the adsorption of Cr(VI) by spherical Ti3C2Tx occurred within 10 min after the adsorption began. At this stage, Cr(VI) rapidly diffuse to the outer surface of Ti3C2Tx, and the adsorption reaction occurs on the outer surface. 10 to 30 min is the second stage of adsorption. With the progress of adsorption, the adsorption on the outer surface of Ti3C2Tx reaches saturation, Cr(VI) enters the Ti3C2Tx sphere, and the particles are diffused and adsorbed in the layer. After 30 min, the third stage of diffusion, adsorption and desorption reach dynamic equilibrium, the adsorption amount no longer increases. Fig. 5(f) shows the diffusion model of Ti3C2Tx on Cr(VI) particles. The three stages occurred within 2 min, 2 to 10 min and 10 min after the adsorption began. The fitting lines of the intragranular diffusion models of both spheres and Ti3C2Tx do not intersect with the origin, indicating that both of them are the internal and external diffusion that jointly governs the adsorption process.
3.4 Adsorption isotherm
The adsorption properties were closely related to the concentration of the adsorbent. In order to analyze the interaction between the adsorbent and Cr(VI), this study tested the MAC after 20 mg Ti3C2Tx adsorbed 100 mL Cr(VI) with different concentrations at 308 K and pH 2. As shown in (Fig. 6), with the increase of the initial concentration of Cr(VI), the MAC of spherical and flaky Ti3C2Tx at equilibrium also increases gradually. When the initial concentration of Cr(VI) was 300 mg L−1, the MAC of spherical and flaky Ti3C2Tx at equilibrium reached 629 and 928 mg g−1, respectively, and the removal efficiency was reduced to 64% and 62%, respectively. In order to analyze the adsorption mechanism, the single layer isothermal adsorption Langmuir model and the Freundlich isotherm model based on isomeric surface adsorption were established. The adsorption data were fitted with two models respectively to find the best. The linear equation of the Langmuir isotherm model36 is:| |
 | (7) |
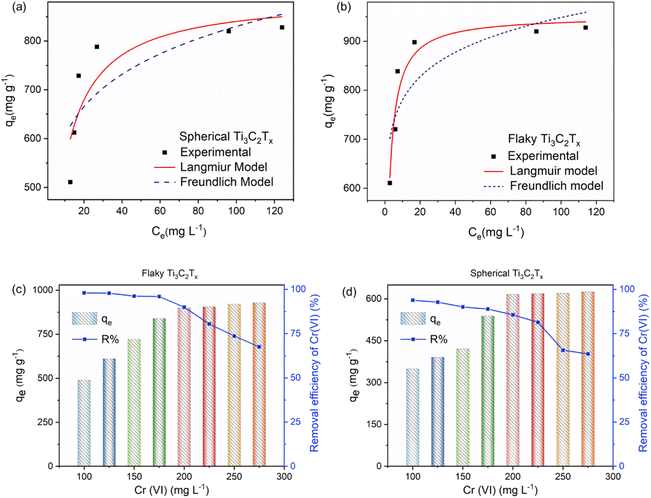 |
| | Fig. 6 Langmuir and Freundlich isotherm models of (a) spherical Ti3C2Tx and (b) flaky Ti3C2Tx; (c and d) The removal efficiency and maximum adsorption capacity of spherical Ti3C2Tx and flaky Ti3C2Tx as a function of Cr(VI) concentration. | |
The linear equation of the Freundlich isotherm model37 is:
| |
 | (8) |
where
Ce (mg L
−1) is the concentration of adsorbent at equilibrium,
qe (mg g
−1) is the adsorption capacity of adsorbent at equilibrium time of a certain concentration,
qm (mg g
−1) is the theoretical maximum adsorption capacity in Langmuir model, and
n represents the adsorption strength of Freundlich model.
KL and
KF are the equilibrium adsorption constants of the two models respectively. The Langmuir isotherm models of spherical and flaky Ti
3C
2T
x are more consistent with the experimental data, indicating that the adsorption of Cr(
VI) by spherical and flaky Ti
3C
2T
x is monolayer adsorption.
3.5 Adsorption thermodynamics
For 100 mL Cr(VI) at a concentration of 250 mg L−1, MAC of 20 mg spherical and flaky Ti3C2Tx solutions with adsorption temperature is shown in Fig. 7(a) The MAC increases with the increase of temperature, indicating that the adsorption process is endothermic. The thermodynamic parameters include enthalpy change (ΔH, kJ mol−1) and entropy change (ΔS, J mol−1 K−1) were calculated by Van't Hoff equation:38| |
 | (9) |
| |
 | (10) |
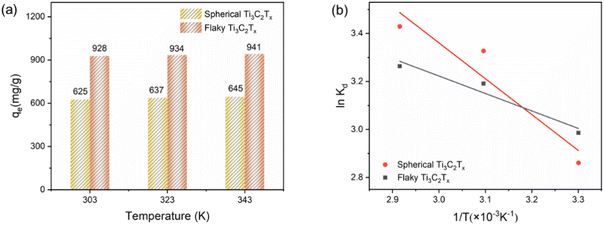 |
| | Fig. 7 (a) Graph of adsorption capacity of spherical Ti3C2Tx and flaky Ti3C2Tx with temperature; (b) van der Waals equation fitting graphs of spherical Ti3C2Tx and flaky Ti3C2Tx at different temperatures. | |
Gibbs free energy change (ΔG, kJ mol−1) was calculated from the following equation:
where
Kd is the distribution coefficient (mL g
−1),
T stands for absolute temperature (K), and
R is the ideal gas constant (8.314 J (mol K)
−1). The linear fitting relationship between ln
![[thin space (1/6-em)]](https://www.rsc.org/images/entities/char_2009.gif) Kd
Kd and 1/
T is shown in
Fig. 7(b), and the relevant parameters are list in
Table 3. Δ
H is greater than zero, which proves that the adsorption process is endothermic. Positive entropy indicates that randomness between interfaces increases during adsorption. Negative Δ
G indicates that the adsorption of Cr(
VI) by spheres and Ti
3C
2T
x is a spontaneous chemical reaction process.
Table 3 Thermodynamic parameters of Cr(VI) adsorption by spherical and flaky Ti3C2Tx
| |
ΔH (kJ mol−1) |
ΔS (J mol−1 K−1) |
ΔG (kJ mol−1) |
| 298 K |
308 K |
318 K |
| S–Ti3C2Tx |
12.42 |
64.85 |
−6.91 |
−7.55 |
−8.20 |
| F–Ti3C2Tx |
6.05 |
44.90 |
−7.33 |
−7.78 |
−8.22 |
3.6 Effect of pH
Adsorption tests were carried out on 100 mL, 300 mg L−1 Cr(VI) solution with 20 mg spherical and flaky Ti3C2Tx at 308 K, and the effect of different pH on the adsorption of Cr(VI) solution was investigated. The pH value of the solution has a great influence on the existence mode of Cr(VI) and the protonation/deprotonation of Ti3C2Tx. As shown in Fig. 8(a), the adsorption process of Cr(VI) by spherical and flaky Ti3C2Tx solutions is highly dependent on pH value. The adsorption ability of the adsorbent for Cr(VI) is very strong at low pH, and the adsorption capacity decreases rapidly with the increase of pH value. The result may be attributed to the fact that the presence of Cr(VI) varies with different pH, and potassium dichromate is a strong oxidizing agent in low pH or neutral solution. The reduction reaction equation is as follows:| | |
Cr2O72−(aq.) + 14H+ + 6e− → 2Cr3+(aq.) + 7H2O
| (12) |
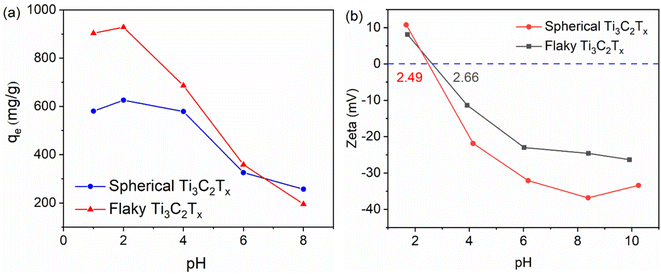 |
| | Fig. 8 (a) Maximum adsorption of Cr(VI) by spherical and flaky Ti3C2Tx at pH 1, 2, 4, 6, 8 (b) zeta potentials of spherical and flaky Ti3C2Tx at different pH. | |
So the removal of Cr(VI) is significantly dependent on pH. In addition, the effect of solution pH on the adsorption result is also affected by the surface charge condition of Ti3C2Tx solution. The test results of the zeta potential as shown in Fig. 8(b) can well explain the pH dependent adsorption behavior. The point of zero charge (PZC) of spherical and flaky Ti3C2Tx solution exists at pHPZC = 2.49 and pHPZC = 2.66, respectively. In solutions with pH less than pHPZC, the more positively charge on the adsorbent surface of Ti3C2Tx solution, the greater the electrostatic attraction of the positive charge on the surface of the adsorbent to the electronegative Cr2O72− in the solution. In solutions with pH greater than pHPZC, as the more negative charge on the surface of the adsorbent of Ti3C2Tx solution, the electrostatic repulsion of the negative surface of the adsorbent on the negative Cr2O72− in the solution will become greater, resulting in a decrease in adsorption performance. The variation trend of zeta potential is consistent with that of adsorption properties at different pH.
3.7 Adsorption mechanism
In order to further investigate the adsorption mechanism, the binding energy of Cr, Ti and C elements was tested by XPS to investigate the chemical bond changes before and after the flaky Ti3C2Tx adsorbed Cr(VI). As shown in Fig. 9(a), the full-spectrum scanning results revealed that peaks of Ti, C, O and F existed in flaky Ti3C2Tx before adsorption, and peaks of Cr 2p appeared in Ti3C2Tx after adsorption.39 Fig. 9(b) shows the high-resolution XPS spectra of Cr 2p before and after adsorption. Cr 2p in potassium bichromate before adsorption is composed of Cr(VI) 2p1/2 (588.6 eV) and Cr(VI) 2p3/2 (579.4 eV).40 Cr 2p in Ti3C2Tx after adsorption is composed of Cr(III) 2p1/2 (587.2 eV) and Cr(III) 2p3/2 (577.6 eV). After adsorption, Cr(VI) was completely reduced to Cr(III).41 The high-resolution XPS spectra of Ti 2p before and after adsorption is given in Fig. 9(c). It is evident that, prior to adsorption, the Ti 2p consists of 2p1/2 (459.9, 460.0, 461.9 eV) attributed to C–Ti–Tx, 2p3/2 (458.2 eV) attributed to Ti–O, 2p3/2 (454.1, 455.1, 456.3 eV) attributed to C–Ti–Tx. After adsorption, 2p (458.6 eV) and 2p3/2 (464.6 eV) peaks of Ti–O are added to Ti 2p1/2, which proves that Ti is oxidized to TiO2 during the adsorption process. Fig. 9(d) shows the high-resolution XPS spectra of C 1s before and after adsorption.42 It can be seen that before adsorption, C 1s consisted of C–C (284.8 eV) and Ti–C (282.3 eV), and after adsorption, in addition to the two existing peaks of C 1s, new peaks C–O (288.6 eV) and C–Cr (286.5 eV) appeared, indicating that the C and Cr complexation reaction of Ti3C2Tx occurred during the adsorption process (Fig. 10).
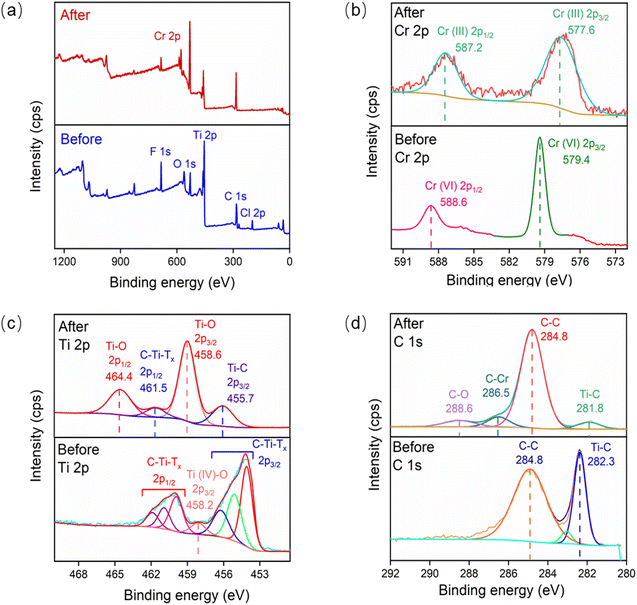 |
| | Fig. 9 Comparison of XPS spectra of Ti3C2Tx before and after adsorption: (a) full spectrum, (b) Cr 2p, (c) Ti 2p, (d) C 1s. | |
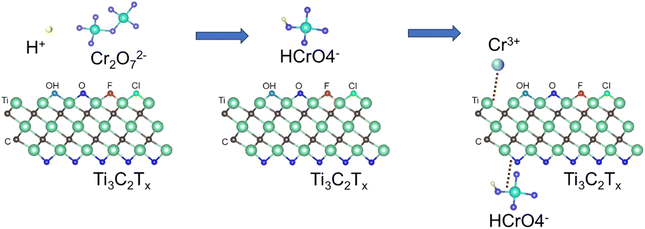 |
| | Fig. 10 Schematic diagram of adsorption mechanism of Cr(VI) on Ti3C2Tx. | |
The adsorption of Cr(VI) by Ti3C2Tx can be divided into three stages. In the first stage, Cr(VI) exists in the form of Cr2O72− before adsorption. In the second stage, the acid is added to the potassium dichromate solution, under acidic conditions, Cr2O72− and H+ quickly form HCrO4− with strong oxidation,43 and the positively charged Ti3C2Tx is easy to adsorb the negatively charged HCrO4−.44 On the one hand, due to electrostatic attraction, a small amount of HCrO4− physically adsorbs with the O or F terminal on Ti3C2. On the other hand, due to the reducibility of Ti3C2Tx, most HCrO4− will be rapidly reduced to Cr(III) by Ti3C2Tx. In the third stage, part of Cr(III) forms a Ti–O–Cr bond with the O terminal, which is anchored to the surface of Ti3C2Tx.
The MAC of Ti3C2Tx solution for Cr(VI) was compared with the previous reports related to MXene-based absorbent, and the results are listed in Table 4. It can be found that Ti3C2Tx sample obtained by spray freezing treatment in this work has a very high adsorption capacity and the fastest adsorption rate, the adsorption properties and equilibrium time of the flaky Ti3C2Tx are found to be better than that of the spherical Ti3C2Tx.
Table 4 Comparison of adsorption properties between this work and existing reports on Mxene adsorption of Cr(VI)
| Adsorbent |
Initial Cr(VI) concentration (mg L−1) |
Equilibrium time (min) |
Maximum adsorption (mg g−1) |
References |
| Ti3C2Tx powder |
400 |
480 |
250 |
45 |
| Multi-layer Ti3C2Tx |
100 |
720 |
80 |
20 |
| ZVI-Alk-Ti3C2Tx |
100 |
360 |
198 |
21 |
| Ti3C2Tx/Pdmm |
100 |
240 |
540 |
46 |
| 1CTAB-Ti3C2 |
200 |
360 |
206 |
47 |
| Ti3C2@IMIZ |
30 |
80 |
184 |
48 |
| Ti3C2/TiO2 |
50 |
240 |
516 |
49 |
| Spherical Ti3C2Tx |
250 |
50 |
626 |
This work |
| Flaky Ti3C2Tx |
300 |
20 |
928 |
This work |
4. Conclusion
In this work, spherical and flaky Ti3C2Tx were successfully prepared using spray freezing method. BET analysis shows that the specific surface areas of spherical Ti3C2Tx and flake Ti3C2Tx are 17.07 m2 g−1 and 17.81 m2 g−1, respectively, which are 1.81 and 1.94 times larger than that of few-layer Ti3C2Tx. The optimized spherical and flaky structures effectively mitigate the stacking issue of Ti3C2Tx, thereby providing more adsorption sites. Under the condition of pH 2, the MAC of 20 mg spherical and flaky Ti3C2Tx for 100 mL, 250 mg L−1 Cr(VI) solution are 626 and 928 mg g−1, respectively. Compared to the few-layer Ti3C2Tx, MAC increased by 33% and 97%, respectively. The adsorption process of spherical and flaky Ti3C2Tx is controlled by chemical adsorption and monolayer adsorption. Thermodynamic experiments have shown that the adsorption reaction is endothermic. By comparing the XPS results before and after adsorption, the adsorption mechanism was discussed in depth. During the adsorption process, unsaturated Ti(II) was oxidized, while Cr(VI) was reduced to Cr(III), indicating that the adsorption of Cr(VI) onto Ti3C2Tx is primarily reductive adsorption. In brief, by optimizing the structure of two-dimensional Ti3C2Tx, the stacking issue of Ti3C2Tx was effectively alleviated, and the adsorption capacity was significantly improved in this study. Moreover, the exceptional adsorption capacity and rapid adsorption rate of the flaky Ti3C2Tx adsorbent for Cr(VI) make it a promising candidate for practical applications in emergency treatment of Cr(VI) wastewater.
Data availability
The data that support the findings of this study are available on request from the corresponding author.
Conflicts of interest
There are no conflicts to declare.
Acknowledgements
This study was funded by various sources, including the National Natural Science Foundation of China (grant NSFC U22A2078), the Fundamental Research Fund for Central Universities (Project 2022CDJQY-007), the Chongqing Natural Science Foundation (Grant CSTB2022NSCQ-LZX0032), the Open Project of Sichuan Material Corrosion and Protection Key Laboratory (No. 2022CL25), the Sharing Fund of Large-scale Equipment of Chongqing University (202303150164, 202303150169, 202303150178), NHC Key Laboratory of Nuclear Technology Medical Transformation (Mianyang Central Hospital) (No. 2021HYX007), Fundamental Science on Nuclear Wastes and Environmental Safety Laboratory (21kfhk04, 18kfhk02, 20kfhk02). We also thank the Analytical and Testing Center at Chongqing University for conducting XRD, FT-IR, and SEM tests.
References
- H. Karimi-Maleh, A. Ayati, S. Ghanbari, Y. Orooji, B. Tanhaei, F. Karimi, M. Alizadeh, J. Rouhi, L. Fu and M. Sillanpää, J. Mol. Liq., 2021, 329, 115062 CrossRef CAS.
- W. Liu, J. Ni and X. Yin, Water Res., 2014, 53, 12–25 CrossRef CAS PubMed.
- L. Wei, Q. Li, H. Li, H. Ye, D. Han, Z. Guo and S. Lek, Ecotoxicol. Environ. Saf., 2022, 241, 113744 CrossRef CAS PubMed.
- H. Wang, F. Wu, Z. Wang, Y. Wang, S. Zhang, H. Luo, Z. Zheng and L. Fang, Chemosphere, 2022, 308, 136573 CrossRef CAS PubMed.
- S. Mahiout, M. Kiilunen, T. Vermeire, S. Viegas, M. Woutersen and T. Santonen, Regul. Toxicol. Pharmacol., 2022, 136, 105276 CrossRef CAS PubMed.
- G. Asgari, A. Sidmohammadi, A. R. Rahmani, M. R. Samargandi and H. Faraji, Optik, 2020, 218, 164983 CrossRef CAS.
- L. Ma, N. Chen, C. Feng, Y. Yao, S. Wang, G. Wang, Y. Su and Y. Zhang, Water Res., 2022, 212, 118144 CrossRef CAS PubMed.
- R. Verma and S. Sarkar, Ind. Eng. Chem. Res., 2020, 59, 21187–21195 CrossRef CAS.
- H. Chen, Y. J. Zhang, P. Y. He, C. J. Li and H. Li, Appl. Surf. Sci., 2020, 515, 146024 CrossRef CAS.
- P. Basnet, P. K. Ojha, D. Gyawali, K. N. Ghimire and H. Paudyal, Heliyon, 2022, 8, e10305 CrossRef CAS PubMed.
- G. Wang, Y. Hua, X. Su, S. Komarneni, S. Ma and Y. Wang, Appl. Clay Sci., 2016, 124–125, 111–118 CrossRef CAS.
- M. Deng, J. Guo, X. Ma, Y. Fu, H. Du, D. Hao and Q. Wang, Sep. Purif. Technol., 2023, 326, 124786 CrossRef CAS.
- M. A. Diab, N. F. Attia, A. S. Attia and M. F. El-Shahat, Synth. Met., 2020, 265, 116411 CrossRef CAS.
- W. Yao, T. Ni, S. Chen, H. Li and Y. Lu, Compos. Sci. Technol., 2014, 99, 15–22 CrossRef CAS.
- K. Eskandari and B. Karami, Monatsh. Chem., 2016, 147, 2119–2126 CrossRef CAS.
- M. Helmi, F. Moazami, A. Hemmati and A. Ghaemi, J. Phys. Chem. Solids, 2023, 178, 111338 CrossRef CAS.
- K. Chu, F. Liu, J. Zhu, H. Fu, H. Zhu, Y. Zhu, Y. Zhang, F. Lai and T. Liu, Adv. Energy Mater., 2021, 11, 2003799 CrossRef CAS.
- M. Naguib, M. Kurtoglu, V. Presser, J. Lu, J. Niu, M. Heon, L. Hultman, Y. Gogotsi and M. W. Barsoum, Adv. Mater., 2011, 23, 4248–4253 CrossRef CAS PubMed.
- H. Deng, Y. Hui, C. Zhang, Q. Zhou, Q. Li, H. Du, D. Hao, G. Yang and Q. Wang, Chin. Chem. Lett., 2024, 35, 109078 CrossRef CAS.
- Y. Tang, C. Yang and W. Que, J. Adv. Dielectr., 2018, 8, 5 Search PubMed.
- L. He, D. Huang, Z. He, X. Yang, G. Yue, J. Zhu, D. Astruc and P. Zhao, J. Hazard. Mater., 2020, 388, 121761 CrossRef CAS PubMed.
- L. Zhu, R. Ye, P. Tang and P. Xia, Aust. J. Chem., 2022, 75, 795–798 CrossRef CAS.
- Q. Li, C. Ge, J. Ma, S. Gu, H. Yang, Y. Xiong, H. Zhou, H. Du, H. Zhu and Q. Wang, Sep. Purif. Technol., 2024, 342, 126982 CrossRef CAS.
- R. Liu, J. Li, M. Li, Q. Zhang, G. Shi, Y. Li, C. Hou and H. Wang, ACS Appl. Mater. Interfaces, 2020, 12, 46446–46454 CrossRef CAS PubMed.
- W. Li, S. Zhang, D. He, M. Cai, C. He and X. Fan, Tribol. Int., 2023, 188, 108877 CrossRef CAS.
- S. Zhang, H. Ying, B. Yuan, R. Hu and W.-Q. Han, Nano–Micro Lett., 2020, 12, 78 CrossRef CAS PubMed.
- K. Mustonen, A. Hussain, C. Hofer, M. R. A. Monazam, R. Mirzayev, K. Elibol, P. Laiho, C. Mangler, H. Jiang, T. Susi, E. I. Kauppinen, J. Kotakoski and J. C. Meyer, ACS Nano, 2018, 12, 8512–8519 CrossRef CAS PubMed.
- J. Yan, C. E. Ren, K. Maleski, C. B. Hatter, B. Anasori, P. Urbankowski, A. Sarycheva and Y. Gogotsi, Adv. Funct. Mater., 2017, 27, 1701264 CrossRef.
- M. Zhao, X. Xie, C. E. Ren, T. Makaryan, B. Anasori, G. Wang and Y. Gogotsi, Adv. Mater., 2017, 29, 1702410 CrossRef PubMed.
- H. Zhang, Z. Dai, Y. Sui, N. Wang, H. Fu, D. Ding, N. Hu, G. Li, Y. Wang and L. Li, Ind. Eng. Chem. Res., 2018, 57, 17318–17327 CrossRef CAS.
- X. Nie, X. Hu, C. Liu, X. Xia and F. Dong, Desalination, 2021, 516, 115226 CrossRef CAS.
- J. Gao, Y. Lu, L. Fang, F. Wu, F. Ling, T. Guan, L. Shi, B. Hu and F. Meng, Environ. Eng. Sci., 2018, 35, 373–381 CrossRef CAS.
- T. Guan, L. Fang, Y. Lu, F. Wu, F. Ling, J. Gao, B. Hu, F. Meng and X. Jin, Colloids Surf., A, 2017, 529, 907–915 CrossRef CAS.
- F. Ling, L. Fang, Y. Lu, J. Gao, F. Wu, M. Zhou and B. Hu, Microporous Mesoporous Mater., 2016, 234, 230–238 CrossRef CAS.
- Y. Lu, B. Jiang, L. Fang, F. Ling, J. Gao, F. Wu and X. Zhang, Chemosphere, 2016, 152, 415–422 CrossRef CAS PubMed.
- D. Zhang, L. Liu, Z. Ma, H. Hou, X. Wang and S. Yu, Colloids Surf., A, 2024, 692, 133977 CrossRef CAS.
- A. Shahzad, K. Rasool, W. Miran, M. Nawaz, J. Jang, K. A. Mahmoud and D. S. Lee, ACS Sustain. Chem. Eng., 2017, 5, 11481–11488 CrossRef CAS.
- A. Mullick, S. Moulik and S. Bhattacharjee, Indian Chem. Eng., 2018, 60, 58–71 CrossRef CAS.
- Q. Wang, H. Zhou, J. Qian, B. Xue, H. Du, D. Hao, Y. Ji and Q. Li, J. Mater. Sci. Technol., 2024, 190, 67–75 CrossRef.
- A. R. Khan, S. M. Husnain, F. Shahzad, S. Mujtaba-ul-Hassan, M. Mehmood, J. Ahmad, M. T. Mehran and S. Rahman, Dalton Trans., 2019, 48, 11803–11812 RSC.
- A. Shahzad, K. Rasool, W. Miran, M. Nawaz, J. Jang, K. A. Mahmoud and D. S. Lee, ACS Sustain. Chem. Eng., 2017, 5, 11481–11488 CrossRef CAS.
- X. Xie, C. Chen, N. Zhang, Z.-R. Tang, J. Jiang and Y.-J. Xu, Nat. Sustain., 2019, 2, 856–862 CrossRef.
- Q. Wang, W. Ma, J. Qian, N. Li, C. Zhang, M. Deng and H. Du, Environ. Pollut., 2024, 347, 123707 CrossRef CAS PubMed.
- X. Ma, H. Du, M. Tan, J. Qian, M. Deng, D. Hao, Q. Wang and H. Zhu, Sep. Purif. Technol., 2024, 339, 126644 CrossRef CAS.
- Y. Ying, Y. Liu, X. Wang, Y. Mao, W. Cao, P. Hu and X. Peng, ACS Appl. Mater. Interfaces, 2015, 7, 1795–1803 CrossRef CAS PubMed.
- L. Jin, L. Chai, W. Yang, H. Wang and L. Zhang, Int. J. Environ. Res. Public Health, 2019, 17, 167 CrossRef PubMed.
- X. Huang, W. Mu and C. Chang, J. Alloys Compd., 2023, 968, 172012 CrossRef CAS.
- G. Yang, X. Hu, J. Liang, Q. Huang, J. Dou, J. Tian, F. Deng, M. Liu, X. Zhang and Y. Wei, J. Hazard. Mater., 2021, 419, 126220 CrossRef CAS PubMed.
- H. Wang, H. Cui, X. Song, R. Xu, N. Wei, J. Tian and H. Niu, J. Colloid Interface Sci., 2020, 561, 46–57 CrossRef CAS PubMed.
Footnote |
| † These authors contributed to the work equally and should be regarded as co-first authors. |
|
| This journal is © The Royal Society of Chemistry 2024 |
Click here to see how this site uses Cookies. View our privacy policy here.  Open Access Article
 *ab
*ab
![[thin space (1/6-em)]](https://www.rsc.org/images/entities/char_2009.gif) :
:![[thin space (1/6-em)]](https://www.rsc.org/images/entities/char_2009.gif) HCl
HCl![[thin space (1/6-em)]](https://www.rsc.org/images/entities/char_2009.gif) :
:![[thin space (1/6-em)]](https://www.rsc.org/images/entities/char_2009.gif) LiF was mixed according to the ratio of 1 g
LiF was mixed according to the ratio of 1 g![[thin space (1/6-em)]](https://www.rsc.org/images/entities/char_2009.gif) :
:![[thin space (1/6-em)]](https://www.rsc.org/images/entities/char_2009.gif) 20 mL
20 mL![[thin space (1/6-em)]](https://www.rsc.org/images/entities/char_2009.gif) :
:![[thin space (1/6-em)]](https://www.rsc.org/images/entities/char_2009.gif) 1.6 g, stirred magnetically at 50 °C with 1000 rpm for 24 h, and then the mixture was washed and centrifuged multiple times with deionized (DI) water until the pH of solution reached 6. After ultrasonic treatment for 3 h, the upper layer solution was collected by further centrifugation at 3500 rpm for 30 min. The collected solution turned green after dilution and formed a stable and uniform suspension, indicating successful preparation of Ti3C2Tx with few layers. A solution sample (20 mL) was filtered, dried, and weighed to determine a concentration of 6 mg mL−1 before being stored in the refrigerator.
1.6 g, stirred magnetically at 50 °C with 1000 rpm for 24 h, and then the mixture was washed and centrifuged multiple times with deionized (DI) water until the pH of solution reached 6. After ultrasonic treatment for 3 h, the upper layer solution was collected by further centrifugation at 3500 rpm for 30 min. The collected solution turned green after dilution and formed a stable and uniform suspension, indicating successful preparation of Ti3C2Tx with few layers. A solution sample (20 mL) was filtered, dried, and weighed to determine a concentration of 6 mg mL−1 before being stored in the refrigerator.


![[thin space (1/6-em)]](https://www.rsc.org/images/entities/char_2009.gif) Kd and 1/T is shown in Fig. 7(b), and the relevant parameters are list in Table 3. ΔH is greater than zero, which proves that the adsorption process is endothermic. Positive entropy indicates that randomness between interfaces increases during adsorption. Negative ΔG indicates that the adsorption of Cr(VI) by spheres and Ti3C2Tx is a spontaneous chemical reaction process.
Kd and 1/T is shown in Fig. 7(b), and the relevant parameters are list in Table 3. ΔH is greater than zero, which proves that the adsorption process is endothermic. Positive entropy indicates that randomness between interfaces increases during adsorption. Negative ΔG indicates that the adsorption of Cr(VI) by spheres and Ti3C2Tx is a spontaneous chemical reaction process.


