 Open Access Article
Unravelling the role of pore structure of biomass-derived porous carbon in charge storage mechanisms for supercapacitors
Mostafa S. Sayed†
ab,
Delvin Aman† *bc,
Moataz G. Fayedd,
Mostafa M. Omrane,
Tamer Zakibc and
Saad G. Mohamed
 *d
*d
aAnalysis and Evaluation Department, Egyptian Petroleum Research Institute, Nasr City, Cairo, 11727, Egypt
bCentral Analytical Laboratories, Egyptian Petroleum Research Institute, Nasr City, PO Box 11727, Cairo, Egypt. E-mail: delvin.aman@epri.sci.eg
cCatalysis Laboratory, Refining Department, Egyptian Petroleum Research Institute (EPRI), Nasr City, 11727 Cairo, Egypt
dMining and Metallurgy Engineering Department, Tabbin Institute for Metallurgical Studies (TIMS), Tabbin, Helwan 109, Cairo 11421, Egypt. E-mail: saadmohamed@tims.gov.eg
eChemistry Department, Faculty of Science, Cairo University, Giza, 12613, Egypt
First published on 7th August 2024
Abstract
This study presents findings on the production and analysis of activated carbon (AC), which exhibits a significantly expansive surface area derived from readily available and inexpensive agroforestry waste, specifically coconut shells. The carbon materials displayed encouraging features for electrochemical energy storage applications with a high specific surface area (2920 m2 g−1), an ordered mesoporous structure (∼2.5 nm), and substantial electronic conductivity. By altering the surface properties of AC materials, they exhibited different energy storage responses while using an ionic liquid as an electrolyte. Electrodes composed of AC sourced from coconut shells demonstrated notably high specific capacitance (78 F g−1) and retained capacitance when assessed within symmetric electrical double-layer capacitors (EDLCs) employing organic electrolytes. Interestingly, the AC cell in an organic electrolyte delivered a specific energy (Es) of 67 W h kg−1 at a specific power (Ps) of 1237 W kg−1 at the current density of 1 A g−1 and still provided Es of 64, 60, 58, 57, and 52 W h kg−1 at Ps of 2477, 3724, 4971, 6218 and 12![[thin space (1/6-em)]](https://www.rsc.org/images/entities/char_2009.gif) 480 W kg−1 at the current density of 2, 3, 4, 5 and 10 A g−1. This work demonstrates the effect of different pore volumes on the electrocatalytic activity of AC derived from natural product waste. Our results indicate the feasibility of employing these electrodes for lab-scale applications. Thus, the AC material emerges as a highly promising substance, poised to advance the creation of cost-efficient, environmentally sustainable, high-performance, high-power devices.
480 W kg−1 at the current density of 2, 3, 4, 5 and 10 A g−1. This work demonstrates the effect of different pore volumes on the electrocatalytic activity of AC derived from natural product waste. Our results indicate the feasibility of employing these electrodes for lab-scale applications. Thus, the AC material emerges as a highly promising substance, poised to advance the creation of cost-efficient, environmentally sustainable, high-performance, high-power devices.
1. Introduction
With the increasing demand for and rapid development of miniaturized portable electronic devices, energy storage systems with high-capacity performance are desperately needed. Due to its high capacitance, power density, wide usage temperature range, and safety, electric double-layer capacitors (EDLCs) have aroused extensive attention. Currently, supercapacitors find wide applications in memory backup systems, electronic devices, automation, and energy generation. Their rising popularity is attributed to their capability to offer superior power density compared to batteries.1 Indeed, based on forecasts, the supercapacitor market achieved a value of USD 0.69 billion in 2023 and is anticipated to attain USD 1.17 billion by 2028, demonstrating a Compound Annual Growth Rate (CAGR) of 11.14% from 2023 to 2028.2 The greater utilization of supercapacitors and large capacity storage of supercapacitors in energy-storage applications is driving market growth. The electrode material, as a key part of the supercapacitor, directly affects the electrochemical performance. It is well established that the hierarchical pore structure of the electrode material is beneficial for supercapacitors to achieve high energy and power density.Supercapacitor electrodes have been fabricated using a variety of materials, including metal oxides, carbon-based materials, conducting polymers, and others.3 Therefore, it is of critical significance to acquire electrode materials with well-developed pore structures. In this regard, carbonaceous materials, including activated carbon (AC), carbon nanofibers, graphene nanosheets, and carbon nanotubes, are commonly used in the electrodes of EDLCs.4
As suggested by Conway,5 the EDLCs must have the following three characteristics: (1) high enough SSA to reach 1000 m2 g−1; (2) sufficient intra/interparticle conductivity in the porous matrices; and (3) sufficient access of electrolyte to the intrapore space of carbon-based materials. Depending on the previous three properties, the selection process of electrode materials for SCs is controlled by a high and accessible surface area along with strong electronic conductivity. Commonly in supercapacitors, carbon materials used as electrodes primarily depend on their large specific surface area for energy storage through the adsorption of electrolyte ions at the electrode/electrolyte interface. However, electrochemical activity is influenced not only by surface area but also by pore structure. According to the International Union of Pure and Applied Chemistry (IUPAC) definition of pore size,6 micropores (<2 nm) enhance the specific surface area and serve as adsorption sites for electrolyte ions. Mesopores (2–50 nm) facilitate rapid ion diffusion, while macropores (>50 nm) act as ion buffering reservoirs, reducing ion diffusion distances. Thus, creating a hierarchical porous structure with a large surface area is a promising strategy for improving electrochemical performance in supercapacitors.7
Previous reports show that micropores significantly increase the surface area and specific capacitance of carbon materials. However, these materials often suffer from poor rate capability at high current densities due to low conductivity and limited ionic diffusion in tortuous micropores, restricting their use in high-power energy storage. Conversely, excessive mesopores and macropores can reduce the high specific surface area. Therefore, balancing the ratio of micropores, mesopores, and macropores in hierarchical porous carbon materials is crucial.8
Designing hierarchical porous carbons with an optimal combination of micro-, meso-, and macropores remains a persistent challenge in the pursuit of high-performance supercapacitors. In such structures, electrolyte ions transfer from macropores, which act as ion reservoirs, into micropores through ion-transport channels (mesopores) with short pathways, thereby enhancing the ion-accessible surface area.9
Hierarchically porous architectures constitute a fundamental structural form prevalent in nature. For instance, the hard tissues in humans and animals, as well as the stalks, branches, and leaves of plants, frequently exhibit hierarchically porous structures. Therefore, due to its abundance, agroforestry waste as natural hierarchically porous structures is a promised cost-effective source of activated carbon as energy storage materials. Recent research indicates that utilizing agricultural by-products for biochar activation can reduce costs and environmental impact in large-scale applications. Using bio-waste for biochar production offers numerous benefits, including soil carbon restoration, water conservation, increased crop yields, and climate change mitigation. However, a comprehensive cross-sectoral policy approach is needed to exploit biochar's potential and maximize its environmental advantages. Biochar aligns with the EU and Africa's objectives of promoting circular economy practices, particularly through the use of waste streams like agroforestry waste. Coconut shells, as agroforestry waste, with their rich composition of hemicellulose, cellulose, and lignin, are excellent candidates for producing activated carbon resources. The synthesis of AC materials from coconut shells through a process that includes steps such as carbonization, activation, surface modification, or templating. Also, activating agents (e.g., KOH, H3PO4) are employed to introduce and expand pores during the carbonization process. Additionally, the carbonization and activation processes can be energy-intensive and require careful control to ensure the uniformity and reproducibility of the porous structure.10,11
This research aims to study two carbons derived from coconut waste shells, SUSCAP-01 and SUSCAP-02. SUSCAP-01 has a high percentage of micropores, while SUSCAP-02 has a high percentage of mesopores. Despite originating from the same biomass source, the primary difference lies in their pore structures, with SUSCAP-02 exhibiting higher pore volume and larger pore diameter than SUSCAP-01. These carbons are used as electrode material and are characterized using FE-SEM, XRD, Raman, FTIR, and nitrogen physisorption techniques. This study demonstrates the impact of varying pore structures on the electrocatalytic activity of activated carbon (AC) samples. Indeed, that allows us to make a backdrop between the relevant porosity of our low-cost activated carbon materials and the energy storage performance.
2. Experimental
2.1. Materials and characterization
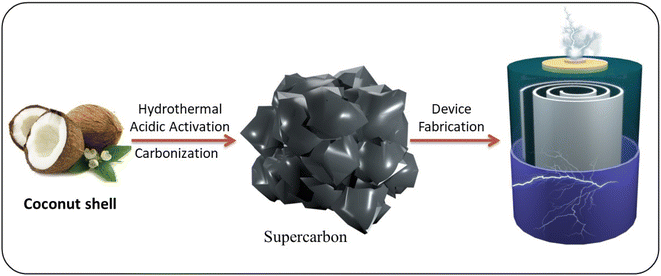
All the purchased chemicals and supplied materials were used without any treatment. Activated carbons derived from biomass, supplied by Envirohemp S.L, “Supercarbons” (Navarra, Spain).12,13 Coconut shells can serve as good precursors for carbon materials, so the tested carbons are produced from local coconut waste biomass. Coconut shells primarily consist of lignin, which contains abundant polyaromatic units that are stable and tend to form 2D structures. Consequently, porous carbon derived from lignin-rich coconut shells typically exhibits a favourable degree of graphitization with good conductivity. The overall process, depicted in Fig. 1′s schematic diagram, involves the degradation of coconut shells into oligomer fragments with low molecular weights, which are then converted into hydrochars through a hydrothermal process at 900 °C. This step is followed by chemical activation using an acidic route, resulting in a high number of nanopores in the carbon framework and ultimately producing highly porous activated carbon with a large surface area.14The studied carbons will be referred to as SUSCAP-01 and SUSCAP-02. SUSCAP-01 (high micropores%) and SUSCAP-02 (high mesopores%). The difference is just in the pore structure of two carbons despite the same source of biomass. Since SUSCAP-02 exhibits higher pore volume and pore diameter than SUSCAP-01. In both materials, the acidic treatment slightly alters the textural properties, resulting in low BET surface area and significantly high average pore diameter of the treated carbons. This aligns well with the fact that strong oxidation from acid treatment can reduce the BET surface area and microporous structure.15
The scanning electron microscopy (SEM) images of prepared activated carbon materials were taken by (FE-SEM, Zeiss, Sigma 300VP, Germany). The phase structure and chemical composition of the prepared samples were investigated using X-ray powder diffraction (XRD) carried out on Shimadzu (model XD-DI) diffractometer in 2θ range between 15° and 80° with Cu Kα radiation (λ = 1.54056 Å). The crystal structure parameters of tested AC samples were calculated from the (002) peak through the formula16 below.
 | (1) |
 | (2) |
 | (3) |
Raman spectroscopy (Micro-Raman microscope, excitation laser beam wavelength of 532 nm) was carried out by Senterra, Brucker, UK. The chemical structure of AC was determined by Fourier-transform infrared spectroscopy (FTIR spectrometer PerkinElmer, model spectrum one FTIR spectrometer, USA). Brunauer–Emmett–Teller (BET) model using N2-isotherm (NOVA 3200 S Unite, Quanta Chrome Corporation, Florida, USA).
2.2. Electrochemical measurements
To perform the electrochemical studies on the AC, the electrodes from these materials were prepared by mixing the active material (AC) with carbon black as a conducting agent and PVDF as a binder at a weight ratio of 80![[thin space (1/6-em)]](https://www.rsc.org/images/entities/char_2009.gif) :
:![[thin space (1/6-em)]](https://www.rsc.org/images/entities/char_2009.gif) 10
10![[thin space (1/6-em)]](https://www.rsc.org/images/entities/char_2009.gif) :
:![[thin space (1/6-em)]](https://www.rsc.org/images/entities/char_2009.gif) 10, respectively, in dimethylformamide (DMF). The mixture was dropped cast on the Ni foam as a current collector with a moderated mass loading (about 3.5 mg). The electrochemical studies were performed in the three-electrode system using a Pt counter electrode, an Ag/AgCl reference electrode, and the prepared electrodes as working electrodes. Two different electrolytes were used: a neutral electrolyte, which is composed of 1 M Na2SO4, and the second electrolyte was an ionic liquid, which is composed of tetraethylammonium tetrafluoroborate in propylene carbonate (TEABF4/PC).
10, respectively, in dimethylformamide (DMF). The mixture was dropped cast on the Ni foam as a current collector with a moderated mass loading (about 3.5 mg). The electrochemical studies were performed in the three-electrode system using a Pt counter electrode, an Ag/AgCl reference electrode, and the prepared electrodes as working electrodes. Two different electrolytes were used: a neutral electrolyte, which is composed of 1 M Na2SO4, and the second electrolyte was an ionic liquid, which is composed of tetraethylammonium tetrafluoroborate in propylene carbonate (TEABF4/PC).
Cyclic voltammetry (CV), galvanostatic charge–discharge (GCD), and electrochemical impedance spectroscopy (EIS) were tested at various scan rates and current densities by using the electrochemical testing station (OrigaFlex electrochemical testing station, Origalys, France). Based on the following formulas, the specific capacitance (Cs) value in the three-electrode arrangement was estimated from the GCDs using the following equation.
 | (4) |
3. Results and discussion
The ACs were synthesized from biomass waste for industrial applications, utilizing coconut waste as the precursor material. This study introduces two distinct types of AC exhibiting varied characteristics.3.1. Scanning electron microscopy (SEM)
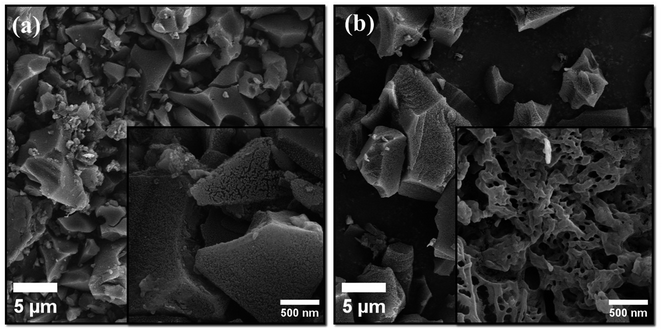
The morphological differences between SUSCAP-01 and SUSCAP-02 were examined using SEM. The outer surface of SUSCAP-01 features folds, while its inner surface is smooth with an irregular particle structure and a higher distribution of tiny pores (Fig. 2a). This indicates a variety of micropores and mesopores in the carbon skeleton, suggesting that SUSCAP-01 retains the vascular bundle structure of the coconut shell. In contrast, SUSCAP-02 displays regular vascular bundles and ridged folds with a greater abundance of mesopores and micropores forming an organized hierarchical porous structure (Fig. 2b). These pores provide channels for ion transport, reducing ion transport resistance. When SUSCAP-02 contacts the electrolyte, ions adsorb the free charge, facilitating migration and enhancing electrochemical performance.173.2. X-ray powder diffraction (XRD)
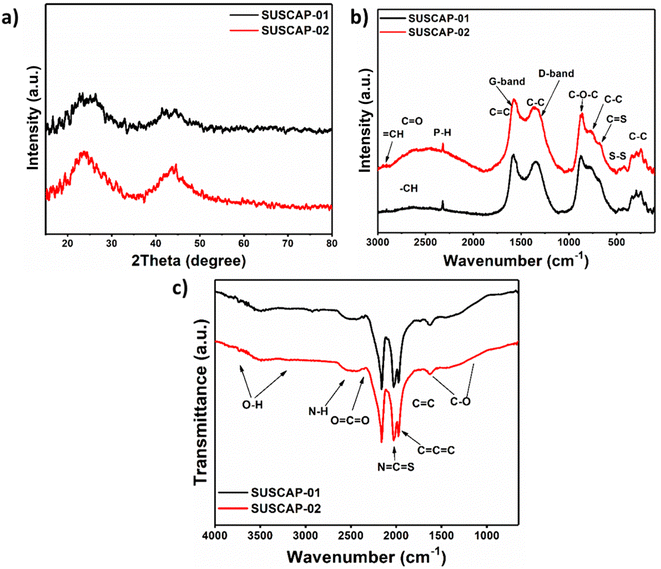
XRD analysis was employed to investigate the crystalline phases of the samples (Fig. 3a). The patterns feature broad diffraction peaks near 24° and 43°, corresponding to the (002) and (100) crystalline planes of disordered carbon material, indicating partial graphitic stacking structures (JCPDS No. 41-1487).18 The half-width and position of these peaks vary slightly among the samples. The two samples' structural parameters, d002, Lc, and La, were calculated. The d002 value, representing the basal spacing of the carbon layers, is used to characterize the degree of graphitization. Lc and La represent the crystallite sizes. A smaller d002 value indicates a higher degree of graphitization. According to the calculations, SUSCAP-01 has the largest d002 of 0.38 nm and the smallest Lc and La of 0.51 nm and 0.21 nm, respectively. In contrast, SUSCAP-02 has the smallest d002 of 0.33 nm and the highest Lc and La of 1.08 nm and 0.20 nm, respectively. For reference, the d002 value for graphite is 0.33 nm. Many studies on highly graphitizable carbon materials reported d002 values ranging from 0.33 to 0.34 nm, with high Lc and La values. In contrast, less graphitizable carbon materials typically exhibit d002 values ranging from 0.35 to 0.50 nm, with very small Lc and La values. This discrepancy could be attributed to the activator used during high-temperature activation, which permeates and disrupts the microcrystalline structure, inserting vapor into the carbon layers, eroding the raw material, and forming pores. The vapor's destructive effect on the aromatic ring structure within the precursor generates numerous pores in SUSCAP-02, as confirmed by SEM images.19–213.3. Raman spectroscopy
Fig. 3b illustrates the Raman spectra of SUSCAP-1 and SUSCAP-2 samples, and the results reveal that the two samples all exhibit the two peaks at 1339 cm−1 (D-band) and 1595 cm−1 (G-band). The D-band suggests lattice defects, edge imperfections, disorderly alignment, and a low-symmetry graphitic structure within the activated carbon material. Likewise, the G band verifies the existence of C![[double bond, length as m-dash]](https://www.rsc.org/images/entities/char_e001.gif) C (sp2) stretching vibrations.22 Also, the graphitization degree of carbon could be determined through the ratio of D-band to G-band (ID/IG).23 The ID/IG ratios of SUSCAP-1 and SUSCAP-2 samples were found to be 0.85 and 0.89, respectively. So, this phenomenon implies that the graphitization of carbon is increased in the SUSCAP-2 as compared with SUSCAP-1.
C (sp2) stretching vibrations.22 Also, the graphitization degree of carbon could be determined through the ratio of D-band to G-band (ID/IG).23 The ID/IG ratios of SUSCAP-1 and SUSCAP-2 samples were found to be 0.85 and 0.89, respectively. So, this phenomenon implies that the graphitization of carbon is increased in the SUSCAP-2 as compared with SUSCAP-1.
3.4. Fourier-transform infrared spectroscopy (FTIR)
FT-IR analysis is further carried out to demonstrate the surface chemical groups of samples with the wavenumber from 4000 to 800 cm−1 (Fig. 3c). The characteristic peak at 3439 cm−1 is related to a combination of O–H stretching vibration and N–H symmetric stretching vibration.24 The peaks located at 2920 and 1384 cm−1 refer to the C–H stretching vibration and C–H bending vibration. The peak related to the C![[double bond, length as m-dash]](https://www.rsc.org/images/entities/char_e001.gif) O stretching vibration is located at 1628 cm−1. Moreover, two peaks centered at 1112 and 1057 cm−1 could originate from C–O and C–O–C vibrations.25 All the above results demonstrate that the nitrogen and oxygen heteroatoms are favorably doped in the carbon skeleton. Due to the effective polar attraction and formation of hydrogen bonds that originated from the oxygen and nitrogen doping, the wettability and ion diffusion of the carbon samples are highly enhanced.26 The improvement in wettability and ion diffusion will lead to a reduction of the contacting resistance and consequently promote the capacitive performance of the carbon electrode.
O stretching vibration is located at 1628 cm−1. Moreover, two peaks centered at 1112 and 1057 cm−1 could originate from C–O and C–O–C vibrations.25 All the above results demonstrate that the nitrogen and oxygen heteroatoms are favorably doped in the carbon skeleton. Due to the effective polar attraction and formation of hydrogen bonds that originated from the oxygen and nitrogen doping, the wettability and ion diffusion of the carbon samples are highly enhanced.26 The improvement in wettability and ion diffusion will lead to a reduction of the contacting resistance and consequently promote the capacitive performance of the carbon electrode.
3.5. N2 adsorption–desorption isotherm and pore structure analysis
The N2 adsorption–desorption isotherm measurements were conducted to investigate the porous structure and pore size distributions of the active materials, as the electrochemical performance is primarily contingent upon SSA and the pore size of these porous materials.AC materials are well-known for their porous nature, boasting a large SSA. Despite their lower conductivity, typically ranging between 1250–2500 S m−1, they remain suitable for supercapacitors. However, not all of the SSA is beneficial for capacitance, as the larger electrolyte ions are unable to enter the smaller micropores, thus limiting their contribution to the charge-storage process. Fig. 4 shows the nitrogen adsorption and desorption isotherms and pore size distribution curves for SUSCAP-01 and SUSCAP-02 samples. The corresponding pore structure data of the two samples are presented in Table 1. Fig. 4a demonstrates that the samples' nitrogen adsorption and desorption isotherms exhibit a type I profile and H4 hysteresis loops, indicating a progressive increase in the adsorption volume up to a relative pressure of 0.3. This result suggests the presence of pores ranging from small micropores to small mesopores.27
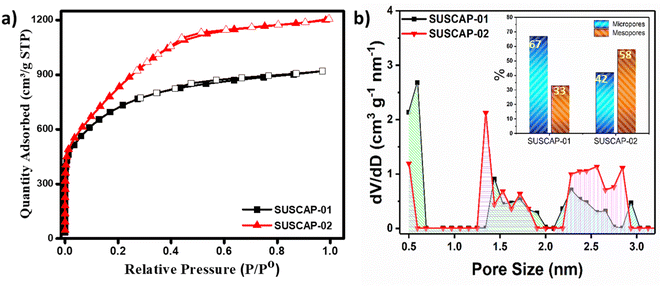 | ||
| Fig. 4 (a) N2 adsorption–desorption isotherm and (b) pore-size distribution curve of the SUSCAP-01 and SUSCAP-02. | ||
| Item | Specific surface area (m2 g−1) | Pore volume (cm3 g−1) | Average pore diameter | ||||
|---|---|---|---|---|---|---|---|
| SBET | Smeso/ macro | Smicro | Vtotal | V(meso/macro) | Vmicro | D (nm) | |
| SUSCAP-01 | 2528.05 | 370 | 2158.05 | 1.4 | 0.3 | 1.1 | 2.2 |
| SUSCAP-02 | 2920.19 | 461 | 2459.19 | 1.85 | 0.25 | 1.6 | 2.5 |
Table 1 compiles the standard characteristics of these samples obtained from N2 isotherms. The specific surface area (SBET) was calculated using the Brunauer–Emmett–Teller (BET) method. The micropore volume (Vmicro) and micropore surface area were obtained by the t-plot method to the adsorption branch of the isotherm. The mesopore volume (Vmeso) and mesopore surface area were calculated by applying the BJH model to the desorption branch of the isotherm. Also, the total pores volume of (VTotal) was evaluated at P/P0 close to 1. Indeed, D (nm) is the average pore diameter. As shown in Table 1, the average pore size and total pore volume for SUSCAP-2 are higher than those for SUSCAP-1. However, Vmeso/macro for SUSCAP-1 is 0.3, which is greater than 0.25 for SUSCAP-2. This indicates that SUSCAP-2 contains some macropores, confirming that SUSCAP-2 has a hierarchical pore structure.6
SUSCAP-01 displayed reduced nitrogen adsorption compared to SUSCAP-02, suggesting that the activation process during preparation enhances nitrogen adsorption by the carbon material. The data provided in Table 1 corroborate that SUSCAP-02 exhibits higher specific surface area and pore volume compared to SUSCAP-01. The reduction in SSA observed in SUSCAP-01 was accompanied by a higher volume of mesopores. This result suggests that extensive etching during the activation process caused the conversion of micropores into mesopores, ultimately leading to structural destabilization and a decline in SSA. It's noteworthy to highlight that the BET surface area of the investigated activated carbon in this study surpasses that of the majority of biomass-derived activated carbons documented in the existing literature.28
Additionally, Fig. 4a illustrates that at low pressure (P/P0 < 0.2), there is a slight increase in nitrogen adsorption across all samples, indicating the presence of micropores. SUSCAP-01 demonstrates a greater increase compared to SUSCAP-02, suggesting that SUSCAP-01 has the lowest micropore content while SUSCAP-02 has the highest. In the medium-low pressure range (0.2 < P/P0 < 0.4), SUSCAP-02 exhibits a more pronounced upward trend than SUSCAP-01, indicating a higher pore volume, consistent with the data in Table 1. Beyond the medium pressure range (0.4 < P/P0 < 0.9), the nitrogen adsorption capacity of the samples changes more gradually, suggesting the presence of mesopores and a broad distribution of mesopore sizes within this range. In the high-pressure range (0.9 < P/P0 < 1), all activated carbon samples show some degree of upward movement in nitrogen adsorption, indicating the presence of large pores. Indeed, the presence of slit-shaped pores in the H4 hysteresis loops observed in the mid-pressure range indicates the existence of mesopores. The study demonstrates that all activated carbon samples possess a hierarchical porous structure.17 This interpretation aligns well with the pore size distribution depicted in Fig. 4b. The pore size distribution profile further proves that SUSCAP-02 has a larger proportion of mesopores. SUSCAP-02 exhibits a broad distribution of pore sizes, particularly within the micropore range (0–2 nm) and smaller mesopores (2–3.5 nm). The high specific surface area and hierarchical porous structure of SUSCAP-02 offer numerous active sites, creating more pathways for ion transport and enhancing its electrochemical properties. During the charge/discharge process, these mesopores can promote the rapid transportation and migration of electrolyte ions to obtain high-rate performance supercapacitor.29
3.6. Electrochemical performance
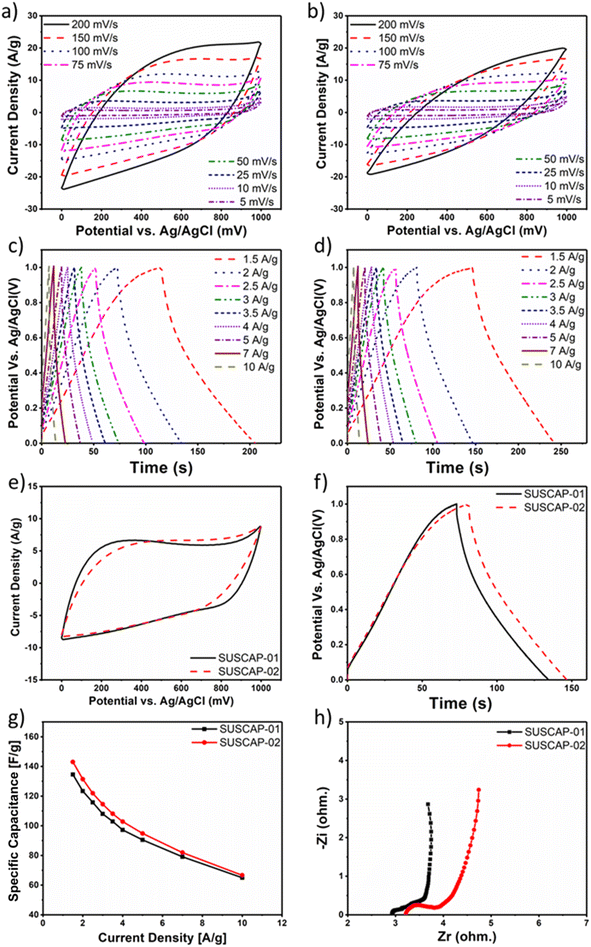
CV, GCD, and EIS analysis were carried out to investigate the charge storage properties of the carbon samples. The potential window is fixed between 0 to 1 V with respect to the Ag/AgCl reference electrode in a three-electrode setup. The CV profiles of the samples at the scan rate ranging from 5 to 200 mV s−1 are given in Fig. 5a and b. The CV curves obtained for both carbons exhibit a symmetric and nearly rectangular shape across the entire potential range of 0 to 1 V, suggesting capacitive behavior without charge transfer kinetic limitations due to low-sized pores. This shape indicates that energy is primarily stored through electric double layers at the interface between the highly mesoporous SUSCAP electrodes and the electrolyte. Even at a high scan rate of 200 mV s−1, the rectangular shape of the CV curves remains, demonstrating excellent rate performance. This performance is attributed to the mesoporous structure, which facilitates easy ion diffusion.30 Due to the similar nature of the carbon samples, the current responses were similar in neutral electrolyte (Fig. 5e). To assess the charge–discharge efficiency, the GCD plots of SUSCAP-1 and SUSCAP-2 samples at the various current rates are given in Fig. 5c and d. The GCD curves of both samples exhibit typical triangular features with high symmetrical behavior without any redox behavior, indicating high coulombic efficiency, which is characteristic of EDLC materials. This result suggests that the fabricated SUSCAP electrodes were able to charge and discharge at a constant rate, even at a high current density of 10 A g−1 over a potential range of 0 to 1 V, without showing any significant IR drop, implying low contact resistance.As shown in Fig. 5f, the SUSCAP-2 sample shows a slightly higher charging and discharging time compared to the SUSCAP-2 samples. This similarity in performance is in line with the CV data of the respective samples, as discussed before.
Fig. 5g presents the specific capacitance of the obtained samples in the neutral electrolyte at different density currents. Under a current density of 1.5 A g−1, the specific capacitance of the samples SUSCAP-1 and SUSCAP-2 reaches 134 and 144 F g−1 in the neutral electrolyte, respectively. The sequentially reduced specific capacitance is mainly due to the decreasing contribution of pseudocapacitance.31
In order to gain insight into the important roles of the engineering hierarchical porous structure on the improved kinetics process, EIS is measured at open circuit voltage in the frequency range of 100 kHz to 10 mHz.
Fig. 5h shows the Nyquist plots of SUSCAP-1 and SUSCAP-2 electrodes. It can be observed that nearly vertical curves appeared at low-frequency region, indicating they are promising candidates for EDLC electrodes.32 The charge transfer resistance (Rct) can be determined from the EIS plot, showing that the SUSCAP-2 electrode exhibited a lower Rct of 0.683 Ω, indicating superior charge transfer kinetics at the electrode/electrolyte interface, as compared to SUSCAP-1 (Rct value of 0.734 Ω). Also, at the high-frequency region, the Rs (equivalent series resistance, ESR) value for SUSCAP-1 and SUSCAP-2 was 2.9 and 3.2 Ω, respectively, suggesting minimal resistance to both electrodes' electrolyte and intrinsic resistance.
It can be obviously found that various resistances of BHPCs are remarkably lower than AC, indicating their excellent conductivity, fast charge transfer and reversible ion adsorption/desorption. The underlying reason can be attributed to the stable 3D interconnected hierarchical porous structures which can facilitate the charge and ion transfer rate.33
The electrolyte is a vital component and primary source of ions in a supercapacitor. In addition, it also defines the operating potential window (OPW) of the supercapacitor device. Here, the practical application of a supercapacitor device in an aqueous (alkaline and neutral) electrolyte is limited by the low OPW, resulting in the low ED and PD of the supercapacitor device. The main difference between the two electrodes was revealed when an organic electrolyte was used. The main difference between the two carbon materials was related to the pore size volume. The difference in the characteristic nature of the pore volume can greatly affect the diffusion mechanism of the electrolyte inside the pores. Similar electrochemical studies were performed using the organic electrolyte to study this effect, where the electrolyte's ionic size can better understand the different behaviors of the materials as the pore volume of the material was altered.
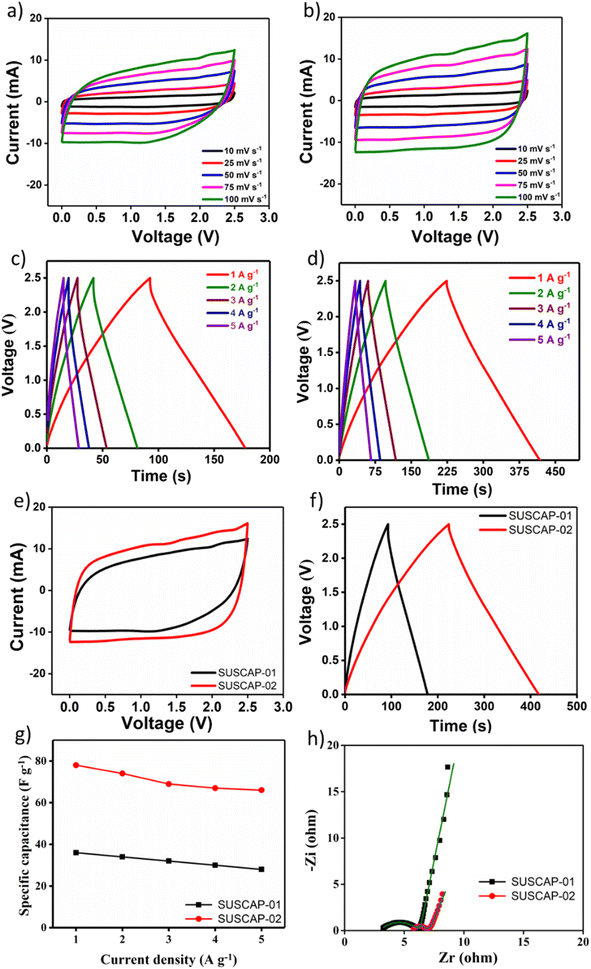
The CV profiles of the samples at the scan rate ranging from 10 to 100 mV s−1 in the region of 0 to 2.5 V are given in Fig. 6a and b. The nearly perfect rectangular-shaped loop was obtained without any redox peaks, further supporting the good capacitive behavior and rate capability of the active carbon materials. It was attributed to the intrinsic rapid ion adsorption/desorption enabled by the electrode.34 As seen in (Fig. 6e), the SUSCAP-2 sample shows slightly higher current responses, which could be due to the improved porous nature of the sample, which, in turn, facilitates the transport of electrolyte ions during the electrochemical processes. The GCD curves of both the samples exhibit typical triangular features, Fig. 6c and d. The SUSCAP-2 sample shows higher charging and discharging time compared to the SUSCAP-1 sample, Fig. 6f.
Fig. 6g presents the specific capacitance of the obtained samples in the organic electrolyte at different density currents. Under a current density of 1 A g−1, the specific capacitance of the samples SUSCAP-1 and SUSCAP-2 reaches 36 and 78 F g−1 in the organic electrolyte, respectively.35 These results highlight the role and importance of electrolytes in enhancing the overall electrochemical performance of the supercapacitor.
The high specific capacitance of SUSCAP-2 compared to SUSCAP-1 is attributed to a highly effective SSA and well-developed and stable pore structure.29 SUSCAP-2 has a larger surface area with a higher mesopores ratio. The presence of both micro- and mesopores can provide ‘ion highways’ for fast and efficient transport. The presence of such a hierarchical pore structure can also fast the ion migration and storage in deep and branched micropores, thereby increasing the effective specific surface area and rate performance of SUSCAP-2. Also, such electrical network channels can provide ionic pathways and hence enhance the conductivity and promote the adsorption and desorption of electrolyte ions.36 As seen in Fig. 7a and b, after 3500 GCD cycles, the SUSCAP-01 and SUSCAP-02 showed 87% (coulombic efficiency of 98.2%) and 92% (coulombic efficiency of 99%) capacitance retention, respectively, in organic liquid electrolytes.
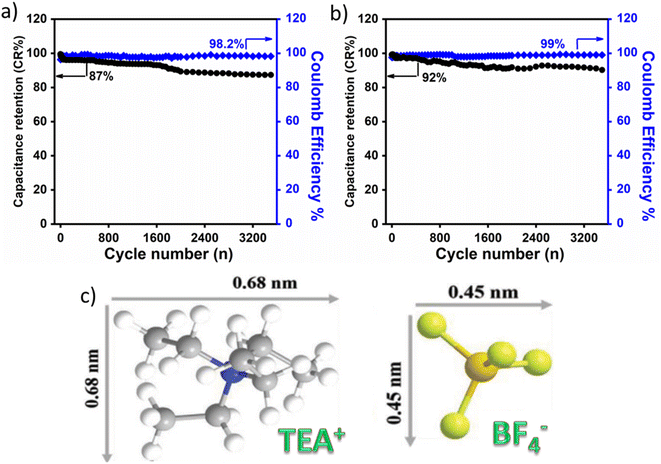 | ||
| Fig. 7 Comparative cycling stability for SUSCAP-01 (a) and SUSCAP-02 (b) in ionic liquid electrolyte, (c) ionic radius of organic electrolyte. | ||
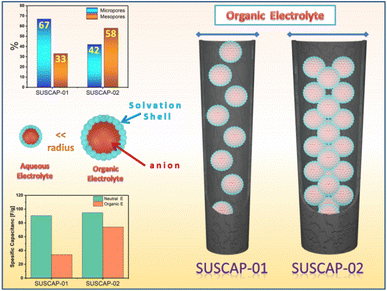
It is worth noticing that this behavior is correlated to the presence of an organic electrolyte. It exhibited lower performance because of its high ionic liquid viscosity and larger ionic radius than Na2SO4 (high ionic conductivity). The ionic radius of the ionic electrolyte is 0.68 nm for cations (TEA+) and 0.45 for anions (BF4−),23,37 Fig. 7c. While in the case of an aqueous electrolyte, the ionic radius will be small enough to immigrate inside the micropores and mesopores.
The two important factors for ascertaining the practical applications of the SC device are mainly specific energy (Es) and specific power (Ps). (Es) and (Ps) of SUSCAP-02//SUSCAP-02 device in the organic electrolyte were identified through the following Equations, respectively.
| Es = CV2/7.2 (W h kg−1) |
| Ps = 3600Es/Δt (W kg−1) |
![[thin space (1/6-em)]](https://www.rsc.org/images/entities/char_2009.gif) 480 W kg−1 at the current density of 2, 3, 4, 5 and 10 A g−1.
480 W kg−1 at the current density of 2, 3, 4, 5 and 10 A g−1.
The comparison between the capacitive performances of various carbon electrodes in non-aqueous electrolytes is summarized in Table 2. It can be noticed that the SUSCAP-02//SUSCAP-02 cell delivered high energy and power even at a high current density of 10 A g−1 compared to most of the reported carbon-based SC electrodes.
| Samples | Electrolyte | Capacitance (F g−1) | Specific energy (W h kg−1) | Ref. |
|---|---|---|---|---|
| Kynol-5092-20 | TEA-BF4 | 118 (0.05 A g−1) | 22 | 38 |
| YP-50F | Li-TFSI | 108 (1 A g−1) | ∼18.2 | 39 |
| LAC800:4 | BMIm-BF4 | 175 (0.5 A g−1) | 24.3 | 40 |
| PS50SiCN900Cl2 | TEA-BF4 | 126 (10 mV s−1) | ∼17.5 | 41 |
| AC monolith | Li-TFSI | 183 (5 mV s−1) | 24 | 42 |
| CsAC | EMI-BF4 | 223 (0.2 A g−1) | 32.5 | 43 |
| SUSCAP-02 | TEA-BF4 | 78 (1 A g−1) | 67 | This work |
| SUSCAP-02 | TEA-BF4 | 74 (2 A g−1) | 64 | This work |
| SUSCAP-02 | TEA-BF4 | 69 (3 A g−1) | 60 | This work |
| SUSCAP-02 | TEA-BF4 | 67 (4 A g−1) | 58 | This work |
| SUSCAP-02 | TEA-BF4 | 66 (5 A g−1) | 57 | This work |
| SUSCAP-02 | TEA-BF4 | 60 (10 A g−1) | 52 | This work |
As shown in Fig. 8, the type and the structure of the pores of each material have a great influence on the electrochemical behavior of the carbon material. As discussed in previous reports,44 The ability of the electrolyte ions, which are surrounded by a solvation shell, to diffuse smoothly inside the pores without hindrance and form EDLC will determine the overall charge storage ability of the material. The variation in charge storage capacity of an assembled device in different electrolytes is probably due to (I) the ionic radius of the ions in the electrolytes and the radius of hydrated ions in the case of aqueous electrolytes, (II) the ionic conductivity, (III) the extent of the ionic mobility, and (IV) stable OPW of the electrolyte.45
Conclusions
Through our research, we have demonstrated the potential of utilizing agroforestry waste, specifically coconut shells, to fabricate activated carbons boasting extensive surface areas and substantial pore volumes enriched with abundant meso and microporous architectures. Using ionic liquid as an electrolyte, AC carbon materials exhibited different energy storage responses by altering their surface properties. High specific surface area, ordered mesoporous structure, and substantial electronic conductivity make carbon materials appealing for electrochemical energy storage applications. Coconut shell AC electrodes demonstrated outstanding specific capacitance (78 F g−1) and retained capacitance within symmetric EDLCs containing organic electrolytes. The AC cell in an organic electrolyte delivered the highest specific energy of 67 W h kg−1 at the current density of 1 A g−1 and the highest specific power of 12![[thin space (1/6-em)]](https://www.rsc.org/images/entities/char_2009.gif) 480 W kg−1 at the current density of 10 A g−1. Given these outcomes, the activated carbon derived from coconut shells emerges as a compelling material, poised to reinforce the evolution of high-performance, economically viable, and environmentally sustainable high-power devices.
480 W kg−1 at the current density of 10 A g−1. Given these outcomes, the activated carbon derived from coconut shells emerges as a compelling material, poised to reinforce the evolution of high-performance, economically viable, and environmentally sustainable high-power devices.
Data availability
The datasets used and/or analyzed during the current study are available from the corresponding author upon reasonable request.Conflicts of interest
There are no conflicts to declare.Acknowledgements
This paper is based upon work supported by the Science, Technology & Innovation Funding Authority (STDF) under grant number (43930). The authors wish to thank ENVIROHEMP, a Spanish company that provides activated carbon samples and works with the Science, Technology & Innovation Funding Authority (STDF) under grant number (43930).References
- R. Aliakbari, E. Kowsari, Y. Marfavi, S. Ramakrishna, A. Chinnappan and Z. A. Cheshmeh, J. Energy Storage, 2021, 44, 103365 CrossRef.
- Supercapacitors Market Size and Share Analysis-Growth Trends & Forecasts, 2024–2029, Source: https://www.mordorintelligence.com/industry-reports/supercapacitors-market.
- S. R. Priyan, G. S. Kumar, K. Lalithambigai, M. Shkir, A. Khan, R. Rajendran and G. Arumugam, J. Alloys Compd., 2024, 976, 173206 CrossRef CAS.
- Y. Wang, L. Zhang, H. Hou, W. Xu, G. Duan, S. He, K. Liu and S. Jiang, J. Mater. Sci., 2021, 56, 173–200 CrossRef CAS.
- B. E. Conway, Electrochemical Supercapacitors: Scientific Fundamentals and Technological Applications, Springer Science & Business Media, 2013 Search PubMed.
- S. Li, H. Zhang, S. Li, J. Wang, Q. Wang and Z. Cheng, Renew. Sustain. Energy Rev., 2024, 202, 114641 CrossRef CAS.
- Y. Wang, W. Lu, X. Xu, F. Pang, X. Feng, X. Zhang, Y. Zeng, Z. Yang, R. Wang and P. Yang, Diam. Relat. Mater., 2022, 130, 109451 CrossRef CAS.
- Q. Wang, J. Yan, Y. Wang, T. Wei, M. Zhang, X. Jing and Z. Fan, Carbon, 2014, 67, 119–127 CrossRef CAS.
- Y. Wang, Y. Zeng, J. Zhu, C. Yang, H. Huang, X. Chen, R. Wang, P. Yan, S. Wei and M. Liu, Colloids Surf., A, 2022, 649, 129356 CrossRef CAS.
- N. P. D. Ngidi, A. F. Koekemoer and S. S. Ndlela, J. Energy Storage, 2024, 89, 111638 CrossRef.
- Z. Bi, Q. Kong, Y. Cao, G. Sun, F. Su, X. Wei, X. Li, A. Ahmad, L. Xie and C. M. Chen, J. Mater. Chem. A, 2019, 7, 16028–16045 RSC.
- D. Mohapatra, O. Muhammad, M. S. Sayed, S. Parida and J.-J. Shim, Electrochim. Acta, 2020, 331, 135363 CrossRef CAS.
- https://envirohemp.com/en/home/.
- P. Yu, Y. Zeng, Y. Zeng, H. Dong, H. Hu, Y. Liu, M. Zheng, Y. Xiao, X. Lu and Y. Liang, Electrochim. Acta, 2019, 327, 134999 CrossRef CAS.
- N. Viar, J. M. Requies, I. Agirre, A. Iriondo, C. García-Sancho and P. L. Arias, Energy, 2022, 255, 124437 CrossRef CAS.
- Y.-K. Ling, J. Li, T. Zhu, J. Wang, Q. Wang, Y. Li and G. Nong, Org. Electron., 2024, 107015 CrossRef CAS.
- F. Zeng, Y. Zhang, Q. Lv, L. Lu and B. Xu, Int. J. Electrochem. Sci., 2024, 100691 CrossRef CAS.
- A. Khan, R. A. Senthil, J. Pan, S. Osman, Y. Sun and X. Shu, Electrochim. Acta, 2020, 335, 135588 CrossRef CAS.
- H. Takagi, K. Maruyama, N. Yoshizawa, Y. Yamada and Y. Sato, Fuel, 2004, 83, 2427–2433 CrossRef CAS.
- M. M. Madirisha, O. R. Dada and B. D. Ikotun, Chemical fundamentals of geopolymers in sustainable construction, Mater. Today Sustain., 2024, 27, 100842 CrossRef.
- S.-M. Lee, S.-H. Lee and J.-S. Roh, Crystals, 2021, 11, 153 CrossRef CAS.
- D. Mohapatra, G. Dhakal, M. S. Sayed, B. Subramanya, J. J. Shim and S. Parida, ACS Appl. Mater. Interfaces, 2019, 11, 8040–8050 CrossRef CAS PubMed.
- G. Dhakal, D. R. Kumar, S. Sahoo and J. J. Shim, Carbon, 2023, 208, 277–289 CrossRef CAS.
- L. Zheng, B. Tang, X. Dai, T. Xing, Y. Ouyang, Y. Wang, B. Chang, H. Shu and X. Wang, Chem. Eng. J., 2020, 399, 125671 CrossRef CAS.
- M. Yu, Y. Han, Y. Li, J. Li and L. Wang, Carbohydr. Polym., 2018, 199, 555–562 CrossRef CAS PubMed.
- H. Xu, L. Wang, Y. Zhang, Y. Chen and S. Gao, Nanoscale, 2021, 13, 10051–10060 RSC.
- S. Yang, X. Mao, Z. Cao, Y. Yin, Z. Wang, M. Shi and H. Dong, Appl. Surf. Sci., 2018, 427, 626–634 CrossRef CAS.
- J. Tu, Z. Qiao, Y. Wang, G. Li, X. Zhang, G. Li and D. Ruan, J. Energy Storage, 2023, 73, 109268 CrossRef.
- M. Xu, A. Wang, Y. Xiang and J. Niu, J. Clean. Prod., 2021, 315, 128110 CrossRef CAS.
- S. G. Mohamed, I. Hussain and J. J. Shim, Nanoscale, 2018, 10, 6620–6628 RSC.
- Z. Liu, J. Hu, F. Shen, D. Tian, M. Huang, J. He, J. Zou, L. Zhao and Y. Zeng, J. Power Sources, 2021, 497, 229880 CrossRef CAS.
- Y. Gao, G. Yang, Y. Dai, X. Li, J. Gao, N. Li, P. Qiu and L. Ge, ACS Appl. Mater. Interfaces, 2020, 12, 17364–17375 CrossRef CAS PubMed.
- J. Li, R. Xiao, M. Li, H. Zhang, S. Wu and C. Xia, Fuel Process. Technol., 2019, 192, 239–249 CrossRef CAS.
- D. Potphode, M. S. Sayed, T. Lama Tamang and J. J. Shim, Chem. Eng. J., 2019, 378, 122129 CrossRef CAS.
- S. H. Park, Y. H. Cho, M. Choi, H. Choi, J. S. Kang, J. H. Um, J. W. Choi, H. Choe and Y. E. Sung, Surf. Coat. Technol., 2014, 259, 560–569 CrossRef CAS.
- L. Xie, F. Su, L. Xie, X. Guo, Z. Wang, Q. Kong, G. Sun, A. Ahmad, X. Li, Z. Yi and C. Chen, Mater. Chem. Front., 2020, 4, 2610–2634 RSC.
- L. Sun, K. Zhuo, Y. Chen, Q. Du, S. Zhang and J. Wang, Adv. Funct. Mater., 2022, 32, 1–20 Search PubMed.
- B. Krüner, A. Schreiber, A. Tolosa, A. Quade, F. Badaczewski, T. Pfaff, B. M. Smarsly and V. Presser, Carbon, 2018, 132, 220–231 CrossRef.
- Q. Dou, S. Lei, D.-W. Wang, Q. Zhang, D. Xiao, H. Guo, A. Wang, H. Yang, Y. Li and S. Shi, Energy Environ. Sci., 2018, 11, 3212–3219 RSC.
- W. Sangchoom, D. A. Walsh and R. Mokaya, J. Mater. Chem. A, 2018, 6, 18701–18711 RSC.
- J.-K. Ewert, D. Weingarth, C. Denner, M. Friedrich, M. Zeiger, A. Schreiber, N. Jäckel, V. Presser and R. Kempe, J. Mater. Chem. A, 2015, 3, 18906–18912 RSC.
- G. Hasegawa, K. Kanamori, T. Kiyomura, H. Kurata, T. Abe and K. Nakanishi, Chem. Mater., 2016, 28, 3944–3950 CrossRef CAS.
- J. Zhou, Z. Li, W. Xing, H. Shen, X. Bi, T. Zhu, Z. Qiu and S. Zhuo, Adv. Funct. Mater., 2016, 26, 7955–7964 CrossRef CAS.
- J. Chmiola, G. Yushin, Y. Gogotsi, C. Portet, P. Simon and P. L. Taberna, Science, 2006, 313, 1760–1763 CrossRef CAS PubMed.
- G. Dhakal, D. Mohapatra, Y. Il Kim, J. Lee, W. K. Kim and J. J. Shim, Renewable Energy, 2022, 189, 587–600 CrossRef CAS.
Footnote |
| † These authors contributed equally to this work. |
| This journal is © The Royal Society of Chemistry 2024 |

