 Open Access Article
Recovery of uranium using epoxy-modified phosphorus pentasulfide as an efficient adsorbent for uranium extraction from aquatic environments
Magd M. Badr a,
W. M. Youssef*b,
Entesar M. Elgammal
 *b,
A. E. M. Hussienb and
M. H. Taha
 b
b
aPolymer Laboratory, Petrochemical Department, Egyptian Petroleum Research Institute, Nasr City, Cairo, 11727, Egypt. E-mail: themagd@yahoo.com; mmb@epri.sci.eg; Tel: +20 1002372636
bNuclear Materials Authority, P.O. Box 530 Maadi, Cairo, Egypt. E-mail: entesarelgammal502@gmail.com; m.walid_nma@yahoo.com
First published on 29th October 2024
Abstract
Epoxy-modified phosphorus pentasulfide (EPMPS) formulation was developed for the supported recovery of uranium from aquatic environments. The selected components of the prepared formulation were tailored to produce a rigid foamed polymeric material that was rich in phosphorus, nitrogen, sulfur and oxygen atoms, thus increasing chelating bonding possibilities with uranium. FT-IR and SEM were applied to physically characterize the resulting sorbent. At an equilibrium time of 30 min, the phase ratio S/L of 1 g L−1, pH 3 and initial uranium concentration of 50 mg L−1 yielded an adsorption efficiency for uranium of 90%. An 85% elution of uranium from loaded EPMPS was achieved with 1 h shaking and a phase ratio (S/A) of 0.5 g/25 mL of 0.1 M CH3COONa. Sorption isotherm designs were exploited to analyze the findings from the experiments. Uranium had an adsorption capability of about 78.7 mg g−1. According to the results of uranium adsorption, when applied to an actual sample, EPMPS is a suitable substrate for uranium adsorption from nitrate media.
1. Introduction
Uranium is a heavy metal that is both chemically poisonous and radioactive. Since the leakage of radionuclides from Japan's Fukushima Daiichi nuclear power plant, uranium contamination has received considerable attention. Large amounts of uranium enter the environment through natural sources, and uranium mill tailings.1,2 The WHO has defined a maximum contaminant value of 9 μg L−1 for U, whereas the US EPA has suggested the highest limit of 30 μg L−1 for U(VI) in drinking water.3 Consequently, eliminating U from waste has become a serious and critical issue for the protection of the environment and human health.During the last decade, research was focused on the production of polymeric materials, including certain electron donor groups. These electron donor groups, which contain phosphorous, sulfur, nitrogen, and/or oxygen, are distinguished by an increase in free electron pairs and negative charges on a material's surface and bulk. The presence of these functional groups and electron resonance can endow the created materials with certain novel features. The resulting materials will be beneficial in a variety of applications, such as metal extraction, catalysts, flame retardants, sensors, supercapacitors, superconductors, semiconductors, batteries, and metal uptake.4–19
Various techniques have been implemented to remove uranium from liquid and radioactive solutions. The most often used procedures include chemical precipitation, ion exchange, liquid membrane, solvent extraction, and adsorption.20,21 Adsorption has piqued the interest of researchers in recent decades owing to its efficacy and low cost in removing uranium and for allowing the recovery and reuse of metal ions from liquid solutions. Several materials have been investigated as adsorbents, including activated carbon,22 zeolite, resin, olivine rock, coir pith, smectites, and kaolinite.23–27
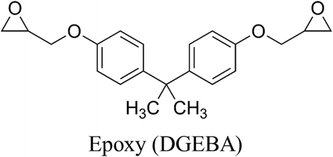
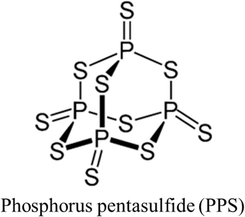
In the present work, systems comprising epoxy (diglycidyl ether of bisphenol A-DGEBA) with phosphorus pentasulfide (PPS) and polyamines were developed, and their potential use in the sorption of uranium from aqueous solutions was investigated based on two factors: their chemical activity and porosity. Based on the chemical activity the surface of these blends contains free electrons forming partially negative charged polar functional groups of, phosphorus, sulfur, nitrogen, and oxygen.
In our research, we created a novel epoxy formulation comprising phosphorus, sulfur, nitrogen, and oxygen, with the aim of recovering uranium from nuclear industrial effluent through reacting the epoxy (diglycidyl ether of bisphenol A-DGEBA) with phosphorus pentasulfide (PPS) and polyamine. It was anticipated that the created formulation's higher phosphorus, nitrogen, sulfur, and oxygen contents would boost the possibility of reaction with the targeted heavy metal, in this study's case, uranium.
2. Experimental
2.1. Materials
The epoxy was purchased from CMB Chemicals for Modern Building Company, Egypt under the trade name KEMAPOXY150 as an industrial two-pot epoxy, with vessel A containing the epoxy base, and vessel B the polyamine hardener.
Phosphorus pentasulfide (PPS) and acetone were provided by Adwic – El Nasr Pharmaceutical Co., Egypt. All the ingredients were used without any further purification.
2.2. Epoxy-modified phosphorus pentasulfide (EPMPS) sample preparation and film formation
First, 10 mL of epoxy base (pot A) was dissolved in 10 mL of acetone (solvent), and the resulting mixture was agitated for 10 min at room temperature in a two-necked round-bottomed flask with a magnetic stirrer and reflux condenser. Next, 10 mL of ethylene glycol (EG) was used to dissolve 5 g of PPS, which was then added dropwise to the main solution and agitated for an additional 30 min at room temperature. To the main solution, 10 mL of polyamine hardener (pot B) was added while continuously shaking for 3 min at room temperature. The solution was then sonicated for 3 min. The prepared material was then baked for 12 h at 80 °C to cure it. Before utilizing or performing any measurements, the material was left to stand at room temperature for 24 h (Fig. 1).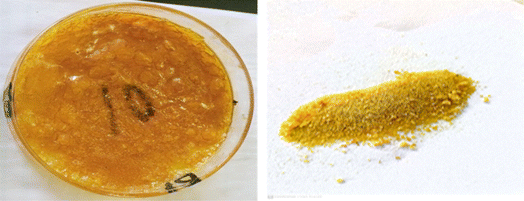 | ||
| Fig. 1 Photographs of the cured created polymeric material of epoxy-modified phosphorus pentasulfide (EPMPS) formulation, and the material after grinding. | ||
2.3. Material characterization
The structural properties of the EPMPS were investigated using Fourier transform infrared spectrometry (FT-IR), scanning electron microscopy (SEM), and EDX. A Thermo-Scientific Nicolet IS10 instrument model (Germany) was used for the FT-IR analysis. The SEM equipment utilized was a Philips XL 30 ESEM (25–30 keV accelerating voltage, 1–2 mm beam diameter, and 60–120 s counting time), which was also linked to an EDX unit. The minimum detectable weight concentration ranged from 0.1–1 wt%, and the instrument realized a precision of less than 1%.2.4. Preparation of the metal solutions
All the reagents utilized were of analytical grade. The uranium stock solution contained 1000 mg L−1 uranium. The Arsenazo III complex technique was used to assay the uranium in its various working aqueous phases.28 A Lambada UV/vis spectrophotometer (PerkinElmer, USA) was used to evaluate the absorbance of the produced uranium Arsenazo III complex at 650 nm in comparison with appropriate standard solutions.2.5. Batch experiments for the adsorption and elution studies
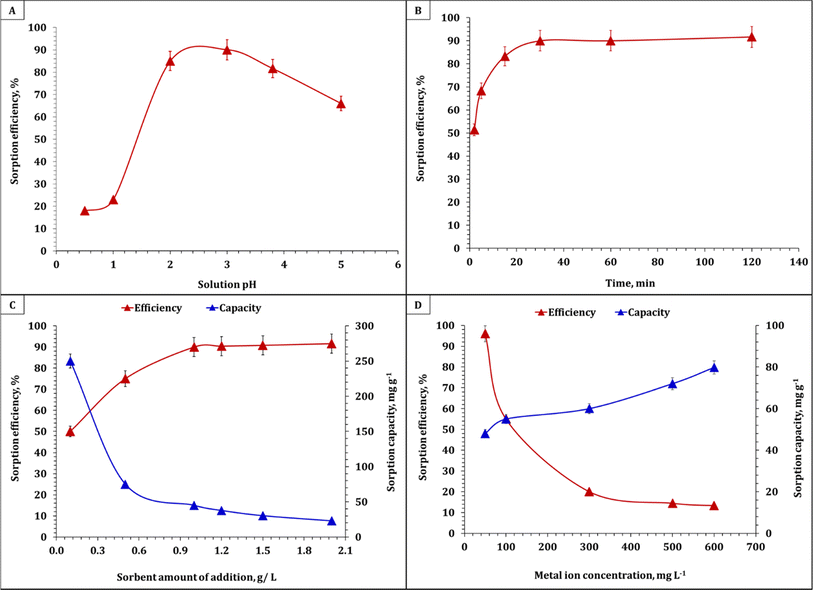
The adsorption process was controlled by a number of variables that were investigated. The solution pH, contact time, initial uranium concentration, and solid/liquid ratio were among these variables. In a typical experiment for the adsorption studies, 0.1 g of EPMPS was shaken with 100 mL uranium solution (50–600 mg L−1) in a pH range of 0.5–5. The effect of Co ions was investigated. The flasks were sealed and set on a mechanical shaker at various temperatures (ranging from 25 °C to 50 °C). All the experiments were carried out triplicate, and mean values of 4% relative errors were used. The filtrate's uranium content was examined. The amount of adsorbed uranium (qe) was estimated via eqn (1) by dividing the difference between the initial and residual amounts of uranium in solution by the mass of the adsorbent. The system's removal or adsorption efficiency (Re), calculated using eqn (2), was expressed as the UO22+ removal percentage in relation to the initial concentration. For uranium elution from the loaded EPMPS, a number of eluting agents were tested, namely HCl, H2SO4, Na2CO3, HNO3, and NaCl.
 | (1) |
 | (2) |
Table 1 shows that the effectiveness of the various types of prepared epoxy against uranium varied significantly. It was discovered that the epoxy modified by phosphorus pentasulfide was the best for uranium sorption because of the unique phosphorus-, sulfur-, nitrogen-, and oxygen-containing epoxy formulation created by reacting epoxy with phosphorus pentasulfide (PPS).
| Type | pH | Time (min) | S/L ratio (g L−1) | Temp. | qe (mg g−1) |
|---|---|---|---|---|---|
| Epoxy only (not modified) | 3 | 30 | 1.0 | Room temperature | 26 |
| EPMPS | 3 | 30 | 1.0 | Room temperature | 78.7 |
2.6. Liquid waste properties
The liquid waste solution was supplied from uranium ore processing in Anshas, Egypt. The main chemical composition comprised UO22+, Fe3+, and Ca2+ at concentrations of 80 mg L−1, 1.6 g L−1, and 1 g L−1, respectively.3. Results and discussion
3.1. Characterization
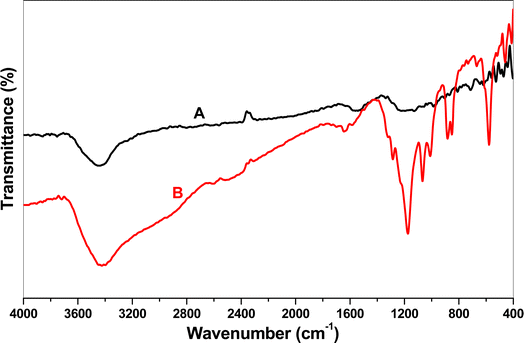
![[double bond, length as m-dash]](https://www.rsc.org/images/entities/char_e001.gif) C and C–C bonds were indicated by the peaks at 1608 and 1509 cm−1, while stretching of the C–O–C bonds corresponding to the ether linkage was shown at 1000–1100 cm−1. The oxirane group's C–O distortion was the reason for the peak's absence at 915 cm−1, which indicated that all of the epoxy rings were consumed through the reactions during the treatment process. Within the range of 2900–3700 cm−1, the bands of amine groups and hydroxyl groups' hydrogen bonds overlapped each other. In the primary amines, N–H deformation was observed at 1650–1500 cm−1; while in the secondary amines, this was shifted toward lower wavenumbers (1580–1490 cm−1) and was typically weak. Strongly coupled to the C–N band, C
C and C–C bonds were indicated by the peaks at 1608 and 1509 cm−1, while stretching of the C–O–C bonds corresponding to the ether linkage was shown at 1000–1100 cm−1. The oxirane group's C–O distortion was the reason for the peak's absence at 915 cm−1, which indicated that all of the epoxy rings were consumed through the reactions during the treatment process. Within the range of 2900–3700 cm−1, the bands of amine groups and hydroxyl groups' hydrogen bonds overlapped each other. In the primary amines, N–H deformation was observed at 1650–1500 cm−1; while in the secondary amines, this was shifted toward lower wavenumbers (1580–1490 cm−1) and was typically weak. Strongly coupled to the C–N band, C![[double bond, length as m-dash]](https://www.rsc.org/images/entities/char_e001.gif) S stretching yielded a band at 1230–1030 cm−1. The P
S stretching yielded a band at 1230–1030 cm−1. The P![[double bond, length as m-dash]](https://www.rsc.org/images/entities/char_e001.gif) S's stretching vibration band displayed a medium intensity and was located at 758.88 cm−1. There was also a variable intensity band at 552.53 cm−1, which may have been caused by the stretching vibration of the P–S bond, which may have been shifted to a higher frequency due to the nearby highly electronegative groups and atoms. The asymmetric stretching vibrations of the aliphatic methoxy P–O–C group were observed by very strong broad bands of pentavalent and trivalent methoxy compounds at 1063.56 and 1026.95 cm−1, respectively, as well as a characteristic symmetric methyl deformation band at 1363.48 cm−1.
S's stretching vibration band displayed a medium intensity and was located at 758.88 cm−1. There was also a variable intensity band at 552.53 cm−1, which may have been caused by the stretching vibration of the P–S bond, which may have been shifted to a higher frequency due to the nearby highly electronegative groups and atoms. The asymmetric stretching vibrations of the aliphatic methoxy P–O–C group were observed by very strong broad bands of pentavalent and trivalent methoxy compounds at 1063.56 and 1026.95 cm−1, respectively, as well as a characteristic symmetric methyl deformation band at 1363.48 cm−1.
At 945.95 cm−1, pentavalent ethoxy compounds showed a further strong band. Compounds containing methoxy and ethoxy had a prominent band at 827.35 cm−1, which was most likely caused by the P–O–C group stretching symmetrically. The P–O–C methoxy group was responsible for a sharp band at 1182.20 cm−1. The band observed at 995–855 cm−1 resulted from the P–O–C asymmetric stretching vibration for aromatic compounds, specifically P–O–phenyl, which was coupled with a strong band at 945.95 cm−1. In the vicinity of 758.88 cm−1, the P–C bond's stretching vibration produced a medium-to-strong band. A medium-to-strong intensity band was also present in the phenyl–P bond because of an aromatic ring vibration at 1457.09 cm−1. The P![[double bond, length as m-dash]](https://www.rsc.org/images/entities/char_e001.gif) O group's stretching vibration strong band lay between 1350 and 1150 cm−1. It is possible that all of the phosphorus atoms were occupied with other types of bonding, which is why there was no sharp band for P–H group stretching vibration observed in the region of 2265–2285 cm−1 and no weak-to-medium intensity broad bands of the P–O–H group for its O–H stretching vibration at 2100–2300 cm−1 or its hydrogen bonding at 2560–2700 cm−1.29–33
O group's stretching vibration strong band lay between 1350 and 1150 cm−1. It is possible that all of the phosphorus atoms were occupied with other types of bonding, which is why there was no sharp band for P–H group stretching vibration observed in the region of 2265–2285 cm−1 and no weak-to-medium intensity broad bands of the P–O–H group for its O–H stretching vibration at 2100–2300 cm−1 or its hydrogen bonding at 2560–2700 cm−1.29–33
The FT-IR spectra of EPMPS both before and after uranium adsorption are shown in Fig. 2. Fig. 2A provides for a qualitative assessment of the functional groups linked to the EPMPS modified phosphorus pentasulfide through using the FT-IR spectra. Fig. 2B unequivocally demonstrates the presence of multiple peaks in both scenarios, including a peak at approximately 3600 cm−1 that was linked to O–H stretching. Alkene C![[double bond, length as m-dash]](https://www.rsc.org/images/entities/char_e001.gif) C bending bands were observed at 977 and 888 cm−1, while bending N–H bands were found at 3398 and 1380 cm−1 and further connected to vinyl group C–N stretching bands at 1117 cm−1. In the modified material, the C–H bad was stretched at 704–616 cm−1 and at 1200 cm−1 related to uranium adsorption.
C bending bands were observed at 977 and 888 cm−1, while bending N–H bands were found at 3398 and 1380 cm−1 and further connected to vinyl group C–N stretching bands at 1117 cm−1. In the modified material, the C–H bad was stretched at 704–616 cm−1 and at 1200 cm−1 related to uranium adsorption.
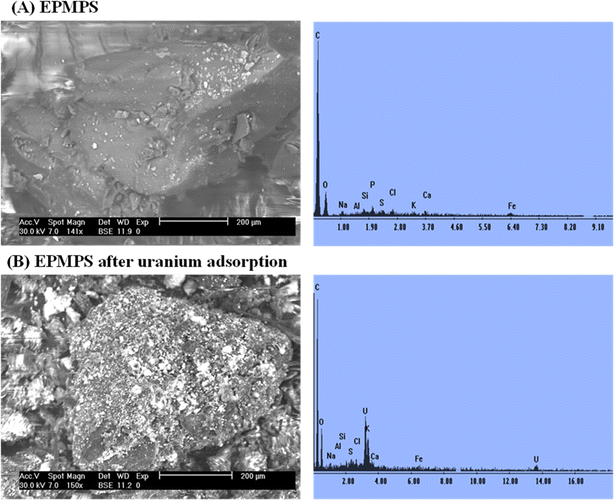
The other elements detected by EDX could be attributed to the presence of impurities in the commercial material or the high activity of the functional groups of the reactants, whereby the synthesized EPMPS reacted with materials on the surface of the glassy container during the reaction process, which may have caused other elements to emerge in the EDX plots.
3.2. Parameters influencing the adsorption procedures
3.3. Kinetic modeling
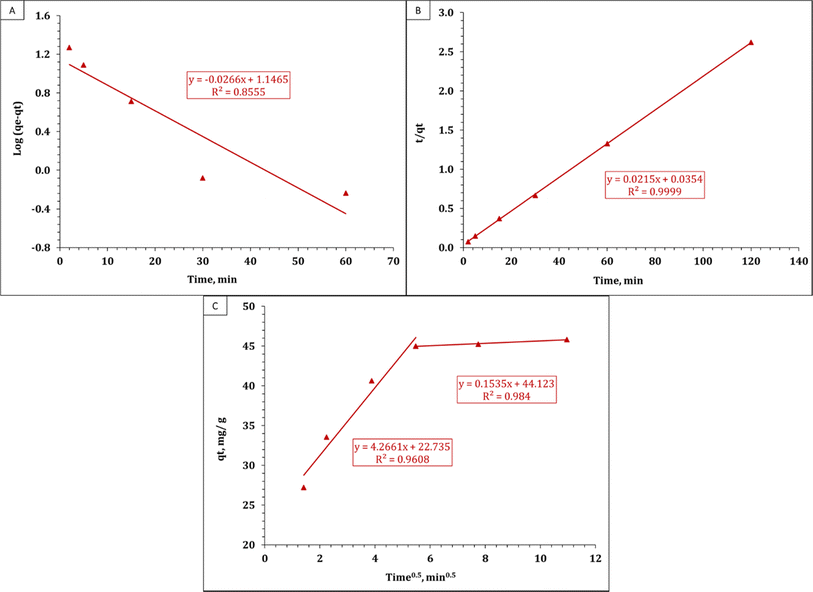
The current study used three equations from various adsorption kinetic models, as listed in Table 2.36| Adsorption kinetic models | Equations |
|---|---|
| Lagergren pseudo-first-order (LPF) model | log(qe − qt) = log![[thin space (1/6-em)]](https://www.rsc.org/images/entities/char_2009.gif) qe − (K1/2.303)t (3) qe − (K1/2.303)t (3) |
| Pseudo-second-order (PS) model | t/qt = 1/K2qe2 + (1/qe)t (4) |
| Weber and Morris (W&M) model | qt = Kidt0.5 + C (5) |
The previously described kinetic models for uranium adsorption on EPMPS are presented in Fig. 5A–C and Table 3 lists their kinetic parameters.
| Lagergren pseudo-first-order model | k1 (min−1) | 0.061 |
| qe,cal (mg g−1) | 14.0 | |
| qe,exp (mg g−1) | 45.8 | |
| R2 | 0.85 | |
| Pseudo-second-order model | k2 (min−1) | 0.013 |
| qe,cal (mg g−1) | 46.5 | |
| qe,exp (mg g−1) | 45.8 | |
| h (mol g−1 h−1) | 28.25 | |
| t1/2 (h) | 1.6 | |
| R2 | 0.99 | |
| Weber and Morris model | Stage I | |
| ki (mg g−1 min−1/2) | 4.27 | |
| C | 22.7 | |
| R2 | 0.96 | |
| Stage II | ||
| ki (mg g−1 min−1/2) | 0.15 | |
| C | 44.1 | |
| R2 | 0.98 | |
The PS kinetic model, which had higher R2 coefficients than the LPF model, was found to be the most precise in matching the experimental results. Additionally, Table 3 illustrates how well the measured adsorption capacity and the theoretical adsorption capacity of the composite at equilibrium matched. These results suggest that the technique of sorption is dependent on the quantity of ions and follows the PS kinetic model.37 Additionally, it was shown that the rate-controlling step involved electron transfer between the UO22+ ions and the material's functional groups during chemical sorption.38 These results highlight the usefulness of the PS kinetic model in assessing the adsorption operation and shed light on the mechanisms governing uranium pickup by the adsorbent.
3.4. Adsorption isotherms
A number of frequently used adsorption isotherm models were considered in order to match the reported isotherm models under the equilibrium adsorption of EPMPS. These models included the Freundlich, Langmuir, and Temkin isotherms, whose equations39–41 are shown in Table 4.| Adsorption isotherms | Equations |
|---|---|
| Freundlich isotherm | qe = KfCe1/n (6) |
log![[thin space (1/6-em)]](https://www.rsc.org/images/entities/char_2009.gif) qe = log qe = log![[thin space (1/6-em)]](https://www.rsc.org/images/entities/char_2009.gif) Kf + (1/n) log Kf + (1/n) log![[thin space (1/6-em)]](https://www.rsc.org/images/entities/char_2009.gif) Ce (7) Ce (7) |
|
| Langmuir isotherm | Ce/qe = 1/bQo + Ce/Qo (8) |
| RL = 1/(1 + bCo) (9) | |
| Temkin isotherm | Qe = B![[thin space (1/6-em)]](https://www.rsc.org/images/entities/char_2009.gif) ln ln![[thin space (1/6-em)]](https://www.rsc.org/images/entities/char_2009.gif) AT + B AT + B![[thin space (1/6-em)]](https://www.rsc.org/images/entities/char_2009.gif) ln ln![[thin space (1/6-em)]](https://www.rsc.org/images/entities/char_2009.gif) Ce (10) Ce (10) |
A straight line with an intercept of (log![[thin space (1/6-em)]](https://www.rsc.org/images/entities/char_2009.gif) KF) and a slope of (1/n) could be seen in Fig. 6A. The Freundlich, Langmuir, and Temkin isotherms are displayed in Table 5. The straight line with a slope of (1/Qo) and an intercept of 1/bQo is shown in Fig. 6B. Using the Langmuir parameters given in Table 4, one may use the dimensionless separation factor RL in eqn (9) listed in Table 4 to predict the affinity between the sorbate and sorbent. The results from the Timken model are illustrated in Fig. 6D. The RL value, which can be either irreversible (RL = 0), favorable (0 < RL < 1), or unfavorable (RL > 1), determines the type of isotherm. According to Fig. 6C, the dimensionless separation factor values for uranium(VI) adsorption onto EPMPS reveal that greater initial uranium(VI) concentrations were preferred over lower concentrations for uranium(VI) adsorption. Table 5 illustrates the data after applying the equations for the isotherms, namely the Freundlich, Langmuir, and Timken parameters for uranium adsorption onto EPMPS.
KF) and a slope of (1/n) could be seen in Fig. 6A. The Freundlich, Langmuir, and Temkin isotherms are displayed in Table 5. The straight line with a slope of (1/Qo) and an intercept of 1/bQo is shown in Fig. 6B. Using the Langmuir parameters given in Table 4, one may use the dimensionless separation factor RL in eqn (9) listed in Table 4 to predict the affinity between the sorbate and sorbent. The results from the Timken model are illustrated in Fig. 6D. The RL value, which can be either irreversible (RL = 0), favorable (0 < RL < 1), or unfavorable (RL > 1), determines the type of isotherm. According to Fig. 6C, the dimensionless separation factor values for uranium(VI) adsorption onto EPMPS reveal that greater initial uranium(VI) concentrations were preferred over lower concentrations for uranium(VI) adsorption. Table 5 illustrates the data after applying the equations for the isotherms, namely the Freundlich, Langmuir, and Timken parameters for uranium adsorption onto EPMPS.
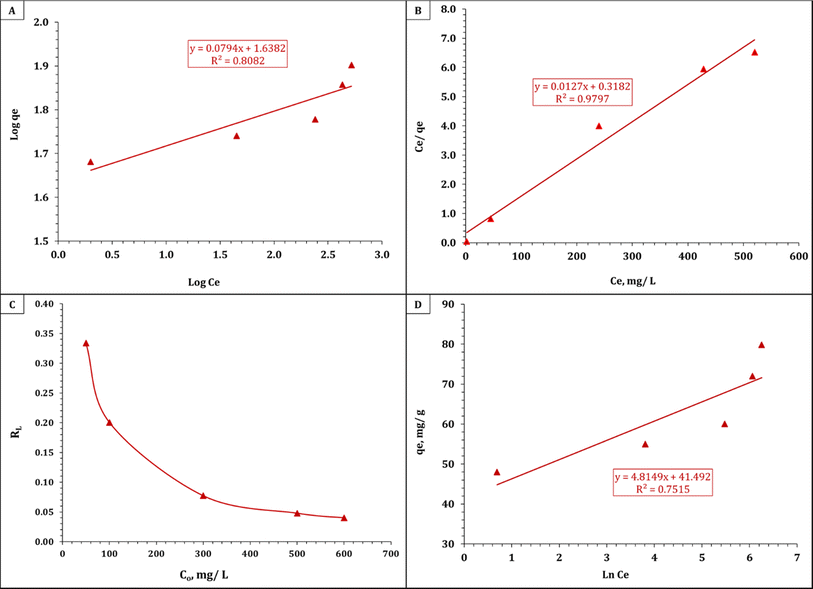 | ||
| Fig. 6 (A) Freundlich isotherm plot, (B) Langmuir isotherm plot, (C) separation factor RL, and (D) Temkin isotherm plot for the adsorption of uranium on EPMPS. | ||
| Freundlich isotherm model | n | 12.59 |
| Kf (mg g−1) | 43.47 | |
| R2 | 0.80 | |
| Langmuir isotherm model | Qm (mg g−1) | 78.74 |
| b (L mg−1) | 0.040 | |
| R2 | 0.98 | |
| Temkin isotherm | b (J mol−1) | 514.56 |
| B | 4.8 | |
| KT (L g−1) | 5527.1 | |
| R2 | 0.75 |
The results of the experiments demonstrated that uranium adsorption on EPMPS more closely matched the Langmuir isotherm than the Freundlich and Temkin isotherms.
Table 6 provides a comparison of the EPMPS adsorption capability with different sorbents.
3.5. Impact of temperature
The influence of temperature on the uranium removal efficiency was studied at temperatures ranging from 25 °C to 50 °C for 30 min and 0.1 g EPMPS/100 mL solution. Fig. 7A depicts the resulting removal efficiencies, which reveal that temperature did not play a critical role in the removal of uranium. After reaching room temperature, the efficiency of uranium removal did not continue to increase; rather, it decreased as the temperature rose. The diminishing effect of the surface activity, which would result in a thinner boundary layer at higher temperatures due to U(VI)'s increased tendency to escape into the solution, may be the cause of the decrease in uranium absorption capacity with the increase in temperature.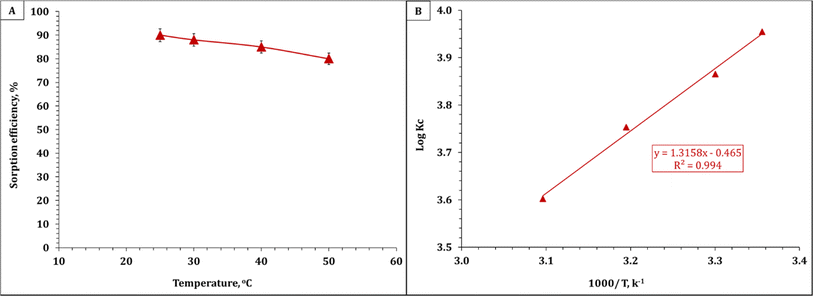 | ||
| Fig. 7 (A) Effect of temperature on the percentage removal of uranium with EPMPS at pH 3 in 30 min. (B) Van't Hoff equation plot for uranium sorption. | ||
3.6. Adsorption thermodynamics
The thermodynamic properties of the adsorption procedure were ascertained through experiments conducted at different temperatures. The mathematical equations shown in Table 7 were used to calculate the system's thermodynamic features and Gibbs free energy (ΔG°).46,47 Fig. 7B shows both the enthalpy (ΔH°) and entropy (ΔS°) values derived from the log![[thin space (1/6-em)]](https://www.rsc.org/images/entities/char_2009.gif) KC vs. 1/T plots using a curve-fitting tool. Also Table 8 provides the thermodynamic parameter values for uranium ion sorption onto EPMPS.
KC vs. 1/T plots using a curve-fitting tool. Also Table 8 provides the thermodynamic parameter values for uranium ion sorption onto EPMPS.
| ΔG (kJ mol−1) | ΔH (kJ mol−1) | ΔS (J mol−1 K−1) | |||
|---|---|---|---|---|---|
| 25 °C | 30 °C | 40 °C | 50 °C | ||
| −22.56 | −22.42 | −22.49 | −22.28 | −25.19 | −8.83 |
The results show that ΔH° possessed negative values and that uranium sorption onto EPMPS was is exothermic. Moreover, ΔG° exhibited negative values across the range of sorption temperatures, suggesting that the sorption process appeared to be feasible as well as spontaneous. A negative value of ΔS° indicates a reduction in the disorder of the solid–aqueous interface.48,49
3.7. Effect of opposite ions
The influence of other metal ions, such as cadmium, copper, thorium, calcium, and iron, which may be present simultaneously with uranium ions in the aqueous solution, was investigated by adding different cations at a concentration 100 ppm, individually to the solution containing uranium under the optimal conditions. As opposing ions were introduced, the percentage of uranium uptake on EPMPS decreased, as shown in Fig. 8. Consequently, we were able to identify the alterations and deleterious consequences that impact uranium's absorption in comparison to competing ions.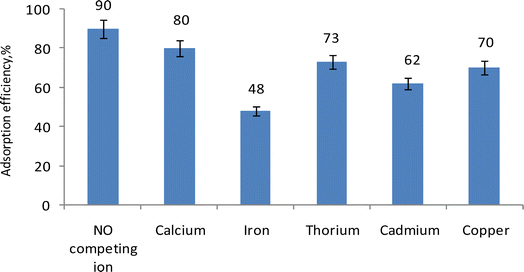 | ||
| Fig. 8 Effect of some competing ions on the efficiency of the adsorbed uranium, showing adsorption efficiency (%) from its solution by EPMPS at pH 3 in 30 min. | ||
3.8. Metal desorption
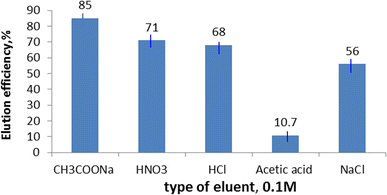
We examined metal elution from different solutions of the loaded EPMPS, namely CH3COONa, HNO3, HCl, acetic acid, and NaCl. The loaded EPMPS polymeric material (0.5 g) was shaken with the eluent parts (25 mL) in order to conduct the elution studies. The amount of eluted metal was calculated following analysis of the metal in the collected samples. Fig. 9 provides a summary of the findings, and it is evident that the CH3COONa50 elution solution was the most effective eluent for obtaining uranium loaded on the EPMPS.3.9. Adsorption mechanism of uranium on the prepared adsorbent
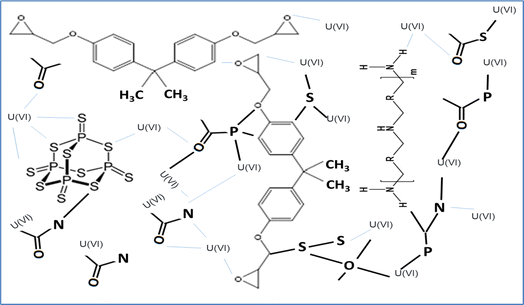
In the current study, uranium sorption from aqueous solution was investigated utilizing EPMPS. Understanding the sorption mechanism was necessary to comprehend the sorption process and to create an efficient flow sheet for uranium recovery from aqueous solution using EPMPS, as a viable substitute for the traditional liquid–liquid technique. To the best of our knowledge, there has not yet been any research done on the mechanism of uranium sorption from aqueous solution using EPMPS. The physicochemical traits of EPMPS's functional groups are mostly responsible for its solid liquid properties. Fig. 10 presents a proposed adsorption mechanism (through chemical interactions and the porosity of the material) of uranium onto EPMPS. Phosphorus, sulfur, nitrogen, and oxygen were necessary for the partially negative charged polar functional from free electron that contained surface EPMPS, hydroxyl, amines, ether, and raw epoxy. The physical mechanism followed thermal curing, as the curative procedure by heat caused openings inside the EPMPS as it is a spongy material. These two variables were obviously necessary for the synthesized EPMPS material.3.10. Case study
Application of the sorption results was performed, wherein 10 mL of waste solution (from an ore processing unit (Project 8, Inshass, NMA, Egypt))46 containing 80 mg L−1 of uranium (Table 9) was contacted with 0.1 g of EPMPS for 30 min at room temperature (25 ± 2) °C and at pH 3. After the solution had equilibrated, its uranium content was assessed, and it was found that the overall sorption capacity of EPMPS was 82% and 75% of the adsorbed uranium was desorbed by 0.1 M CH3COONa (70%).| Element | Concentration (mg L−1) |
|---|---|
| Cl | 16 |
| Fe | 1600 |
| UO2 | 80 |
| Cu | 2 |
| SiO2 | 800 |
| SO42 | 53 |
| CO32 | 80 |
| Mn | 230 |
4. Conclusion
This study investigated the use of EPMPS to adsorb uranium from aqueous solution. The results show that several factors, comprising the pH, time, adsorbent amount, initial uranium content, temperature, and opposite ions, significantly influenced the removal of uranium by adsorption on to EPMPS. The adsorption process was found to rise with increasing the shaking duration and the adsorbent weight and decreased with the rising temperature and metal concentration. The experimental data best followed the Langmuir model. It was confirmed by this study that a novel material was synthesized with novel properties, which is suitable for uranium sorption and is highly recommended for some other applications, including metal extraction and catalysts. Our next task will be to create the material at the nanoscale and with several additional chemical compositions and to further test its utility.Abbreviations
| EPMPS | Epoxy-modified phosphorus pentasulfide |
| DGEBA | Diglycidyl ether of bisphenol A |
| LPF | Lagergren pseudo-first-order |
| PS | Pseudo-second-order |
| W&M | Weber and Morris |
Data availability
The data supporting this article have been included in this manuscript.Conflicts of interest
There are no conflicts to declare.Acknowledgements
The authors would like to thank all of the contributors who assisted us in gathering sample data.References
- L. M. Camacho, S. Deng and R. R. Parra, J. Hazard. Mater., 2010, 175, 393–398 CrossRef CAS.
- H. Parab, S. Joshi, N. R. Shenoy, V. A. Lali and M. Sudersanan, Bioresour. Technol., 2005, 96, 1241–1248 CrossRef CAS.
- F. Ma, Y. Gui, P. Liu, Y. Xue and W. Song, J. Chem. Eng., 2020, 390, 124597, DOI:10.1016/j.cej.2020.124597.
- X. Zhou and T. Wu, Chemosphere, 2019, 235, 163–168 CrossRef CAS PubMed.
- F. A. Ibrahim and M. B. Magd, Front. Sci. Res. Technol., 2023, 5, 41–51 Search PubMed.
- D. K. Kakati and M. H. George, Polymer, 1993, 34, 4319–4324 CrossRef CAS.
- S. Iliescu, L. Zubizarreta, N. Plesu, L. Macarie, A. Popa and G. Ilia, Chem. Cent. J., 2012, 6, 1–13 CrossRef PubMed.
- S. Monge and G. David, Phosphorus-based Polymers: from Synthesis to Applications, Royal Society of Chemistry, 2014 Search PubMed.
- S. Maiti, S. Banerjee and S. K. Palit, Prog. Polym. Sci., 1993, 18, 227–261 CrossRef CAS.
- Z. Tan, C. Wu, M. Zhang, W. Lv, J. Qiu and C. Liu, RSC Adv., 2014, 4, 41705–41713 RSC.
- M. M. Alam, B. Biswas, A. K. Nedeltchev, H. Han, A. D. Ranasinghe, P. K. Bhowmik and K. Goswami, Polymers, 2019, 11, 1141 CrossRef CAS PubMed.
- E. D. Weil and S. V. Levchik, Phosphorus-Containing Polymers and Oligomers, Encyclopedia of Polymer Science and Technology, John Wiley & Sons, 2010 Search PubMed.
- F. R. Wurm, Green Mater., 2016, 4, 135–139 CrossRef.
- S. Iliescu, G. Ilia, A. Pascariu, A. Popa and N. Plesu, Pure Appl. Chem., 2007, 79, 1879–1884 Search PubMed.
- T. A. DelDonno, US Pat., 5191029, Washington, DC: U.S. Patent and Trademark Office, 2013.
- S. Monge, B. Canniccioni, A. Graillot and J. J. Robin, J. Biol. Macromol., 2011, 12, 1973–1982 Search PubMed.
- S. Iliescu and G. Ilia, Curr. Green Chem., 2014, 1, 40–50 Search PubMed.
- K. Dück, B. W. Rawe, M. R. Scott and D. P. Gates, Angew. Chem., Int. Ed., 2017, 56, 9507–9511 CrossRef PubMed.
- S. Hiranphinyophat and Y. Iwasaki, Sci. Technol. Adv. Mater., 2021, 22, 301–316 CrossRef CAS PubMed.
- A. E. M. Hussein, W. M. Youssef, M. H. Taha and M. M. El-Maadawy, Arab J. Nucl. Sci. Appl., 2017, 50, 156–170 Search PubMed.
- A. E. M. Hussein, W. M. Youssef and A. S. El-Sheikh, Radiochemistry, 2019, 61, 592–597 CrossRef CAS.
- W. M. Youssef, J. Basic Environ. Sci., 2020, 7, 1–12 CrossRef CAS.
- M. H. Taha, M. M. El-Maadawy, A. E. M. Hussein and W. M. Youssef, J. Radioanal. Nucl. Chem., 2018, 317, 685–699 CrossRef CAS.
- M. M. Shehata, W. M. Youssef, H. H. Mahmoud and A. M. Masoud, Russ. J. Inorg. Chem., 2020, 65, 279–289 CrossRef CAS.
- W. M. Youssef, A. S. El Sheikh, S. H. Ahmed and A. M. A. Morsy, J.Radioanal. Nucl. Chem., 2020, 324, 87–96 CrossRef CAS.
- A. A. Abdel-Samad, M. M. Abdel Aal, E. A. Haggag, W. M. Yosef and J. Bas, Environ. Sci., 2020, 7, 140–153 CrossRef CAS.
- W. M. Youssef, Int. J. Environ. Anal. Chem., 2022, 1–20 DOI:10.1080/03067319.2022.2134995.
- Z. Marczenko, Spectrophotometric Determination of Elements, E. Horwood, Halsted Press, Chichester, Eng., New York, 1976, p. 580 Search PubMed.
- L. Guo, B. Zhang, S. Bai, X. Ma and Z. Wang, e-Polymers, 2015, 15, 195–201 CAS.
- G. Socrates, Infrared and Raman Characteristic Group Frequencies: Tables and Charts, John Wiley & Sons Ltd, New York, 3rd edn, 2004 Search PubMed.
- Z. Moldovan, F. Ionescu, I. Vasilescu, S. LiŃescu and G. L. Radu, An. Univ. Bucuresti, Chim., 2007, 49–57 CAS.
- U. Shoukat, E. Baumeister and H. K. Knuutila, Energies, 2019, 12, 3285 CrossRef CAS.
- M. Hema, S. Selvasekarapandian, D. Arunkumar, A. Sakunthala and H. Nithya, J. Non-Cryst. Solids, 2009, 355, 84–90 CrossRef CAS.
- O. S. Amuda, A. Giwa and I. A. Bello, Eng. J., 2007, 36, 174–181 CAS.
- C. Kütahyalı and M. Eral, Sep. Purif. Technol., 2004, 40, 109–114 CrossRef.
- L. Xia, K. Tan, X. Wang, W. Zheng, W. Liu and C. Deng, J. Environ. Chem. Eng., 2013, 139, 887–895 CAS.
- J. Wang and X. Guo, J. Hazard. Mater., 2020, 390, 122156 CrossRef CAS PubMed.
- X. Fan, L. Peng, X. Wang, S. Han, L. Yang, H. Wang and C. Hao, Ind. Crops Prod., 2022, 183, 114966 CrossRef CAS.
- A. Bhatnagar and A. K. Jain, J. Colloid Interface Sci., 2005, 281, 49–55 CrossRef CAS.
- F. A. Al-Rub, M. Kandah and N. Al-Dabaybeh, Eng. Life Sci., 2002, 2, 111–116 CrossRef CAS.
- J. Perić, M. Trgo and N. V. Medvidović, Water Res., 2004, 38, 1893–1899 CrossRef.
- L. Zhong, F. He, Z. Liu, B. Dong and J. Ding, Colloids Surf., A, 2022, 641, 128565 CrossRef CAS.
- M. Zhao, Z. Cui, D. Pan, F. Fan, J. Tang, Y. Hu and W. Wu, ACS Appl. Mater. Interfaces, 2021, 13, 17931–17939 CrossRef CAS PubMed.
- Z. Xiao-teng, J. Dong-mei, X. Yi-qun, C. Jun-chang, H. Shuai and X. Liang-shu, J. Chem., 2019, 1, 6409504 Search PubMed.
- D. Mei, L. Liu and B. Yan, Coord. Chem. Rev., 2023, 475, 214917 CrossRef CAS.
- W. M. Youssef, M. S. Hagag and A. H. Ali, Adsorpt. Sci. Technol., 2018, 36, 1274–1293 CrossRef CAS.
- M. M. El-Maadawy, Radiochemistry, 2019, 61, 331–338 CrossRef CAS.
- A. M. Masoud, M. Saeed, M. H. Taha and M. M. El-Maadawy, J. Chem., 2020, 63, 721–741 Search PubMed.
- C. Pang, Y. Liu, X. Cao, R. Hua, C. Wang and C. Li, J. Radioanal. Nucl. Chem., 2010, 286, 185–193 CrossRef CAS.
- W. M. Youssef, A. A. Elzoghby, A. A. Rateb, E. M. Helmy, K. A. Khalil and H. S. Gado, Radiochemistry, 2024, 66, 481–492 CrossRef CAS.
| This journal is © The Royal Society of Chemistry 2024 |

