DOI:
10.1039/D4RA04692G
(Paper)
RSC Adv., 2024,
14, 23645-23660
Structural, optical, magnetic properties and energy-band structure of MFe2O4 (M = Co, Fe, Mn) nanoferrites prepared by co-precipitation technique
Received
28th June 2024
, Accepted 23rd July 2024
First published on 29th July 2024
Abstract
MFe2O4 (M = Co, Fe, Mn) nanoparticles were successfully formed through the chemical co-precipitation technique. X-ray diffraction, scanning electron microscopy, and energy-dispersive X-ray analysis were used to investigate samples' structural properties. The investigated structural properties included phases formed, crystallite size, cation distribution, hopping length, bond length, bond angle, edge length, and shared and unshared octahedral edge length. Scanning electron micrographs of the prepared samples demonstrated well-defined crystalline nanoparticles. The grain diameter was 15, 9, and 34 nm for CoFe2O4, Fe3O4, and MnFe2O4, respectively. The energy-dispersive X-ray analysis confirmed the existence of every element (Co, Fe, and O) and no discernible impurities in the samples. The optical properties were studied in detail through photoluminescence (PL) spectroscopy and Raman spectroscopy. The presence of active modes in Raman spectra confirmed the spinel structure of the MFe2O4 nanoparticles. The direct bandgap energy estimated through UV-visible spectroscopy was about 2.59–2.64 eV, corresponding with the energy-band structures of the octahedral site (1.70 eV) and the tetrahedral site (0.9 eV). This result was further confirmed by PL emission spectra. Based on Mie theory and UV-visible and PL spectral data, the mechanism of photothermal characterization for MFe2O4 nanoparticles was determined. Investigating the changes in temperature of magnetic parameters including coercivity, squareness ratio, and saturation magnetization for MFe2O4 samples showed the dominant influence of ion distribution and A–A, A–B, and B–B exchange interactions. This study also showed that strong anisotropy and weak dipolar interaction tended to increase the coercivity and squareness ratio of CoFe2O4. Conversely, weaker anisotropy and stronger dipolar interaction corresponded with the small coercivity and squareness ratio of Fe3O4 and MnFe2O4 samples.
1. Introduction
The needs of emerging industries require various multifunctional materials that can be applied in diverse applications. Nanomaterials, especially nanosized spinel ferrites with the general formula MFe2O4 (M = divalent cation), exhibit many outstanding properties in the fields of magnetism, conductivity, and optics. Thus, they are a potential candidate in various fields from the electronics industry to biomedicine.1–3 In general, the cation distribution between the A-site and B-site of an AB2O4 spinel structure decides the structural type of ferrites, i.e., whether it is normal or inverse or mixed.4 If all divalent M2+ ions occupy the tetrahedral site (A site) and the trivalent Fe3+ ions occupy the octahedral site (B site), one would have normal spinel ferrites, and the inverse spinel structure becomes possible only when all divalent ions occupy the B site. The trivalent Fe3+ ions can be equally divided between the A and remaining B sites.5,6 Among nanoferrites, CoFe2O4, Fe3O4, and MnFe2O4 nanoferrites are excellent because of their unique physical properties and important applications.7 Bulk CoFe2O4, MnFe2O4, and Fe2O4 ferrites are predominantly inverse spinel ferrites in which Co2+/Fe2+/Mn2+ ions primarily occupy the B-site and Fe3+ ions are distributed equally among the A- and B-sites.8 However, in most cases, the preparation methods and the reduced size of spinels to the nanometer scale, the degree of inversion of the crystal structure becomes different from that of their bulk counterparts. Thus, the cation distribution directly affects the mechanical, chemical, and physical characteristics of spinel ferrite nanoparticles (NPs). This issue is well documented in the literature.9 However, owing to the cation exchange between tetrahedral and octahedral sites, the properties of some spinels become complicated; they are not the same even if they have the same chemical formula.10 This is a result of the quantum-confinement effect and the strength between the two A and B sublattice interactions.10 Therefore, controlling the fabrication parameters and choosing the appropriate sample-preparing method can confer beneficial properties for nanoferrite applications in engineering and biomedicine. The fabrication of CoFe2O4 and Fe3O4 NPs and most of their optical and magnetic properties have been thoroughly studied and are well documented.
Hunpratub et al.11 synthesized CoFe2O4 NPs through a co-precipitation method and investigated the effect of cation distribution on their magnetic properties. They found that the predicted net magnetic moment values of all samples corresponded with the decrease in migration of Co2+ and Fe3+ between A and B sites. This result agreed with those of Yadav et al.12 and Kumar et al.13 Besides cation distribution and particle size, they suggested that the noncollinear structure of spins on the surface also needs to be considered as an important factor affecting the magnetization of CoFe2O4 NPs.
Ansari et al.14 studied the structural, physical, chemical, electronic, and magnetic properties of solvothermally synthesized CoFe2O4 NPs. In particular, they found a doublet peak of T2g(1) mode for CoFe2O4 with different sizes, consistent with the observation of Chandramohan et al.15 Á. de Jesús Ruíz-Baltazar et al.16 found that the T2g(1), T2g(2), and Eg modes are located at 312, 545, and 667 cm−1, respectively, consistent with the strange modes at 453, 755, 870, and 950 cm−1 for 40 nm-sized Fe3O4. They attributed the appearance of these unknown modes to iron oxides left over from the magnetite formation. However, many authors believe that the Raman characteristics of the inverse and mixed spinel structure are double peaks.17–19 Therefore, 10 Raman peaks at most can be observed in Fe3O4 NPs.
It is clear that the previous reports of MFe2O4 only confined to analyze the structural, optical, magnetic, and the correlation between the cation distribution with the modification of its physical properties. In addition, in recent years, the MFe2O4 superparamagnetic nanomaterials were investigated for magnetic hyperthermia therapy. As a whole, this confirmed a fact that the role of dipolar interaction in the magnetic property were not investigated at length for MFe2O4 nanoferrites via the co-precipitation method. Therefore, an intention was carried out to study the above said property for MFe2O4 nanoferrites.
The photothermal effect in Fe3O4 NPs and its process based on photoluminescence emission in the near-infrared (NIR) region are attracting scientific research attention. Sadat et al.20 used PL emission spectra in the NIR region and UV-visible (UV-Vis) spectra to establish the mechanism for interpreting the photothermal effect in (PAA)/Fe3O4, PS/Fe3O4, and Si/PS/Fe3O4 NPs. Zhao et al.21 studied the photothermal effect of Fe3O4 NPs in solution and thin-film forms under the influence of white light and NIR laser irradiation. Interestingly, they obtained a stronger photothermal effect for Fe3O4 under the stimulation of white-light irradiation. Their results are also explained based on PL and UV-Vis spectra and energy bands structure. However, the energy bands structure of ferrites is still a subject of debate. In general, the relatively complex electronic structure of transition metals has led to various confusing interpretations of the optical and magneto-optical Kerr spectra for ferrites owing to different assignments of the observed transitions.22 Specifically, the photothermal effect mechanism of CoFe2O4 and MnFe2O4 NPs has not yet been studied.
Recently, we have synthesized and determined the elastic parameters and nanocrystalline size of spinel ferrites MFe2O4 (M = Co, Fe, Mn, and Zn) through X-ray diffraction and infrared spectroscopy analyses.23 In the present work, we continued to fabricate and study the structural, optical, and magnetic characteristics of the hard magnetic CoFe2O4 and the soft magnetic Fe3O4 and MnFe2O4 NPs. We focused on discussing the relationship between UV-Vis and PL spectra from building the energy-band structure diagram of the three samples, as well as the role of dipolar interaction in the magnetic property of MFe3O4 NPs.
2. Experimental detail
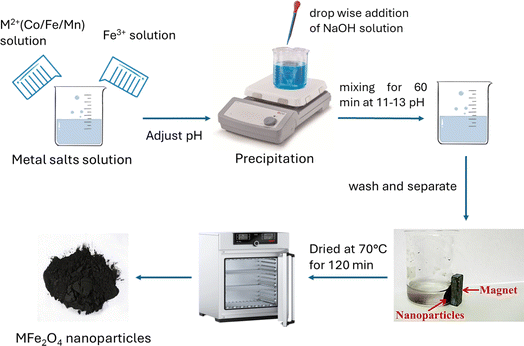
2.1. Synthesis of MFe2O4 (M = Co, Fe, Mn)
The co-precipitation technique was used to synthesize MFe2O4 NPs following a previous procedure.23 Cobalt(II) chloride hexahydrate (CoCl2·6H2O, ≥98%), iron(III) chloride hexahydrate (FeCl3·6H2O, ≥98%), manganese(II) chloride tetrahydrate (MnCl2·4H2O, ≥98%), ferrous chloride tetrahydrate (FeCl2·4H2O, ≥98%), sodium hydroxide (NaOH, ≥98%) were purchased from Sigma-Aldrich, US. Each MFe2O4 sample was prepared from 50 mL of mixed aqueous solution by dissolving required amounts of CoCl2·6H2O and FeCl3·6H2O (for CoFe2O4), FeCl2·4H2O and FeCl3·6H2O (for Fe3O4), and MnCl2·4H2O and FeCl3·6H2O (for MnFe2O4) with 2![[thin space (1/6-em)]](https://www.rsc.org/images/entities/char_2009.gif) :1 molar ratio of Fe3+ to M2+, respectively. Chemical precipitation was achieved at room temperature under vigorous stirring by adding 200 mL of 2 M NaOH solution and mixing for 60 min at pH 11 to 13. Afterward, the black precipitate of each sample was cooled to room temperature, the precipitates were separated with a permanent magnet, and they were washed with deoxygenated distilled water until neutral pH. Finally, MFe2O4 was washed with acetone and dried in an oven at 70 °C for 120 min. All steps of preparing MFe2O4 nanoferrites are clearly illustrated in Fig. 1.
:1 molar ratio of Fe3+ to M2+, respectively. Chemical precipitation was achieved at room temperature under vigorous stirring by adding 200 mL of 2 M NaOH solution and mixing for 60 min at pH 11 to 13. Afterward, the black precipitate of each sample was cooled to room temperature, the precipitates were separated with a permanent magnet, and they were washed with deoxygenated distilled water until neutral pH. Finally, MFe2O4 was washed with acetone and dried in an oven at 70 °C for 120 min. All steps of preparing MFe2O4 nanoferrites are clearly illustrated in Fig. 1.
 |
| | Fig. 1 Schematic for synthesis MFe2O4 (M = Co, Fe, Mn) nanoferrites using co-precipitation method. | |
2.2. Characterization
The crystalline phase of the synthesized MFe2O4 NPs was examined using a Rigaku X-ray diffractometer equipped with Cu Kα (λ = 1.5406 Å). The 2θ range of 10° to 80° and a step size of 0.02° with a dwell time of 0.05 s were used during the measurement. Morphology and particle size were analyzed by scanning electron microscopy (SEM; Hitachi S-4800). The chemical compositions of MFe2O4 NPs were obtained by the energy-dispersive X-ray (EDX) analysis using a Hitachi S-4800 FESEM equipped with an EDX energy-dispersive spectroscopy attachment.
Optical properties were assessed by PL emission. Measurements were made at an excitation wavelength of 310 nm using a fluorescence spectrophotometer (Fluorolog 3 FL3-22; Horiba). Raman spectra were obtained using an XploRA PLUS Micro Raman spectrometer (Horiba) with a laser wavelength of 785 nm as an excitation source. UV-Vis spectroscopy (JASCO V-770) was used to determine the bandgap of MFe2O4 NPs. A 3 T Physical Property Measurement System VersaLab (model VL173; USA) was used to analyze magnetic properties.
3. Results and discussion
3.1. Structural characteristics of MFe2O4 NPs
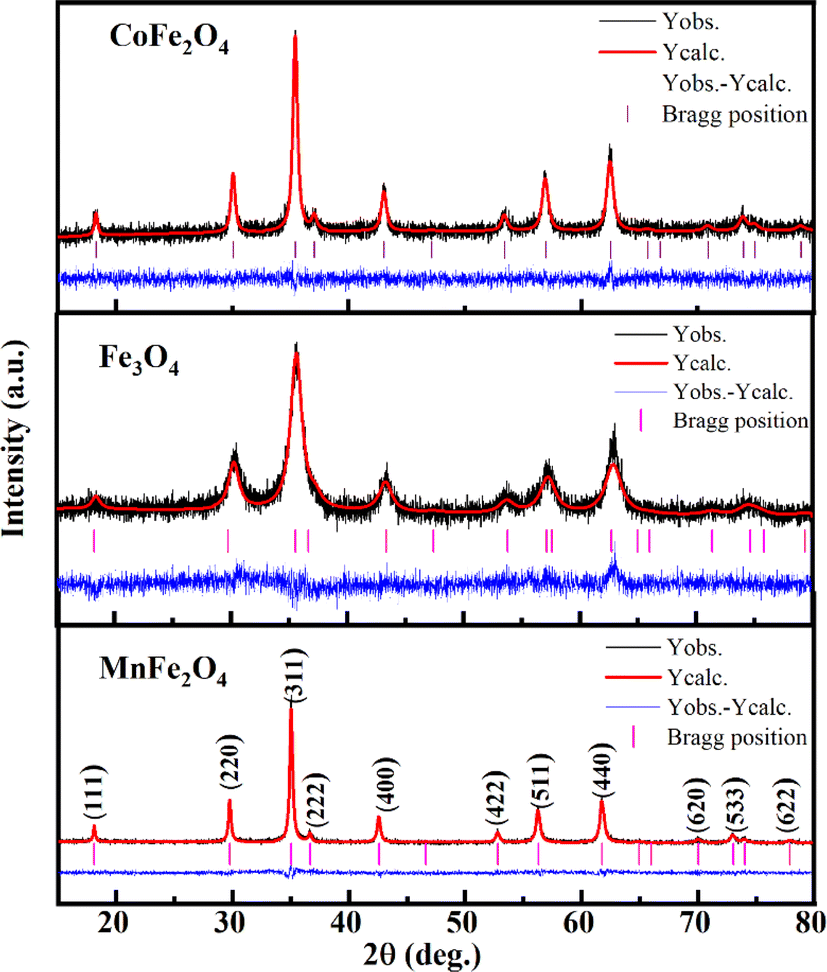
Fig. 2 illustrates the X-ray diffraction (XRD) pattern and Rietveld refinement of CoFe2O4, Fe3O4, and MnFe2O4 compatible with the JCPDS card number of CoFe2O4 (No. 156-5326), Fe3O4 (No. 151-3304), MnFe2O4 (No. 230-0618). Their patterns showed typical diffraction peaks assigned to the (111), (220), (311), (222), (400), (422), (511), (440), (620), and (533) planes of the cubic spinel structure with the Fd![[3 with combining macron]](https://www.rsc.org/images/entities/char_0033_0304.gif) m space group of ferrites. No additional peaks arising from impurities were detected within the limits of XRD measurement. The goodness factor (χ2) was less than 2, which lay within the confidence threshold (1 ≤ χ2 < 2), demonstrating high refinement reliability.
m space group of ferrites. No additional peaks arising from impurities were detected within the limits of XRD measurement. The goodness factor (χ2) was less than 2, which lay within the confidence threshold (1 ≤ χ2 < 2), demonstrating high refinement reliability.
 |
| | Fig. 2 The Rietveld refinement of XRD patterns for MFe2O4 nanoparticles (observed – black line, calculated – red line and difference – blue line). | |
The experimental lattice constant (aexp), unit-cell volume (V) and oxygen positional parameter (u) were determined from Rietveld refinement and are listed in Table 1. The lattice constant and oxygen positional parameter of Fe3O4 were less than those of CoFe2O4 and MnFe2O4, which was attributed to the redistribution of cations (Fe3+, Mn2+, and Co2+) between the two interstitial sites.11,24 Conversely, the disparity of the oxygen positional parameter with ideal value (u = 0.375 Å) may be due to anion displacement from the ideal position to expand the tetrahedral interstices.25 However, these experimental values were close to the values obtained for the ferrite system in the literature.26,27
Table 1 Cation distribution, experimental and theoretical lattice parameter (aexp, ath), unit cell volume (V) and oxygen positional parameter (u) mean ionic radii of A site  and B site
  , crystalline grain diameter (d), grain size (D) of MFe2O4 nanoparticles
| Sample |
Cation distribution |
aexp (Å) |
ath (Å) |
V (Å3) |
u |

|

|
d (nm) |
D (nm) |
| A site |
B site |
| CoFe2O4 |
Co0.082+Fe0.923+ |
Co0.922+Fe1.083+ |
8.4093 |
8.4093 |
594.67 |
0.3806 |
0.4972 |
0.6910 |
14.6 |
14.7 |
| Fe3O4 |
Fe3+ |
Fe2+Fe3+ |
8.3628 |
8.3628 |
584.86 |
0.3762 |
0.4900 |
0.7125 |
7.0 |
9.0 |
| MnFe2O4 |
Fe3+ |
Mn2+Fe3+ |
8.4981 |
8.4981 |
613.71 |
0.3808 |
0.4900 |
0.7375 |
27.4 |
34.3 |
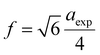
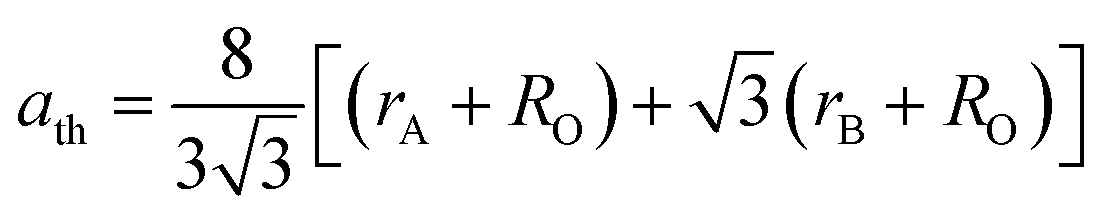
The cation distribution at the A and B sites was determined based on the assumption that the occupancies of the cations with a sum of cations at A site equal to 1 and a sum of cations at B site equal to 2 of the three samples are represented in Table 1. Thus, according to the cation distribution, the theoretical lattice constant (ath) was calculated using the following expression:11,26,28
| |
 | (1) |
where
rA and
rB are the ionic radius of tetrahedral and octahedral sites, respectively, and were calculated using the equations:
| |
 | (2a) |
| |
 | (2b) |
where
RO is the radius of oxygen ion (1.38 Å). The (
ath) values of three samples are listed in
Table 1. The lattice constants
ath and
aexp well agreed with each other, indicating the migration of Co
2+, Mn
2+, and Fe
3+ ions into the tetrahedral and octahedral sites, respectively.
28
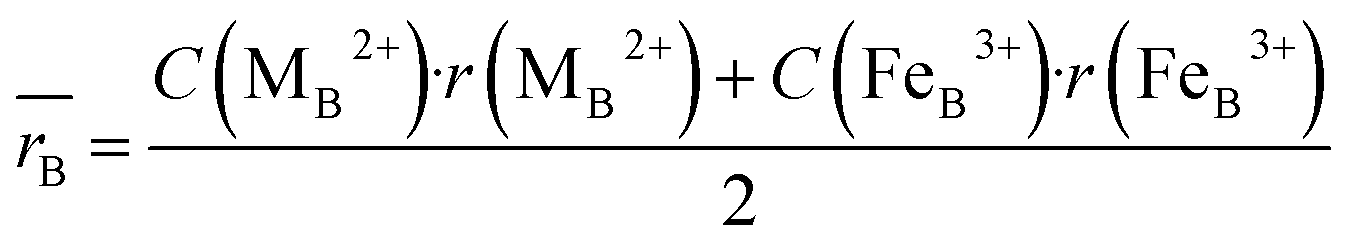
Moreover, the mean cation radii at the tetrahedral  and octahedral sites
  were determined based on the following cation distribution:
| |
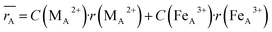 | (3a) |
| |
 | (3b) |
where
C is the ionic concentration at the tetrahedral and octahedral sites;
r(M
A2+) are the ionic radii of Co
2+ (0.58 Å) and Fe
3+ (0.49 Å) ions in the tetrahedral sites, respectively;
r(M
B2+),
r(Fe
B3+) are the ionic radii of Co
2+ (0.745 Å), Mn
2+ (0.83 Å), Fe
2+ (0.78 Å), and Fe
3+ (0.645 Å) ions in the octahedral sites, respectively.
29 The

values of three samples are shown in
Table 1. The average ionic radius of the tetrahedral site was reduced whereas the average ionic radius of the octahedral site increased in the order Co > Fe > Mn ions in MFe
2O
4. This finding was because Fe
3+ ions (0.49 Å) with a smaller ionic radius were replaced by Co
2+ ions (0.58 Å) with a larger ionic radius. Conversely, in (B) sites, all Mn
2+ ions (0.83 Å) and Fe
2+ ions (0.78 Å) with larger ion radii migrated to the B site, so the average ion radius of the B site increased.
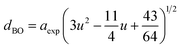
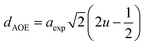
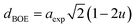
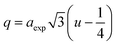
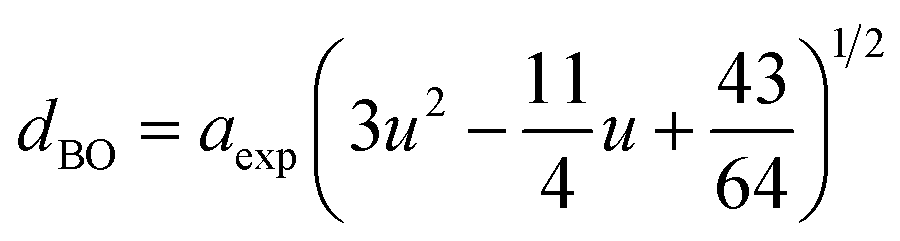
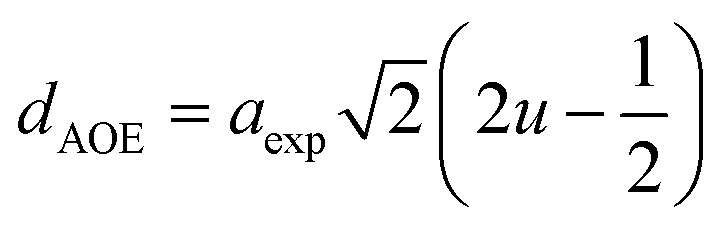
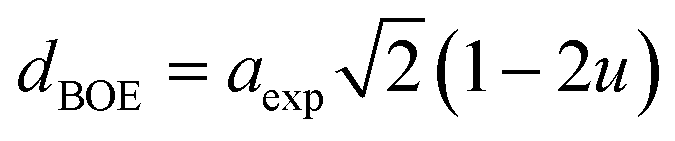
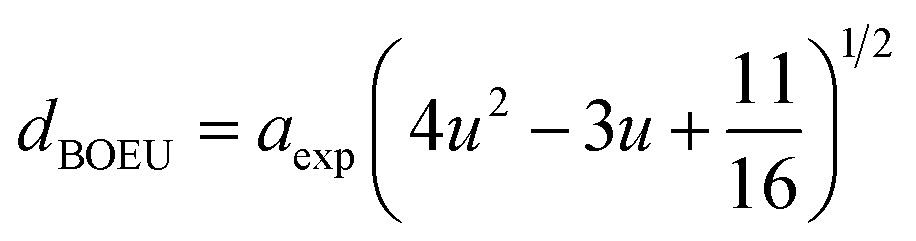
The hopping length (LA and LB), tetrahedral and octahedral bond lengths (dAO and dBO), tetrahedral edge length (dAOE), and shared and unshared octahedral edge length (dBOE and dBOEU) of the three samples were computed according to the equations below,28,30,31 and the results are listed in Table 2.
| |
 | (4a) |
| |
 | (4b) |
| |
 | (5a) |
| |
 | (5b) |
| |
 | (6a) |
| |
 | (6b) |
| |
 | (6c) |
Table 2 Hopping length (LA and LB), tetrahedral bond length (dAO), octahedral bond length (dBO), tetrahedral edge length (dAOE), shared octahedral edge length (dBOE), unshared octahedral edge length (dBOEU) of MFe2O4 nanoparticles
| Sample |
Hopping length |
Edges |
| LA (Å) |
LB (Å) |
dAO (Å) |
dBO (Å) |
dAOE (Å) |
dBOE (Å) |
dBOEU (Å) |
| CoFe2O4 |
3.641 |
2.973 |
1.902 |
2.056 |
3.106 |
2.840 |
2.975 |
| Fe3O4 |
3.621 |
2.957 |
1.828 |
2.081 |
2.985 |
2.928 |
2.957 |
| MnFe2O4 |
3.680 |
3.005 |
1.925 |
2.076 |
3.144 |
2.865 |
3.006 |
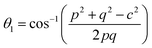
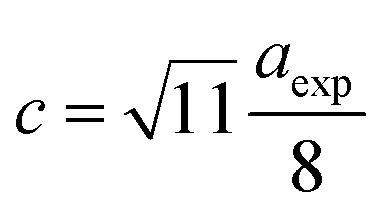
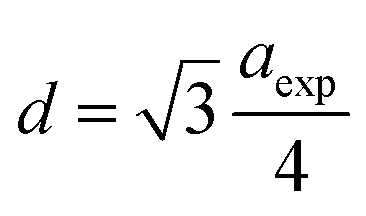
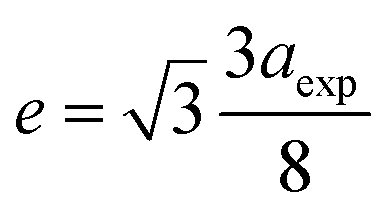
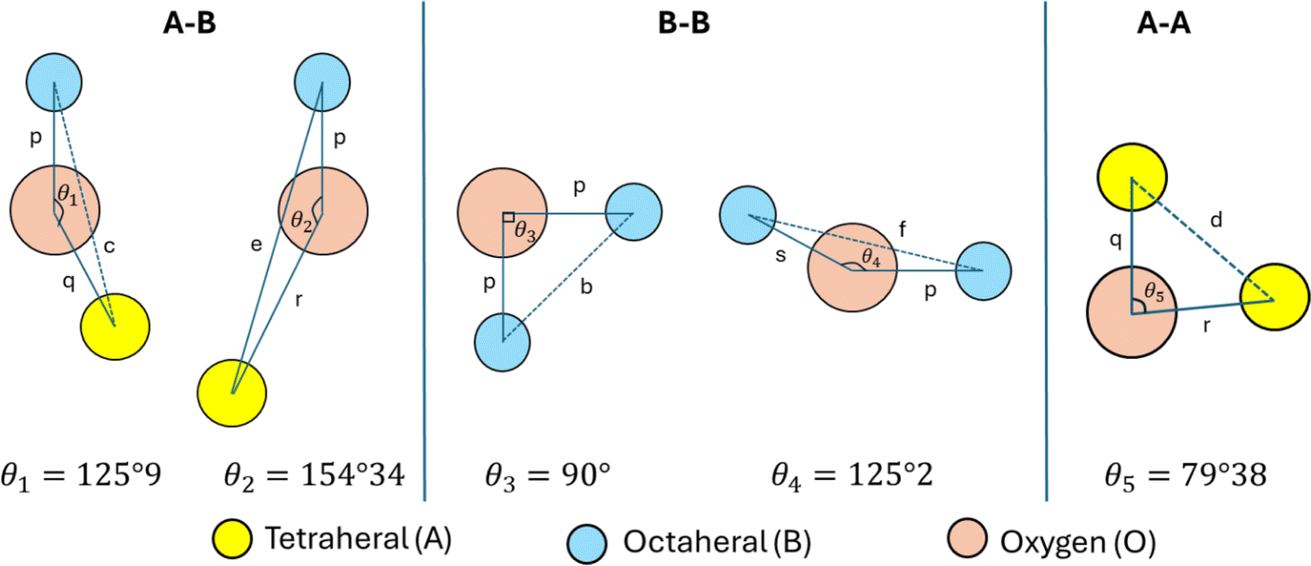
In ferrites, the distances between intrinsic ions (cation–anion and cation–cation distances) and bond angles between metal ions directly affect the strength of the magnetic exchange interactions, thus, to gain deeper insight into the magnetic properties of the samples, the inter-ionic length and bond angles between ions were calculated, and results are provided in Tables 3 and 4. The interionic distances were determined using relations,32–35
| |
 | (7a) |
| |
 | (7b) |
| |
 | (7c) |
| |
 | (7d) |
for cation–anion length,
| |
 | (8a) |
| |
 | (8b) |
| |
 | (8c) |
| |
 | (8d) |
| |
 | (8e) |
for cation–cation distances.
Table 3 Values of the interionic distances of MFe2O4 nanoparticles
| Sample |
Me–O (Å) |
Me–O (Å) |
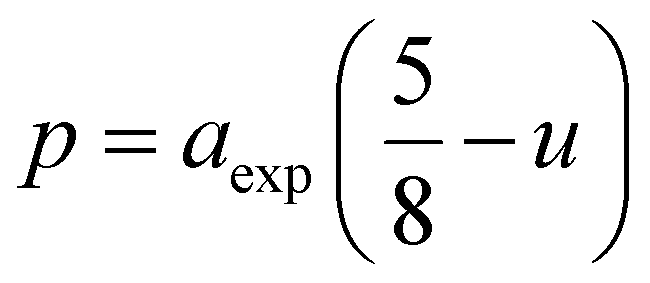
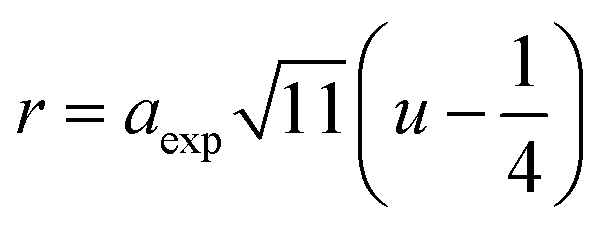
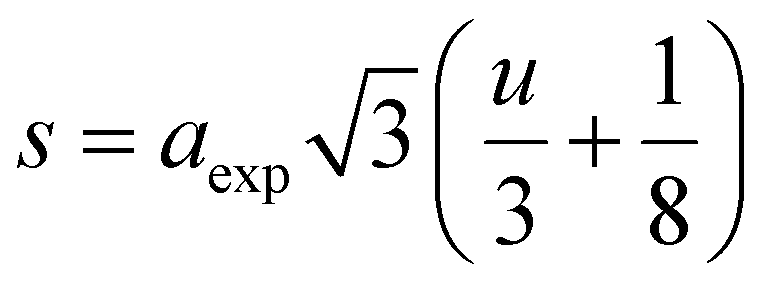
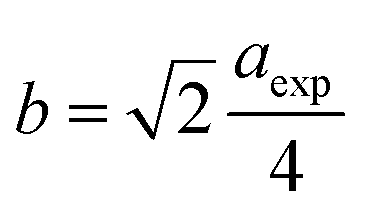
| p |
q |
r |
s |
b |
c |
d |
e |
f |
| CoFe2O4 |
2.0554 |
1.9019 |
3.6419 |
3.6684 |
2.9731 |
3.4863 |
3.6413 |
5.4620 |
5.1496 |
| Fe3O4 |
2.0807 |
1.8280 |
3.5003 |
3.6270 |
2.9567 |
3.4670 |
3.6212 |
5.4318 |
5.1211 |
| MnFe2O4 |
2.0752 |
1.9253 |
3.6866 |
3.7082 |
3.0045 |
3.5231 |
3.6798 |
5.5197 |
5.2040 |
Table 4 Values of the interionic angles (in degrees) of MFe2O4 nanoparticles
| Sample |
Bond angle |
| θ1 |
θ2 |
θ3 |
θ4 |
θ5 |
| CoFe2O4 |
123.47 |
145.55 |
92.65 |
125.87 |
74.84 |
| Fe3O4 |
124.87 |
152.52 |
90.55 |
125.39 |
78.82 |
| MnFe2O4 |
123.40 |
145.23 |
92.75 |
125.90 |
74.65 |
All these parameters of the three samples are given in Table 3. The change in values of these intrinsic distances well agreed with the unit-cell volume of the samples (Table 1).
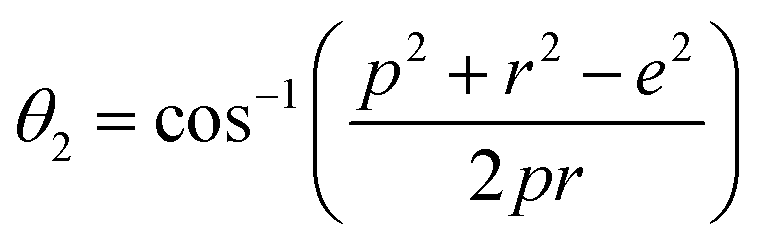
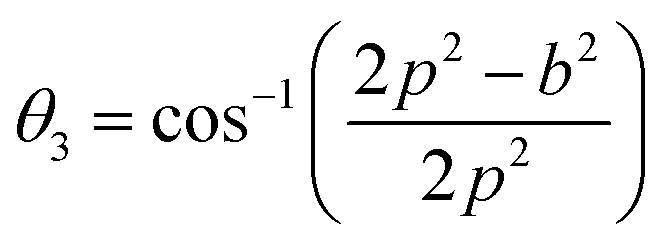
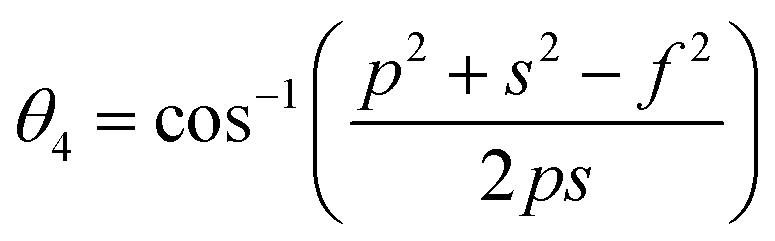
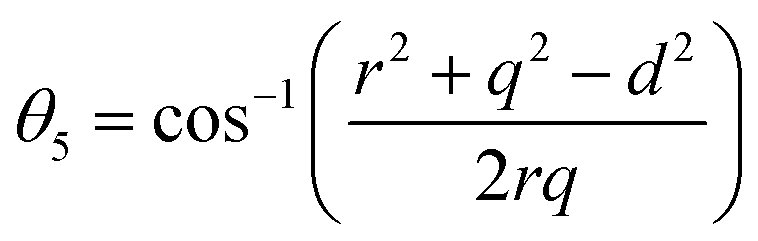
The bond angles (θ1; θ2; θ3; θ4; θ5) between metal ions were computed from values of cation–cation and cation–anion lengths using expressions.32–35 Results are listed in Table 4.
| |
 | (9a) |
| |
 | (9b) |
| |
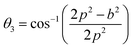 | (9c) |
| |
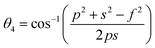 | (9d) |
| |
 | (9e) |
The values of θ1, θ2, and θ5 for Fe3O4 exceeded those of CoFe2O4 and MnFe2O4, whereas those of θ3 and θ4 for Fe3O4 were smaller than those of CoFe2O4 and MnFe2O4. Generally, the greater decrease in θ3 and θ4 corresponded with stronger interactions in B–B; conversely, the greater increment in θ1, θ2, and θ5 corresponded with weaker interactions in A–B.33 Fig. 3 illustrates the visualization of the arrangement of ion pairs with the intrinsic lengths between them and the angles formed by these lengths in the spinel structure. The influence of changing the value of bond angles on the magnetic properties of the samples is discussed in detail in the following section.
 |
| | Fig. 3 Schematics of the configuration of the ion pairs in ideal spinel ferrites with advantageous distances and angles for effective magnetic interactions.26 | |
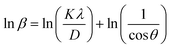
To minimize the total absolute value of errors, the average crystallite size (D) of the prepared MFe2O4 samples was calculated using the full width at half-maximum (β) values and angle values corresponding with all peaks, as proposed by Monshi et al.34
| |
 | (10) |
The lnβ vs.  graphs of the samples are drawn in Fig. 4. The obtained average crystallite size (D) was 14.5, 7.0, and 27.4 nm for CoFe2O4, Fe3O4, and MnFe2O4, respectively, as listed in Table 1. The large difference in crystal size between samples showed the role of pH and reaction time on phase formation and crystal size. This finding was consistent with that of Saf et al.28 They found that CoFe2O4 samples synthesized at low pH have smaller crystallite sizes with poor crystallinity, whereas CoFe2O4 samples synthesized at high pH have a larger crystallite size with a greater degree of crystallinity.
 |
| | Fig. 4 Modified Scherrer for MFe2O4 nanoparticles. | |
3.2. FE-SEM and EDX of MFe2O4 NPs
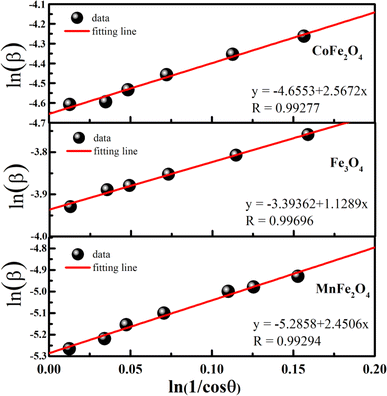
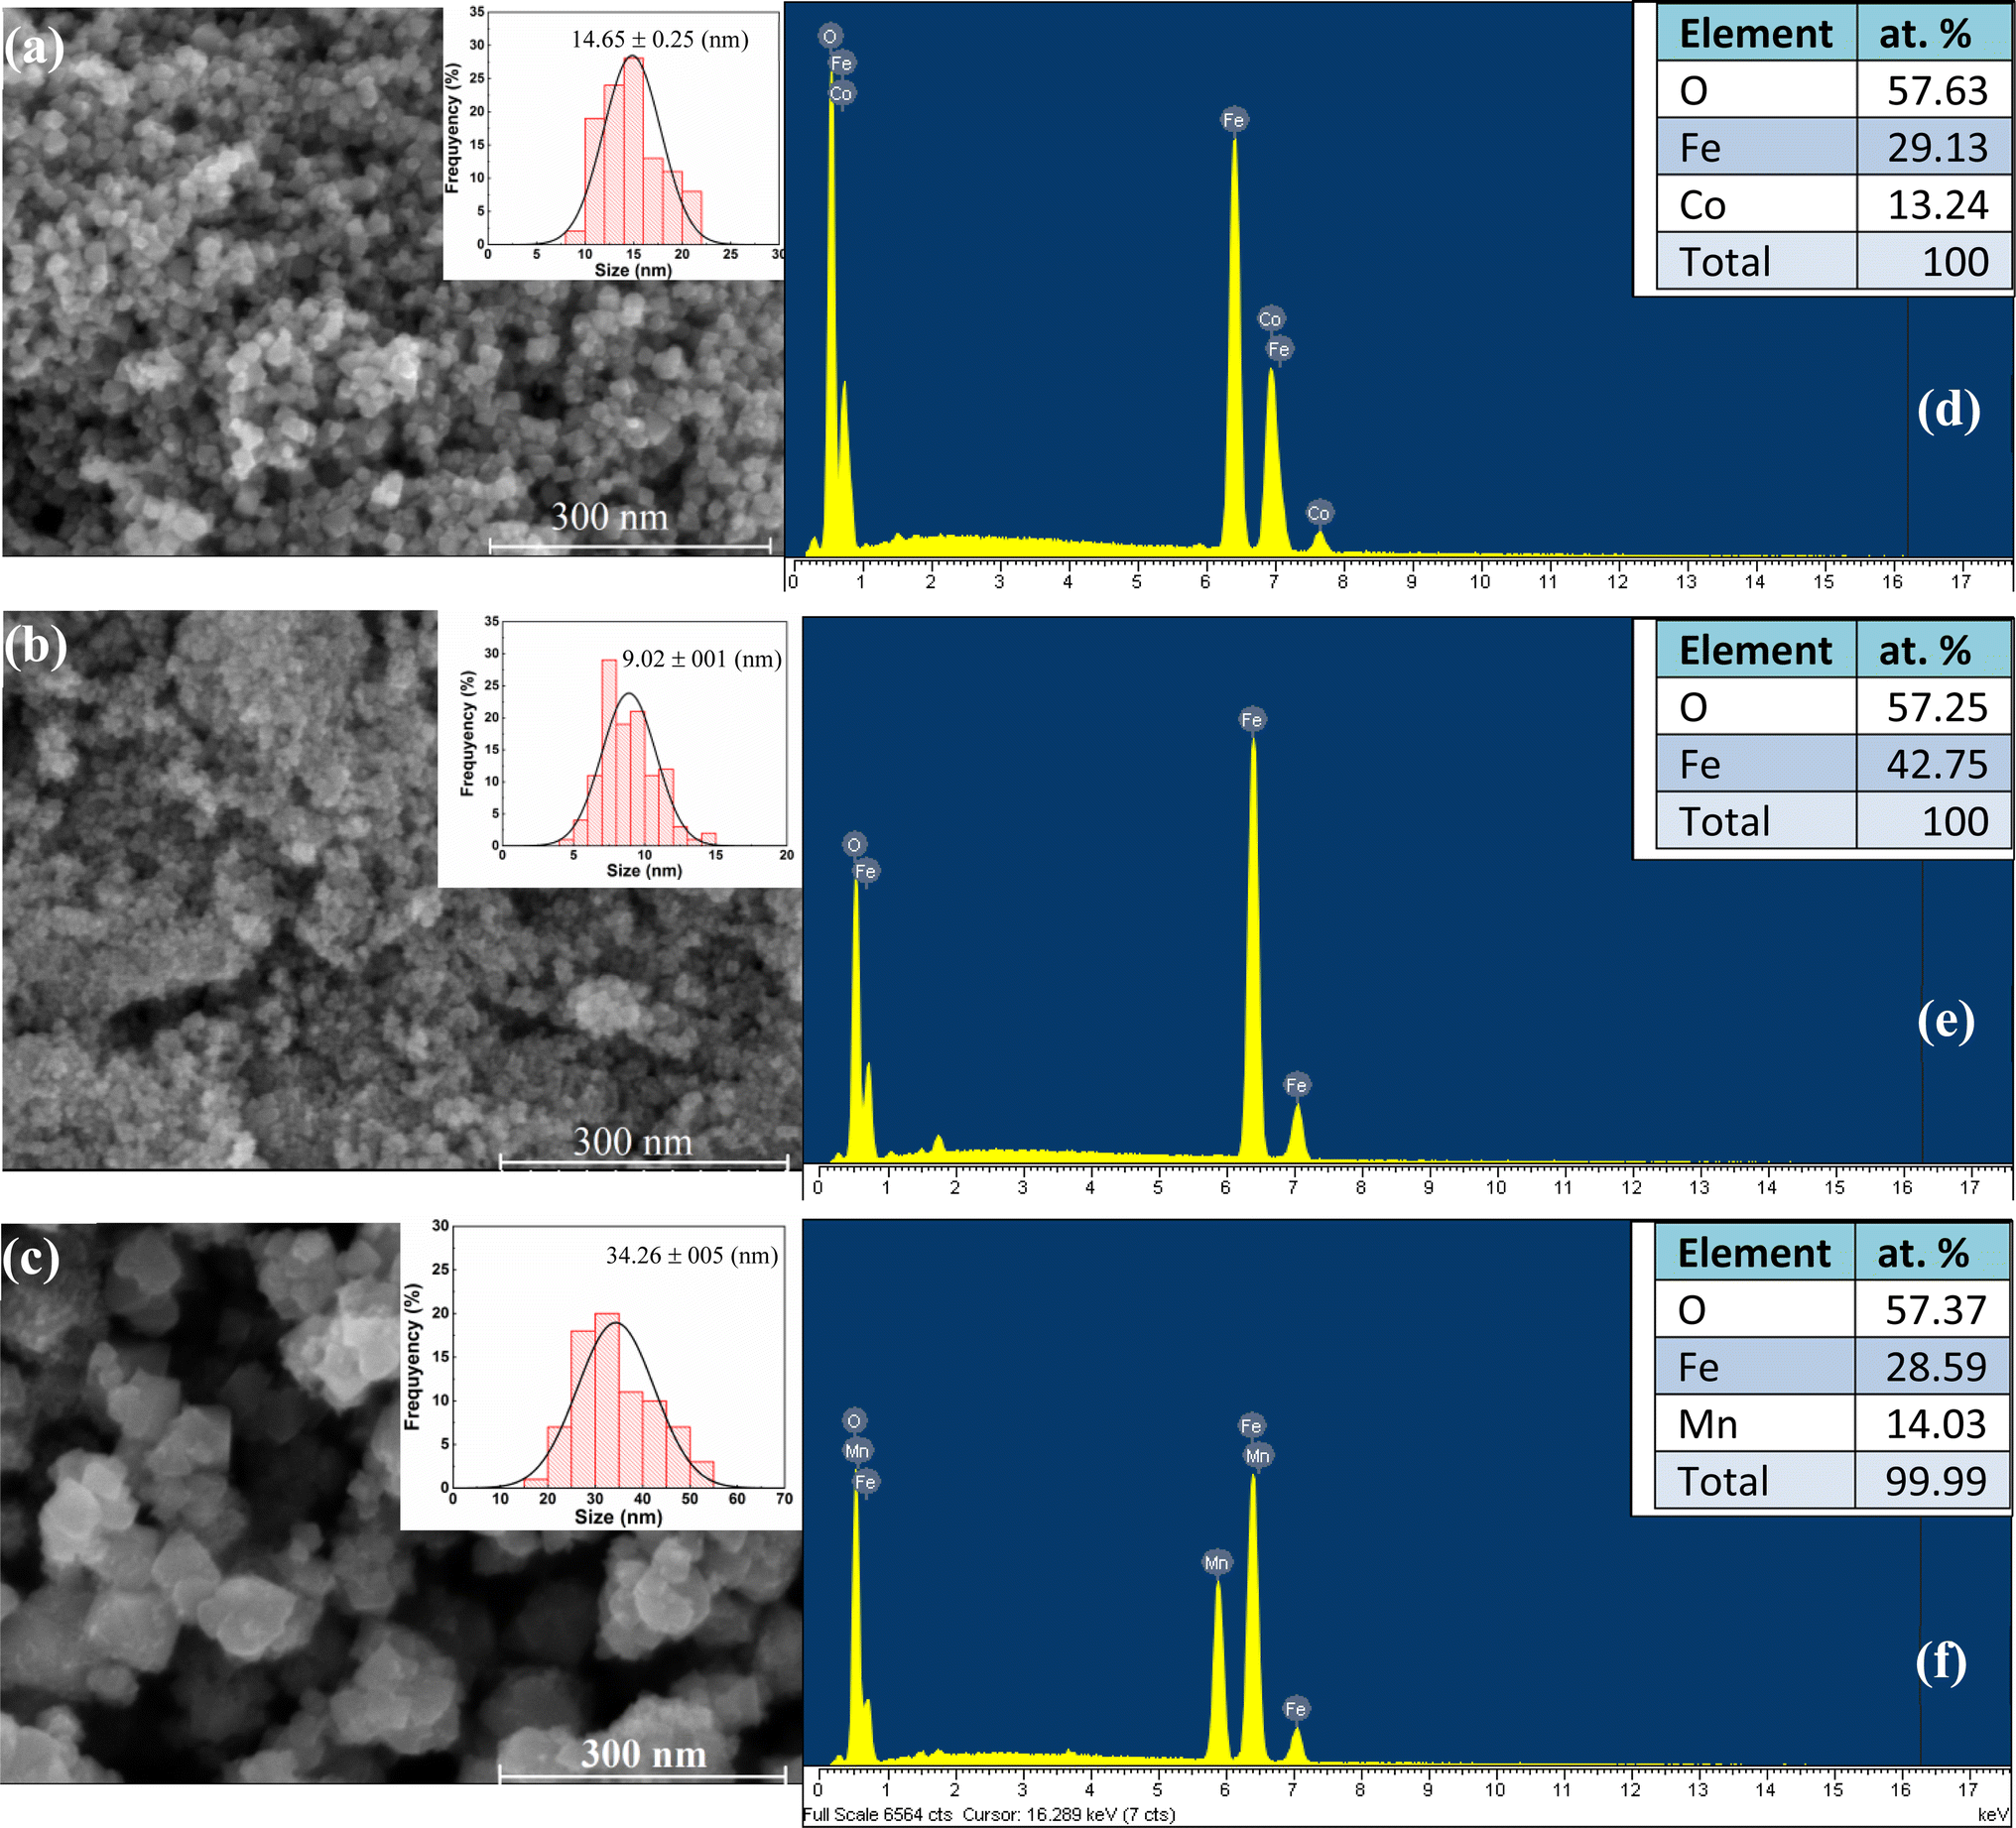
The morphology of MFe2O4 NPs was examined by the FE-SEM technique, and results are shown in Fig. 5(a–c). Fig. 5 reveals particle agglomeration with spherical NPs and a narrow particle-size distribution. Analysis results of SEM images using ImageJ software demonstrated the average particle size to be 14.7, 9.0, and 34.3 nm for CoFe2O4, Fe3O4, and MnFe2O4, respectively. Experimental studies have determined the critical sizes for superparamagnetic (SPM) behavior of CoFe2O4, Fe3O4, and MnFe2O4 NPs to be 10–17 nm,36 20 nm,37,38 and 43 nm,39 respectively. Therefore, our samples satisfy the conditions for the existence of the SPM state at temperature T > TB and blocked state at temperature T < TB (here TB is a blocking temperature). The values of the average particle sizes from SEM images well agreed with those of the average crystallite sizes determined from the XRD patterns. The structure of MFe2O4 NPs was further investigated by EDX spectroscopy. The results are presented in Fig. 5(d–f). Co, Fe, Mn, and O elements were present without any impurity elements from precursors. As shown in the inset of Fig. 5(d–f), the observed atomic percentage of metal cations and anions determined from the average value of three different positions of each sample was close to the standard metal cation-to-anion ratio (3:4) of ferrites. This finding further confirmed that all precursors reacted very well with one another to finally form the desired nanoferrite samples.
 |
| | Fig. 5 (a–c) HR-SEM image, particle size distribution histogram and (d–f) corresponding EDX spectra of MFe2O4 nanoparticles. | |
3.3. Raman spectra of MFe2O4 NPs
Raman spectroscopy measurements were performed at room temperature to further study the surface and structural properties of materials, and results are presented in Fig. 6(a). Calculations from group theory predict A1g + Eg + 3T2g Raman modes in the normal cubic spinel structure.40,41 Thus, the phonon-mode assignment for our samples was conducted in accordance using the vailable literature.17,19,40–47 The highest frequency A1g mode above 600 cm−1 was assigned to the symmetric breathing mode of oxygen atoms concerning Co, Fe, and Mn ions in the tetrahedral void (AO4).42 The second-highest frequency T2g(3) mode from 450 cm−1 to below 600 cm−1 was due to as either the antisymmetric breathing mode of the AO4 unit40,43 or to the asymmetric bending motion of oxygen bonded to the tetrahedral cation.44 The T2g(2) mode from 330 cm−1 to below 480 cm−1 was due to a translation along one direction of the lattice, with the cation and oxygen atoms moving in opposite directions.40,45 The Eg mode from 140 cm−1 to below 330 cm−1 was ascribed to the symmetric bending motion of oxygen anions within the AO4 unit.40 The lowest frequency Raman-active mode T2g(1) was a complete translation of the tetrahedral void within the spinel lattice.40,42,45 However, all Raman modes were asymmetric (or dissociated). The deconvoluted Raman spectrum for all major peaks of the samples along with their fits are presented in Fig. 6(b–d), whereas parameters derived are summarized in Table 5. These results showed that each peak can be presented like a doublet, which was characteristic of the inverse or mixed spinel structure,19,46,47 similar to the peak positions reported for NiFe2O4 and ZnFe2O4 NPs.17 This variation in the relative Raman intensities of CoFe2O4, Fe3O4, and MnFe2O4 was due to ionic-radius differences in Co2+, Fe2+, Fe3+, and Mn2+. Moreover, the downshifts and broadening of the Raman peaks in CoFe2O4, Fe3O4, and MnFe2O4 NPs primarily originated from the strain growth and quantum-confinement effect of optical phonons in nanosized crystalline particles.48
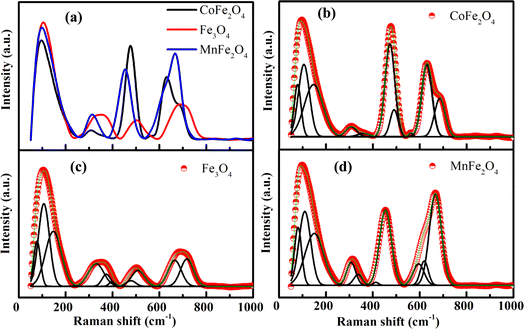 |
| | Fig. 6 (a) Experimental Raman spectrum under excitation wavelength of 785 nm and (b–d) Raman active modes fitted with cumulative fit are displayed for MFe2O4 nanoparticles. | |
Table 5 Assigned Raman modes for MFe2O4 nanoparticles
| Sample |
T2g(1) (cm−1) |
T2g(1) (cm−1) |
Eg (cm−1) |
Eg (cm−1) |
T2g(2) (cm−1) |
T2g(2) (cm−1) |
T2g(3) (cm−1) |
T2g(3) (cm−1) |
A1g (cm−1) |
A1g (cm−1) |
| CoFe2O4 |
78.49 |
105.51 |
146.89 |
307.24 |
360.10 |
472.37 |
490.37 |
560.81 |
630.03 |
685.45 |
| Fe3O4 |
77.92 |
106.90 |
147.48 |
329.72 |
373.56 |
397.73 |
478.60 |
509.08 |
665.32 |
717.67 |
| MnFe2O4 |
80.86 |
109.78 |
150.31 |
307.14 |
337.33 |
413.11 |
453.70 |
595.30 |
619.36 |
666.88 |
3.4. Optical properties and electronic band structure of MFe2O4 NPs
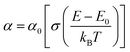
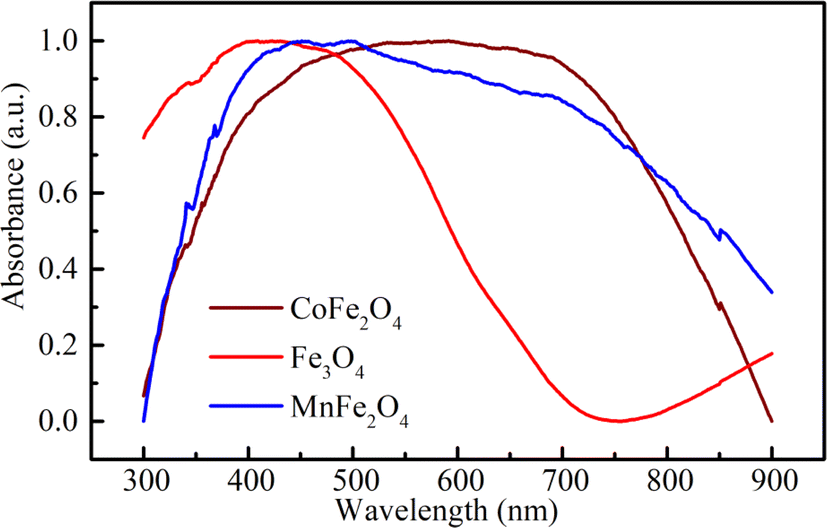
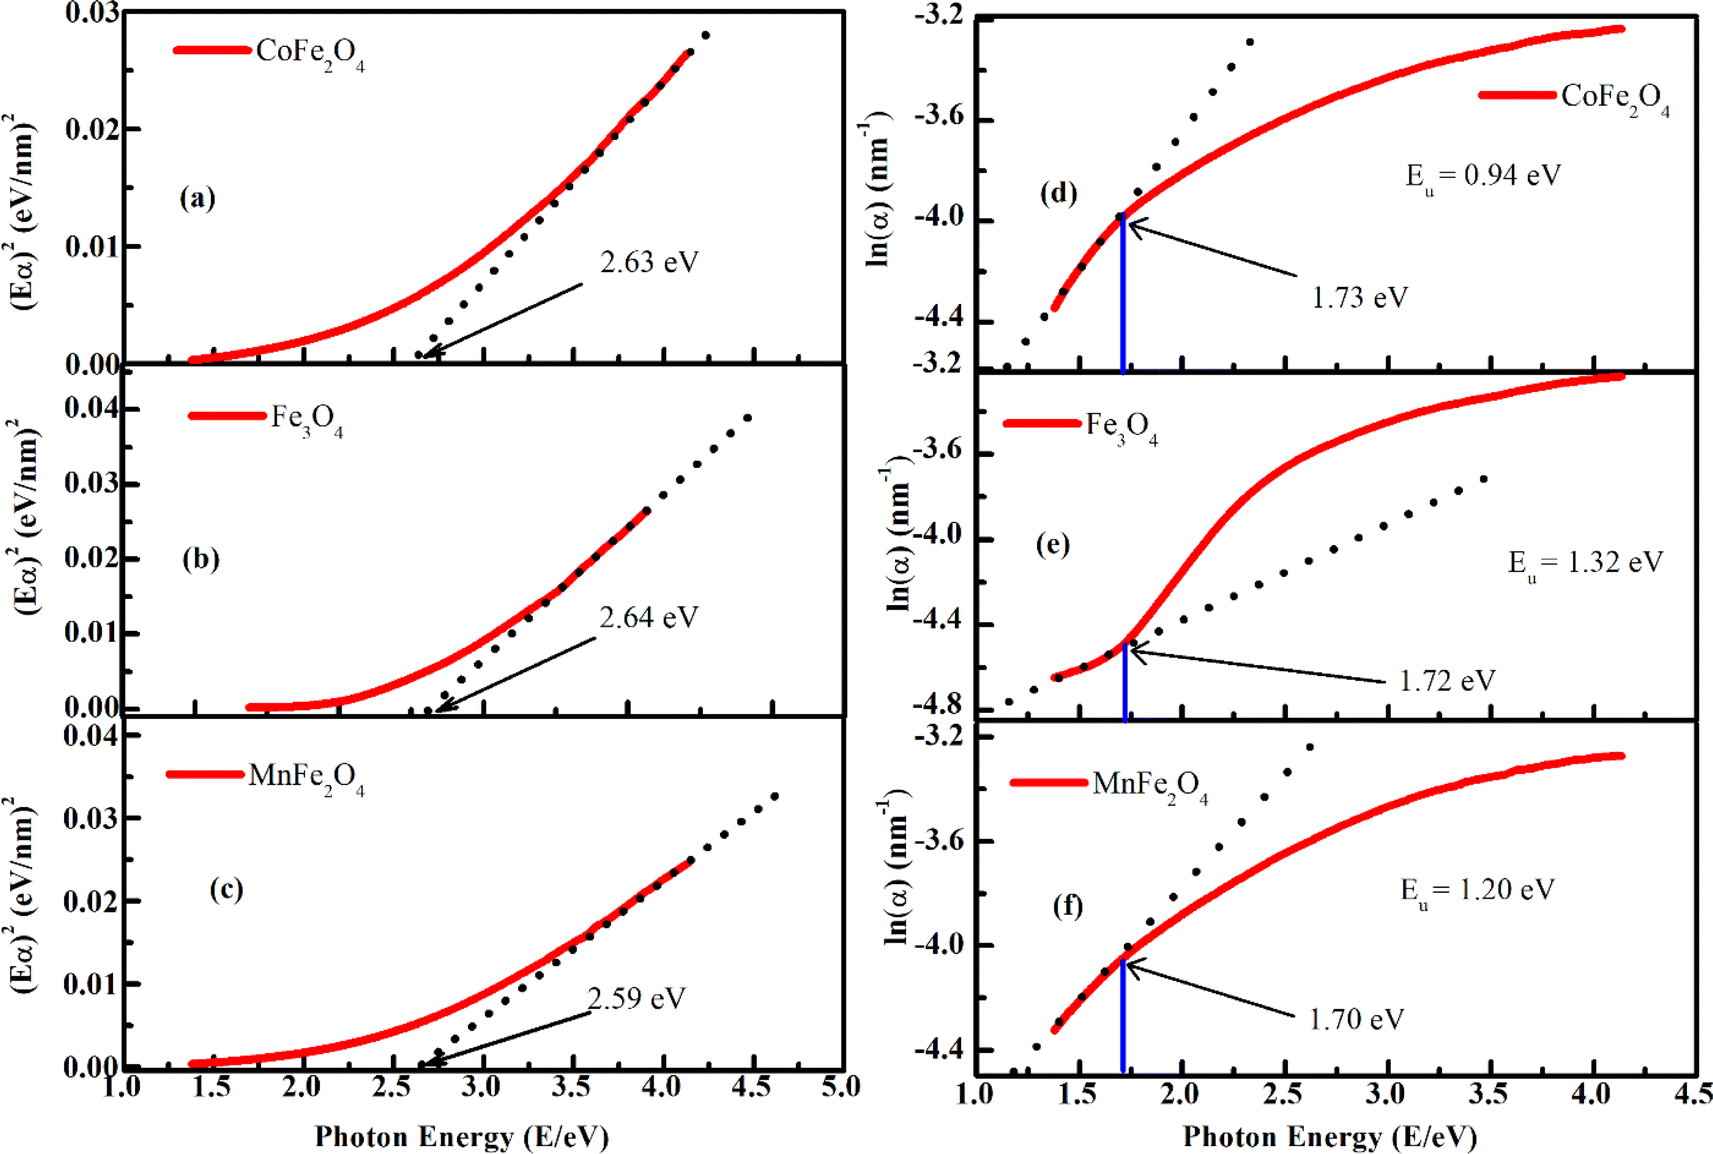
To investigate the optical-absorption properties of the materials, UV-Vis-NIR absorption spectra of the MFe2O4 NP samples were measured using a spectrophotometer (JASCO V-770) within the wavelength range of 300 nm to 900 nm. Fig. 7 shows the absorbance spectra of MFe2O4 NPs. As shown in Fig. 7, the Fe3O4 NPs exhibited an absorbance peak at 390 nm, following the finding of Zhao et al.21 Meanwhile, those of MnFe2O4 NPs were about 410 nm, and a wide absorbance band was observed for CoFe2O4 NPs. This result was due to the change in optical-energy bandgap and the effect of nanoferrites' surface roughness.48,49 The absorbance spectra were related to the electronic structure and were thus used to determine the relation of crystallite size to the optical bandgap. The optical energy bandgap of CoFe2O4, Fe3O4, and MnFe2O4 NPs were evaluated using the Tauc model50 with the help of UV-Vis data.where n represents the nature of transitions with n = 1/2 for allowed direct transitions and n = 2 for indirect transitions, respectively; A is a constant that depends on the transition probability, and Eg is the optical bandgap. Fig. 8(a–c) displays (αhν)2 vs. hν for the samples. Direct bandgap values were obtained by extrapolating the linear regions of these plots along the X-axis. The obtained bandgap energy was found to be 2.63, 2.64, and 2.59 eV for the CoFe2O4, Fe3O4, and MnFe2O4 NPs, respectively, showing a decrease in the bandgap from Fe3O4 to MnFe2O4. The decrease in bandgap energy was due to the size effect and the redistribution of anion ions from octahedral to tetrahedral sites. The obtained direct bandgap value of CoFe2O4 and Fe3O4 NPs were comparable with previously reported values.51–53 Fig. 8(d–f) shows the plot of the absorption coefficient (α) against photon energy for the three samples based on the absorbance data from Fig. 7. The absorption coefficient α is depicted by the relation54| |
 | (12) |
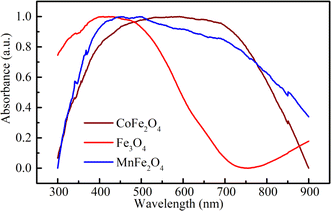
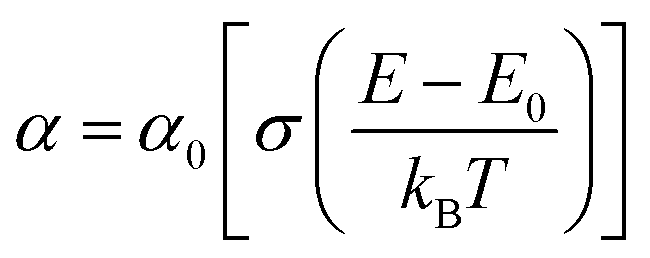
where α0, E, and E0 are the absorption coefficient, incident energy, and onset of absorption, respectively. Notably, α0 and E0 depends on the nature of the material. Eu = kBT/σ is specified as the Urbach energy (also known as Urbach “tail”), where σ is the steepness parameter and kB is the Boltzmann constant. Generally, the Urbach energy is governed by the crystal defect originating from thermal fluctuations, impurities, and crystalline-lattice disordering.20,55 The Urbach energy is determined from the reciprocal of the slope of the linear portion's fitting line in the ln(α) versus photon energy (hν) plot. The Urbach energy values obtained for CoFe2O4, Fe3O4, and MnFe2O4 were 0.94, 1.32, and 1.20 eV, respectively. Eu increased with decreased grain size, indicating that electrons experienced a larger extent of disorder while passing across the bandgap. Thus, the behavior of the optical bandgap was consistent with the characterization of Urbach energy. The Eu obtained for our samples also well agreed with those in the literature.21
 |
| | Fig. 7 Room temperature UV-Vis absorbance spectrum of MFe2O4 nanoparticles. | |
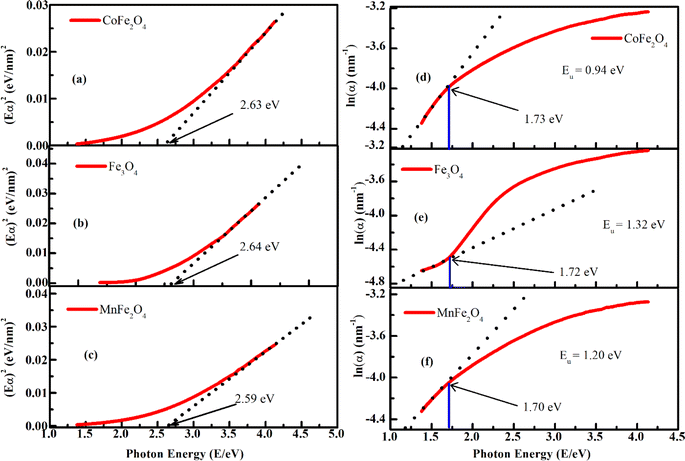 |
| | Fig. 8 (a–c) Plot of (Eα)2 vs. (hν), in which red line represents the experimental absorption spectra, and dashed black line is the fit to the linear portion of the data, where the intercept of that curve in the x-axis gives estimating the optical band gap and (d–f) the red line represents the experimental absorption curve, and dashed black line is the fit to the linear portion of the curve; and the Urbach energy and onset of absorption are calculated from the fitting for MFe2O4 nanoparticles. | |
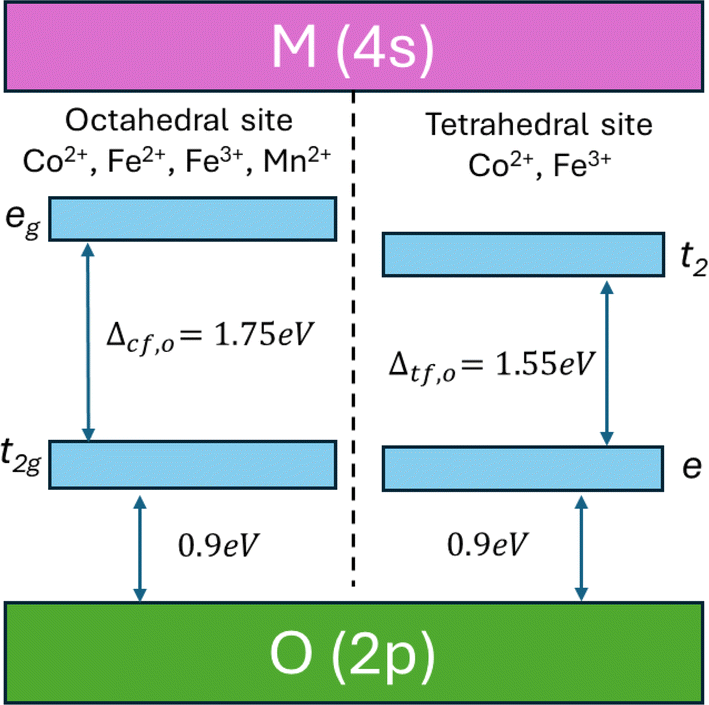
To study the energy-transfer mechanism of MFe2O4 NPs in detail, we proposed an energy-band structure model based on theoretical calculations from the literature20,21,56–60 and the results of our PL and UV-Vis measurements. According to Camphausen et al.,56 the energy gap between the O(2p) to the empty M(4s) in the 3d transition-metal oxides is about 6 eV, whereas Zaanen et al.57 found that this bandgap ranges within 4–6 eV. Between these bands is the octahedral and tetrahedral crystal-field energies generated from the orbitals of 3d metals. The splitting energy between lower t2g and higher eg levels in an octahedral crystal field is Δcf,O ∼1.75 eV, and those of lower e and higher t2 levels in a tetrahedral crystal field is Δcf,t ∼1.55 eV.58 Moreover, the energy gap between the t2g level (octahedral crystal field) and e level (tetrahedral crystal field) and the valence band of O(2p), respectively, approaches 0.9 eV.22,59,60 From the above analysis, the energy-band structure of MFe2O4 NPs is illustrated in Fig. 9. Using this approach, the bandgap values for the CoFe2O4 (2.63 eV), Fe3O4 (2.64 eV), and MnFe2O4 (2.59 eV) determined from the absorbance data (Fig. 8(a–c)) were consistent with the bandgap (∼2.65 eV) between the O(2p) and eg level of the octahedral site. Fig. 8(d–f) also shows that the onset of absorption was very close to the crystal-field splitting energy for the octahedral site (1.75 eV).
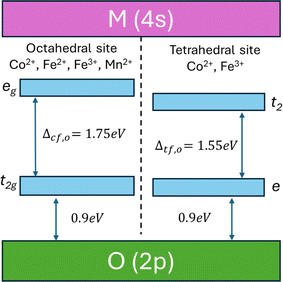 |
| | Fig. 9 Schematic of the energy bands for MFe2O4 system. | |
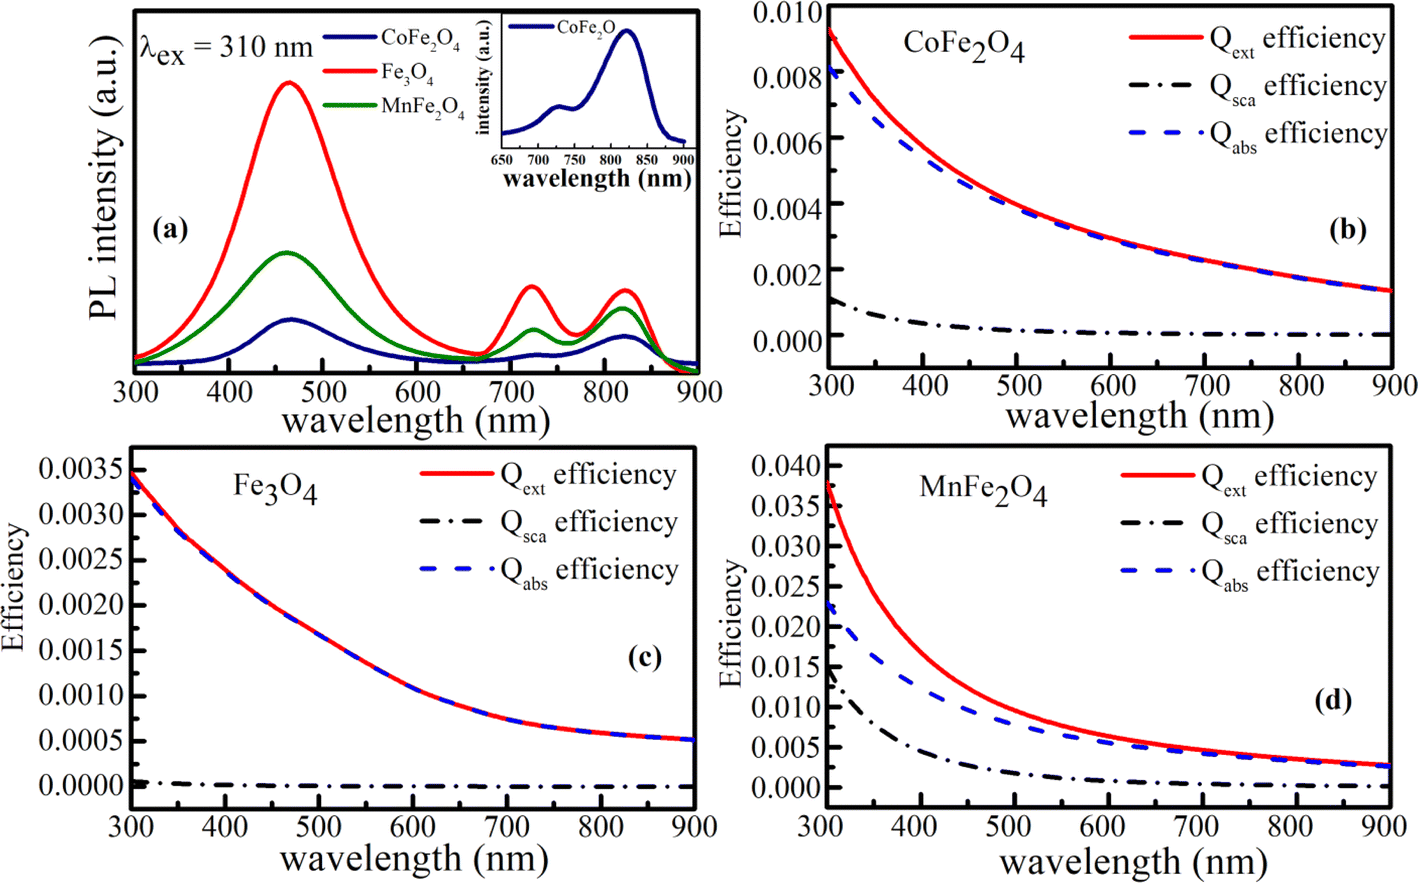
Sadat et al.20 obtained the PL spectra for 10 nm to 5 μm-sized Fe3O4 NPs. They found three main peaks near 565 nm (2.2 eV), 690 nm (1.79 eV), and 840 nm (1.47 eV) when the samples were illuminated with laser light at a wavelength of 407 nm (3.05 eV). They suggested that the peak at 565 nm is due to the radiative recombination of mobile electrons from t2g → eg on the octahedral site, the peak at 690 nm to the recombination of trapped electrons from the octahedral site to O(2p), and the peak at 840 nm to the electron traps on the tetrahedral site. These observations were consistent with the energy-band structure that they proposed. However, Zhao et al.21 observed only the peak at 674 nm (1.84 eV) for 10 nm-sized Fe3O4 NPs illuminated with a laser of 449 nm (2.76 eV). This large difference may be due to the influence of the quantum-confinement effect originating from the nanoscale of particle size and the use of dissimilar excitation light when measuring the PL spectra of Fe3O4.
PL measurements of MFe2O4 NPs were performed using Xe light under an excitation wavelength of 310 nm (4.0 eV). Fig. 10(a) depicts the PL spectra of CoFe2O4, Fe3O4, and MnFe2O4 NPs. As shown in Fig. 10(a), the emission spectrum at each sample primarily comprised three dominated clear emission peaks at around 469 nm (2.64 eV), 728 nm (1.70 eV), and 823 nm (1.51 eV). The peak of UV emission at around 469 nm was consistent with the energy gaps caused by the eg orbital of the octahedral site and the O(2p) level, whereas the visible peak at around 728 nm and NIR peak at around 823 nm were attributed to the crystal-field splitting energy for the octahedral and tetrahedral sites, respectively.
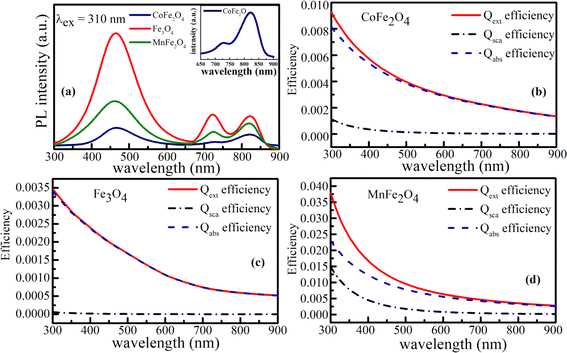 |
| | Fig. 10 Photoluminescence spectrum (a), the wavelength dependence of extinction (Qext), absorption (Qabs), scattering (Qsca) efficiencies (b–d) for MFe2O4 system. The values are calculated based to the Mie theory using the complex refractive indices of the samples. | |
According to Mie's theory, to evaluate the photothermal performance of a material, the ratio of absorption efficiency (Qabs) to extinction efficiency (Qext) needs to be analyzed and considered in detail, where Qext is the imaginary part of the complex refractive index, related to light absorption. Therefore, the absorption (Qabs), extinction (Qext), and scattering (Qsca) efficiencies as a function of wavelength for MFe2O4 NPs were calculated using equations:20,21
| |
 | (13a) |
| |
 | (13b) |
in which
an and
bn are the coefficients,

is the size parameter with
D being the mean radius of the particles,
nmed is the refractive index of the media, and
λ0 is the vacuum wavelength. Using the code “Mie-Plot” written by Philip Laven,
61 the numerical values of
Qext,
Qsca, and
Qabs were calculated as a function of wavelength for MFe
2O
4 NPs and are shown in
Fig. 10(b–d).
Fig. 10(b) reveals that the extinction efficiency of Fe
3O
4 NPs was mostly absorption-dominated, whereas those CoFe
2O
4 and MnFe
2O
4 NPs were not [
Fig. 10(b) and (d)]. Thus, CoFe
2O
4 and MnFe
2O
4 had lower
Qabs/
Qext than Fe
3O
4 (1.00) and less efficient photothermal performance. This finding was consistent with the fact that smaller particles have higher surface area, so photothermal heating is more efficient.
20 However, the scattering efficiency of MnFe
2O
4 exceeded those of CoFe
2O
4 and Fe
3O
4 owing to the difference in their grain size. This finding indicated good agreement with Mie's scattering theory because with decreased particle size, the pattern of the diffracted and scattered light spread away from the forward direction. Consequently, the larger grain size of MnFe
2O
4 contributed to a greater scattering efficiency.
3.5. Magnetic properties of MFe2O4 NPs
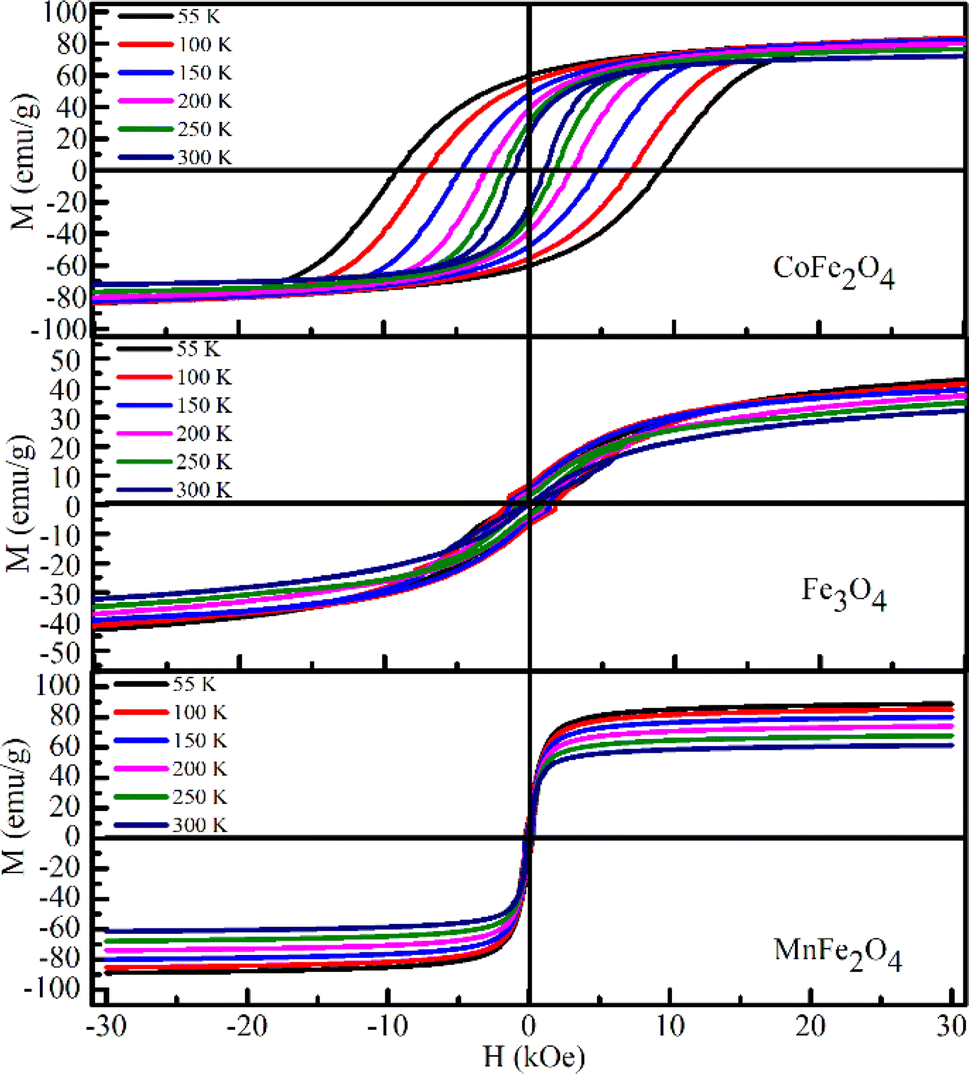
Magnetic measurements of the MFe2O4 NPs were performed at different temperatures. Fig. 11 shows the magnetization (M–H) loops (3 T ≤ H ≤ 3 T) measured at 55, 100, 150, 200, 250, and 300 K. The magnetic parameters of all three samples including saturation magnetization (Ms), remnant magnetization (Mr), coercivity (Hc), exchange bias field (Hex), effective anisotropy constant (Keff), and squareness ratio (R = Mr/Ms) at various temperatures were extracted from these hysteresis loops and are listed in Table 6. For CoFe2O4, the value of Ms at 55 K (83.58 emu g−1 or 3.51 μB) was slightly higher than the theoretical value of ideal inverted structural ferrite (3.0 μB per F.U.),62,63 bulk counterpart (80 emu g−1),62,63 and some nanosized CoFe2O4 samples in literature.62 The increment in Ms may be due to the distribution of Co and Fe ions at tetrahedral and octahedral sites compared with the ideal spinel structure. This was also confirmed by Ansari et al.14 in oleic acid-coated CoFe2O4, that is, even the organic coating does not significantly affect the high value of Ms in an inverted-structure CoFe2O4. For MnFe2O4, Ms was 88.87 emu g−1 (3.67 μB per F.U.) at 55 K, which was significantly higher than that of its bulk counterpart (3.3–4.5 μB per F.U.).64–68 Notably, Mn2+ has an isoelectronic configuration (3d5), which was zero crystal-field stabilization energy; thus, the influence of the inverse parameter on the magnetic properties of MnFe2O4 was less pronounced than that of other spinel ferrites such as MgFe2O4 or Fe3O4.69 Consequently, similar to CoFe2O4, the Ms of MnFe2O4 was larger than those of an inverted structural spinel (3.0 μB per F.U.).64,65 In contrast to the above two samples, Ms at 55 K (59.22 emu g−1) of Fe3O4 was smaller than that of its bulk counterpart (90 emu g−1).70 This was due to the spin-canting phenomena originating from the enhancement in the surface-to-volume ratio of the smaller-sized (9 nm) Fe3O4. This characteristic has been mentioned in most studies on the magnetic properties of nanosized Fe3O4.70 The value of Ms in our samples was consistent with the change in the value of bond angles determined in Section 3.1. As shown in Table 5, the decrease in bond angle θ3 and increase in length between the metal ions at the octahedral site and anion (p) for Fe3O4 indicated the weakening of the B–B interaction. Likewise, the bond angle θ5 for Fe3O4 increased, again confirming a weak interaction between A–B and A–A. Therefore, according to ref. 71, Ms of Fe3O4 was smaller than that of the remaining samples. Table 6 reveals that the Hc of all samples monotonically decreased with increased temperature.
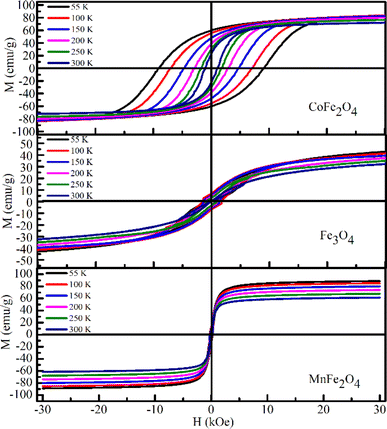 |
| | Fig. 11 M(H) loops measured at different temperatures for the MFe2O4 system. | |
Table 6 Saturation magnetization (Ms), remnant magnetization (Mr), coercivity (Hc) exchang bias field (Hex), effective anisotropy constant (Keff), squareness ratio (Mr/Ms) and a magnetic grain size (Dm) at various temperature of MFe2O4 nanoparticles
| Sample |
Temp. (K) |
Ms (emu g−1) |
Ms (μB) |
Mr (emu g−1) |
Hc (Oe) |
Hex (Oe) |
Keff (erg cm−3) |
Mr/Ms |
Hdip (kOe) |
Dm (nm) |
| CoFe2O4 |
55 |
83.58 |
3.51 |
59.74 |
9129.04 |
191.52 |
6.25 × 10⁶ |
0.71 |
0.29 |
5.6 |
| 100 |
83.48 |
3.51 |
54.59 |
6902.64 |
55.86 |
4.72 × 10⁶ |
0.66 |
0.38 |
6.2 |
| 150 |
82.47 |
3.46 |
47.13 |
4782.10 |
69.70 |
3.23 × 10⁶ |
0.58 |
0.55 |
7.0 |
| 200 |
80.07 |
3.36 |
38.09 |
3024.39 |
7.98 |
1.98 × 10⁶ |
0.48 |
0.87 |
8.2 |
| 250 |
76.59 |
3.22 |
29.02 |
1843.36 |
7.98 |
1.16 × 10⁶ |
0.39 |
1.43 |
9.9 |
| 300 |
72.06 |
3.03 |
22.26 |
1015.72 |
21.32 |
5.99 × 10⁵ |
0.31 |
2.60 |
12.3 |
| Fe3O4 |
55 |
59.22 |
2.45 |
9.24 |
233.02 |
−9.00 |
1.13 × 10⁵ |
0.16 |
138.47 |
23.0 |
| 100 |
58.18 |
2.41 |
6.88 |
167.12 |
11.00 |
7.98 × 10⁴ |
0.12 |
193.07 |
25.8 |
| 150 |
56.54 |
2.34 |
5.45 |
136.50 |
0.50 |
6.34 × 10⁴ |
0.10 |
236.38 |
27.9 |
| 200 |
54.39 |
2.25 |
4.32 |
94.01 |
2.00 |
4.20 × 10⁴ |
0.08 |
343.22 |
32.0 |
| 250 |
51.88 |
2.15 |
4.36 |
94.02 |
3.00 |
4.01 × 10⁴ |
0.08 |
343.18 |
32.5 |
| 300 |
48.88 |
2.03 |
0.63 |
41.32 |
3.00 |
1.65 × 10⁴ |
0.01 |
780.89 |
43.6 |
| MnFe2O4 |
55 |
88.87 |
3.67 |
13.40 |
266.00 |
4.00 |
1.84 × 10⁵ |
0.15 |
1.67 |
22.8 |
| 100 |
85.29 |
3.52 |
11.80 |
243.50 |
3.50 |
1.62 × 10⁵ |
0.14 |
1.82 |
23.7 |
| 150 |
80.05 |
3.31 |
9.17 |
198.50 |
1.50 |
1.24 × 10⁵ |
0.11 |
2.24 |
26.0 |
| 200 |
74.10 |
3.06 |
9.17 |
177.50 |
0.50 |
1.08 × 10⁵ |
0.12 |
2.37 |
27.2 |
| 250 |
67.86 |
2.80 |
8.73 |
138.50 |
2.50 |
9.44 × 10⁴ |
0.13 |
2.49 |
28.4 |
| 300 |
61.52 |
2.54 |
7.51 |
118.00 |
1.00 |
8.06 × 10⁴ |
0.12 |
2.64 |
30.0 |
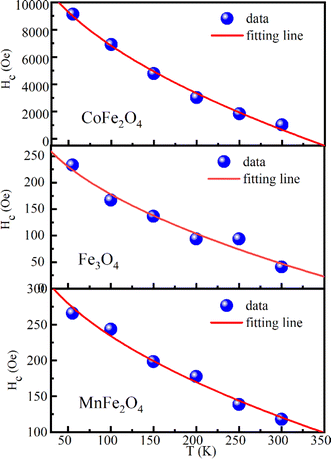
Furthermore, the coercivity values of CoFe2O4, Fe3O4, and MnFe2O4 at 55 K reached 9.13 kOe, 233 Oe, and 266 Oe, respectively. For CoFe2O4, Hc was remarkably higher than that for bulk CoFe2O4 (∼5 kOe at 5 K),72 whereas the low coercivity of Fe3O4 and MnFe2O4 indicated the soft magnetic nature of two these samples. The temperature variation of Hc for three samples can be fitted according to Keller's law, i.e.,
| | |
Hc = Hc0[1 − (T/TB)1/2]
| (14) |
where
Hc0 is coercivity at 0 K and
TB is the blocking temperature. The experimental data and fitting curves for CoFe
2O
4, Fe
3O
4 and MnFe
2O
4 are revealed in
Fig. 12.
Hc0 was 15
230, 356, and 389 Oe for CoFe
2O
4, Fe
3O
4 and MnFe
2O
4, respectively, and their
TB values were 328, 399 and 630 K, respectively. The good fitting according to Keller's law proved that three samples were non-interacting, randomly oriented spherical particles with cubic anisotropy. Thus, the relationship among coercivity, saturation magnetization, and effective anisotropy constant (
Keff) can be given by the formula
Hc = 0.64
Keff/
Ms. The obtained
Keff values are listed in
Table 6. The effective anisotropy constant values at 55 K were compatible with those of CoFe
2O
4, Fe
3O
4, and MnFe
2O
4 published in the literature.
73–75 Indeed, according to the Stoner–Wohlfarth (SW) model,
76 if
R < 0.5, magnetostatic interactions between particles would dominate, whereas if
R = 0.5, the particles would have no exchange–coupling and become randomly oriented uniaxial anisotropic ferromagnets. Finally, 0.5 <
R < 1.0 confirmed the existence of exchange–coupling between particles. Therefore, from the low value of
R (<0.2), we assumed that the interaction was much stronger between MnFe
2O
4 and Fe
3O
4 particles
77 and that the particle assembly was multidomain.
71 Accordingly, the SW model was less relevant for MnFe
2O
4 and Fe
3O
4 NPs. CoFe
2O
4 is known to exhibit cubic magnetic anisotropy with the first crystalline magnetic anisotropy constant
K1 > 0, so the theoretical value of
R should be 0.832. However,
R in our CoFe
2O
4 sample was smaller than the theoretical value, so we inferred that the contribution of surface spins to the value of
Keff was negligible. Thus, the SW model was less consistent for explaining the high values of
Hc and
Keff in this case. These findings indicated that for our MFe
2O
4 samples, surface anisotropy and dipole interactions were the main factors affecting
Hc and
Keff.
 |
| | Fig. 12 Temperature dependence of coercivity (solid circle) and the fitting line according to Kneller's law (solid black line) for MFe2O4 samples. | |
To evaluate in more detail the role of these factors on the magnetic properties of the system, their magnetic grain volume (Vm) is calculated by the formula Vm = 25kBTB/Keff,78 where kB is the Boltzmann constant. Subsequently, the diameters of magnetic grains (Dm) for the three samples, respectively, were obtained; results are listed in Table 6. Table 6 shows that Dm increased monotonically with temperature. Moreover, the Dm of both CoFe2O4 and MnFe2O4 samples were smaller than the average physical size, indicating the significant influence of canted surface spins around CoFe2O4 and MnFe2O4 NPs; whereas Dm of Fe3O4 NPs were larger than the average size because of the collective behavior of several particle moments stimulated by the dipole–dipole interparticle interactions.73 Thus, for CoFe2O4 and MnFe2O4 NPs, the Keff mainly originates from the surface spins. Conversely, for Fe3O4 NPs, surface spins do not provide Keff but those induce magnetocrystalline anisotropy and dipole interaction. The strength of dipolar interparticle interactions for MFe2O4 samples was calculated using the maximum dipolar field Hdip between nearest-neighbor particles through the relation Hdip = 2μ/d3, in which μ is the particle moment (μ = Ms × Vm) and d is the distance between the centers of two particles.79 The Hdip parameters obtained for the samples are presented in Table 6. Notably, Hdip for Fe3O4 was larger than that for the remaining samples, indicating that Hdip increased rapidly for larger-sized magnetic particles. Given that the magnetic particle size of Fe3O4 was larger than that of MnFe2O4 and CoFe2O4, more canted surface spins occurred around the CoFe2O4 and MnFe2O4 particles. Thus, the surface anisotropy in Fe3O4 was weaker than that of MnFe2O4 and CoFe2O4. Meanwhile, the smaller values of Hdip in CoFe2O4 and MnFe2O4 compared with that of Fe3O4 confirmed that the magnetocrystalline anisotropy was weaker and the dipole–dipole interaction was stronger in CoFe2O4 and MnFe2O4. However, a comparison of Hc and R for all three samples and the Hdip calculated for three samples suggested that the dipolar interactions between particles for MFe2O4 NPs were predominant. Fe3O4 and CoFe2O4 particles synthesized with organic precursors also show similar behaviors.14,73,79–81
4. Conclusions
MFe2O4 (M = Co, Fe, Mn) NPs were synthesized successfully using co-precipitation technique. The distribution of cations within interstitial sites was determined by X-ray diffraction, which showed that Co2+ and Fe3+ions were distributed over both A and B sites for CoFe2O4. Conversely, Fe2+ and Mn2+ ions occupied the tetrahedral site only for Fe2O4, and MnFe2O4, respectively. The cation distribution within A and B sites induced changes in structural parameters, such as mean radii of tetrahedral and octahedral sites, edge lengths, bond lengths, and bond angles in the unit cell of MFe2O4. SEM images showed that MFe2O4 NPs had a narrow size distribution with an average size of 14.7, 9.0, and 34.3 nm for CoFe2O4, Fe3O4, and MnFe2O4, respectively. The observation of doublet phenomena of characteristic Raman peaks confirmed the feature of the inverse or mixed spinel structure for MFe2O4 NPs. The optical energy bandgap calculated through UV-Vis spectroscopy was 2.63, 2.64, and 2.59 eV for CoFe2O4, Fe3O4, and MnFe2O4, respectively. Based on the bandgap energy determined from UV-Vis and PL measurements, the energy-band structure diagram of MFe2O4 was established, in which the bandgap energy determined from the PL spectrum corresponded with the crystal-field splitting energy for the octahedral (1.70 eV) and tetrahedral (1.51 eV) sites. The mechanism of photothermal behavior of MFe3O4 NPs was further determined based on the PL emission and UV-Vis spectra. Magnetic parameters such as coercivity, remanence, squareness ratio, and effective anisotropy constant were deduced from the magnetization loops under an applied magnetic field of 3 T ≤ H ≤ 3 T. The change in magnetic saturation of MFe2O4 samples was explained based on the cation distribution and A–A, A–B, and B–B interactions. The large coercivity and squareness ratio of CoFe2O4 corresponded with strong effective anisotropy primarily due to the surface spins. Meanwhile, the smaller coercivity and squareness ratio of MnFe2O4 and Fe3O4 resulted from the weaker anisotropy and stronger dipolar interaction.
Data availability
The data that support the findings of this study are available within the article.
Author contributions
Tran Dang Thanh: writing – original draft, review & editing, investigation, project administration. Tran Thi Ngoc Nha: writing – original draft, investigation. Tran Thi Ha Giang: investigation. Dang Ngoc Toan: resources, investigation. Pham Hong Nam: resources, investigation. Dinh Thanh Khan: resources, investigation. Do Hung Manh: writing – review & editing, investigation. Pham Thanh Phong: writing – review & editing, investigation.
Conflicts of interest
The authors confirm that there are no known conflicts of interest associated with this publication.
Acknowledgements
This work was supported by an excellent research team development program grant funded by the Vietnam Academy of Science and Technology (VAST) under Project Code NCXS01.04/22–24.
References
- C. N. R. Rao, A. Müller and A. K. Cheetham, Nanomaterials Chemistry: Recent Developments and New Directions, John Wiley & Sons, 2007 Search PubMed.
- P. P. Hong, V. H. Nguyen, N.-V. Nguyen and V. H. Nguyen, Directly electrospun copper ferrite CuFe2O4 nanofiber-based for gas classification, Adv. Nat. Sci.: Nanosci. Nanotechnol., 2024, 15, 025010, DOI:10.1088/2043-6262/ad4850.
- B. Lin, C. Tang, Z. Zheng, M. Zhang, Y. Huang, X. Yuan, X. Liu and Y. Wu, Efficient activation of peroxymonosulfate by Co/Cu co-substituted-ferrite and carbon composite for rapid degradation of tetracycline in aqueous phase: Performance evaluation and mechanisms, Chem. Eng. J., 2024, 488, 150858, DOI:10.1016/j.cej.2024.150858.
- T. N. N. Tran, D. N. Toan, P. H. Nam, Do H. Manh, D. T. Khan and P. T. Phong, Determine elastic parameters and nanocrystalline size of spinel ferrites MFe2O4 (M = Co, Fe, Mn, Zn) through X-ray diffraction and infrared spectrum: Comparative approach, J. Alloys Compd., 2024, 996, 174773, DOI:10.1016/j.jallcom.2024.174773.
- K. R. Desai, S. T. Alone, S. R. Wadgane, S. E. Shirsath, K. M. Batoo, A. Imran, E. H. Raslan, M. Hadi, M. F. Ijaz and R. H. Kadam, X-ray diffraction based Williamson–Hall analysis and Rietveld refinement for strain mechanism in Mg–Mn co-substituted CdFe2O4 nanoparticles, Phys. B, 2021, 614, 413054, DOI:10.1016/j.physb.2021.413054.
- P. H. Nam, N. X. Phuc, P. H. Linh, L. T. Lu, D. H. Manh and P. T. Phong, In-Ja Lee, Effect of zinc on structure, optical and magnetic properties and magnetic heating efficiency of Mn1-xZnxFe2O4 nanoparticles, Phys. B, 2018, 55, 428–435, DOI:10.1016/j.physb.2018.09.004.
- R. A. Pawar, S. M. Patange, Q. Y. Tamboli, V. Ramanathan and S. E. Shirsath, Spectroscopic, elastic and dielectric properties of Ho3+ substituted Co-Zn ferrites synthesized by sol-gel method, Ceram. Int., 2016, 42, 16096–16102, DOI:10.1016/j.ceramint.2016.07.122.
- D. K. Mondal, C. Borgohain, N. Paul and J. P. Borah, Tuning hyperthermia efficiency of MnFe2O4/ZnS nanocomposites by controlled ZnS concentration, J. Mater. Res. Technol., 2019, 8(6), 5659–5670, DOI:10.1016/j.jmrt.2019.09.034.
- T. Tatarchuk, M. Bououdina, J. Judith Vijaya and L. John Kennedy, Nanophysics, Nanomaterials, Interface Studies, and Applications, Selected Proceedings of the 4th International Conference Nanotechnology and Nanomaterials (NANO2016), August 24–27, 2016, Lviv, Ukraine, pp. 305–326 Search PubMed.
- O. Dehghani Dastjerdi, H. Shokrollahi and S. Mirshekari, A review of synthesis, characterization, and magnetic properties of soft spinel ferrites, Inorg. Chem. Commun., 2023, 153, 110797, DOI:10.1016/j.inoche.2023.110797.
- S. Hunpratub, S. Phokha, P. Kidkhunthod, N. Chanlek and P. Chindaprasirt, The effect of cation distribution on the magnetic properties of CoFe2O4 nanoparticles, Results Phys., 2021, 24, 104112, DOI:10.1016/j.rinp.2021.104112.
- R. S. Yadav, I. Kuřitka, J. Vilcakova, J. Havlica, J. Masilko, L. Kalina, J. Tkacz, J. Švec, V. Enev and M. Hajdúchová, Impact of grain size and structural changes on magnetic, dielectric, electrical, impedance and modulus spectroscopic characteristics of CoFe2O4 nanoparticles synthesized by honey mediated sol-gel combustion method, Adv. Nat. Sci.: Nanosci. Nanotechnol., 2017, 8(14pp), 045002, DOI:10.1088/2043-6254/aa853a.
- Y. Kumar, A. Sharma and P. M. Shirage, Impact of different morphologies of CoFe2O4 nanoparticles for tuning of structural, optical and magnetic properties, J. Alloys Compd., 2019, 778, 398–409, DOI:10.1016/j.jallcom.2018.11.128.
- S. M. Ansari, B. B. Sinha, D. Phase, D. Sen, P. U. Sastry, Y. D. Kolekar and C. V. Ramana, Particle Size,
Morphology, and Chemical Composition Controlled CoFe2O4 Nanoparticles with Tunable Magnetic Properties via Oleic Acid Based Solvothermal Synthesis for Application in Electronic Devices, ACS Appl. Nano Mater., 2019, 2, 1828–1843, DOI:10.1021/acsanm.8b02009.
- P. Chandramohan, M. P. Srinivasan, S. Velmurugan and S. V. Narasimhan, Cation distribution and particle size effect on Raman spectrum of CoFe2O4, J. Solid State Chem., 2011, 184, 89–96, DOI:10.1016/j.jssc.2010.10.019.
- Á. de Jesús Ruíz-Baltazar, S. Y. Reyes-López and R. Pérez, Magnetic structures synthesized by controlled oxidative etching: Structural characterization and magnetic behavior, Results Phys., 2017, 7, 1828–1832, DOI:10.1016/j.rinp.2017.05.001.
- Z. Z. Lazarevic, C. Jovalekic, A. Milutinovic, D. Sekulic, V. N. Ivanovski, A. Recnik, B. Cekic and N. Z. Romcevic, Nanodimensional spinel NiFe2O4 and ZnFe2O4 ferrites prepared by soft mechanochemical synthesis, J. Appl. Phys., 2013, 113, 187221, DOI:10.1063/1.4801962.
- A. Ahlawat and V. G. Sathe, Raman study of NiFe2O4 nanoparticles, bulk and films: effect of laser power, J. Raman Spectrosc., 2011, 42, 1087, DOI:10.1002/jrs.2791.
- M. H. Sousa, F. A. Tourinho and J. C. Rubim, Use of Raman micro-spectroscopy in the characterization of MIIFe2O4 (M = Fe, Zn) electric double layer ferrofluids, J. Raman Spectrosc., 2000, 31, 185, DOI:10.1002/(SICI)1097-4555(200003).
- M. E. Sadat, M. K. Baghbador, A. W. Dunn, H. P. Wagner, R. C. Ewing, J. Zhang, H. Xu, G. M. Pauletti, D. B. Mast and D. Shi, Photoluminescence and photothermal effect of Fe3O4 nanoparticles for medical imaging and therapy, Appl. Phys. Lett., 2014, 105, 091903, DOI:10.1063/1.4895133.
- Y. Zhao, M. E. Sadat, A. Dunna, H. Xu, C. –H. Chen, W. Nakasuga, R. C. Ewing and D. Shi, Photothermal effect on Fe3O4 nanoparticles irradiated by white-light for energy-efficient window applications, Sol. Energy Mater. Sol. Cells, 2017, 161, 247–254, DOI:10.1016/j.solmat.2016.11.039.
- W. F. J. Fontijn, P. J. van der Zaag, L. F. Feiner, R. Metselaar and M. A. C. Devillers, A consistent interpretation of the magneto-optical spectra of spinel type ferrites (invited), J. Appl. Phys., 1999, 85, 5100, DOI:10.1063/1.369091.
- Do Hung Manh, T. T. N. Nha, L. T. H. Phong, P. H. Nam, D. T. Tran and P. T. Phong, Determination of the crystalline size of hexagonal La1−xSrxMnO3 (x = 0.3) nanoparticles from X-ray diffraction – a comparative study, RSC Adv., 2023, 13, 25007–25017, 10.1039/D3RA04018F.
- E. Ranjith Kumar, Ch. Srinivas, M. Deepty, I. Pradeep, M. V. K. Mehar, C. L. Prajapat, T. V. Chandrasekhar Rao, N. Krishna Mohan and D. L. Sastry, Synergistic effect of heat treatment on structural, magnetic and dielectric properties of spinel ferrite nanoparticles, J. Mater. Sci.: Mater. Electron., 2018, 29, 20968–20977, DOI:10.1007/s10854-018-0241-4.
- S. S. Jadhav, S. E. Shirsath, S. M. Patange and K. M. Jadhav, Effect of Zn substitution on magnetic properties of nanocrystalline cobalt ferrite, J. Appl. Phys., 2010, 108, 093920, DOI:10.1063/1.3499346.
- T. R. Tatarchuk, M. Bououdina, N. D. Paliychuk, I. P. Yaremiy and V. V. Moklyak, Structural characterization and antistructure modeling of cobalt-substituted zinc ferrites, J. Alloys Compd., 2017, 694(15), 777–791, DOI:10.1016/j.jallcom.2016.10.067.
- S. Jonak and J. P. Borah, Correlation between cation distribution and heating efficiency of annealed Fe3O4 nanoparticles, Mater. Today Commun., 2021, 26, 101789, DOI:10.1016/j.mtcomm.2020.101789.
- R. Saf, A. Ghasemi, R. Shoja-Razavi and M. Tavousi, The role of pH on the particle size and magnetic consequence of cobalt ferrite, J. Magn. Magn. Mater., 2015, 396, 288–294, DOI:10.1016/j.jmmm.2015.08.022.
- R. D. Shannon, Revised Effective Ionic Radii and Systematic Studies of Interatomic Distances in Halides and Chalcogenides, Acta Crystallogr., Sect. A: Cryst. Phys., Diffr., Theor. Gen. Crystallogr., 1976, 32, 751, DOI:10.1107/S0567739476001551.
- P. T. Phong, P. H. Nam, N. X. Phuc, B. T. Huy, L. T. Lu and D. H. Manh, In-Ja Lee, Optical, and Magnetic Properties of Mixed Co-Zn Ferrites Nanoparticles Synthesized by Low-Temperature Hydrothermal Method, Metall. Mater. Trans. A, 2019, 50, 1571–1581, DOI:10.1007/s11661-018-5096-z.
- T. Abbas, Y. Khan, M. Ahmad and S. Anwar, X-ray diffraction study of the cation distribution in the Mn-Zn ferrites, Solid State Commun., 1992, 82(9), 701–703, DOI:10.1016/0038-1098(92)90064-G.
- R. Sharma, P. Thakur, M. Kumar, N. Thakur, N. S. Negi, P. Sharma and V. Sharma, Improvement in magnetic behaviour of cobalt doped magnesium zinc nanoferrites via Co-precipitation route, J. Alloys Compd., 2016, 684, 569–581, DOI:10.1016/j.jallcom.2016.05.200.
- V. K. Lakhani, T. K. Pathak, N. H. Vasoya and K. B. Modi, Structural parameters and Xray Debye temperature determination study on copper-ferrite-aluminates, Solid State Sci., 2011, 13, 539–547, DOI:10.1016/j.solidstatesciences.2010.12.023.
- A. Monshi, M. R. Foroughi and M. R. Monshi, Modified Scherrer Equation to Estimate More Accurately Nano-Crystallite Size Using XRD, World J. Nano Sci. Eng., 2012, 2, 154–160, DOI:10.4236/WJNSE.2012.23020..
- S. B. Somvanshi, M. V. Khedkar, P. B. Kharat and K. M. Jadhav, Influential diamagnetic magnesium (Mg2+) ion substitution in nano-spinel zinc ferrite (ZnFe2O4): Thermal, structural, spectral, optical and physisorption analysis, Ceram. Int., 2020, 46(7), 8640–8650, DOI:10.1016/j.ceramint.2019.12.097.
- V. Blanco-Gutiérrez, E. Climent-Pascual, R. Sáez-Puchea and M. J. Torralvo-Fernándeza, Temperature dependence of superparamagnetism in CoFe2O4 nanoparticles and CoFe2O4/SiO2 nanocomposites, Phys. Chem. Chem. Phys., 2016, 18, 9186–9193, 10.1039/C6CP00702C.
- C. T. Yavuz, J. T. Mayo and W. W. Yu, et al., Low-field magnetic separation of monodisperse Fe3O4 nanocrystals, Science, 2006, 314, 964–967, DOI:10.1126/science.1131475.
- Y. W. Jun, Y. M. Huh and J. S. Choi, et al., Nanoscale size effect of magnetic nanocrystals and their utilization for cancer diagnosis via magnetic resonance imaging, J. Am. Chem. Soc., 2005, 127, 5732–5733, DOI:10.1021/ja0422155.
- P. T. Phong, L. H. Nguyen, L. T. H. Phong, P. H. Nam, D. H. Manh, I.-J. Lee and N. X. Phuc, Study of specific loss power of magnetic fluids with various viscosities, J. Magn. Magn. Mater., 2017, 428, 36–42, DOI:10.1016/j.jmmm.2016.12.008.
- T. Yamanaka and M. Ishii, Raman scattering and lattice vibrations of Ni2SiO4 spinel at elevated temperature, Phys. Chem. Miner., 1986, 13, 156–160, DOI:10.1007/BF00308157.
- T. Yu, Z. X. Shen, Y. Shi and J. Ding, Cation migration and magnetic ordering in spinel CoFe2O4: micro-Raman scattering study, J. Phys.: Condens. Matter, 2002, 14, L613–L618, DOI:10.1088/0953-8984/14/37/101.
- M. P. Dojcinovic, Z. Z. Vasiljevic, V. P. Pavlovic, D. Barisic, D. Pajic, N. B. Tadic and M. V. Nikolic, Mixed Mg–Co spinel ferrites: Structure, morphology, magnetic and photocatalytic properties, J. Alloys Compd., 2021, 855(1), 157429, DOI:10.1016/j.jallcom.2020.157429.
- J. L. Verble, Temperature-dependent light-scattering studies of the Verwey transition and electronic disorder in magnetite, Phys. Rev. B: Solid State, 1974, 9(12), 5236–5248, DOI:10.1103/PhysRevB.9.5236.
- H. Cynn, S. K. Sharma, T. F. Cooney and M. Nicol, High-temperature Raman investigation of order-disorder behavior in the MgAl2O4 spinel, Phys. Rev. B: Condens. Matter Mater.
Phys., 1992, 45(1), 500–502, DOI:10.1103/PhysRevB.45.500.
- C. Pernechele, M. Solzi, M. Ghidini, E. Arisi, I. Bergenti and V. Dediu, Magnetic behaviour of hybrid magnetite/organic semiconductor bilayers, J. Phys. D: Appl. Phys., 2008, 41, 134013, DOI:10.1088/0022-3727/41/13/134013.
- A. Ahlawat and V. G. Sathe, Raman study of NiFe2O4 nanoparticles, bulk and films: effect of laser power, J. Raman Spectrosc., 2011, 42, 1087, DOI:10.1002/jrs.2791.
- W. Wang, Z. Ding, X. Zhao, S. Wu, F. Li, M. Yue and J. Ping Liu, Microstructure and magnetic properties of MFe2O4 (M = Co, Ni, and Mn) ferrite nanocrystals prepared using colloid mill and hydrothermal method, J. Appl. Phys., 2015, 117, 17A328, DOI:10.1063/1.4917463.
- P. Chand, S. Vaish and P. Kumar, Structural, optical and dielectric properties of transition metal (MFe2O4; M= Co, Ni and Zn) nanoferrites, Phys. B, 2017, 524, 53–63, DOI:10.1016/j.physb.2017.08.060.
- A. S. Ahmed, M. M. Shafeeq, M. L. Singla, S. Tabassum, A. H. Naqvi and A. Azam, Band gap narrowing and fluorescence properties of nickel doped SnO2 nanoparticles, J. Lumin., 2010, 131, 1–6, DOI:10.1016/j.jlumin.2010.07.017.
- J. Tauc, Amorphous and Liquid Semiconductors, ed. J. Tauc, Plenum, New York, 1974, ch. 4 Search PubMed.
- M. Sundararajan, L. John Kennedy, J. Judith Vijaya and U. Aruldoss, Microwave combustion synthesis of Co1-xZnxFe2O4 (0 ≤ x ≤ 0.5): structural, magnetic, optical and vibrational spectroscopic studies, Spectrochim. Acta, Part A, 2015, 140, 421–430, DOI:10.1016/j.saa.2014.12.035.
- M. Srivastava, J. Singh, M. Yashpal, D. K. Gupta, R. K. Mishra, S. Tripathi and A. K. Ojha, Synthesis of superparamagnetic bare Fe3O4 nanostructures and core/shell (Fe3O4/alginate) nanocomposites, Carbohydr. Polym., 2012, 89, 821–829, DOI:10.1016/j.carbpol.2012.04.016.
- M. A. Shilpa Amulya, H. P. Nagaswarupa, M. R. Anil Kumar, C. R. Ravikumar and K. B. Kusuma, Sonochemical synthesis of MnFe2O4 nanoparticles and their electrochemical and photocatalytic properties, J. Phys. Chem. Solids, 2021, 148, 109661, DOI:10.1016/j.jpcs.2020.109661.
- F. Urbach, The Long-Wavelength Edge of Photographic Sensitivity and of the Electronic Absorption of Solids, Phys. Rev., 1953, 92, 1324, DOI:10.1103/PhysRev.92.1324.
- S. M. Wasim, C. Rincon, G. Marin, P. Bocaranda, E. Hernandez, I. Bonalde and E. Medina, Effect of structural disorder on the Urbach energy in Cu ternaries, Phys. Rev. B: Condens. Matter Mater. Phys., 2001, 64, 195101, DOI:10.1103/PhysRevB.64.195101.
- D. L. Camphausen, J. M. D. Coey and B. K. Chakraverty, One-Electron Energy Levels in Fe304, Phys. Rev. Lett., 1972, 29, 657, DOI:10.1103/PhysRevLett.29.657.
- J. Zaanen, G. A. Sawatzky and J. W. Allen, Band gaps and electronic structure of transition-metal compounds, Phys. Rev. Lett., 1985, 55, 418, DOI:10.1103/PhysRevLett.55.418.
- S. F. Alvarado, M. Erbudak and P. Munz, Final-state effects in the 3d photoelectron spectrum of Fe3O4 and comparison with FexO, Phys. Rev. B: Solid State, 1976, 14, 2740, DOI:10.1103/PhysRevB.14.2740.
- C. Boxall, G. Kelsall and Z. Zhang, Photoelectrophoresis of colloidal iron oxides. Part 2.—Magnetite (Fe3O4), J. Chem. Soc., Faraday Trans., 1996, 92, 791, 10.1039/FT9969200791.
- I. Balberg and H. L. Pinch, The optical absorption of iron oxides, J. Magn. Magn. Mater., 1978, 7, 12, DOI:10.1016/0304-8853(78)90138-5.
- P. Laven, MiePlot, http://www.philiplaven.com/mieplot.htm Search PubMed.
- B. Cai, M. Zhao, Y. Ma, Z. Ye and J. Huang, Bioinspired Formation of 3D Hierarchical CoFe2O4 Porous Microspheres for Magnetic-Controlled Drug Release, ACS Appl. Mater. Interfaces, 2015, 7, 1327–1333, DOI:10.1021/am507689a.
- Y. Kumar, A. Sharma and P. M. Shirage, Impact of different morphologies of CoFe2O4 nanoparticles for tuning of structural, optical and magnetic properties, J. Alloys Compd., 2019, 778, 398–409, DOI:10.1016/j.jallcom.2018.11.128.
- J.-R. Huang and C. Cheng, Cation and magnetic orders in MnFe2O4 from density functional calculations, J. Appl. Phys., 2013, 113, 33912, DOI:10.1063/1.4776771.
- Z. Simsa and V. Brabers, Influence of the degree of inversion on magnetic properties of MnFe2O4, IEEE Trans. Magn., 1975, 11, 1303–1305, DOI:10.1109/TMAG.1975.1058861.
- G. Balaji, N. Gajbhiye, G. Wilde and J. Weissmüller, Magnetic properties of MnFe2O4 nanoparticles, J. Magn. Magn. Mater., 2002, 242–245, 617–620, DOI:10.1016/S0304-8853(01)01043-5.
- M. Zheng, X. Wu, B. Zou and Y. Wang, Magnetic properties of nanosized MnFe2O4 particles, J. Magn. Magn. Mater., 1998, 183, 152–156, DOI:10.1016/S0304-8853(97)01057-3.
- Z. X. Tang, C. M. Sorensen, K. J. Klabunde and G. C. Hadjipanayis, Size-dependent Curie temperature in nanoscale MnFe2O4 particles, Phys. Rev. Lett., 1991, 67, 3602–3605, DOI:10.1103/PhysRevLett.67.3602.
- C. Simon, A. Blösser, M. Eckardt, H. Kurz, B. Weber, M. Zobel and R. Marschall, Magnetic properties and structural analysis on spinel MnFe2O4 nanoparticles prepared via non-aqueous microwave synthesis, Z. Anorg. Allg. Chem., 2021, 647, 2061–2072, DOI:10.1002/zaac.202100190.
- B. S. Corrêa, M. S. Costa, G. A. Cabrera-Pasca, C. Sena, R. H. Holanda Pinto, A. P. S. Silva, R. N. Carvalho Junior, L. Ishida, J. G. A. Ramon, R. S. Freitas, M. Saiki, I. T. Matos, E. L. Corrêa and A. W. Carbonari, High-saturation magnetization in small nanoparticles of Fe3O4 coated with natural oils, J. Nanopart. Res., 2020, 22, 68, DOI:10.1007/s11051-020-4761-5.
- S. N. Kane and M. Satalkar, Correlation between magnetic properties and cationic distribution of Zn0.85-xNixMg0.05Cu0.1Fe2O4 nano spinel ferrite: effect of Ni doping, J. Mater. Sci., 2017, 52, 3467–3477, DOI:10.1007/s10853-016-0636-7.
- S. Bhattacharyya, J. P. Salvetat, R. Fleurier, A. Husmann, T. Cacciaguerra and M. L. Saboungi, One Step Synthesis of Highly Crystalline and High Coercive Cobalt-ferrite Nanocrystals, Chem. Commun., 2005, 4818–4820, 10.1039/B509026A.
- S. T. Xua, Y. Q. Ma, G. H. Zheng and Z. X. Dai, Simultaneous effects of surface spins: rarely large coercivity, high remanence magnetization and jumps in the hysteresis loops observed in CoFe2O4 nanoparticles, Nanoscale, 2015, 7, 6520–6526, 10.1039/C5NR00582E.
- C. Iacovita, A. Florea, L. Scorus, E. Pall, R. Dudric, A. I. Moldovan, R. Stiufiuc, R. Tetean and C. M. Lucaciu, Hyperthermia, Cytotoxicity, and Cellular Uptake Properties of Manganese and Zinc Ferrite Magnetic Nanoparticles Synthesized by a Polyol-Mediated Process, Nanomaterials, 2019, 9, 1489, DOI:10.3390/nano9101489.
- K. D. Sattler, Handbook of Nanophysics: Nanomedicine and Nanorobotics, 2010, vol. 23, p. 11 Search PubMed.
- E. C. Stoner and E. P Wohlfarth, A Mechanism of Magnetic Hysteresis in Heterogeneous Alloys, Philos. Trans. R. Soc., A, 1948, 240, 599–642, DOI:10.1098/rsta.1948.0007.
- I. P. Muthuselvam and R. N. Bhowmik, Mechanical alloyed Ho3+ doping in CoFe2O4 spinel ferrite and understanding of magnetic nanodomains, J. Magn. Magn. Mater., 2010, 322, 767–776, DOI:10.1016/j.jmmm.2009.10.057.
- T. Hyeon, Y. Chung, J. Park, S. S. Lee, Y. W. Kim and B. H. Park, Synthesis of Highly Crystalline and Monodisperse Cobalt Ferrite Nanocrystals, J. Phys. Chem. B, 2002, 106, 6831–6833, DOI:10.1021/jp026042m.
- S. Laureti, G. Varvaro, A. M. Testa, D. Fiorani, E. Agostinelli, G. Piccaluga, A. Musinu, A. Ardu and D. Peddis, Magnetic interactions in silica coated nanoporous assemblies of CoFe2O4 nanoparticles with cubic magnetic anisotropy, Nanotechnology, 2010, 21(6pp), 315701, DOI:10.1088/0957-4484/21/31/315701.
- D. Peddis, F. Orru, A. Ardu, C. Cannas, A. Musinu and G. Piccaluga, Interparticle Interactions and Magnetic Anisotropy in Cobalt Ferrite Nanoparticles: Influence of Molecular Coating, Chem. Mater., 2012, 24, 1062–1071, DOI:10.1021/cm203280y.
- A. G. Roca, M. P. Morales, K. O'Grady and C. Serna, Structural and Magnetic Properties of Uniform Magnetite Nanoparticles Prepared by High Temperature Decomposition of Organic Precursors, Nanotechnology, 2006, 17, 2783–2788, DOI:10.1088/0957-4484/17/11/010.
|
| This journal is © The Royal Society of Chemistry 2024 |
Click here to see how this site uses Cookies. View our privacy policy here. 
 Open Access Article
 This Open Access Article is licensed under a Creative Commons Attribution-Non Commercial 3.0 Unported Licence
 cd,
Dinh Thanh Khane,
Do Hung Manh
cd,
Dinh Thanh Khane,
Do Hung Manh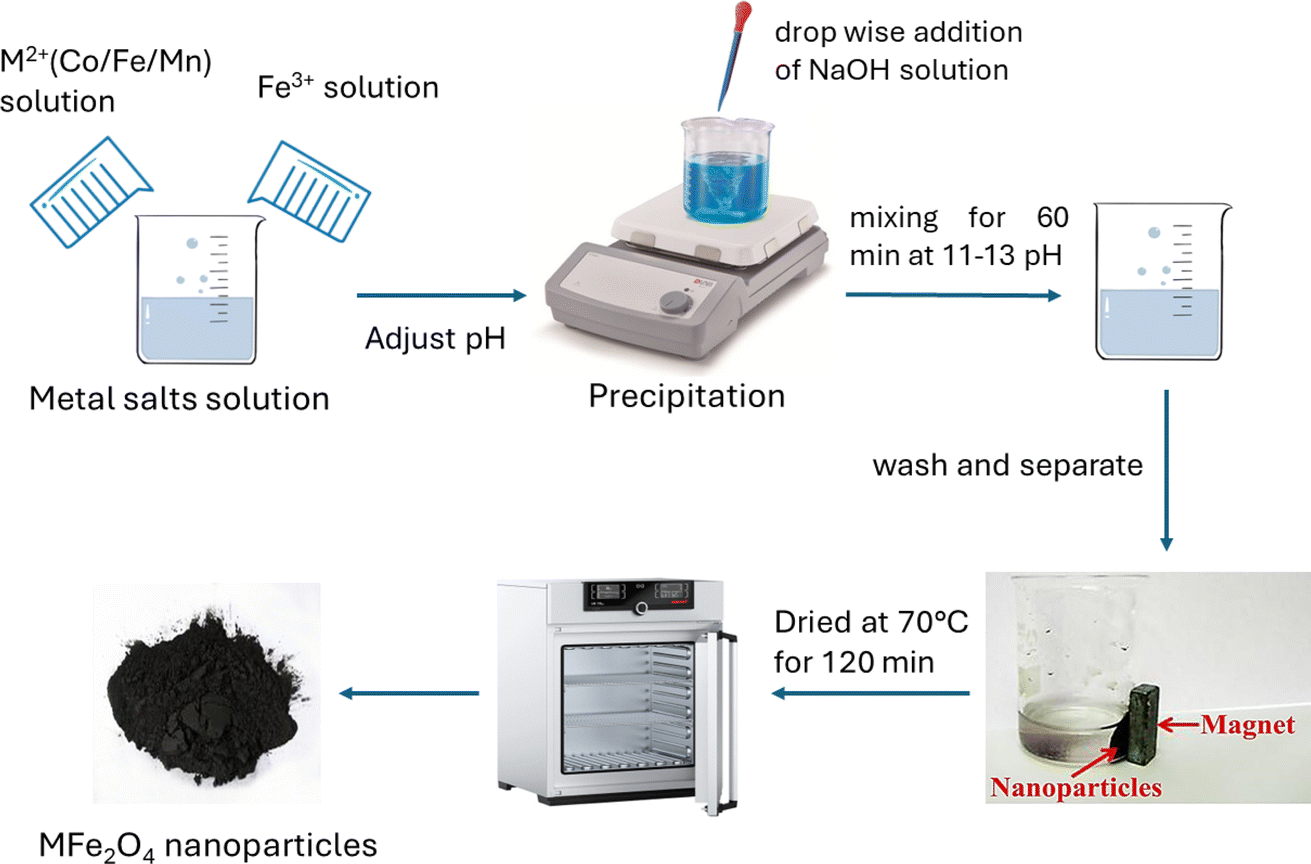
 and B site
  , crystalline grain diameter (d), grain size (D) of MFe2O4 nanoparticles


 and octahedral sites
  were determined based on the following cation distribution:
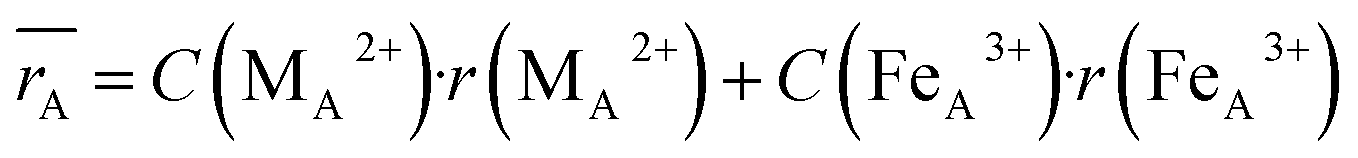
 values of three samples are shown in Table 1. The average ionic radius of the tetrahedral site was reduced whereas the average ionic radius of the octahedral site increased in the order Co > Fe > Mn ions in MFe2O4. This finding was because Fe3+ ions (0.49 Å) with a smaller ionic radius were replaced by Co2+ ions (0.58 Å) with a larger ionic radius. Conversely, in (B) sites, all Mn2+ ions (0.83 Å) and Fe2+ ions (0.78 Å) with larger ion radii migrated to the B site, so the average ion radius of the B site increased.


 graphs of the samples are drawn in Fig. 4. The obtained average crystallite size (D) was 14.5, 7.0, and 27.4 nm for CoFe2O4, Fe3O4, and MnFe2O4, respectively, as listed in Table 1. The large difference in crystal size between samples showed the role of pH and reaction time on phase formation and crystal size. This finding was consistent with that of Saf et al.28 They found that CoFe2O4 samples synthesized at low pH have smaller crystallite sizes with poor crystallinity, whereas CoFe2O4 samples synthesized at high pH have a larger crystallite size with a greater degree of crystallinity.
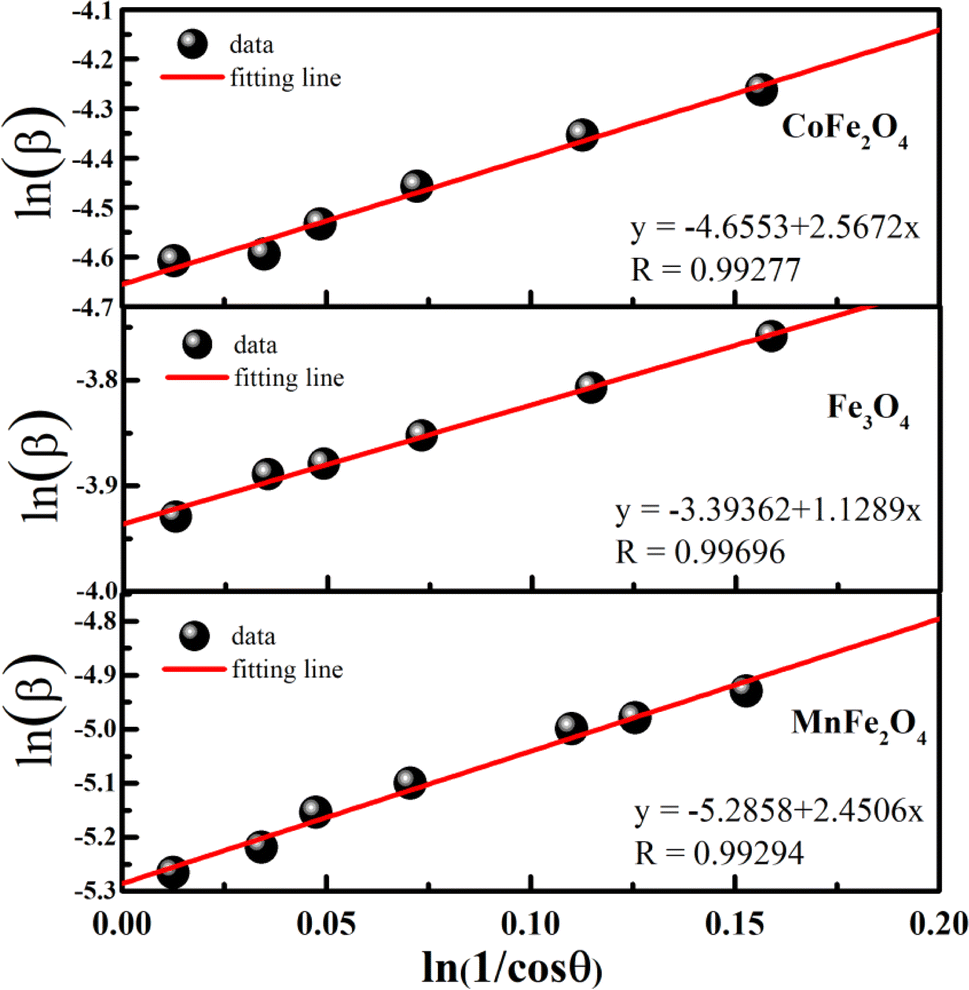

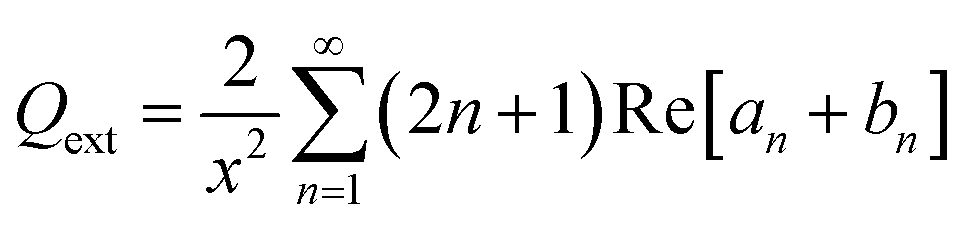
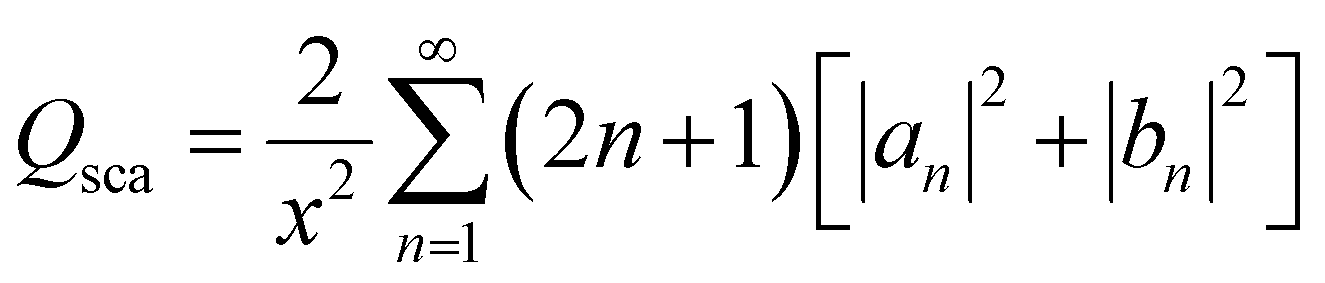
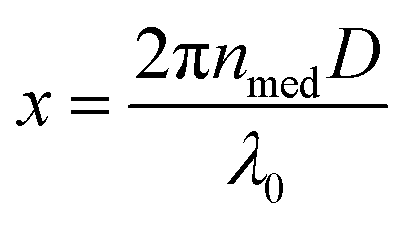 is the size parameter with D being the mean radius of the particles, nmed is the refractive index of the media, and λ0 is the vacuum wavelength. Using the code “Mie-Plot” written by Philip Laven,61 the numerical values of Qext, Qsca, and Qabs were calculated as a function of wavelength for MFe2O4 NPs and are shown in Fig. 10(b–d). Fig. 10(b) reveals that the extinction efficiency of Fe3O4 NPs was mostly absorption-dominated, whereas those CoFe2O4 and MnFe2O4 NPs were not [Fig. 10(b) and (d)]. Thus, CoFe2O4 and MnFe2O4 had lower Qabs/Qext than Fe3O4 (1.00) and less efficient photothermal performance. This finding was consistent with the fact that smaller particles have higher surface area, so photothermal heating is more efficient.20 However, the scattering efficiency of MnFe2O4 exceeded those of CoFe2O4 and Fe3O4 owing to the difference in their grain size. This finding indicated good agreement with Mie's scattering theory because with decreased particle size, the pattern of the diffracted and scattered light spread away from the forward direction. Consequently, the larger grain size of MnFe2O4 contributed to a greater scattering efficiency.