DOI:
10.1039/D4RA04715J
(Paper)
RSC Adv., 2024,
14, 28626-28637
Facile synthesis of NiSe2–ZnO nanocomposites for enhanced photocatalysis and wastewater remediation
Received
28th June 2024
, Accepted 24th August 2024
First published on 9th September 2024
Abstract
In this study, NiSe2 nanocubes, ZnO rods, and their composites were prepared by simple chemical methods to investigate their photocatalytic response and antibacterial activity. The optimal concentration of NiSe2 nanocubes was explored for enhanced photocatalytic performance by varying its percentage in the NiSe2–ZnO composites. The findings suggested that the optical response of ZnO was significantly improved and shifted towards visible region by incorporating NiSe2 as a co-catalyst. The photocatalytic properties of NiSe2, ZnO, and NiSe2–ZnO composites were assessed under visible light by using methylene blue (MB) as a model pollutant. The results showed that the optimized composite containing 75% NiSe2 with ZnO exhibited outstanding photocatalytic efficiency of 97%. The degradation of MB dye by NiSe2, ZnO, and their composites followed the pseudo-first-order reaction kinetics (Langmuir–Hinshelwood model). Furthermore, the prepared NiSe2–ZnO composite displayed exceptional reusability and stability over a number of cycles, demonstrating its practical applicability. This research presents unique findings, showcasing the comparative antibacterial performance of NiSe2, ZnO, and NiSe2–ZnO nanocomposites against Bacillus cereus (B. cereus). Of all the prepared photocatalysts, the 75% NiSe2–ZnO nanocomposite revealed the best performance, exhibiting an inhibition zone of 28 mm.
1. Introduction
Currently, two of the most serious global challenges faced by humans are rapid depletion of energy resources and environmental pollution. Organic dyes are commonly released into waterways by textile, painting, paper, and leather industries, causing serious environmental pollution.1–4 Azo dyes are the most commonly used dyes in the textile industry, which are highly soluble in water and are extremely harmful.5,6 These toxic organic dyes can be removed from waterways through traditional methods such as coagulation, desalination, reverse osmosis, filtration, adsorption, etc.7,8 However, these methods are usually ineffective to completely remove azo dyes from wastewater due to their inherent disadvantages, which also include the production of secondary harmful products.9 Photocatalysis, a low-cost technique, is considered a promising method for the removal of stable toxic organic dyes.10 This process usually involves heterogeneous catalysis, in which a light-harvesting catalyst is placed in contact with target reactants either in a liquid or a gas phase.4 This method has been successfully applied as an effective route for the degradation of a variety of toxic compounds, including numerous air and aquatic organic contaminants.11 For example, the removal of organic pollutants can occur at room temperature within a few hours by using active photocatalysts.12 Furthermore, organic pollutants could be entirely mineralized to non-toxic compounds such as CO2 and H2O without the creation of secondary harmful products.4,12 Zinc oxide (ZnO) is a versatile and functional material that has gained significant attention due to its unique optical, electronic, and photocatalytic properties.13 ZnO is a wide bandgap semiconductor that can efficiently absorb ultraviolet (UV) light and produce electrons and holes in its conduction and valence bands, respectively.14 This ability to produce charge carriers makes ZnO a promising material for photocatalytic applications.13 One of the main disadvantages of ZnO is its inefficient utilization of sunlight because it can only absorb UV light, which is only 4–5% of the solar spectrum.15 Thus, a large portion of the solar energy is not utilized by ZnO, which reduces the overall photocatalytic efficiency of ZnO and limits its potential applications for wastewater treatment.15 To overcome this disadvantage, researchers are exploring the use of ZnO in combination with other materials that can efficiently utilize visible light.
One of the most important aspects of photocatalysis is the recombination process of photo-generated charge carriers (electrons and holes).16 In addition, the bandgap of the material, electron mobility, and surface area of the material can all play a substantial role in the recombination of electron–hole pairs.17 The surface area of the material can also influence the recombination by increasing the probability of recombination via trap states or catalytic sites.18 Therefore, one of the most effective ways to improve the photocatalytic activity of ZnO is to enhance the above-mentioned parameters. This can be achieved by modifying the surface of ZnO with materials such as noble metals, transition metals, or metal oxide, as well as the usage of coupled semiconductors.19,20 Also, coupled semiconductors comprise of two different forms of energy-level systems that play a significant role in charge separation.21 Coupling heterogeneous semiconductor materials can decrease the band gap, increase the absorption coefficient range to the region of the visible spectrum, and cause electron–hole pair separation under visible light irradiation, leading to improved photocatalytic activity.22,23 The reduction of the bandgap coupled semiconductors can lead to improved electronic and optical properties, making them more useful for various applications.4 For instance, Ag/Mg-ZnO,24 and ZnO–MgO,25 etc. have been reported to photodegrade organic contaminants more effectively compared to their pure counterparts. Composite materials are utilized not just to enhance catalytic properties but can also be used for a variety of other applications including gas sensors and electric conductivity etc.26,27 NiSe2 is an interesting material that has gained significant interest of researchers due to its potential applications in energy storage, dye sensitized solar cells, electrocatalysts, etc.28 NiSe2 is a p-type semiconductor having a bandgap energy of around 1.9 eV.29 NiSe2 exhibits more metallic behavior than other Ni-based chalcogenides, such as sulfides and oxides.26 In addition, the fabrication of nickel-containing selenides is cost-effective and less toxic compared to other selenide-based materials such as cadmium or lead.30 The material also exhibits intrinsic electrical conductivity that facilitates electron conduction, making it an ideal candidate for hydrogen production via photocatalysis.30 Due to these factors, it may also be used as a co-catalyst for water splitting. In the last few decades, nickel-based selenides have been developed as effective materials for photocatalytic water-splitting processes.31,32 Recent studies have explored NiSe2-based nanocomposites, such as NiSe2/CdS, for their potential application in photocatalytic hydrogen production.33 Mn0.05Cd0.95S nanoparticles have been anchored onto cubic NiSe2 for efficient hydrogen production under photocatalytic conditions.34
Bacterial contamination of drinking water and food is another major global problem.35 Various pathogens are significant contributors to various infections and foodborne diseases, which pose a significant public health threat.36,37 Recently, metal oxides, including ZnO and TiO2, have gained considerable attention as highly effective antibacterial agents because of their impressive physical properties and remarkable stability.35 B. cereus is a commonly found Gram-positive, spore-forming bacterium that has the ability to grow in water bodies at different temperatures and pH levels.38 In addition, B. cereus spores are also resistant to typical toxic chemicals therefore, traditional methods are not very effective at inactivating them. B. cereus has been associated with several foodborne outbreaks in meat, vegetables, rice, and milk, particularly when food is cooked, cooled, and stored under inadequate refrigeration conditions.39–41 Symptoms of B. cereus related food poisoning include nausea, vomiting, abdominal pain, and diarrhea.39,42 B. cereus in dairy products can be identified and classified using a variety of traditional and advanced microbiological testing methods. As a result, these methods remain very complex and time-consuming.43 Nanomaterials are now often used to control bacterial growth as their smaller size enables them to penetrate through the cell membrane to kill the bacteria through several modes of action. Furthermore, after passing through the cell membrane, the reactive oxygen species (ROS) can initiate intracellular destruction by damaging the bacterial DNA, oxidation of the proteins, and peroxidation of lipids.44 With regard to its ability to kill B. cereus and various other prominent bacterial strains, the engineered ZnO nanostructures have been shown to exhibit highly impressive antimicrobial properties.41,45 For instance, Cu@ZnO nanocomposites revealed high antibacterial activities against Escherichia coli and B. cereus as compared to pure ZnO.46
Although widespread efforts have been made to boost the photocatalytic activity of ZnO by using various strategies, its coupling with NiSe2 has not yet been investigated to the best of our knowledge. By using NiSe2 as a co-catalyst, the ZnO–NiSe2 composites can form heterojunctions to facilitate the interfacial charge transfer, thus preventing the recombination of charge carriers. Additionally, the presence of NiSe2 in the composites can potentially shift the absorption edge towards the visible region and can induce a synergistic effect, which could lead to improved photocatalytic reactions. Therefore, it can be speculated that NiSe2 should be an effective co-catalyst to improve the photocatalytic performance of ZnO. In the present work, NiSe2, ZnO, and their composites were prepared by using a cost-effective wet chemical method. For the NiSe2–ZnO composite samples, the amount of NiSe2 was varied to determine the influence of NiSe2 on the structural, morphological, optical, and photocatalytic response of ZnO. Methylene blue (MB) dye, which is a non-biodegradable and harmful organic compound, is selected as the degradation target to assess the photocatalytic performances of the prepared samples under visible light irradiation. The photocatalytic response of the prepared samples for degradation efficiency followed the trend: 75% NiSe2–ZnO (97%) > 50% NiSe2–ZnO (82%) > 25% NiSe2–ZnO (73%) > ZnO (60%) > NiSe2 (50%). The 75% NiSe2–ZnO composite also revealed enhanced antibacterial performance against B. cereus.
2. Experimental
2.1. Material and methods
Elemental selenium powder (Se) 99.95%, nickel nitrate hexahydrate (Ni(NO3)2·6H2O) 97%, ethanol (C2H5OH) 99.8%, and methanol (CH3OH) 99.7% were purchased from Sigma Aldrich. Hydrazine hydrate (N2H4·H2O) 79–81% was supplied by Duksan, zinc acetate-dihydrate Zn(CH3COO)2·2H2O (99%) by Allied Signal, and sodium hydroxide (NaOH) 98% by Sigma Aldrich. All chemicals were utilized as received without any purification.
2.2. Synthesis of ZnO rods
The ZnO rods were prepared using a low-cost and simple sol–gel process. In a typical synthesis, 2.2 g of zinc acetate dihydrate (Zn(CH3COO)2·2H2O) and 8 g of sodium hydroxide (NaOH) were weighed using a measuring balance. After that, all the precursors were mixed in a beaker containing 100 mL of DI water and thoroughly stirred for a few minutes to obtain a homogeneous solution. The mixture was then transferred into a glass bottle, sealed tightly and heated at 90 °C for around 12 h. Next, the mixture was naturally cooled down to room temperature and then carefully washed with DI water and ethanol to obtain white precipitates followed by overnight drying in an oven at around 80 °C. The dried sample was then calcined at a high temperature, typically around 350 °C for 3 h, to yield the final ZnO product.
2.3. Preparation of NiSe2 nanocubes
For the synthesis of NiSe2 nanocubes, Se powder (0.52 g) was first added to a beaker containing hydrazine hydrate (4 mL) and sonicated for around 10 min. Nickel nitrate hexahydrate (0.96 g) was then added to the above solution, and the resulting mixture was sonicated for 30 min. After sonication, the mixture was poured into a stainless-steel Teflon-lined autoclave and placed in an oven at around 180 °C for 24 h. The autoclave was then allowed to cool down to room temperature and the resulting precipitates were centrifuged and washed several times with DI water and ethanol. After washing, the sample was dried in an oven for 24 h at 80 °C.
2.4. Preparation of ZnO–NiSe2 composites
A series of ZnO–NiSe2 composites were prepared by varying the weight percent ratios of NiSe2. Appropriate amounts of NiSe2 and ZnO were mixed in methanol (40 mL) to achieve a 25%, 50%, and 75% ratio of NiSe2 in the composites. The mixture was first sonicated and subsequently stirred for around 30 min. After stirring, the mixture was placed in an oven to dry at 60 °C for 18 h.
2.5. Characterization
For the structural and phase analysis, an X-ray diffractometer (P-XRD, Philips) was employed, with CuKα as a radiation source (λ = 0.154 nm). The diffraction patterns for all prepared samples were recorded in a 2θ range of 20°–80°. The surface morphology and microstructure of the prepared samples were investigated with the aid of a TESCAN-made (MAIA-3) field emission scanning electron microscope. Elemental identification of the NiSe2, ZnO, and their composites was performed through energy-dispersive X-ray spectroscopy. UV-Vis spectroscopy (U-4001, Hitachi) was used to examine the optical properties of the prepared nanocomposite samples.
2.6. Photodegradation studies
To evaluate the photocatalytic characteristics of NiSe2, ZnO, and NiSe2–ZnO composites, the degradation of organic pollutants such as methylene blue (MB) was carried out. The experiments were carried out in the presence of visible light illumination by employing Xenon lamp as a source (400 W). In addition, the experiments were performed in a wooden cabin which is designed to prevent external light from entering and affecting the photocatalytic process. Initially, 0.01 g of MB was dissolved in a beaker containing 100 mL of DI water to produce a homogenous solution. Then, 0.04 g of the photocatalyst was added in 1 ppm of MB solution in a beaker containing 100 mL of DI water. The mixture was magnetically stirred for 30 min without light so that adsorption/desorption equilibrium could be achieved. After 30 min of stirring in the dark, 3 mL of the suspended solution was extracted, its absorption data was recorded, and the reading was marked as zero min. The degradation of the solution was initiated by exposing it to light, 3 mL of the suspended solution was extracted at regular intervals of 30 min, and the samples were centrifuged and analyzed using UV-Vis spectroscopy. This process was repeated until the solution became colorless, indicating that MB dye had completely decomposed. To calculate the degradation efficiency of each sample, the following equation was used:| |
 | (1) |
where Ct represents the concentration of MB dye at any time ‘t’, C0 indicates the initial concentration.
2.7. Antibacterial studies
The culture media (LB broth) was prepared by adding 0.5 g of sodium chloride, 0.5 g of tryptone, and 0.25 g of yeast in 50 mL of water in a glass bottle, the media was sterilized for 1 h at 15 lbs of pressure at 121 °C. Following this, the media was cooled down in a laminar flow hood, and a disinfected wire loop-size stock strain was transferred into a test tube containing 10 mL of the above-prepared LB media. The cultured microorganism was added to the test tube, and covered with aluminum foil and then placed in an incubator at 37 °C for 24 h on an orbital shaker with continuous shaking. The agar disc diffusion method was used to evaluate the antibacterial activity of the prepared samples. B. cereus was inoculated on an LB agar Petri plate with a sterile cotton bud. The filter paper was cut into circular discs with a diameter of 6 mm. The autoclaved discs were dipped into a solution containing the synthesized samples (5 mg mL−1). The sample-coated discs were placed on the media inoculated with B. cereus in Petri dishes. The Petri plates were incubated for 24 h at 37 °C. After incubation, the average zone of inhibition surrounding the discs was measured.
3. Results and discussion
3.1. Structural, morphological, and elemental analysis
The phase and structural characteristics of the NiSe2, ZnO, and their composites with different NiSe2 content were investigated using XRD. Fig. 1a shows the XRD patterns of both ZnO and NiSe2 where the diffraction peaks of ZnO are observed at 2θ values of 31.70°, 34.47°, 36.27°, 47.45°, 56.48°, 62.73°, and 67.66°, which are assigned to the (100), (002), (101), (102), (110), (103), and (112) crystallographic planes, respectively. The diffraction pattern is in perfect agreement with the standard JCPDS No. 01-076-0704 for hexagonal wurtzite ZnO. The two small diffraction peaks at 2θ = 38.3° and 44.6° are attributed to the orthorhombic crystal structure of zinc hydroxide (JCPDS card No. 00-020-1435). The XRD pattern of NiSe2 also shows sharp diffraction peaks at 2θ = 25.92°, 29.77°, 33.62°, 36.99°, 42.88°, 45.17°, 50.82°, 55.51°, 57.80°, 62.13°, 70.18°, 72.47°, and 74.52°, which are indexed to the (111), (200), (210), (211), (220), (221), (311), (230), (321), (400), (420), (421) and (332) crystallographic planes, respectively. The observed pattern agrees with the JCPDS card No. 00-011-0552 and attributed to the cubic phase of NiSe2. The two small diffraction selenium peaks were also observed at 2θ = 23.4° and 41.22°, which are respectively assigned to the (100) and (110) crystal planes. The diffraction peaks due to selenium are in perfect agreement with the standard JCPDS No. 00-006-0362. XRD patterns of NiSe2–ZnO nanocomposites containing different amounts of NiSe2 are presented in Fig. 1b. The observed diffraction peaks could be indexed to the ZnO and cubic NiSe2, suggesting the successful coupling of ZnO with NiSe2. As expected, the peak intensity of NiSe2 increased with increasing the concentration of NiSe2 from 25% to 75%. The crystalline structure of the nanocomposites was found to be in good agreement with the standard JCPDS cards for ZnO and NiSe2 indicating the high quality of the synthesized nanocomposites. The sharp diffractions in the XRD patterns of NiSe2–ZnO nanocomposites confirm that the samples maintained their crystallinity during composite formation. By using the well-known Scherrer formula, the average crystallite sizes of NiSe2, ZnO, 25% NiSe2–ZnO, 50% NiSe2–ZnO and 75% NiSe2–ZnO nanocomposites were determined to be 24, 30, 35, 28, and 26 nm.
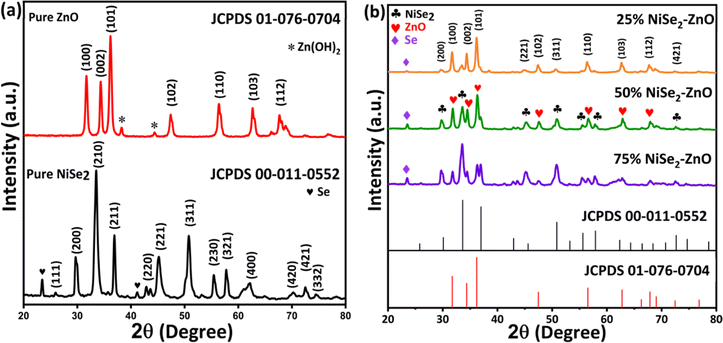 |
| | Fig. 1 XRD pattern of (a) pure ZnO and NiSe2 (b) 25% NiSe2–ZnO, 50% NiSe2–ZnO, and 75% NiSe2–ZnO nanocomposites. | |
Fig. 2 displays the FESEM images of pure ZnO, NiSe2, and their composites containing different concentrations of NiSe2. The morphological structure of ZnO is comprised of nanorods with random orientations, as presented in Fig. 2a. The average diameter of the nanorods was determined to be in the range of 70 nm. The FESEM image presented in Fig. 2b illustrates the morphology of NiSe2, which is comprised of cube-like structures. For the NiSe2–ZnO nanocomposites, FESEM images demonstrate the coexistence of both ZnO nanorods and NiSe2 cubes (Fig. 2c–e). The ratio of nanorods of ZnO and NiSe2 cubes appeared to be dependent on the NiSe2 content, as expected. For instance, the ratio of nanorods in the 25% NiSe2–ZnO composite is high as compared to nanocubes, due to the higher concentration of ZnO. Fig. 2(d) demonstrates a FESEM micrograph of 50% NiSe2–ZnO nanocomposites. The coexistence of nanorods of NiSe2 and nanocubes in almost equal amounts is attributed to the equal concentration of ZnO and NiSe2. In Fig. 2(e) the existence of NiSe2 cubes with few ZnO nanorods ultimately confirms the composition of the 75% NiSe2–ZnO nanocomposite.
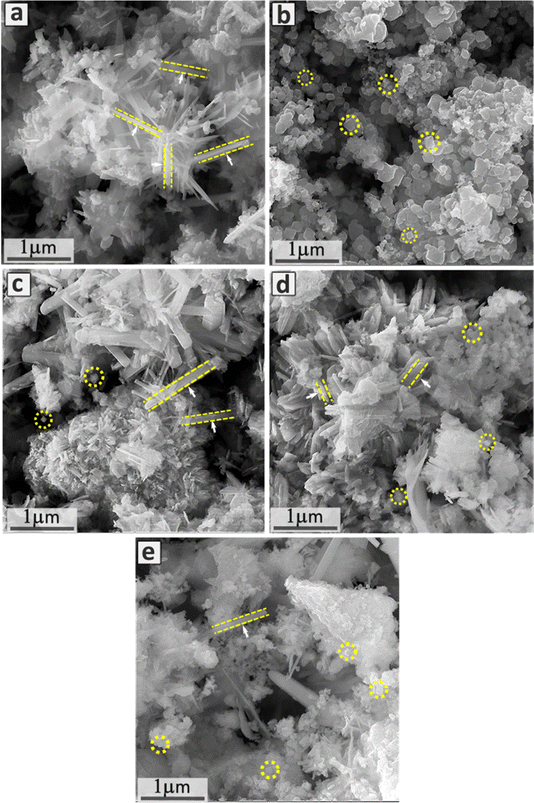 |
| | Fig. 2 FESEM images of (a) pure ZnO, (b) pure NiSe2, (c) 25% NiSe2–ZnO, (d) 50% NiSe2–ZnO, and (e) 75% NiSe2–ZnO nanocomposites. | |
EDX measurements were performed to validate the chemical composition of pure ZnO, NiSe2, and ZnO–NiSe2 composites, and the corresponding data is shown in Fig. 3. The EDX spectrum of pure ZnO revealed the emission of X-rays related to Zn and O elements as evident in Fig. 3a. Similarly, the EDX spectrum of pure NiSe2 shows the elemental peaks due to Ni and Se elements (Fig. 3b). In the case of the NiSe2–ZnO nanocomposites, the spectra comprised X-ray emissions associated with Ni, Zn, O, and Se as shown in Fig. 3(c)–(e). Peaks due to impurity elements or contaminations were not detected in the EDX spectra, thus certifying the elemental purity of the prepared materials.
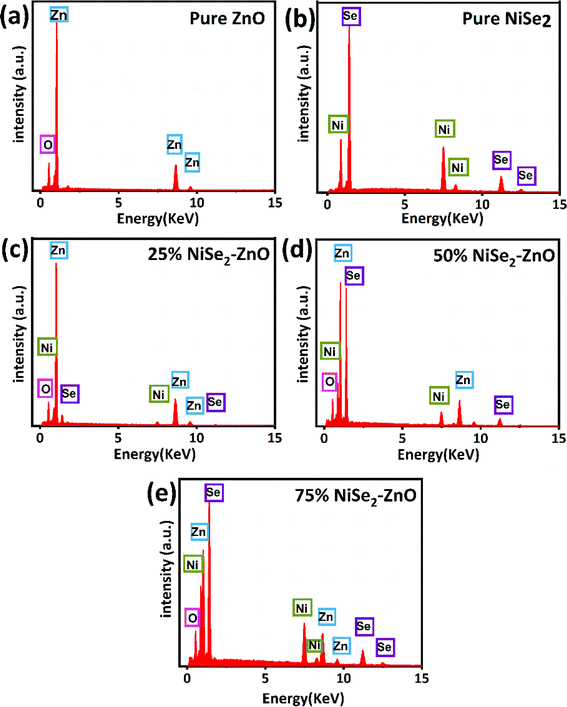 |
| | Fig. 3 EDX spectra of (a) pure ZnO (b) pure NiSe2 (c) 25% NiSe2–ZnO (d) 50% NiSe2–ZnO (e) 75% NiSe2–ZnO nanocomposites. | |
3.2. Optical measurements
UV-Vis spectroscopy was utilized to explore the optical characteristics of the synthesized NiSe2, ZnO, and their nanocomposites over a range between 200 and 800 nm. In the case of pure ZnO, strong light absorption was observed at around 380 nm, which could be attributed to its inherent bandgap of 3.2 eV as shown in Fig. 4a. This property of ZnO agrees with the previous reports.47 Similarly, a strong continuous absorption was observed for NiSe2 in the measured spectral range as presented in Fig. 4b. Similar absorption characteristics of NiSe2 are also reported in the literature and attributed to its metallic nature. Compared to pure ZnO samples, the photoabsorption capability of NiSe2–ZnO nanocomposites is significantly enhanced by increasing the NiSe2 content (Fig. 4c). This is desired for superior photocatalytic properties of the materials. The following Tauc formula was used to determine the bandgap energy of ZnO, NiSe2 and their composites:| | |
(αhν)1/n = A(hν − Eg)
| (2) |
where α is the absorption coefficient, h is Planck's constant, ν is the frequency of light, A is a constant and Eg is the bandgap energy, n is the nature of electronic transition and the value of n is 1/2, for the direct transition. The band gap energy is determined from the intercept of the linear portion of the (αhν)2 vs. hν as presented in Fig. 4d. The bandgap energy of ZnO/NiSe2 nanocomposites with 25%, 50%, and 75% NiSe2 content were determined to be 2.75 eV, 2.35 eV, and 2.1 eV, respectively. The bandgap energies of the composites were observed to decrease with increasing the NiSe2 concentration. The bandgap energies of the nanocomposites are lower compared to pure ZnO, which could be attributed to the formation of heterojunction between ZnO and NiSe2. Consequently, new energy levels are produced at the interface of the heterojunction.
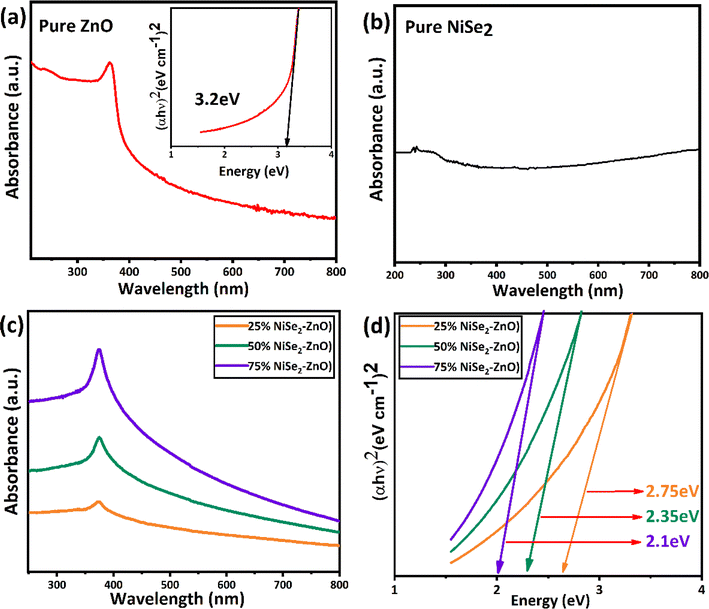 |
| | Fig. 4 Absorption spectra of (a) ZnO (b) NiSe2 (c) 25% NiSe2–ZnO, 50% NiSe2–ZnO, and 75% NiSe2–ZnO nanocomposites (d) determination of the bandgap energies using Tauc plot. | |
3.3. Photocatalytic studies
The MB dye was used as a representative pollutant to analyze the photocatalytic performance of the NiSe2–ZnO nanocomposites and their comparison with pure ZnO and NiSe2 samples under visible light exposure. The corresponding results are presented in Fig. 5. Initially, experiments were carried out without any photocatalyst, and the relationship of absorbance of MB dye as a function of exposure time was monitored as illustrated in histograms of Fig. 5(a). The result demonstrates that the removal of MB without a catalyst is quite slow, and there is a minor decrease in the absorption peak intensity at around 664 nm even after exposure to visible light for 300 min. However, the absorbance peak is noticeably reduced in the presence of pure ZnO (Fig. 5(b)), where almost 60% of the dye was degraded in 300 min. The low efficiency of ZnO towards the degradation of MB dye is attributed to the broad bandgap and reduced charge separation in ZnO. Fig. 5(c) illustrates the removal of MB using pure NiSe2 as a photocatalyst, where only 50% of the MB dye was degraded after light exposure for 300 min. The low photocatalytic efficiency of NiSe2 could be attributed to poor charge separation and low specific surface area. Compared to pure ZnO and NiSe2 samples, the NiSe2–ZnO nanocomposites exhibit significant ability to remove MB dye, which is highly dependent on the NiSe2 content as illustrated in Fig. 5(d)–(f).
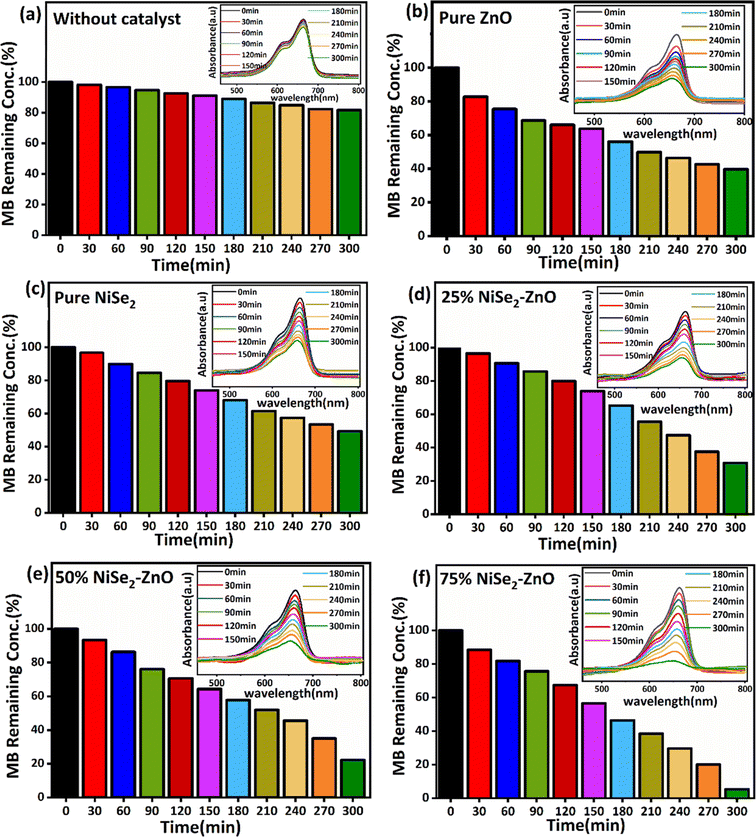 |
| | Fig. 5 Photodegradation characteristics of MB dye (a) without any photocatalyst (b) ZnO (c) NiSe2 (d) 25% NiSe2–ZnO (e) 50% NiSe2–ZnO and (f) 75% NiSe2–ZnO composites. | |
The photocatalytic efficiency of the nanocomposites exhibits the following trend: 25% NiSe2–ZnO (73%) < 50% NiSe2–ZnO (82%) < 75% NiSe2–ZnO (97%). Among all the photocatalysts used in this study, the 75% NiSe2–ZnO nanocomposite demonstrated a remarkable photocatalytic performance. The essential component to enhance the performance of the photocatalyst is its bandgap, which is reduced by increasing the ratio of NiSe2 content in the nanocomposites. Because of the reduction in the bandgap energy, the absorption capability of the sample could increase in the visible range, thus leading to enhanced photocatalytic activities. In addition, the addition of NiSe2 led to the formation of the ZnO–NiSe2 heterojunction that exhibits improved photocatalytic performance than that of pure ZnO and NiSe2, which could be attributed to a slower electron–hole recombination rate, which promotes the use of visible light and charge carrier photogeneration. Therefore, the heterojunction contact between ZnO and NiSe2 is critical in maintaining the separation of the photogenerated electron–hole pairs.48
Fig. 6 compares the efficacy of all samples while summarizing how each photocatalyst performed. In Fig. 6a, the degradation rate (Ct/Co) is plotted against illumination time for ZnO, NiSe2, and their composites, where Co and Ct respectively represent the MB dye concentration before illumination and at time ‘t’. It is evident that the decomposition rate of MB dye is higher for the 75% NiSe2–ZnO composite sample. The increasing trend in the elimination of MB dye with the inclusion of NiSe2 clearly suggests that the number of active adsorption sites present on the surface of NiSe2–ZnO composite are increasing as the amount of NiSe2 is increased. This could, in turn, enhance the number of hydroxyl radicals, thus leading to superior photocatalytic performance of the samples. The Langmuir–Hinshelwood (L–H) model was used to calculate the rate constant (k).49
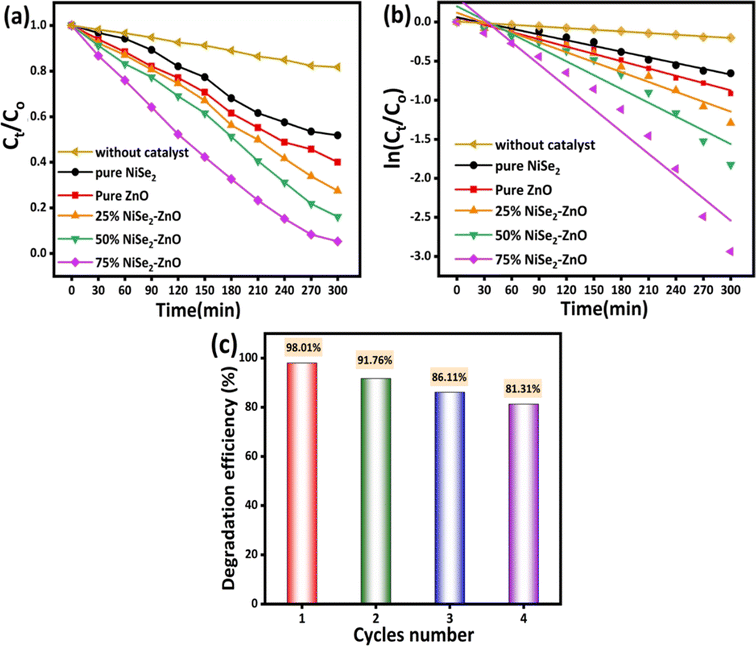 |
| | Fig. 6 (a) Ct/Co profiles of NiSe2, ZnO, and their composites (b) kinetic behavior of MB dye elimination using the prepared photocatalysts (c) cyclic runs of 75% NiSe2–ZnO composites for photocatalytic degradation of MB dye. | |
The kinetic behavior of the synthesized photocatalysts can be demonstrated by plotting ln(Ct/Co) against illumination time as depicted in Fig. 6b.
The degradation reaction was observed to follow the pseudo-first-order Langmuir–Hinshelwood kinetic model.49 The rate constant (k) value can be found by the slope of a straight line. The estimated kinetics reaction rate constant k values are 0.0024 and 0.0031 min−1 for NiSe2 and ZnO, respectively. For NiSe2–ZnO nanocomposites with 25, 50, and 75% NiSe2 ratios, the k values were determined to be 0.0042, 0.0058, and 0.0095 min−1. From the values of reaction rates, it could be concluded that the rate constant of 75% NiSe2–ZnO nanocomposite is higher compared to other samples, which leads to its superior degradation performance. The superior performance of 75% NiSe2–ZnO composite in the removal of MB dye confirms the presence of an optimal number of active adsorption sites on the sample surface. The results suggest that a higher NiSe2 content in NiSe2–ZnO nanocomposites results in more ˙OH radicals, thus improving the photocatalytic performance.
The stability and reuse of a photocatalyst are regarded as important features in large-scale applications. Fig. 6c shows the recycling test performed on the 75% NiSe2–ZnO photocatalyst for four consecutive cycles. After each cycle, the catalyst was centrifuged, washed several times with DI water and ethanol, and dried in an oven at 60 °C for 12 h. The dry material was then processed uniformly and used for the next cycle. As depicted in Fig. 6c, the prepared photocatalyst demonstrates an excellent performance in terms of reusability and stability for a number of times. The slight reduction in the photocatalytic performance is predominantly attributed to the loss of sample during the recovery process. However, a slight loss of activity could also be ascribed to the partial deactivation of the active adsorption sites on the surface of the photocatalyst. The above results suggest that the prepared composites hold an excellent potential for the photodegradation of organic pollutants. Table 1 presents a comparison of photocatalytic degradation of NiSe2–ZnO composites with ZnO combined with other systems reported in the literature. It can be seen that the performance of NiSe2–ZnO composites, with optimal concentration of NiSe2, was significantly enhanced compared to other relevant materials. This could be attributed to an improved synergistic effect between NiSe2 and ZnO.
Table 1 Comparison of photocatalytic degradation using different synthesized ZnO-NPs
| Catalyst |
Target dye |
Light source |
Degradation ratio (%) |
Reaction time (min) |
Ref. |
| 75% NiSe2–ZnO |
MB |
Visible |
97 |
300 |
Current work |
| Graphdiyne-ZnO nanohybrids |
MB |
UV |
89 |
180 |
50 |
| Cu-ZnO/TiO2 |
MB |
Visible |
68 |
120 |
51 |
| ZnO/PANI |
MB |
Visible |
76 |
160 |
52 |
| Graphene-ZnO nanofiber mats |
MB |
UV |
80 |
240 |
53 |
| 40% ZnO-GR |
MB |
Visible |
86.8 |
100 |
54 |
The migration of charge carriers from one semiconductor to another usually relies on their respective potential edge of the conduction (ECB) and the valence band (EVB). The corresponding values of EVB and ECB potentials for both ZnO and NiSe2 could be determined by utilizing their Eg values according to the following relations:55
| | |
ECB = −χ + 0.5Eg + Ee
| (4) |
| |
 | (5) |
In the above equations, Ee is the energy of the free electrons on the hydrogen scale (4.5 eV), χA and χB are the absolute electronegativities of different atoms. By using eqn (5), the electronegativity values calculated for ZnO and NiSe2 were found to be 5.79 eV and 5.34 eV respectively. The values of EVB for pure ZnO rods and NiSe2 nanocubes were determined to be 3.51 and 1.50 V, respectively. Similarly, the ECB values of pure ZnO and NiSe2 were estimated to be 0.31 V and −0.06 V, respectively.
The degradation of MB dye is believed to be highly dependent on the excitation of photocatalysts when exposed to visible light. Within this context, the ZnO–NiSe2 heterojunction exhibits type (II) band alignment, which ensures an enhanced charge carrier separation, as illustrated in Fig. 7. In this process, the photoexcited electrons in the ECB of NiSe2 migrate to the ECB of ZnO as the conduction band edge potential of NiSe2 (−0.06 V) is more negative compared to ZnO (0.31 V). Since the valence edge potential of ZnO (3.51 V) is more positive compared to that of NiSe2 (1.50 V), the generated holes in the EVB of ZnO are migrated to that of NiSe2. As a result, the formation of the ZnO–NiSe2 heterojunction interface efficiently maintains ZnO and NiSe2 electron–hole pair separation. Once the charge carrier separation is maintained, the photoexcited electrons quickly migrate to the photocatalyst's surface to degrade the MB dye. The electrons in the CB of ZnO combine with the O2 to produce O2˙− which undergoes a series of reactions to degrade the dyes into harmless products. On the other hand, the photogenerated holes in NiSe2 VB react with water to generate hydroxyl radicals that further reacts with MB dye to create degradation products. Moreover, during the reaction process, the electrons and holes could directly interact with dye molecules. Consequently, the molecules of MB dye are photocatalytically destroyed, resulting in the formation of nontoxic compounds (CO2 and H2O).56 The proposed reaction mechanism for MB dye degradation is shown below.
| ZnO + NiSe2 + hυ → ZnO (eCB−) + NiSe2 (hVB+) |
| ZnO (eCB−) + O2 → O2˙− + ZnO |
| O2˙− + dye → degradation products |
| NiSe2 (hV.B+) + H2O → H+ + OH− + NiSe2 |
| NiSe2 (hV.B+) + OH− → NiSe2 + OH˙ |
| OH˙ + dye → degradation products |
| O2˙− + OH˙ + dye → degradation products |
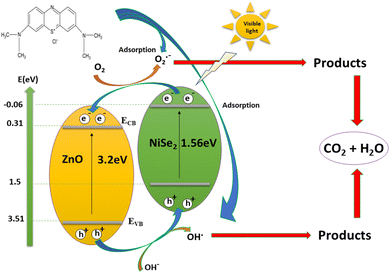 |
| | Fig. 7 Photocatalytic mechanism of ZnO–NiSe2 nanocomposites for degradation of MB dye under visible light irradiation. | |
3.4. Antibacterial activity
The antibacterial characteristics of NiSe2–ZnO composites tested against Gram-positive (B. cereus) are shown in Fig. 8. The bactericidal activity of pure NiSe2 and ZnO was considered as a control. ZnO exhibited reduced antibacterial activity due to its larger crystallite size and wider bandgap in comparison to other synthesized materials in this study. It is known that nanomaterials with larger particle sizes showed narrow inhibition zones.57 Furthermore, the results shown in the Fig. 8 demonstrate that NiSe2 and ZnO samples exhibit lower antibacterial activities in comparison to NiSe2–ZnO nanocomposites. The crystallite size of the composites plays a significant role in controlling their antibacterial activity, in addition to the effective heterojunction between NiSe2 and ZnO. Among all the prepared samples, the 75% NiSe2–ZnO nanocomposite demonstrated excellent antibacterial activity with an inhibition zone of 28 mm (Table 2). Semiconducting nanomaterials are known to produce reactive oxygen species (ROS) such as O2˙−, ˙OH and H2O2 when exposed to visible light. These ROS react with the bacterial cell wall, cytoplasmic membrane, or intracellular components, leading to lipid peroxidation and cell wall breakdown, ultimately causing bacterial death.58,59 Due to their small size and high reactivity, nanoparticles can easily penetrate and pass through the cell wall, interacting with the cell membrane. The ions they release induce structural changes in the cell membrane, compromising its integrity and increasing its permeability.60
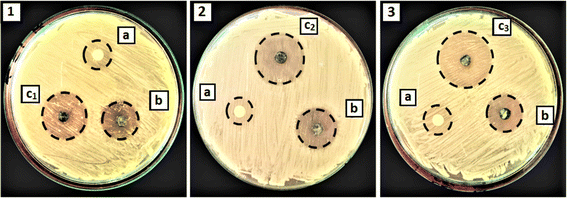 |
| | Fig. 8 Zone of inhibition of the prepared nanostructures against B. cereus (1) 25% NiSe2–ZnO (2) 50% NiSe2–ZnO (3) 75% NiSe2–ZnO; where a and b denote ZnO and NiSe2 respectively. | |
Table 2 Quantitative data of the calculated inhibition zone for ZnO, NiSe2 and their composites
| Samples code |
Sample name |
Zone of inhibition (mm) |
| A |
ZnO |
15 |
| B |
NiSe2 |
20 |
| C1 |
25% NiSe2–ZnO |
23 |
| C2 |
50% NiSe2–ZnO |
25 |
| C3 |
75% NiSe2–ZnO |
28 |
4. Conclusions
We have successfully fabricated NiSe2, ZnO, and NiSe2–ZnO composites with varying concentrations of NiSe2 to analyze their photocatalytic performance against MB. Pure ZnO, NiSe2 and their composites were synthesized with the aid of sol–gel and hydrothermal methods. The prepared samples were characterized using different techniques to study the effect of various concentrations of NiSe2 on the structural, optical, and morphological properties of ZnO. XRD measurements confirmed the structural and phase purity of NiSe2 and ZnO. The average crystallite sizes of NiSe2, ZnO, and NiSe2–ZnO composites were determined to be in the range between 24–35 nm. FESEM images showed that the morphology of ZnO was comprised of randomly oriented nanorods, whilst that of NiSe2 was observed to be nanocubes. The morphology of NiSe2–ZnO nanocomposites was found to be composed of both co-existing ZnO nanorods and NiSe2 nanocubes. The elemental composition of the prepared samples was confirmed by EDX spectra. Optical measurements revealed a red shift in the bandgap values by increasing the NiSe2 amount in the NiSe2–ZnO nanocomposites. The photocatalytic activities of the synthesized samples were evaluated by using MB dye as a model contaminant. The photocatalytic response of the prepared samples followed the trend: 75% NiSe2–ZnO (97%) > 50% NiSe2–ZnO (82%) > 25% NiSe2–ZnO (73%) > ZnO (60%) > NiSe2 (50%). The Langmuir–Hinshelwood model was utilized to determine the values of rate constants, which further confirmed that the addition of NiSe2 had a remarkable role in enhancing the photocatalytic efficiency of ZnO. The 75% NiSe2–ZnO composite sample also exhibited a high antibacterial activity against B. cereus under visible light irradiation.
Data availability
All data generated or analyzed during this study are included in this article.
Conflicts of interest
The authors declare no conflict of interest.
Acknowledgements
The authors would like to thank the Higher Education Commission of Pakistan for providing funding (NRPU project 5349/Federal/NRPU/R&D/HEC/2016). Authors acknowledge the generous support from the Researchers Supporting project number (RSP2024R122), King Saud University, Riyadh, Saudi Arabia. Prof. Dr Sonia Zulfiqar is highly thankful for the support provided by the Statutory City of Ostrava, Czechia, through the Research Grant “Global Experts”. Profs. Cochran and Zulfiqar are grateful to the National Science Foundation for financial support through research grants NSF-2113695, NSF-2132200 and NSF-2242763.
References
- F. Achouri, S. Corbel, L. Balan, K. Mozet, E. Girot, G. Medjahdi, M. B. Said, A. Ghrabi and R. Schneider, Mater. Des., 2016, 101, 309–316 CrossRef CAS.
- V. Dhiman and N. Kondal, Phys. B, 2022, 628, 413569 CrossRef CAS.
- K. S. Al-Namshah, M. Shkir, F. A. Ibrahim and M. S. Hamdy, Phys. B, 2022, 625, 413459 CrossRef CAS.
- Y.-H. Chiu, T.-F. M. Chang, C.-Y. Chen, M. Sone and Y.-J. Hsu, Catal, 2019, 9, 430 CrossRef CAS.
- C. V. Reddy, B. Babu and J. Shim, J. Phys. Chem. Solids, 2018, 112, 20–28 CrossRef CAS.
- A. Kumar and G. Pandey, Mater. Sci. Eng. Int. J., 2017, 1, 1–10 Search PubMed.
- K. G. Pavithra, P. S. Kumar, V. Jaikumar and P. S. Rajan, J. Ind. Eng. Chem., 2019, 75, 1–19 CrossRef CAS.
- M. R. Gadekar and M. M. Ahammed, Desalin. Water Treat., 2016, 57, 26392–26400 CrossRef CAS.
- D. Ayodhya and G. Veerabhadram, Mater. Today Energy, 2018, 9, 83–113 CrossRef.
- H. R. Dihom, M. M. Al-Shaibani, R. M. S. R. Mohamed, A. A. Al-Gheethi, A. Sharma and M. H. B. Khamidun, J. Water Process Eng., 2022, 47, 102705 CrossRef.
- K. Fuku, H. Kanai, M. Todoroki, N. Mishima, T. Akagi, T. Kamegawa and N. Ikenaga, Chem.–Asian J., 2021, 16, 1887–1892 CrossRef CAS PubMed.
- Y. Y. Lee, J. H. Moon, Y. S. Choi, G. O. Park, M. Jin, L. Y. Jin, D. Li, J. Y. Lee, S. U. Son and J. M. Kim, J. Phys. Chem. C, 2017, 121, 5137–5144 CrossRef CAS.
- K. Tanji, I. El Mrabet, Y. Fahoul, I. Jellal, M. Benjelloun, M. Belghiti, M. El Hajam, Y. Naciri, A. El Gaidoumi and B. El Bali, J. Water Process Eng., 2023, 53, 103682 CrossRef.
- K. Davis, R. Yarbrough, M. Froeschle, J. White and H. Rathnayake, RSC Adv., 2019, 9, 14638–14648 RSC.
- R. Qiu, D. Zhang, Y. Mo, L. Song, E. Brewer, X. Huang and Y. Xiong, J. Hazard. Mater., 2008, 156, 80–85 CrossRef CAS PubMed.
- Y. Liu, J. Shi, C. Li, Z. Niu, X. Du, Z. Liu and X. Yue, Int. J. Hydrogen Energy, 2022, 47, 28845–28858 CrossRef CAS.
- H. Wang, X. Zheng, X. Li, L. He, J. Guo, Y. Chen, H. Lin, J. Tang and C. Li, Phys. Chem. Chem. Phys., 2023, 25, 1998–2011 RSC.
- R. Qian, H. Zong, J. Schneider, G. Zhou, T. Zhao, Y. Li, J. Yang, D. W. Bahnemann and J. H. Pan, Catal. Today, 2019, 335, 78–90 CrossRef CAS.
- Y. Sun, W. Zhang, Q. Li, H. Liu and X. Wang, Adv. Sens. Energy Mater., 2023, 2, 100069 CrossRef.
- H. Li, J. Ding, S. Cai, W. Zhang, X. Zhang, T. Wu, C. Wang, M. Foss and R. Yang, Appl. Surf. Sci., 2022, 583, 152539 CrossRef CAS.
- M. Ijaz, Int. J. Hydrogen Energy, 2023, 48, 9609–9619 CrossRef CAS.
- P. Hemmatpour, A. Nezamzadeh-Ejhieh and A. Ershadi, Mater. Res. Bull., 2022, 151, 111830 CrossRef CAS.
- J. Liang, X. Yang, H. Fu, X. Ran, Y. Zhang and X. An, Powder Technol., 2023, 415, 118138 CrossRef CAS.
- S. Dilawar, K. Albalawi, A. U. Khan, K. Tahir, M. E. Zaki, E. A. M. Saleh, Z. M. Almarhoon, T. M. Althagafi, A. A. El-Zahhar and E. El-Bialy, Environ. Res., 2023, 231, 116093 CrossRef CAS PubMed.
- S. Klubnuan, P. Amornpitoksuk and S. Suwanboon, Mater. Sci. Semicond. Process., 2015, 39, 515–520 CrossRef CAS.
- S. Mani, S. Ramaraj, S.-M. Chen, B. Dinesh and T.-W. Chen, J. Colloid Interface Sci., 2017, 507, 378–385 CrossRef CAS PubMed.
- L. Zhu, Q. Lu, L. Lv, Y. Wang, Y. Hu, Z. Deng, Z. Lou, Y. Hou and F. Teng, RSC Adv., 2017, 7, 20084–20092 RSC.
- S. Wang, W. Li, L. Xin, M. Wu, Y. Long, H. Huang and X. Lou, J. Chem. Eng., 2017, 330, 1334–1341 CrossRef CAS.
- M. Achimovičová, M. Hegedüs, V. Girman, M. Lisnichuk, E. Dutková, J. Kurimský and J. Briančin, Nanomaterials, 2022, 12, 2952 CrossRef.
- S. Jayachitra, D. Mahendiran, P. Ravi, P. Murugan and M. Sathish, Appl. Catal., B, 2022, 307, 121159 CrossRef CAS.
- Y.-l. Cen, J.-j. Shi, M. Zhang, M. Wu, J. Du, W.-h. Guo and Y.-h. Zhu, J. Colloid Interface Sci., 2019, 546, 20–31 CrossRef CAS PubMed.
- Z. Wu, X. Chen, X. Liu, X. Yang and Y. Yang, Nanoscale Res. Lett., 2019, 14, 1–14 CrossRef CAS.
- G. Wang and Z. Jin, Appl. Surf. Sci., 2019, 467, 1239–1248 Search PubMed.
- H. Liu, T. Yan, Z. Jin and Q. Ma, New J. Chem., 2020, 44, 14879–14889 RSC.
- M. Azizi-Lalabadi, A. Ehsani, B. Divband and M. Alizadeh-Sani, Sci. Rep., 2019, 9, 17439 CrossRef PubMed.
- L. Wang, C. Hu and L. Shao, Int. J. Nanomed., 2017, 12, 1227–1249 CrossRef CAS PubMed.
- M. J. Hajipour, K. M. Fromm, A. A. Ashkarran, D. J. de Aberasturi, I. R. de Larramendi, T. Rojo, V. Serpooshan, W. J. Parak and M. Mahmoudi, Trends Biotechnol., 2012, 30, 499–511 CrossRef CAS PubMed.
- N.-K. Lee, W.-S. Kim and H.-D. Paik, Food Sci. Biotechnol., 2019, 28, 1297–1305 CrossRef CAS.
- R. Dietrich, N. Jessberger, M. Ehling-Schulz, E. Märtlbauer and P. E. Granum, Toxins, 2021, 13, 98 CrossRef CAS.
- F. M. Elshaghabee, N. Rokana, R. D. Gulhane, C. Sharma and H. Panwar, Front. Microbiol., 2017, 8, 1490 CrossRef PubMed.
- M. K. Morsy, R. Elsabagh and V. Trinetta, Food Control, 2018, 92, 249–254 CrossRef CAS.
- F. B. Firouzabadi, M. Noori, Y. Edalatpanah and M. Mirhosseini, Food Control, 2014, 42, 310–314 CrossRef CAS.
- N. Duan, M. Ye, M. Lu, X. Chen and S. Wu, Adv. Agrochem, 2023, 2, 284–290 CrossRef CAS.
- V. B. Borisov, S. A. Siletsky, M. R. Nastasi and E. Forte, Antioxid, 2021, 10, 839 CrossRef CAS PubMed.
- A. Krzepiłko, K. M. Matyszczuk and A. Święciło, Pathogenesis, 2023, 12, 485 CrossRef.
- P. Krishnamurthi, Y. Raju, Y. Khambhaty and P. T. Manoharan, ACS Omega, 2017, 2, 2524–2535 CrossRef CAS.
- M. Awais, R. Hussain, A. Shah, M. F. Alajmi, R. Maryam, A. Hussain, S. U. Khan and S. u. Rahman, Phys. B, 2024, 685, 416048 CrossRef CAS.
- S. Goktas and A. Goktas, J. Alloys Compd., 2021, 863, 158734 CrossRef CAS.
- H. D. Tran, D. Q. Nguyen, P. T. Do and U. N. Tran, RSC Adv., 2023, 13, 16915–16925 RSC.
- S. Thangavel, K. Krishnamoorthy, V. Krishnaswamy, N. Raju, S. J. Kim and G. Venugopal, J. Phys. Chem. C, 2015, 119, 22057–22065 CrossRef CAS.
- F. Fan, X. Wang, Y. Ma, K. Fu and Y. Yang, Fullerenes, Nanotubes Carbon Nanostruct., 2015, 23, 917–921 CrossRef CAS.
- S. Ameen, M. S. Akhtar, Y. S. Kim, O.-B. Yang and H.-S. Shin, Colloid Polym. Sci., 2011, 289, 415–421 CrossRef CAS.
- S. An, B. N. Joshi, M. W. Lee, N. Y. Kim and S. S. Yoon, Appl. Surf. Sci., 2014, 294, 24–28 CrossRef CAS.
- H. Fan, X. Zhao, J. Yang, X. Shan, L. Yang, Y. Zhang, X. Li and M. Gao, Catal. Commun., 2012, 29, 29–34 CrossRef CAS.
- J. Jia, X. Bai, Q. Zhang, X. Hu, E. Liu and J. Fan, Nanoscale, 2020, 12, 5636–5651 RSC.
- S. Faryad, U. Azhar, M. B. Tahir, W. Ali, M. Arif and M. Sagir, Chemosphere, 2023, 320, 138002 CrossRef CAS PubMed.
- A. Azam, A. S. Ahmed, M. Oves, M. S. Khan, S. S. Habib and A. Memic, Int. J. Nanomed., 2012, 7, 6003–6009 CrossRef CAS.
- S. ur Rahman, M. Arif, S. U. Khan, R. Hussain, R. Ahmad, J. Muhammad, S. U. Khan, N. A. Siddiqui, A. Hussain and A. Shah, Mater. Today Commun., 2024, 39, 108662 CrossRef.
- K. Varaprasad, M. M. Yallapu, D. Núñez, P. Oyarzún, M. López, T. Jayaramudu and C. Karthikeyan, RSC Adv., 2019, 9, 8326–8332 RSC.
- G. Wyszogrodzka, B. Marszałek, B. Gil and P. Dorożyński, Drug Discovery Today, 2016, 21, 1009–1018 CrossRef CAS.
|
| This journal is © The Royal Society of Chemistry 2024 |
Click here to see how this site uses Cookies. View our privacy policy here.  Open Access Article
 b,
Zahid Alic,
Rabia Maryamd,
Afzal Hussaine,
Mohamed Fahad Alajmie,
Shams ur Rahman*a,
Sonia Zulfiqar
 fgh and
Eric W. Cochran
 *g
*g


