DOI:
10.1039/D4RA04822A
(Paper)
RSC Adv., 2024,
14, 27555-27564
High ion barrier hydrogel with excellent toughness achieved by directional structures†
Received
3rd July 2024
, Accepted 18th August 2024
First published on 30th August 2024
Abstract
Owing to their nontoxicity, environmental friendliness, and high biocompatibility, physically cross-linked hydrogels have become popular research materials; however, their high water content and high free volume, along with the weak bonding interactions inherent to ordinary physically cross-linked hydrogels, limit their application in fields such as flexible devices, packaging materials, and substance transport regulation. Here, a structural barrier approach based on directional freezing-assisted salting out was proposed, and the directional structure significantly enhanced the barrier performance of the hydrogel. When the direction of substance diffusion was perpendicular to the pore channel structure of the directional freezing-PVA hydrogel (DFPVA), the Cl− transmission rate was 57.2% for the uniform freezing-PVA hydrogel (UFPVA). By adjusting the concentration of the salting-out solution and the salting-out time, the crystallinity and crystal domain size of the hydrogel could be further changed, optimizing and regulating the barrier performance of the hydrogel, with the best Cl− unit permeability being 36.02 mg mm per cm2 per day. Additionally, DFPVA had excellent mechanical properties (stress of 6.47 ± 1.04 MPa, strain of 625.85 ± 61.58%, toughness of 25.77 ± 3.72 MPa). Due to the barrier and mechanical properties of the direct structure, DFPVA is suitable as a drug carrier for slow drug release in vitro.
1 Introduction
The mechanical and barrier properties of materials have garnered extensive attention in the fields of flexible devices, packaging materials, and substance transport regulation. However, the toughness and high-barrier properties of some materials seem to be contradictory.1–8 Metal materials, such as aluminium foil, have high barrier properties against gases and solutions. However, due to the tight packing of atoms, the interatomic distances and voids are minimized, resulting in poor ductility. Conversely, some elastomeric polymers possess good toughness but poor barrier effects against gases and liquids because of their high free volume and chain motion. Hydrogels have become popular materials because of their nontoxicity, environmental friendliness, and high biocompatibility; they also present potential as matrix materials for controlled release or barrier applications.9–19
However, their inherent high water content, high free volume, and weak bonding interactions limit the barrier performance of hydrogels, restricting their application in flexible devices, encapsulation materials, and substance transport regulation. Typically, researchers enhance the degree of molecular chain packing in a hydrogel by introducing chemical cross-linking or reducing the free volume and porosity to achieve the aforementioned functions but often at the cost of sacrificing other properties, such as strength and ductility, which are essential for flexible materials; this also leads to issues such as complex preparation processes and poor biocompatibility. To date, hydrogel materials that simultaneously achieve high strength, high toughness, and high barrier properties have not been reported. Recently, the strategy of directional freezing and salting out proposed by He20 has offered new insights into the densification and reinforcement of hydrogels. The synergistic effects of direct freezing and the Hofmeister effect enabled the construction of anisotropic structures within hydrophilic hydrogel systems, thereby imparting remarkable strength and stretchability across various length scales.21–29 These physical structural improvements lay the foundation for developing hydrogels with combined strength, toughness, and barrier properties.
Here, we present a structural barrier strategy using oriented structures within physically cross-linked directional freezing-PVA (DFPVA) hydrogels created via directional freezing-assisted salting-out. This structure increased the resistance to substance diffusion perpendicular to the orientation, significantly enhancing the barrier performance of the hydrogel. The crystallinity and crystal domain size could be controlled by varying the salting-out time and solution concentration, thus optimizing and tailoring the barrier performance of DFPVA. Furthermore, it exhibited excellent stress (6.47 ± 1.04 MPa), strain (625.85 ± 61.58%), toughness (25.77 ± 3.72 MPa) and elastic modulus (4.06 ± 0.40 MPa) values. The enhanced barrier properties and good mechanical performance of the constructed oriented structure DFPVA may have potential in the drug carrier area.
2 Materials and methods
2.1. Materials
PVA 2099, glutaraldehyde (50%), sulfuric acid, trisodium citrate dihydrate, and NaCl were purchased from Chengdu Kelong Chemical Co., Ltd. Diclofenac sodium (DS) was purchased from the Aladdin platform, and phosphate-buffered saline (PBS) solution (1×, pH 7.2–7.4) was obtained from Adamas Life. All the above chemicals were used as received without any further processing.
2.2. Preparation of the solution
2.2.1 Preparation of PVA solution. First, 10 g of polyvinyl alcohol (PVA) was added to 90 g of deionized water. The mixture was heated to 90 °C with vigorous stirring until the PVA was fully dissolved. The solution was then allowed to stand overnight to degas, resulting in a solution of 10 wt% PVA.
2.2.2 Preparation of NaCl solution. First, 2.925 g of sodium chloride (NaCl) was dissolved in deionized water and brought up to a final volume of 100 ml in a volumetric flask, resulting in a 0.5 M NaCl solution.
2.2.3 Preparation of C6H5Na3O7 solution. A total of 14.705 g, 29.41 g, 44.115 g, and 58.820 g of trisodium citrate dihydrate were each dissolved in deionized water with vigorous stirring and brought up to a final volume of 100 ml in a volumetric flask, resulting in the preparation of trisodium citrate solutions at concentrations of 0.5 M, 1.0 M, 1.5 M, and saturated, respectively.
2.2.4 Preparation of the crosslinking solution. Concentrated sulfuric acid, a 50% aqueous solution of glutaraldehyde, and deionized water were added to a beaker at a volume ratio of 1![[thin space (1/6-em)]](https://www.rsc.org/images/entities/char_2009.gif) :
:![[thin space (1/6-em)]](https://www.rsc.org/images/entities/char_2009.gif) 20
20![[thin space (1/6-em)]](https://www.rsc.org/images/entities/char_2009.gif) :
:![[thin space (1/6-em)]](https://www.rsc.org/images/entities/char_2009.gif) 100. The mixture was thoroughly stirred to prepare a glutaraldehyde solution capable of chemical crosslinking with PVA hydrogel.
100. The mixture was thoroughly stirred to prepare a glutaraldehyde solution capable of chemical crosslinking with PVA hydrogel.
2.2.5 Preparation of diclofenac sodium solution. First, 1.6 g of the anti-inflammatory drug diclofenac sodium (DS) was dissolved in 100 ml of deionized water to prepare a DS solution.
2.3. Fabrication of the hydrogel
2.3.1 Fabrication of the UFPVA and DFPVA. A 10 wt% PVA solution was separately poured into a homogeneously conductive PTFE mould, and a composite mould was assembled from a thermally superior iron plate and a thermally inferior PTFE. Upon gelation through freezing, the hydrogels were immediately immersed in a 1.5 M sodium citrate solution for thawing and salting-out processes, leading to the fabrication of UFPVA and DFPVA hydrogels. For the freezing process, the UFPVA mould was placed in a low-temperature freezer at −40 °C to ensure consistency of the freezing temperature; the iron plate extension side of the DFPVA mould was submerged in a low-temperature ethanol bath (−40 °C), facilitating controlled directional freezing solidification under a temperature gradient.
2.3.2 Fabrication of DFPVA with different salting-out times and solution concentrations. Similar to the aforementioned DFPVA fabrication process, the directionally frozen DFPVA precursors were immersed in a 1.5 M trisodium citrate solution and removed at 3, 6, 12, 24, and 48 h, yielding hydrogels designated 3 h-DFPVA, 6 h-DFPVA, 12 h-DFPVA, 24 h-DFPVA, and 48 h-DFPVA, respectively. The DFPVA precursors were also independently immersed in trisodium citrate solutions of various concentrations (0.5 M, 1.0 M, 1.5 M, and saturated) and retrieved after 1 day, resulting in the formation of hydrogels named 0.5 M-DFPVA, 1.0 M-DFPVA, 1.5 M-DFPVA, and saturated-DFPVA, respectively.
2.3.3 Fabrication of diclofenac sodium-loaded DFPVA. Similar to the aforementioned DFPVA fabrication process, the DS-DFPVA precursors were immersed in a 1.0 M sodium citrate solution and removed at 24 h. After being salted out, the hydrogels were swollen in deionized water to remove the salts. Following freeze-drying, they were soaked in DS solution to load the drug, thereby preparing DS-DFPVA.
2.4. Performance characterization of the PVA hydrogel
2.4.1 Gas barrier properties of PVA hydrogels. To eliminate the influence of material thickness and ensure data consistency, we used water vapor permeability (WVP) and oxygen permeability (OP) to characterize the barrier properties of the material against water vapor and oxygen, with the units being [mg mm per m2 per day per atm] and [ml mm per m2 per day per atm], respectively.Three grams of deionized water was added to a 5 ml crimp-top vial. PVA hydrogels with smooth surfaces and uniform thicknesses were cut into appropriate sizes and sealed over the opening of the crimp-top vial via a crimping tool. The vials were then placed in a constant temperature and humidity chamber at 23 °C and 50% relative humidity. The total mass was assessed every 12 h, and the WVP of the PVA hydrogel was calculated via the following formula:
where (
d) is the thickness of the hydrogel, (
S) is the area of the crimp-top vial opening, (Δ
m) is the mass change during the test time, (Δ
t) is the time interval between two test processes, and (Δ
P) is water-vapor partial pressure gradient across the film.
To evaluate the oxygen permeability, the cut PVA hydrogels were placed in an H-shaped, dual-chamber sealed glass mould. One chamber was fed 30 ml per min O2 as the diffusion gas, whereas the other chamber was fed 30 ml per min nitrogen (N2) as the sweep gas. The gas swept from the chamber was then analysed via gas chromatography. Based on the gas chromatography results, the flow rate of O2 in the sweep gas was calculated. The OP of the PVA hydrogel was determined via the following formula:
where (
V) denotes the flow rate of O
2 in the sweep gas, (
d) represents the thickness of the hydrogel, (
S) signifies the area of the hydrogel subjected to gas exposure within the confines of the H-shaped mould, (Δ
t) represents the time interval, and (Δ
P) is oxygen partial pressure gradient across the film. This methodology provides a quantifiable measure of PVA hydrogel permeability to water vapour and oxygen, thereby assessing their potential utility in applications requiring gas barrier properties.
2.4.2 Cl− transmission rate of the PVA hydrogel. Cl− permeability is a relevant parameter characterizing the ion barrier properties of materials, and research in this area is scarce. We referred to the established definitions and testing methods of the WVP and OP in fields such as packaging materials, establishing a similar and reasonable concentration gradient to evaluate the Cl− permeability performance of the material, using [mg mm per cm2 per day] as the unit. This signifies the permeability of Cl− through the gel material of a certain thickness per unit time and unit area. In this experiment, the cut PVA hydrogels were precisely positioned within the H-shaped mould. On one side of the mould, 20 ml of deionized water was added, while on the opposite chamber, 20 ml of a 0.5 M sodium chloride (NaCl) solution was introduced. This setup ensured that the PVA hydrogel was in full contact with the solutions on both sides. The ambient temperature was maintained at 25 °C throughout the experiment. The solution on the deionized water side was extracted and analysed for chloride ion content via ion chromatography after 1 day. The Cl− permeability (Cl−P) of the PVA hydrogel was calculated via the following formula:
where (w) is the chloride ion (Cl−) content measured on the deionized water side, (d) is the thickness of the hydrogel, and (S) is the area of the hydrogel held within the H-shaped mould.
2.4.3 SEM characterization. The microstructure of the PVA hydrogels was characterized through scanning electron microscopy (SEM). For SEM analysis, PVA hydrogels were first immersed in deionized water for one day for full swelling and removal of sodium citrate. The swollen hydrogels were subsequently freeze-dried. The freeze-dried samples were fractured in liquid nitrogen to expose fresh surfaces. Due to the poor conductivity of PVA, the fracture surfaces were sputter-coated with gold before SEM imaging with a Thermo Scientific Apreo 2C. This process enhances the surface conductivity, enabling detailed examination of the hydrogel microstructure through high-resolution imaging.
2.4.4 Transparency characterization. The transmittance of the fully swollen PVA hydrogels at various wavelengths was measured via a UV-visible spectrophotometer. The transmittance (Ta) for a 1 mm-thick PVA hydrogel was calculated via the following formula:
In this equation, (T) represents the light transmittance of the PVA hydrogel at different wavelengths of visible light for a given thickness (d).
2.4.5 Hydrogel density measurement. The density of the hydrogel was measured via the volumetric delivery method. The sample with mass m was dropped into a graduated cylinder containing anhydrous ethanol, and the volume of ethanol displaced (ΔV) was recorded. The hydrogel density was then calculated via the following formula.
2.4.6 Swelling characterization. The hydrogel was immersed in deionized water to facilitate swelling. The mass (mi) of the hydrogel at different swelling times was measured. The fully swollen hydrogel was then placed in an oven at 50 °C to dry and dehydrate, and its dry weight (m0) was measured. The water content of the hydrogel (w) at different swelling times was calculated via the following formula:
2.4.7 Crystallinity content measurement. The hydrogel samples were pretreated with a glutaraldehyde crosslinking solution before differential scanning calorimetry (DSC) analysis. For this process, the hydrogel samples were immersed in the prepared glutaraldehyde crosslinking solution for 6 h. In an acidic environment, the excess glutaraldehyde chemically crosslinked with the amorphous polymer chains in the PVA hydrogel, reducing the further formation of crystalline domains during the lyophilization process.30–32 The crosslinked samples were then soaked in deionized water for 1 day to remove excess glutaraldehyde and sulfate. The samples were lyophilized, and their dry weight (mdry) was measured. DSC analysis was conducted via a thermal analysis system produced by Mettler-Toledo, Switzerland. The sample was placed in an aluminium crucible under a nitrogen atmosphere with a flow rate set to 30 ml min−1, and the heating rate was set to 20 °C min−1 from 25 °C to 270 °C. In the DSC curve, the narrow peak between 200 °C and 270 °C corresponds to the melting of PVA crystalline domains. The integral corresponds to the endothermic peak, which corresponds to the melting enthalpy (Hcrystalline) per unit mass of PVA crystal. The mass of the crystalline domain (mcrystalline) was calculated via the following formula:
| mcrystalline = mdry × Hcrystalline/H0crystalline |
where H0crystalline = 138.6 J g−1 is the melting enthalpy of 100% mass fraction PVA crystal at the equilibrium melting point T0m. The crystallinity of the dry sample (Xdry) can be calculated via the following formula:
2.4.8 X-ray scattering characterization. X-ray diffraction (XRD) can be used to characterize the interplanar spacing and size of crystallites in a sample. After crosslinking and freeze-drying, the samples were ground into a uniform powder via a cryogenic grinder. The working voltage of the XRD instrument was set to 40 kV, with a scanning range of 2θ angles from 5 to 80° and a scanning speed of 5° per minute, which was conducted at room temperature. The interplanar spacing of the samples was calculated via Bragg's law:
2d![[thin space (1/6-em)]](https://www.rsc.org/images/entities/char_2009.gif) sin sin![[thin space (1/6-em)]](https://www.rsc.org/images/entities/char_2009.gif) θ = nλ θ = nλ |
In this formula, (d) represents the interplanar spacing, (θ) represents the diffraction angle, (λ) represents the wavelength of the X-rays, and (n) represents the order of diffraction. The average size of the crystallites was estimated via the Scherrer equation:
D = κλ/(β![[thin space (1/6-em)]](https://www.rsc.org/images/entities/char_2009.gif) cos cos![[thin space (1/6-em)]](https://www.rsc.org/images/entities/char_2009.gif) θ) θ) |
where (κ) is a dimensionless shape factor that varies with the actual shape of the crystallites and where (β) is the full width at half maximum of the most intense diffraction peak, with (κ) typically assumed as 0.94.
2.4.9 Tensile testing. The hydrogel samples were cut into a “dog-bone” shape, and the thickness and width of the middle stretch section of each sample were measured via a Vernier calliper. Tensile tests were carried out using an AGS-J electronic universal testing machine from Shimadzu Corporation, Japan. The experimental environment for the samples was set up according to the GN2918 standard, and pneumatic grips were used to clamp both ends of the sample strips. To ensure the accuracy of the test results, a force sensor with an upper limit of 450 N was selected.
2.4.10 Drug release of DS-DFPVA. The in vitro drug release process of the DS-DFPVA hydrogel was studied via a solution immersion method. The DS-DFPVA was immersed in 50 ml of PBS buffer solution (pH 7.4). At time intervals of 0.5, 1, 2, 4, 6, 12, and 24 h, 1 ml of the sample mixture was extracted and replaced with an equal volume of fresh buffer mixture to maintain a constant volume of the release medium. After dilution, the absorbance at 264 nm was measured via a UV-visible spectrophotometer. By comparison with a standard curve, the DS content in the PBS sample was calculated.
3 Results and discussion
3.1. Directional structure construction and barrier principle
The key to achieving structural barriers lies in constructing stable oriented structures within the PVA hydrogel. Here, we selected a 10 wt% PVA hydrogel system to create a hierarchical structure. Under the influence of a unidirectional temperature gradient in a −80 °C ethanol bath, ice crystals in the hydrogel solution grew directionally from the cold end toward the warm end, squeezing the polymer chains into the interstices of the ice crystals and forming a “honeycomb-like”-oriented structure (Fig. 1a). After complete solidification, the PVA hydrogel precursor was placed in sodium citrate solution for thawing and salting-out at room temperature (Fig. 1b). During this process, various interactions among citrate ions, PVA chains, and water occurred in the system because the surface tension between the polymer chains and water molecules changed, which further packed the polymer chains and fixed and reinforced their structures. When substances (such as gases or ions) undergo free diffusion across a hydrogel under the influence of a concentration gradient, the directional transport of these substances is hindered if their diffusion direction is perpendicular to the oriented structure, which is composed of tight polymer chains, and these pore walls form the PVA matrix. Consequently, substances had to traverse a longer path for mass transfer (Fig. 1c and d).
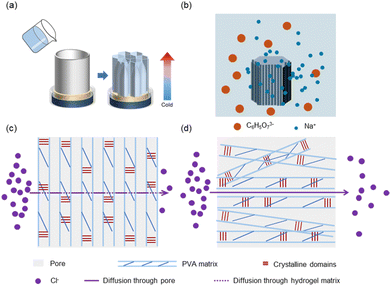 |
| | Fig. 1 Fabrication and material diffusion process of DFPVA hydrogels. (a) Directionally freeze the PVA solution to obtain a DFPVA precursor with an oriented structure. (b) Thaw in a sodium citrate solution, where the salting out process occurs. The process of substance diffusion through the internal structure of the DFPVA (c) and UFPVA (d) hydrogels. | |
3.2. Validation of the structural barrier effect
To elucidate the relationship between the structure and barrier properties of the hydrogel, DFPVA and UFPVA were prepared by freezing at −40 °C and salting out in a 1.5 M sodium citrate solution for 1 day. The barrier properties of the hydrogels against different substances were verified, and their cross-sections were examined via SEM. The results showed that in a 0.5 M NaCl solution, DFPVA exhibited a lower Cl− permeability of 43.76 mg mm per cm2 per day, which was only 57.2% of UFPVA, successfully achieving the “structural barrier” strategy (Fig. 2a). In addition, DFPVA also has advantages as an oxygen and water vapour barrier (Fig. 2b and c). After stabilization, the oxygen permeability (OP) of DFPVA was approximately 0.425 ml mm per m2 per day per atm, which was 89% that of UFPVA (0.480 ml mm per m2 per day per atm), and its water vapour permeability (WVP) stabilized at 3.1 mg mm per m2 per day per atm, which was 65% that of UFPVA (4.8 mg mm per m2 per day per atm).
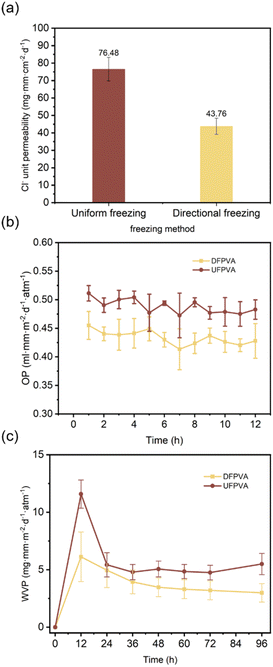 |
| | Fig. 2 Barrier properties of DFPVA and UFPVA. (a–c) Cl−, O2 and water vapour permeabilities of DFPVA and UFPVA. | |
SEM cross-sections revealed significant internal structural differences between DFPVA and UFPVA. During the freezing-solidification process of DFPVA, PVA was expelled by directionally growing ice crystals, eventually forming micron-level parallel pore channel-oriented structures within the hydrogel (Fig. 3a). In contrast, in UFPVA, the growth direction of the ice crystals was random, resulting in a micron-scale uniform random porous structure (Fig. 3b). Both DFPVA and UFPVA exhibited spiderweb-like nanostructures within their respective micron-level structures, which were formed during the salting-out process.20 The salting-out process reduced the water content of the PVA hydrogel, stabilized its structure, and enhanced the mechanical properties of the membrane material. Our test results indicated that the micron-scale parallel pore channels and nanoscale spiderweb-like structures formed in DFPVA through direct freezing-salting-out could prolong the mass transfer path when Cl− diffuses across the hydrogel along a concentration gradient. This effectively increased the mass transfer resistance for Cl− diffusion, thereby reducing the unit permeability of Cl−.
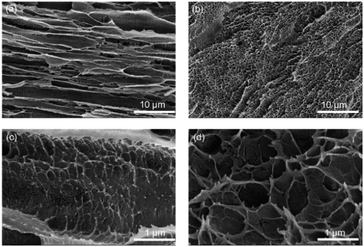 |
| | Fig. 3 (a and c) SEM image of DFPVA. (b and d) SEM image of UFPVA. | |
3.3. Optimization and mechanistic analysis of direct structural barrier performance
3.3.1 Optimization of barrier performance. By varying the direct freezing temperature, salting-out solution concentration, and salting-out duration, we investigated and analysed the impact mechanisms of different process parameters on the barrier performance of DFPVA hydrogels; this further enabled the regulation of the hydrogel structures and the optimization of their properties.The Cl− permeability was 42.59, 47.24, 35.51, 36.02, and 40.77 mg mm per cm2 per day, after the freezing temperature was adjusted from −20 to −100 °C, and the samples were washed out in 1.5 M sodium citrate solution for 1 day. The results indicated that the effect of the formation temperature on the ion barrier ability was relatively weak. During the freezing process, polymer chains are squeezed together by the growth of ice crystals to form a dense structure, and the freezing temperature primarily determines the growth rate of ice crystals; thus, Cl− permeability is less dependent on temperature (Fig. 4a).
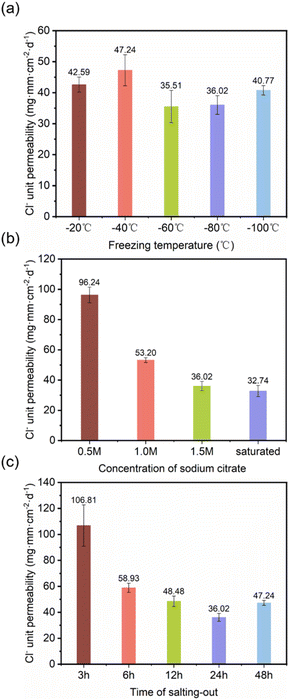 |
| | Fig. 4 Cl− unit permeability of DFPVA at different freezing temperatures (a), sodium citrate concentrations (b) and salting-out times (c). | |
The effect of the salting-out solution concentration was further investigated. At a lower salting-out solution concentration of 0.5 M, the Cl− permeation rate was 96.24 mg mm per cm2 per day, whereas when the concentration increased to saturated, the chloride ion permeability significantly decreased by 66%, reaching only approximately 32.74 mg mm per cm2 per day (Fig. 4b). The salting-out time also had a great influence on the Cl− ion barrier capacity (Fig. 4c). The longer the salting-out time is, the tighter the structure and the stronger the barrier capacity. When the salting-out solution concentration was 1.5 M, Cl− permeation reached 106.81 mg mm per cm2 per day at a salting-out duration of 3 h, which was 2.96 times greater than that at 24 h (36.02 mg mm per cm2 per day). However, when the duration of salting out reached 48 h, Cl− permeation increased slightly.
3.3.2 Density and transparency analysis. The physical properties, such as transparency and density, of DFPVA prepared under different salting-out conditions varied. The densities of different DFPVAs are shown in Tables 1 and 2. As the concentration of the salting-out solution and the duration of the salting-out process increased, the material density correspondingly increased. Compared with DFPVA without the salting-out process (density of 0.906 g cm−3), the density of DFPVA salted out in saturated sodium citrate for 24 hours was 1.285 g cm−3. These results indicated that the salting-out process increased the compactness of the polymer chains, which could restrict the directional transport of Cl− along a concentration gradient. Transparency tests revealed that the light transmission rate of DFPVA was also affected by the salting-out time and solution concentration (Tables S1 and S2†), suggesting differences in crystallinity and crystal region sizes within the material.
Table 1 Effects of the sodium citrate concentration on the density
| Concentration of SC/M |
Average density/(g cm−3) |
| 0 |
0.906 ± 0.142 |
| 0.5 |
1.090 ± 0.049 |
| 1.0 |
1.147 ± 0.014 |
| 1.5 |
1.234 ± 0.063 |
| Saturated |
1.285 ± 0.087 |
Table 2 Effects of the salting-out time on density
| Salting-out time/h |
Average density/(g cm−3) |
| 0 |
0.906 ± 0.142 |
| 3 |
1.120 ± 0.020 |
| 6 |
1.174 ± 0.062 |
| 12 |
1.218 ± 0.058 |
| 24 |
1.234 ± 0.063 |
| 48 |
1.233 ± 0.023 |
3.3.3 Swelling analysis. A hydrogel is composed of a three-dimensional polymer network and a significant amount of water such that ions diffuse in aqueous solution and shuttle through the free volume of the polymer chains. Here, the swelling behaviour of DFPVA in deionized water was investigated to illustrate the impact of water content on ion diffusion behaviour (Fig. 5a and b). The results showed that DFPVA underwent limited swelling in water until it reached swelling equilibrium, and the time of swelling equilibrium and the equilibrium water content were closely related to the concentration and duration of the salting-out solution. The initial water contents of the DFPVA hydrogels formed at 0 M, 0.5 M, 1 M, 1.5 M and saturated were 89.91%, 78.01%, 69.86%, 58.65% and 53.52%, respectively, which reached equilibrium after approximately 24, 12, 12, 12, and 12 h, and the water contents were 95.28%, 85.77%, 82.68%, 78.24% and 77.78%, respectively. The DFPVA formed in saturated sodium citrate had the lowest water content, indicating a lower pore structure and free volume, which was consistent with the Cl− barrier results. Similar patterns were also observed when the impact of salting-out duration was considered.
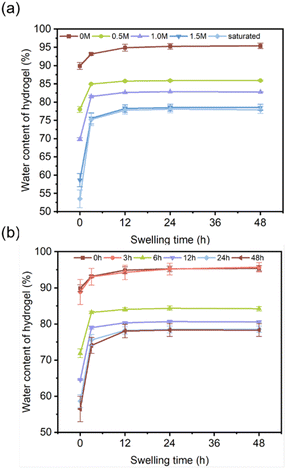 |
| | Fig. 5 Swelling water content of DFPVA with different sodium citrate concentrations (a) and salting-out times (b). | |
The initial water contents of the DFPVA hydrogels formed at 0, 3, 6, 12, 24 and 48 h in sodium citrate were 89.91%, 88.87%, 71.89%, 64.56%, 58.65% and 56.50%, respectively, which reached equilibrium after approximately 24, 24, 24, 12, 12 and 12 h, and the water contents were 95.28%, 95.20%, 84.37%, 80.33%, 78.24% and 78.04%, respectively. The DFPVA formed after 48 h of salting out had the lowest water content and the best ion barrier properties.
3.3.4 Crystallinity analysis. Crystallization is a form of ordered arrangement of polymer chains. During the directional freezing process, ice crystals grow from the cold end toward the warm end, compressing the polymer chains of PVA together. In the thawing process following salting-out, with the assistance of the Hofmeister effect, it was easier to form elongated crystalline shapes within the DFPVA hydrogel, which restricted the passage of light, thus making the material appear milky white and causing a decrease in the transparency of the hydrogel.33–35 The degree of crystallinity and the degree of crystallization were revealed by differential scanning calorimetry (DSC) and X-ray diffraction (XRD) characterization, indicating the influence of the salting-out solution concentration and salting-out time on the crystallization of DFPVA.The results of the DSC tests for various salting-out solution concentrations and times are shown in Fig. S1 and S2,† respectively, featuring narrow melting peaks between 200 °C and 250 °C corresponding to the melting of the crystalline domains of the DFPVA hydrogels (Fig. 6a and b).
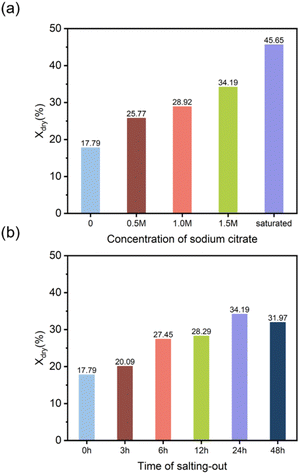 |
| | Fig. 6 Crystallinity content of DFPVA at different sodium citrate concentrations (a) and salting-out times (b). | |
Compared with that prepared solely by directional freezing (Xdry = 17.79%), Xdry of DFPVA gradually increased with increasing salting-out solution concentration, reaching 45.65% for samples salted out in saturated sodium citrate at 24 h. As the salting-out time increased from 0 to 24 h, Xdry gradually increased from 17.79% to 34.19% and then decreased at 48 h (31.97%). The tendency of crystallinity was highly related to the Cl− barrier performance of DFPVA. An increase in the concentration of sodium citrate and time during the salting-out process could induce further crystallization, resulting in the formation of more regular and larger crystalline domains in DFPVA, thereby increasing the density and Cl− barrier performance of the material. The decrease in crystallinity after 48 h may be due to the dynamic change and simultaneous occurrence of growth and destruction of the crystalline domains during the salting-out process, with some degree of dissolution occurring as the soaking time increases.36–38
By cryo-milling the freeze-dried PVA samples, XRD tests were conducted on pure PVA, 0.5 M salting-out for 24 h, 1.5 M salting-out for 24 h, and 1.5 M salting-out for 3 h samples (Fig. S3†), and Bragg's law and the Scherrer equation were used to estimate the crystalline domain lattice spacing and grain size within the samples, further characterizing the correlation between crystallinity and barrier performance (Fig. 7a–d). Compared with the pure PVA hydrogel (0.447 nm), the DFPVA samples presented smaller 2θ values, corresponding to larger lattice spacings (0.458 nm), indicating that higher salting-out solution concentrations and longer salting-out times led to the formation of crystalline domains over a wider area, increasing the lattice spacing.
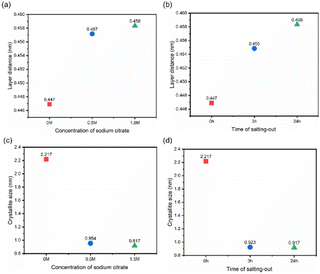 |
| | Fig. 7 Crystallite layer distance (a and b) and size (c and d) with different sodium citrate concentrations and salting-out times. | |
The size of the crystalline domains in pure PVA was 2.217 nm, whereas DFPVA had smaller crystalline domain sizes (0.917–0.954 nm). Combined with the crystallinity test results, the salting-out process clearly led to the formation of more and smaller-sized crystalline domains in DFPVA, and the formation and continuous growth of these crystalline domains were the direct reasons for the enhanced Cl− barrier performance of the hydrogel.
3.4. Mechanical characterization of DFPVA
The prepared hydrogel not only possessed good and adjustable barrier properties but also exhibited excellent mechanical properties, as shown in Fig. 8. The results revealed that the distribution of stress–strain in the samples was relatively concentrated, indicating good uniformity; the stress for the five samples was 6.47 ± 1.04 MPa, with a strain of 625.85 ± 61.58% (Fig. 8a). The cyclic load-unload mechanical tests indicated that the samples subjected to tensile stretching up to 250% strain for ten cycles displayed distinct energy dissipation behaviour. Initially, a pronounced hysteresis loop was observed during the first stretching cycle, dissipating a significant amount of energy, with energy dissipated at 6368.27 kJ m−3. As the number of cycles increased, the energy dissipated in each cycle gradually decreased and stabilized after five cycles. From the fifth to tenth cycles, the dissipation energy slowly decreased from 960.24 kJ m−3 to 774.72 kJ m−3 (Fig. 8d). This behaviour suggested that the DFPVA hydrogel had a good ability to resist external impacts and was capable of dissipating most of the energy upon the first impact. After multiple cycles of stretching, the material demonstrated a certain stretch stability. The small hysteresis loops observed during continuous stretching from 25% to 250% strain indicated that the samples possessed good sensitivity and response speed. Besides, the tests we conducted revealed that DFPVA salting out under saturated sodium citrate conditions indeed exhibited superior mechanical properties with approximately strain of 768.7% and stress of 10.4 MPa (Fig. S4†).
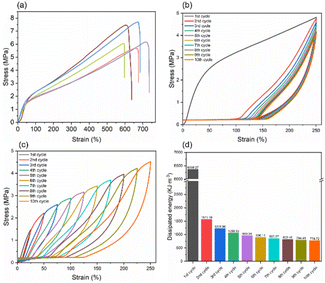 |
| | Fig. 8 Mechanical properties of DFPVA. Stress–strain curves of the DFPVA hydrogels after 24 h of salting out in 1.5 M sodium citrate (a). Cyclic loading of DF-PVA to 250% strain (b). Cyclic loading of DF-PVA from 25% to 250% strain (c). Energy dissipation of DF-PVA in each cycle of 250% cyclic loading (d). | |
3.5. Use of DFPVA for in vitro drug release
Hydrogels are known for their high water content, similar to the natural tissue environment, which makes them excellent for various applications, including drug delivery systems39–42 and wound dressings.43–45 To verify the applicability of the structural barrier of DFPVA, an in vitro drug release experiment was designed with DFPVA loaded with the ionic anti-inflammatory drug diclofenac sodium (DS). The results and calculations demonstrated that DFPVA loaded with DS in a pH = 7.4 PBS buffer solution could achieve sustained release of the loaded drug for approximately 8 h. Combined with previous optimization results, these findings suggested that by designing the preparation process of DFPVA and loading drugs onto it, a sustained release effect in vitro could be achieved. The structurally barriered DFPVA is expected to be used for in vitro drug-loaded hydrogel dressings (Fig. 9).
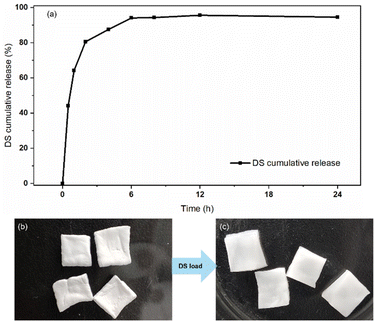 |
| | Fig. 9 DFPVA for in vitro drug release. DS cumulative release curve (a); DFPVA treated with 1.0 M salting-out for 24 h without DS loading (b); DS-DFPVA (c). | |
4 Conclusions
We proposed and successfully validated the concept of a structural barrier, which involves constructing DFPVA hydrogels with oriented structures through a direct freezing-salt leaching process in high-water-content, loosely structured hydrogels. This structure significantly enhanced the barrier properties of the DFPVA hydrogel. Compared with that of the UFPVA hydrogels with a random structure, the Cl− permeability of the DFPVA hydrogel was 57.2% greater than that of UFPVA. Moreover, by adjusting the concentration of the salting-out solution and the duration of salting-out, it was possible to change the crystallinity of the hydrogel, as well as the interlayer spacing and size of the crystalline domains, thereby controlling the internal crystallization of the hydrogel and optimizing its barrier performance. In our work, the barrier properties of the material were primarily determined by Cl− unit permeability. Combined with previous test results, the temperature had little effect on Cl− permeability (with −80 °C being preferable). The Cl− permeability decreased as the salting-out solution concentration increased (with 1.5 M being optimal), and it initially decreased and then increased with longer salting-out times (with 24 h being optimal). Therefore, to achieve the best barrier property, DFPVA should be prepared by directional freezing at −80 °C and salting-out with 1.5 M solution for 24 h. Additionally, DFPVA exhibited excellent mechanical properties (stress of 6.47 ± 1.04 MPa, strain of 625.85 ± 61.58%, toughness of 25.77 ± 3.72 MPa, elastic modulus of 4.06 ± 0.40 MPa). High-ion barrier hydrogels with excellent toughness may be suitable as drug carriers in the future.
Data availability
The data will be made available upon request.
Conflicts of interest
There are no conflicts to declare.
Acknowledgements
We would like to thank the National Natural Science Foundation of China (Grant No. U2013603, No. 52470125, No. 52403383, No. 52374133, No. 51827901, No. 52304427, No. 52104400, No. 52004166). This work is supported by Sustainable Development Technology Special Project of Shenzhen Science and Technology Innovation Commission (KCXST20221021111601003). This work is also supported by the National Key R&D Program of China (Grant No. 2022YFB4102101). This work is also supported by Postdoctoral Innovation Talent Support Program (No. BX20240240). We are grateful for the support from Program for Guangdong Introducing Innovative and Entrepreneurial Teams (Grant No. 2019ZT08G315). We would like to thank the Sichuan Natural Science Foundation (Grant No. 24NSFSC3635, No. 24NSFSC6592). We thank the Institute of New Energy and Low-Carbon Technology (Sichuan University).
Notes and references
- A. Eckert, T. Rudolph, J. Guo, T. Mang and A. Walther, Adv. Mater., 2018, 30, 1802477 CrossRef PubMed.
- Y.-J. Jang, L. Sangroniz and M. A. Hillmyer, Polym. Chem., 2022, 13, 3882–3891 RSC.
- D. Niu, P. Xu, B. Liu, H. Shao, C. He, T. Liu, W. Yang and P. Ma, Macromolecules, 2023, 56, 8236–8246 CrossRef CAS.
- A. Sangroniz, J.-B. Zhu, X. Tang, A. Etxeberria, E. Y.-X. Chen and H. Sardon, Nat. Commun., 2019, 10, 3559 CrossRef PubMed.
- Q. Shen, M. Jiang, R. Wang, K. Song, M. H. Vong, W. Jung, F. Krisnadi, R. Kan, F. Zheng and B. Fu, Science, 2023, 379, 488–493 CrossRef CAS PubMed.
- Z. Wu, Y. Zhang and D. Srolovitz, Acta Mater., 2009, 57, 4508–4518 CrossRef CAS.
- H. Xie, H. Meng, L. Wu, B.-G. Li and P. Dubois, Polymer, 2022, 246, 124751 CrossRef CAS.
- G. Tedeschi, S. Guzman-Puyol, U. C. Paul, M. J. Barthel, L. Goldoni, G. Caputo, L. Ceseracciu, A. Athanassiou and J. A. Heredia-Guerrero, Chem. Eng. J., 2018, 348, 840–849 CrossRef CAS.
- E. A. Appel, R. A. Forster, A. Koutsioubas, C. Toprakcioglu and O. A. Scherman, Angew. Chem., Int. Ed., 2014, 53, 10038–10043 CrossRef CAS PubMed.
- Z. Cai, Y. Tang, Y. Wei, P. Wang and H. Zhang, Biomacromolecules, 2021, 22, 4967–4979 CrossRef CAS PubMed.
- V. L. Fernandez Corujo, M. L. Salum, M. L. Herrera and P. Froimowicz, ACS Food Sci. Technol., 2022, 2, 1378–1400 CrossRef CAS.
- C. Hu, R. An, L. Han, X. Wang, Y. Shi and R. Ran, Colloids Surf., A, 2018, 559, 74–82 CrossRef CAS.
- D. Li, X. Fei, K. Wang, L. Xu, Y. Wang, J. Tian and Y. Li, J. Mater. Chem. B, 2021, 9, 6844–6855 RSC.
- L. Martin, C. G. Wilson, F. Koosha and I. F. Uchegbu, Eur. J. Pharm. Biopharm., 2003, 55, 35–45 CrossRef CAS PubMed.
- D. Sun, H. Wang, J. Liu, X. Wang, H. Guo, L. Xue, L. Li, J. Li, B. Zhang and Y. Xue, Nano Today, 2022, 44, 101467 CrossRef CAS.
- Y. Takashima, Y. Yuting, M. Otsubo, H. Yamaguchi and A. Harada, Beilstein J. Org. Chem., 2012, 8, 1594–1600 CrossRef CAS PubMed.
- W. Wang, Y. Liu, S. Wang, X. Fu, T. Zhao, X. Chen and Z. Shao, ACS Appl. Mater. Interfaces, 2020, 12, 25353–25362 CrossRef CAS PubMed.
- R. Xu, S. Ma, P. Lin, B. Yu, F. Zhou and W. Liu, ACS Appl. Mater. Interfaces, 2017, 10, 7593–7601 CrossRef PubMed.
- X. Xue, Y. Hu, S. Wang, X. Chen, Y. Jiang and J. Su, Bioact. Mater., 2022, 12, 327–339 CAS.
- M. Hua, S. Wu, Y. Ma, Y. Zhao, Z. Chen, I. Frenkel, J. Strzalka, H. Zhou, X. Zhu and X. He, Nature, 2021, 590, 594–599 CrossRef CAS PubMed.
- X. Dong, X. Guo, Q. Liu, Y. Zhao, H. Qi and W. Zhai, Adv. Funct. Mater., 2022, 32, 2203610 CrossRef CAS.
- A. Kalra, N. Tugcu, S. M. Cramer and S. Garde, J. Phys. Chem. B, 2001, 105, 6380–6386 CrossRef CAS.
- X. Li, Y. Wang, C. Zhao, L. Tong, P. Wang, J. Liang, Q. Jiang, Y. Fan, X. Zhang and Y. Sun, Small, 2024, 2310689 CrossRef CAS PubMed.
- M.-A. Shahbazi, M. Ghalkhani and H. Maleki, Adv. Eng. Mater., 2020, 22, 2000033 CrossRef CAS.
- P. Wu, B. Zhang, Z. Yu, H. Zou and P. Liu, J. Appl. Polym. Sci., 2019, 136, 47179 CrossRef.
- R. Zangi, J. Phys. Chem. B, 2010, 114, 643–650 CrossRef CAS PubMed.
- H. Zhang and A. I. Cooper, Adv. Mater., 2007, 19, 1529–1533 CrossRef CAS.
- L. Zhang, K. Wang, S. Weng and X. Jiang, Chem. Eng. J., 2023, 463, 142414 CrossRef CAS.
- W. Zhu, J. Wang, W. Sun, S. Zhou and M. He, Chem. Eng. J., 2023, 451, 138335 CrossRef CAS.
- S. Lin, J. Liu, X. Liu and X. Zhao, Proc. Natl. Acad. Sci. U. S. A., 2019, 116, 10244–10249 CrossRef CAS PubMed.
- A. K. Patel, R. Bajpai and J. Keller, Microsyst. Technol., 2014, 20, 41–49 CrossRef CAS.
- N. A. Peppas and E. W. Merrill, J. Appl. Polym. Sci., 1976, 20, 1457–1465 CrossRef CAS.
- J. L. Holloway, A. M. Lowman and G. R. Palmese, Soft Matter, 2013, 9, 826–833 RSC.
- Y. Hou, C. Chen, K. Liu, Y. Tu, L. Zhang and Y. Li, RSC Adv., 2015, 5, 24023–24030 RSC.
- N. A. Peppas and E. W. Merrill, J. Polym. Sci., Polym. Chem. Ed., 1976, 14, 441–457 CrossRef CAS.
- H. Ming, M.-F. Zhu, L. Li, Q.-B. Liu, W.-H. Yu, Z.-Q. Wu and Y.-M. Liu, CrystEngComm, 2021, 23, 2723–2732 RSC.
- J. Tóth, A. Kardos-Fodor and S. Halász-Péterfi, Chem. Eng. Process., 2005, 44, 193–200 CrossRef.
- L. Xu, H. Kang, W. Wei, T. Goto, X. Wu and H. Dai, Adv. Funct. Mater., 2024, 2406367 CrossRef.
- C. A. Dreiss, Curr. Opin. Colloid Interface Sci., 2020, 48, 1–17 CrossRef CAS.
- M. Hamidi, A. Azadi and P. Rafiei, Adv. Drug Delivery Rev., 2008, 60, 1638–1649 CrossRef CAS PubMed.
- J. Li and D. J. Mooney, Nat. Rev. Mater., 2016, 1, 1–17 Search PubMed.
- Z. Sun, C. Song, C. Wang, Y. Hu and J. Wu, Mol. Pharmaceutics, 2019, 17, 373–391 Search PubMed.
- L. Fan, H. Yang, J. Yang, M. Peng and J. Hu, Carbohydr. Polym., 2016, 146, 427–434 CrossRef CAS PubMed.
- E. A. Kamoun, E.-R. S. Kenawy and X. Chen, J. Adv. Res., 2017, 8, 217–233 CrossRef CAS PubMed.
- M. Kokabi, M. Sirousazar and Z. M. Hassan, Eur. Polym. J., 2007, 43, 773–781 CrossRef CAS.
|
| This journal is © The Royal Society of Chemistry 2024 |
Click here to see how this site uses Cookies. View our privacy policy here.  Open Access Article
 a,
Wenchuan Jianga,
Geng Lid,
Bin Zhongd,
Jin Weid,
Tao Liu
 *a and
Heping Xiea
![[thin space (1/6-em)]](https://www.rsc.org/images/entities/char_2009.gif) :
:![[thin space (1/6-em)]](https://www.rsc.org/images/entities/char_2009.gif) 20
20![[thin space (1/6-em)]](https://www.rsc.org/images/entities/char_2009.gif) :
:![[thin space (1/6-em)]](https://www.rsc.org/images/entities/char_2009.gif) 100. The mixture was thoroughly stirred to prepare a glutaraldehyde solution capable of chemical crosslinking with PVA hydrogel.
100. The mixture was thoroughly stirred to prepare a glutaraldehyde solution capable of chemical crosslinking with PVA hydrogel.![[thin space (1/6-em)]](https://www.rsc.org/images/entities/char_2009.gif) sin
sin![[thin space (1/6-em)]](https://www.rsc.org/images/entities/char_2009.gif) θ = nλ
θ = nλ![[thin space (1/6-em)]](https://www.rsc.org/images/entities/char_2009.gif) cos
cos![[thin space (1/6-em)]](https://www.rsc.org/images/entities/char_2009.gif) θ)
θ)


