 Open Access Article
Development of an ultra-sensitive laser stimulated fluorescence system for simultaneous detection of amino acids
Megha Naik and
Ajeetkumar Patil *
*
Department of Atomic and Molecular Physics, Manipal Academy of Higher Education (MAHE), Manipal, India-576 104. E-mail: ajeetkumar.p@manipal.edu; ajeetkumarp@gmail.com
First published on 28th October 2024
Abstract
An ultra-sensitive, high-performance liquid chromatography-based laser-stimulated fluorescence detection system was developed and validated for the simultaneous detection of 20 derivatized amino acids. Dansyl chloride was used as a derivatizing agent, and key derivatization parameters, such as reaction time and temperature, were optimized to enhance sensitivity and reproducibility. The majority of amino acids showed a relative standard deviation of less than 5%, indicating the reliability of the approach. The method demonstrated excellent sensitivity for all 20 amino acids, with detection limits ranging from 4.32 to 85.34 femtomoles. It also exhibited good linearity, with regression (R2) values greater than 0.98 for the amino acids. The system's performance was tested on human serum, and the eluted amino acids were identified. This method has great potential for analyzing amino acids in various body fluids and can be used in various clinical applications. It is ultra-sensitive, reliable, user-friendly, and cost-effective, offering a valuable tool for diagnosing and managing amino acid-related disorders.
Introduction
Amino acids (AAs) are the structural units of proteins and intermediate metabolites that drive subsequent biosynthetic activities.1,2 AAs are essential for the human body's growth, development, and maintenance, and their proper intake through a balanced diet is crucial for optimal health.3 Some of the AAs, such as arginine, glutamine, glutamate, glycine, proline, and branched chain AAs, have significant effects on blood flow,4 nutrient transport and metabolism in animal cells,5 intestinal microbial growth and metabolism, antioxidative actions,6 as well as innate and cell-mediated immune responses.7 Functional AAs show immense potential in preventing and treating infectious diseases (including viral infections), metabolic disorders (such as obesity, diabetes, and cardiovascular diseases), lactation failure, fetal and postpartum growth restriction, male and female infertility, and organ dysfunctions.8 Therefore, a qualitative and quantitative assessment of AAs in body fluids is crucial, and it is important to use a sensitive and reliable system to ensure accurate results.Several analytical techniques are available for the assessment of AAs, such as AA analyzers, nuclear magnetic resonance (NMR), gas chromatography (GC), high-performance liquid chromatography (HPLC) with UV/fluorescence detectors, and LC-mass spectrometry (LC-MS).9,10 The conventional AA analysis technique involves ion exchange chromatography with post-column derivatization using a ninhydrin reagent. However, this approach has limitations such as poor retention for acidic molecules, low specificity, and longer analysis time.11 NMR spectroscopy is frequently utilized for AA profiling due to its quick sample analysis, high repeatability, and precise quantification, though its sensitivity is relatively limited.12,13 While GC-MS provides high sensitivity and resolution for AAs, the complexity of sample preparation and derivatization makes HPLC-based methods more preferred.14 HPLC combined with MS offers the highest sensitivity and selectivity compared to other techniques.15,16 Nevertheless, the high instrumentation and operation costs, along with the complex sample preparation, are notable challenges.17,18 HPLC with ultraviolet (UV) and fluorescence (FL) detection is often preferred due to its low cost, ease of use, and adequate sensitivity. Compared to UV detectors, HPLC with fluorescence detection provides increased sensitivity and precision, making it a more favorable choice for analyzing AAs.
The derivatization process is typically carried out to identify AAs using HPLC with UV/FL/MS detectors because AAs generally lack potent chromophores or fluorophores necessary for direct detection.16 For derivatization, several reagents were employed, such as dansyl chloride (Dns-Cl), dabsyl chloride (Dbs-Cl), fluorescamine, and fluorenyl-methyl chloroformate (FMOC), phenylisothiocyanate (PITC), aminoquinolyl-N-hydroxylsuccinimidylcarbamate (AQC) and o-phthalaldehyde (OPA) have been used.19–21 Though OPA derivatization is often preferred due to its simplicity and flexibility, it does not react with secondary AAs, and the derivatives are often unstable.22 Other reagents, such as AQC, FMOC-Cl, and PITC, also have limitations. PITC derivatives are said to be unstable, whereas interference from the hydrolysis products of AQC and FMOC-Cl hinders the detection of AAs.23,24 Dns-Cl derivatization is widely used for investigating compounds containing primary and secondary amines, including AAs, biogenic amines, and polyamines.25,26
Despite the available methods, there is a need for a sensitive, cost-effective, and reliable technique for analyzing AAs. The present study describes the development of an ultrasensitive HPLC-coupled laser-stimulated fluorescence (LSF) detection system for qualitative and quantitative analysis of AAs using Dns-Cl as a derivatizing agent. This technique offers several advantages in terms of simplicity, excellent sensitivity, and cost-effectiveness compared to similar techniques.
Materials and methods
Reagents
AA standards kit (≥99.0%) [alanine (Ala), aspartic acid (Asp), cysteine (Cys), cystine (Cys–Cys), glutamine (Gln), glutamic acid (Glu), glycine (Gly), histidine (His), hydroxyproline (Hyp), isoleucine (Ile), leucine (Leu), lysine (Lys), methionine (Met), phenylalanine (Phe), proline (Pro), serine (Ser), threonine (Thr), tryptophan (Trp), tyrosine (Tyr), and valine (Val)], sodium carbonate (99.9%), sodium bicarbonate (≥99.7%), Dns-Cl (≥99% HPLC), ammonium hydroxide (30–33% NH3 in H2O, puriss.) (Sigma-Aldrich, U.S); HPLC grade water, acetic acid, acetonitrile (Merck Life Science, Germany); methanol (LCMS grade, RCI Labscan Limited, Thailand), and sodium acetate (99.9%) (Sisco Research Laboratories Pvt. Ltd India).Derivatization procedure
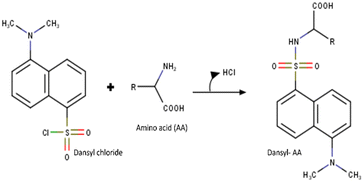
The Dns-Cl (37 mM) solution was prepared in acetonitrile, and stock solutions of individual standard AAs were prepared using HPLC-grade water. The stock solutions were diluted to working concentrations using bicarbonate buffer (pH 9.2). Dns labeling occurs only in alkaline conditions because amino groups react as free bases, not conjugate acids. Dns-Cl reacts with nucleophiles like water to produce dansyl sulfonic acid (Dns-OH) under an OH-catalyzed reaction. A pH of 9.5 is recommended as a threshold to prevent hydrolysis.27,28 Therefore, a sodium bicarbonate buffer with pH 9.2 was used for the reaction.To the solution of standard AAs, 25 μL of Dns-Cl was added and kept at room temperature for an hour. Fig. 1 shows the reaction mechanism of Dns-Cl with AA. The excess of Dns-Cl present in the reaction mixture competes with the formation of dansyl AAs (Dns-AA) and converts them to dansylamide (Dns-NH2) and other byproducts.29 Therefore, after one hour of reaction, the excess of Dns-Cl was quenched using an ammonium hydroxide (NH4OH) solution to prevent the conversion of Dns-AA to Dns-NH2.
Absorption and fluorescence studies of Dns-Cl
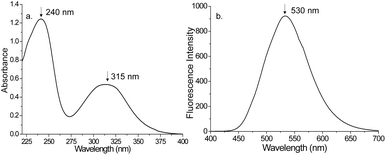
The absorption spectrum of Dns-Cl was recorded using JASCO-UV 3600. Fig. 2a depicts the absorption spectra of Dns-Cl in ACN. The absorption maxima were found to be 240 and 315 nm, respectively. In addition, the fluorescence spectra of Dns-Cl were recorded using a Jasco FP8300 fluorescence spectrometer. The fluorescence emission peak of Dns-Cl was observed at 530 nm when excited at a wavelength of 325 nm, as shown in Fig. 2b. In this study, an excitation source with a 325 nm wavelength was utilized, which aligns with the absorption characteristics of Dns-Cl. This choice of excitation wavelength also helps to avoid interference from autofluorescence exhibited by AAs, which is typically observed at wavelengths below 300 nm. Subsequently, the emission wavelength of 530 nm was chosen for detecting Dns-AA using the HPLC-LSF technique discussed below. By carefully choosing the excitation and emission parameters, the precision and selectivity of Dns-AAs detection were enhanced, making it an excellent analytical approach.Experimental setup
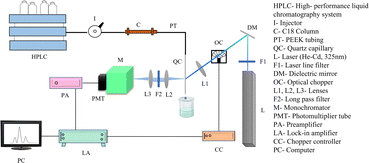
In earlier work, a sensitive and reliable HPLC coupled-fluorescence-based detection tool was reported for studying the proteins in various body fluids, including serum, saliva, tissue, and cellular samples. This method has a detection limit of femtomoles and is helpful for various biomedical applications.30–34 The studies were subsequently extended to develop an HPLC-LSF system for detecting AAs. Several modifications were made in the system and analysis procedure to obtain qualitative and quantitative assessments of AAs with high sensitivity.The two primary components of the experimental setup are the HPLC unit for Dns-AA separation and the LSF unit for its detection, as depicted in Fig. 3.
Chromatographic separation
The separation part consists of an HPLC system (Agilent 1200 series) with a G1322A degasser, G1311A pump, and a manual injector (model no. 7725i, Rheodyne, USA) coupled to a reversed-phase ZORBAX 300Extend-C18 selectivity HPLC column 5 μm, 250 mm × 4.6 mm i.d. column (No. 770995-902, Agilent, USA). The column's effluent was directed into a UV-grade quartz capillary flow cell (75 μm inner diameter, HP CE Capillary, US). The capillary is connected to PEEK tubing (part no. 5042-6462, 1.58 mm outer diameter, 175 μm inner diameter, Agilent, USA) using finger-tight fittings. The flow cell is precisely positioned on precession mounts for consistent excitation and fluorescence collection. The derivatized solution was injected into the manual injector (7725i, Rheodyne, USA) fitted with a 20 μL sample loop.Chromatographic condition
DNS-AAs were eluted using a mobile phase consisting of a sodium acetate buffer (83 mM, pH 5.94) (A) and methanol (B). The elution process followed a gradient starting with 60% solvent A, decreasing to 55% in 26 min, 55% to 40% in 35 min, 40% to 33% in 48 min, and 0% in 60 min. The 100% B was continued for 10 minutes, extending the total run time to 70 minutes. A blank was recorded after every run to make sure the column was clean before each sample run.LSF detection system
The LSF technique was employed to detect AAs. A continuous-wave, He–Cd laser (KIMMON KOHA, IK3083R-D, JAPAN) emitting at a wavelength of 325 nm was used to effectively excite Dns-AA. The beam was focused onto the capillary using a biconvex lens (focal length (f) = 5 cm). An optical chopper (SR540, Stanford Research Systems, Inc., USA) was used to chop the laser beam constantly at a frequency of 20 Hz to provide a reference for lock-in detection. As depicted in Fig. 2, the fluorescence signal from the sample was collected at an angle of 90° to lessen the background signal. After collimating the emitted signal using a biconvex lens [focal length (f) = 3 cm], an additional biconvex f/4 lens with a 10 cm focal length was used to refocus the fluorescence beam on the monochromator (No. 0051-08-06, Micro HR, Horiba Jobin Yvon, USA) to match the monochromator's F value, which is adjusted at a 530 nm wavelength. A high pass filter was positioned directly before the monochromator slit to minimize stray light at other wavelengths. The fluorescence was detected by a photomultiplier tube (R750, Hamamatsu Inc., Hamamatsu, Japan) operated at −850 V, coupled through a preamplifier (Signal Recovery Model 5113, USA), which is connected to a lock-in amplifier (Signal Recovery Model 7265, USA). The chromatograms were obtained using a computer connected to the lock-in amplifier's output. The excitation and collection optics used along with the He–Cd LSF system were more effective at collecting the total emitted radiation, and the choice of parameters such as PMT voltage, the gain of lock-in amplifier, the choice of suitable and stable derivatizing agent, and optimization of reaction conditions all contributed to an improved detection limit.Results and discussion
In clinical laboratories, the accurate measurement of AA analysis is vital, and it relies on the specificity and sensitivity of the technique. This study evaluated the stability, repeatability, and sensitivity of the HPLC-LSF system as key performance parameters.The derivatization procedure was modified to achieve the best possible detection. Many studies have used Dns-Cl to detect AAs in various samples. The commonly used dansyl derivatization approach for detecting AAs involves heating the sample at 60–80 °C for 30–60 minutes or leaving it at room temperature for 24 hours.35,36 However, these conditions can lead to side reactions and the formation of byproducts, affecting the accuracy of the analysis. To improve the reliability and efficiency of the derivatization process, the conditions were optimized to allow the reaction to take place at room temperature within an hour. This offers several advantages over higher temperatures, as higher temperatures can cause sample degradation or necessitate additional heating equipment. After derivatization, 20 μL of the solution was injected into the HPLC system, and the chromatogram of dansylated AAs was recorded.
Fig. 4a shows the chromatogram of a typical blank recorded to ensure that the column was clean and no residues were present that could interfere with the analysis of AAs. A mixture of 20 AAs without derivatization was injected to assess the potential interference from the autofluorescence of AAs. It was observed that no fluorescence signal was detected when excited at 325 nm, and the resulting chromatogram of the mixture was indistinguishable from that of a blank run. Fig. 4b represents the chromatogram of Dns-Cl in bicarbonate buffer, while Fig. 4c shows the chromatogram of a standard AA mixture. The chromatographic conditions were optimized to prevent nonspecific peaks from interfering with the quantification of AAs, thus ensuring the reliability of the analysis.
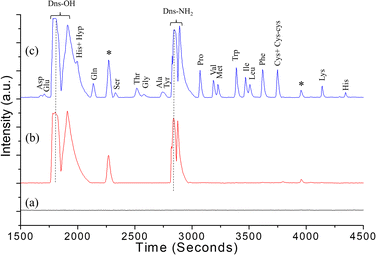 | ||
| Fig. 4 (a) Blank, (b) chromatogram of Dns-Cl in bicarbonate buffer. (c) Chromatogram of the dansylated standard AA mixture in bicarbonate buffer (* – residual peaks). | ||
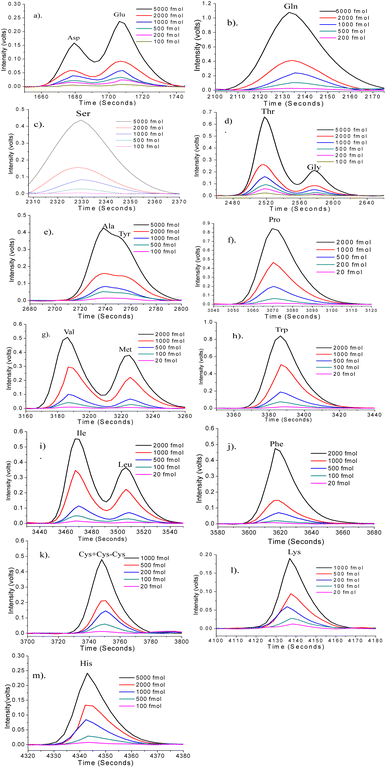
A total of 20 AAs were detected, and out of these, the histidine dansylation resulted in two peaks. T4-hydroxyproline and the first of the two His peaks invariably co-eluted, posing difficulty in quantification due to the combined peak eluting as a shoulder to a significant peak formed by dansyl hydroxy product. The quantification was done using the second His peak. Fig. 5 displays the overlaid chromatograms for various AA concentrations. The solution of standard AAs was measured at decreasing concentrations until a peak three times higher than the baseline was observed. The AA peaks were quantified using a standard calibration method, which involved constructing five- to six-point calibration curves for each AA. Fig. 6 shows the calibration curves for the AAs plotted using the intensity of the AA peak of the chromatogram against their respective concentrations. The limit of detection (LOD), and limit of quantification (LOQ) were calculated using standard error and slope using the equation, LOD = 3.3 × standard error/slope and LOQ = 10 × standard error/slope.37 Table 1 shows the retention time (RT), LOD, LOQ, relative standard deviation, and R2 values for 18 AAs, calculated using the calibration curves. It was observed that, most of the AAs analyzed have detection limits below 50 fmol. The standard curve R2 value for 18 AAs analyzed was 0.98 or higher. This shows good linearity over the concentration range examined, indicating that the technique can accurately quantify AAs over a wide dynamic range.
| Sl. No. | Amino acid | RT (seconds) | Standard error (×10−4) | Slope (×10−4) | LOD (fmol) | LOQ (fmol) | Linear range (fmol) | R2 |
|---|---|---|---|---|---|---|---|---|
| 1 | Asp | 1676.8 | 7.5 | 0.29 | 85.34 | 258.62 | 100–5000 | 0.989 |
| 2 | Glu | 1706.7 | 11.1 | 0.46 | 79.63 | 241.30 | 100–5000 | 0.999 |
| 3 | Gln | 2134 | 29.4 | 2.1 | 46.20 | 140.00 | 100–5000 | 0.999 |
| 4 | Ser | 2328 | 2.7 | 0.59 | 15.1 | 45.76 | 20–5000 | 0.993 |
| 5 | Thr | 2516.7 | 10 | 1.3 | 25.38 | 76.92 | 100–5000 | 0.999 |
| 6 | Gly | 2576 | 3.2 | 0.42 | 25.14 | 76.19 | 100–5000 | 0.999 |
| 7 | Ala | 2737 | 5.4 | 0.835 | 21.34 | 64.67 | 100–5000 | 0.999 |
| 8 | Tyr | 2750 | 1.35 | 0.76 | 5.86 | 17.76 | 20–5000 | 0.997 |
| 9 | Pro | 3069.6 | 38 | 3.8 | 33.00 | 100.00 | 100–2000 | 0.999 |
| 10 | Val | 3186 | 3.6 | 2.8 | 4.24 | 12.85 | 20–2000 | 0.984 |
| 11 | Met | 3225 | 8.1 | 2 | 13.36 | 40.50 | 20–2000 | 0.996 |
| 12 | Trp | 3386 | 38 | 4.3 | 29.16 | 88.37 | 100–2000 | 0.993 |
| 13 | Ile | 3467 | 4.6 | 3 | 5.06 | 15.33 | 20–2000 | 0.995 |
| 14 | Leu | 3506 | 16 | 1.9 | 27.78 | 84.21 | 100–2000 | 0.999 |
| 15 | Phe | 3616.6 | 28 | 4 | 23.10 | 70.00 | 100–2000 | 0.987 |
| 16 | Cys + Cys–Cys | 3748 | 80 | 4.3 | 60.39 | 186.04 | 100–2000 | 0.992 |
| 17 | Lys | 4136.6 | 11.9 | 1.7 | 23.10 | 70.00 | 100–2000 | 0.983 |
| 18 | His | 4342 | 1.1 | 0.46 | 7.89 | 23.91 | 100–5000 | 0.998 |
The repeatability was assessed at two different concentration levels (200 and 1000 fmol) to ensure consistent and accurate results from the system. Table 2 summarizes the intra-day and inter-day repeatability for AA detection using the HPLC-LSF system. Intra-day precision was evaluated by performing five repeated injections on the same day. Most AAs exhibited a %RSD of less than 6% at both concentrations, indicating high precision within a single day. Inter-day precision measures the consistency of a method over an extended period. The inter-day precision was assessed using the same analytical conditions over three consecutive days (n = 5). The %RSD for AAs remained below 6%, indicating good repeatability for analyzing AAs over extended periods.
| Amino acids | Average RT (seconds) | Intra-day repeatability | Inter-day repeatability | ||||||
|---|---|---|---|---|---|---|---|---|---|
| For 1000 fmol | For 200 fmol | For 1000 fmol | For 200 fmol | ||||||
| Mean intensity ± SD (10−3) | %RSD | Mean intensity ± SD (10−3) | %RSD | Mean intensity ± SD (10−3) | %RSD | Mean intensity ± SD (10−3) | %RSD | ||
| Asp | 1662 ± 18 | 33 ± 1.4 | 4.28 | 5.2 ± 0.29 | 5.55 | 33 ± 1.7 | 5.25 | 5.2 ± 0.26 | 5.08 |
| Glu | 1694 ± 13 | 50 ± 2.1 | 4.34 | 7.7 ± 0.24 | 3.08 | 51 ± 2.3 | 4.49 | 7.3 ± 0.29 | 3.93 |
| Gln | 2123 ± 16 | 202 ± 4.4 | 2.21 | 25.0 ± 1.41 | 5.65 | 213 ± 5.7 | 2.70 | 25.3 ± 1.5 | 6.03 |
| Ser | 2318 ± 17 | 85 ± 3.9 | 4.67 | 5.1 ± 0.25 | 4.82 | 85 ± 4.2 | 4.88 | 5.2 ± 0.25 | 4.80 |
| Thr | 2509 ± 9 | 105 ± 3.6 | 3.46 | 22.2 ± 0.96 | 4.31 | 105 ± 5.0 | 4.76 | 22.0 ± 1.0 | 4.54 |
| Gly | 2567 ± 18 | 34 ± 1.6 | 4.86 | 7.0 ± 0.38 | 5.47 | 35 ± 1.5 | 4.32 | 7.0 ± 0.47 | 6.72 |
| Ala | 2728 ± 20 | 82 ± 2.6 | 3.16 | 12.4 ± 0.63 | 5.07 | 84 ± 2.5 | 2.98 | 14.3 ± 0.57 | 4.02 |
| Tyr | 2743 ± 17 | 79 ± 2.2 | 2.87 | 14.4 ± 0.50 | 3.47 | 83 ± 3.0 | 3.69 | 14.6 ± 0.57 | 3.93 |
| Pro | 3065 ± 16 | 398 ± 4.4 | 1.12 | 68.0 ± 2.88 | 4.24 | 393 ± 5.7 | 1.46 | 67.3 ± 3.05 | 4.53 |
| Val | 3182 ± 14 | 210 ± 6.1 | 2.91 | 41.0 ± 1.15 | 2.81 | 210 ± 10 | 4.76 | 41.3 ± 1.52 | 3.69 |
| Met | 3221 ± 14 | 204 ± 5.5 | 2.68 | 30.4 ± 1.00 | 3.29 | 203 ± 5.7 | 2.84 | 31.0 ± 1.0 | 3.22 |
| Trp | 3384 ± 15 | 402 ± 10.9 | 2.72 | 76.4 ± 2.21 | 2.90 | 386 ± 11.5 | 2.99 | 76.6 ± 3.05 | 3.98 |
| Ile | 3467 ± 17 | 320 ± 12.2 | 3.82 | 47.8 ± 2.38 | 4.98 | 316 ± 15.2 | 4.82 | 47.0 ± 2.6 | 5.63 |
| Leu | 3505 ± 16 | 209 ± 7.4 | 3.54 | 31.4 ± 0.95 | 3.05 | 225 ± 8.6 | 3.85 | 32.0 ± 1.0 | 3.12 |
| Phe | 3616 ± 16 | 397 ± 6.7 | 1.68 | 69.8 ± 1.50 | 2.15 | 386 ± 11.5 | 2.98 | 66.6 ± 2.88 | 4.33 |
| Cys + Cys–Cys | 3737 ± 15 | 232 ± 8.3 | 3.60 | 61.6 ± 2.87 | 4.66 | 230 ± 10 | 4.34 | 61.6 ± 2.88 | 4.68 |
| Lys | 4136 ± 4 | 185 ± 5.0 | 2.70 | 29.8 ± 1.00 | 3.35 | 183 ± 5.7 | 3.15 | 28.6 ± 1.15 | 4.02 |
| His | 4343 ± 0.5 | 74 ± 4.2 | 5.65 | 7.5 ± 0.47 | 6.25 | 75 ± 4.1 | 5.52 | 7.5 ± 0.5 | 6.66 |
The efficacy and reliability of the suggested approach were assessed using correlation uncertainty and predicted values. Table 3 shows the correlation of uncertainty and the expected concentration of AAs using the leave-one-out approach. By employing known concentrations of the AAs in this procedure, a calibration curve was plotted, and one AA concentration can be omitted as a test sample. The predicted concentration (Cp) of the sample is determined from the ratio of signal intensity of the analyte concentration with corrected intercept value (y − c) and the slope (m) from the calibration curve.
| Sl. No. | Amino acids | Known concentration (Ck) fmol | Predicted concentration (Cp) [x = (y − c)/m] fmol | Correlation uncertainty (%) (|Ck − Cp|/Cp) × 100% |
|---|---|---|---|---|
| 1 | Asp | 1000 | 938.30 | 3.13 |
| 2 | Glu | 1000 | 1042.52 | 3.19 |
| 3 | Gln | 2000 | 1932.85 | 3.47 |
| 4 | Ser | 2000 | 2004.61 | 1.91 |
| 5 | Thr | 500 | 490.4 | 1.95 |
| 6 | Gly | 500 | 469.76 | 5.16 |
| 7 | Ala | 2000 | 1923.75 | 3.96 |
| 8 | Tyr | 500 | 466.66 | 5.63 |
| 9 | Pro | 1000 | 1015.58 | 1.53 |
| 10 | Val | 1000 | 944.59 | 4.51 |
| 11 | Met | 500 | 465.5 | 6.38 |
| 12 | Trp | 1000 | 1006.97 | 7.62 |
| 13 | Ile | 500 | 469 | 6.53 |
| 14 | Leu | 2000 | 1866.84 | 10.7 |
| 15 | Phe | 1000 | 977.5 | 2.04 |
| 16 | Cys + Cys–Cys | 1000 | 1055.68 | 5.08 |
| 17 | Lys | 500 | 455.55 | 7.40 |
| 18 | His | 2000 | 2019.35 | 0.95 |
Evaluation of the blue applicability grade index (BAGI) and greenness assessment
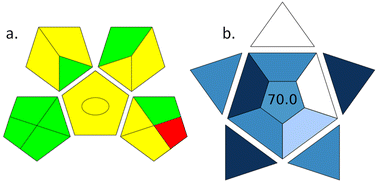
The field of green analytical chemistry focuses on reducing the use of harmful solvents in the extraction and sample preparation process and minimizing the energy consumption of analytical instruments.38 The green analytical procedure index (GAPI) aids in assessing the environmental impact of analytical techniques by considering various parameters such as the types of reagents or solvents used, energy consumption, waste production, and the potential for materials recycling and reuse.39 ComplexGAPI was utilized to assess our technique, demonstrating the method's green feature by providing a graphical representation of a pentagon. The representation includes three colours (green, red, and yellow) to indicate environmental impact and severity. The GAPI pictogram in Fig. 7a indicates that the proposed method largely follows green chemistry guidelines, as shown by the significant yellow and green colours. This method uses green solvents like methanol and sodium acetate, simple sample preparation, and treatment procedures. Additionally, the low flow rate (0.2 mL min−1) used to separate AAs significantly reduces solvent, waste, and energy consumption in the LC system. The only red region in the Pentagon represents waste generation of more than 10 mL, which occurs because each run requires approximately 12 mL of solvents. Despite this, the proposed method is predominantly green and environmentally friendly. To address waste generation, solvent recovery and method optimization can be employed.The practicality of the analytical procedure was evaluated using BAGI software. It assesses a range of parameters, such as the type of analysis, methods for sample preparation, the total number of steps, samples examined in an hour, the volume of sample, necessary preconcentration, instruments required, and automation level.40 It yields a score that typically ranges from 25 to 100, with a score of 100 indicating exceptional applicability and a score of less than 25 suggesting lower relevance. The total score obtained for the HPLC-LSF method using the BAGI software is 70, as depicted in Fig. 7b. This result meets the specified acceptance threshold. By utilizing derivatization, our analytical method allowed for the simultaneous analysis of 20 AAs. Less than 5 μL of sample is adequate for measuring AAs in biological fluids, ensuring sufficient sensitivity and minimal biological waste.
Detection of AAs in serum sample
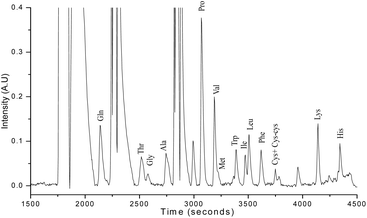
AA analysis of a human serum sample was conducted to demonstrate the practical application of the usefulness of the Dns derivatized AAs with the above-mentioned HPLC-LSF system. The blood sample was collected from a healthy volunteer. Ethical clearance was obtained for the study from the institutional ethical committee of Kasturba Hospital, Manipal (IEC 651/2020), and written informed consent was obtained from the participant. The serum sample was obtained by centrifuging the blood sample at 2000 rpm for 10 min. 1 μL of serum sample was diluted using sodium bicarbonate buffer (74 μL) and derivatized following the method described in the previous section. Fig. 8 depicts the chromatogram of the AA profile of human serum, and 15 AAs were found in the sample.The study results emphasize that the in-house developed HPLC-LSF system is capable of simultaneously detecting 20 AAs at lower concentrations in the range of fmol. This high sensitivity and precision of the system enables accurate identification of AAs, making it a suitable option for AA profiling in biological fluids such as cerebrospinal fluid,41 saliva,42 and tears15 where AA levels are typically very low (of the order of picomole or below). This technique requires minimal sample volume (less than 5 μL), which is advantageous when working with precious biological samples. For instance, when studying AA-related disorders in infants, a limited volume of biological fluid is available for testing. In such cases, the HPLC-LSF technique can be used to analyze AAs with very small sample volumes, reducing the necessity for large blood draws and ensuring sufficient sensitivity.
Conclusion
The study demonstrated the effectiveness of the HPLC-LSF system for the simultaneous detection of 20 AAs. Optimization of the derivatization conditions significantly enhanced sensitivity and reliability in AA detection. The method exhibits excellent sensitivity, with a LOD ranging from 4.32 to 85.34 fmols. Furthermore, the repeatability and reliability of the system were validated using intra-day and inter-day precision tests.The findings underscore the efficiency and reliability of the proposed method in thoroughly examining AA levels in biological fluids. This method holds significant potential for clinical applications, especially in monitoring disease progression, assessing treatment efficacy, and facilitating early diagnosis of AA-related disorders. In addition to clinical diagnostics, this method offers promising applications in biochemistry, pharmaceutical research, and environmental monitoring for accurate measurement of AAs.
Data availability
The data supporting the findings of this study are part of a patent application submitted to the Indian Patent Office (Application No. 202341044833 dated 4th July 2023) and data may be shared upon request.Conflicts of interest
The present work has been filed for intellectual property rights in the Indian Patent Office, Chennai (Application No. 202341044833 dated 4th July 2023).Acknowledgements
Ms Megha Naik gratefully acknowledges the Dr T. M. A. Pai scholarship provided by the Manipal Academy of Higher Education. The authors thank the Manipal Academy of Higher Education for the MAHE-Intramural Grant – MAHE/CDS/PHD/IMF/2019.References
- W. Xu, C. Zhong, C. Zou, B. Wang and N. Zhang, Amino Acids, 2020, 52, 1071–1088 CrossRef CAS PubMed.
- H. Kaspar, K. Dettmer, W. Gronwald and P. J. Oefner, Anal. Bioanal. Chem., 2009, 393, 445–452 CrossRef CAS PubMed.
- E. Aliu, S. Kanungo and G. L. Arnold, Ann. Transl. Med., 2018, 6, 471 CrossRef CAS PubMed.
- B. Tan, X. Li, G. Wu, X. Kong, Z. Liu, T. Li and Y. Yin, Amino Acids, 2012, 43, 2481–2489 CrossRef CAS PubMed.
- A. Suryawan, H. V. Nguyen, R. D. Almonaci and T. A. Davis, Amino Acids, 2013, 45, 523–530 CrossRef CAS PubMed.
- S. Katayama and Y. Mine, J. Agric. Food Chem., 2007, 55, 8458–8464 CrossRef CAS PubMed.
- J. Y. Kim, R. C. Burghardt, G. Wu, G. A. Johnson, T. E. Spencer and F. W. Bazer, Biol. Reprod., 2011, 84, 62–69 CrossRef CAS PubMed.
- G. Wu, Amino Acids, 2013, 45, 407–411 CrossRef CAS PubMed.
- G. K. Jayaprakasha and B. S. Patil, Talanta, 2016, 153, 268–277 CrossRef CAS PubMed.
- R. Mandrioli, L. Mercolini and M. A. Raggi, Anal. Bioanal. Chem., 2013, 405, 7941–7956 CrossRef CAS PubMed.
- M. M. Hasan, M. H. Razu, S. Akter, S. A. Mou, M. Islam and M. Khan, RSC Adv., 2024, 14, 22292–22303 RSC.
- D. Lane, R. Soong, W. Bermel, P. Ning, R. D. Majumdar, M. Tabatabaei-Anaraki, H. Heumann, M. Gundy, H. Bönisch, Y. L. Mobarhan, M. J. Simpson and A. J. Simpson, ACS Omega, 2019, 4, 9017–9028 CrossRef CAS PubMed.
- T. Tchipilov, K. Meyer and M. G. Weller, Methods Protoc., 2023, 6, 11 CrossRef CAS PubMed.
- Y. Alnouti, I. L. Csanaky and C. D. Klaassen, J. Chromatogr. B: Anal. Technol. Biomed. Life Sci., 2008, 873, 209–217 CrossRef CAS PubMed.
- C. X. Du and Z. Huang, RSC Adv., 2019, 9, 36539–36545 RSC.
- R. Zhao, B. Huang, G. Lu, S. Fu, J. Ying and Y. Zhao, Int. J. Mol. Sci., 2023, 24, 7332 CrossRef CAS PubMed.
- S. Kambhampati, J. Li, B. S. Evans and D. K. Allen, Plant Methods, 2019, 15, 1–12 CrossRef PubMed.
- G. Sharma, S. V. Attri, B. Behra, S. Bhisikar, P. Kumar, M. Tageja, S. Sharda, P. Singhi and S. Singhi, Amino Acids, 2014, 46, 1253–1263 CrossRef CAS PubMed.
- S. M. Eid, M. A. Farag and S. Bawazeer, ACS Omega, 2022, 7, 31106–31114 CrossRef CAS PubMed.
- S. A. Cohen, B. A. Bidlingmeyer and T. L. Tarvin, Nature, 1986, 320, 769–770 CrossRef CAS PubMed.
- Y. Sakaguchi, T. Kinumi, T. Yamazaki and A. Takatsu, Analyst, 2015, 140, 1965–1973 RSC.
- S. A. Cohen, in Amino Acid Analysis Protocols, Humana Press, New Jersey, 2000, vol. 159, pp. 039–047 Search PubMed.
- H. K. Mayer and G. Fiechter, Anal. Bioanal. Chem., 2013, 405, 8053–8061 CrossRef CAS PubMed.
- M. J. González-Castro, J. López-Hernández, J. Simal-Lozano and M. J. Oruña-Concha, J. Chromatogr. Sci., 1997, 35, 181–185 Search PubMed.
- C. Molins-Legua, P. Campíns-Falcó, A. Sevillano-Cabeza and M. Pedrón-Pons, Analyst, 1999, 124, 477–482 RSC.
- N. Parris and D. Gallelli, J. Liq. Chromatogr., 1984, 7, 917–924 CrossRef CAS.
- C. Gros and B. Labouesse, Eur. J. Biochem., 1969, 7, 463–470 CrossRef CAS PubMed.
- W. R. Gray, Methods Enzymol., 1972, 25, 121–138 CAS.
- K. Stephens, PhD thesis, Ball State University, 1986.
- S. Bhat, A. Patil, L. Rai, V. B. Kartha and S. Chidangil, Sci. World J., 2012, 2012, 1–7 CrossRef PubMed.
- A. Patil, S. Bhat, L. Rai, V. B. Kartha and S. Chidangil, AIP Conf. Proc., 2011, 1349, 226–227 CrossRef CAS.
- A. Patil, K. S. Choudhari, V. K. Unnikrishnan, N. Shenoy, R. Ongole, K. M. Pai, V. B. Kartha and S. Chidangil, J. Biomed. Opt., 2013, 18, 101317 CrossRef PubMed.
- A. Patil, V. Prabhu, K. S. Choudhari, V. K. Unnikrishnan, S. D. George, R. Ongole, K. M. Pai, J. K. Shetty, S. Bhat, V. B. Kartha and S. Chidangil, J. Biomed. Opt., 2010, 15, 067007 CrossRef PubMed.
- S. Bhat, A. Patil, L. Rai, V. B. Kartha and C. Santhosh, J. Chromatogr. B: Anal. Technol. Biomed. Life Sci., 2010, 878, 3225–3230 CrossRef CAS PubMed.
- X. Kang, J. Xiao, X. Huang and Z. Gu, Clin. Chim. Acta, 2006, 366, 352–356 CrossRef CAS PubMed.
- R. Minocha and S. Long, J. Chromatogr. A, 2004, 1035, 63–73 CrossRef CAS PubMed.
- R. V. John, T. Devasia, S. S. Adigal, J. Lukose, V. B. Kartha and S. Chidangil, J. Chromatogr. B: Anal. Technol. Biomed. Life Sci., 2023, 1217, 123616 CrossRef CAS PubMed.
- M. Sajid and J. Płotka-Wasylka, Talanta, 2022, 238, 123046 CrossRef CAS PubMed.
- J. Płotka-Wasylka and W. Wojnowski, Green Chem., 2021, 23, 8657–8665 RSC.
- N. Manousi, W. Wojnowski, J. Płotka-Wasylka and V. Samanidou, Green Chem., 2023, 25, 7598–7604 RSC.
- C. M. Jones, M. Smith and M. J. Henderson, Ann. Clin. Biochem., 2006, 43, 63–66 CrossRef CAS PubMed.
- H. Masoudi Rad, M. Rabiei, A. Sobhani, M. Sadegh Khanjani, M. Rahbar Taramsar and E. Kazemnezhad Leili, J. Oral Rehabil., 2014, 41, 759–767 CrossRef CAS PubMed.
| This journal is © The Royal Society of Chemistry 2024 |

