 Open Access Article
Effect of density on the smoldering of calcium alginate fibers†
Ziming Wang a,
Yide Liu
 a,
Zewen Lia,
Yujie Caia and
Fengyu Quan*b
aSchool of Materials Science and Engineering, Qingdao University, Qingdao 266071, China. E-mail: wangziming7268@163.com; Liuyd9519@163.com; 17660706137@163.com; jessicacai1130@163.com; Tel: +86 18763497268 Tel: +86 15863081995 Tel: +86 17660706137 Tel: +86 17856076797
bState Key Laboratory of Bio-Polysaccharide Fiber Forming and Eco-Textile jointly, established Ministry of Provincial Affairs of China, Qingdao University, Qingdao 266071, China. E-mail: quanfengyu@qdu.edu.cn; Tel: +86 13863990812
First published on 11th September 2024
Abstract
The onset temperature of smoldering for calcium alginate fibers was determined across several densities. Experimental results and theoretical calculations proved that as the density of calcium alginate fibers increases, its smoldering occurrence temperature decreases. From the experiments, the thermal stability of calcium alginate fibers decreases with increasing density. It is concluded that the mass loss of calcium alginate fiber during smoldering varies significantly with density, with higher density exhibiting higher mass loss.
1 Introduction
Alginate, extracted from brown algae, consists of α-L-guluronic acid (G) and β-D-mannuronic acid (M).1,2 As an intrinsically flame-retardant renewable fiber, calcium alginate fiber is non-toxic, biocompatible and potentially bioactive. The new green fiber, with excellent performance, has a wide range of sources and applications.3 Xia's team has conducted much research on the fire-resistant mechanism of alginate fibers and proposed a metal ion flame-retardant mechanism.4–7Tian Xing et al.8 used sodium tetraborate to establish a cross-linking structure in the fibers, resulting in modified alginate fibers with enhanced fracture strength, as well as improved resistance to salt and detergents. Zhang Jianjun5,6 analyzed the pyrolysis process of alginate fibers. Under identical pyrolysis conditions, the pyrolysis products of divalent metal ion alginate fibers were fewer compared to those of alginate fibers. This indicated an incomplete thermal degradation process for divalent metal ion alginate fibers and implies that divalent metal ions switch the pyrolysis process of alginate fibers.
Calcium alginate fiber, an intrinsically flame-retardant renewable fiber originating from the ocean, holds significant potential in the field of flame retardancy. However, it has been observed that calcium alginate fiber exhibits a phenomenon of smoldering, which becomes particularly serious in denser states. The peak temperature of smoldering is low.9 During a fire, smoldering poses the risk of secondary ignition of flammable materials, leading to the re-smoldering of fire and great safety hazards. The first task for alginate fiber to be widely used in indoor textiles such as military training, protection and firefighting, nuclear submarines, ships, aircraft carriers and other indoor textiles, as well as in textiles used in public places such as transportation and high-class hotels, is to solve the smoldering phenomenon of calcium alginate fiber and conduct research on the smoldering mechanism and its characteristics.
The smoldering of cellulose fibers is significantly influenced by density.10 At higher densities, smoldering occurs, as suggested by Babrauskas.11 A 50% increase in density leads to a decrease of about 10 °C in the temperature at which smoldering occurs in cellulose fibers.12–14 For cotton, the critical smoldering temperature increases with the increase of density.15 Additionally, if the density is sufficiently high, smoldering does not occur.16 Due to the high cost of alginate fiber and smoldering, flame retardant viscose,17 flame retardant polyester18 and alginate fiber blends are usually selected to develop blended flame retardant fabrics with properties such as good flame retardancy, comfortable wear and cost-effectiveness. In addition, the smoldering mechanism of alginate fiber itself remains unexplored.
This paper investigates the effect of density on the temperature required for smoldering of calcium alginate fibers. It presents the smoldering temperatures of calcium alginate fiber at different densities and provides the calculation process for the related kinetic parameters. The residue after smoldering was subjected to XRD test to analyze the smoldering products. The smoldering residue was analyzed by Raman spectroscopy to investigate the effect of density on the structure of carbon layer on the residue surface.
2 Experiment
2.1 Experimental samples
Calcium alginate fiber (Industrial Grade, Qingdao Yuanhai New Material Science & Technology Co.).The ambient temperature is 25 °C, with a relative humidity of 45%.
Calcium alginate fibers with densities of 40, 60, 80 and 100 kg m−3 were used.
2.2 Experimental set-up
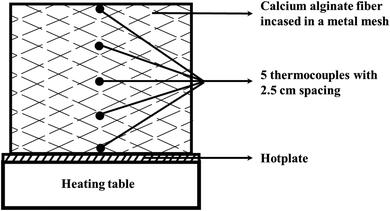
Since the sample height affects the transition from smoldering to combustion,19,20 the height of the sample was set at 0.1 m, with overall dimensions of 0.1 m × 0.1 m × 0.1 m, as shown in Fig. 1. Calcium alginate fibers were filled into a wire mesh container, with metal mesh used at the top and bottom ends to prevent fiber expansion, as shown in Fig. 1.Thermocouples (see below) were placed throughout the sample at a uniform density, with the screen container allowing air to enter the calcium alginate fiber package. The test stand is free-standing, with unrestricted airflow around it.To monitor temperature, a multiplexed temperature logger (TCP-8XL, MEASUREFINE Wisepac) was used, with five type K thermocouples placed from the top of the hot plate to the top of the model. Thermocouples were placed on the vertical centerline of the calcium alginate fiber packs at 2.5 cm intervals. The diameter of the thermocouples, including the housing, was 0.5 cm.
The far-infrared microcrystalline heating plate (DB-XWJ, Shanghai Li-Chen Bang Xi Instrument Science and Technology Co., Ltd) was selected as the ignition source because it can repeat heating scenarios. The hot plate consists of a heating table and a hot plate.
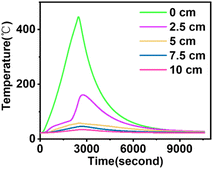
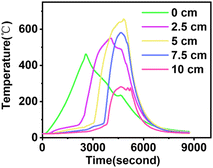
In the experiment, the hot plate is heated to a predetermined temperature. Due to the residual temperature of the metal wire inside the heating table, the measured hot plate temperature increases even when the power is cut off. In Fig. 2, when the hot plate temperature attained 440 °C, the power supply was cut off, and the highest temperature recorded for the hot plate was 446.09 °C. The temperature distribution in Fig. 2 is a non-smoldering setting, where the hot plate cools down after attaining the maximum temperature. Fig. 3 shows the experimental temperature distribution where smoldering occurs. Here, the hot plate does not cool in the same way, and the entire sample reaches a high temperature due to the heat generated by smoldering.
2.3 Procedure
Before data collection, the power to the hot plate was turned on, and calcium alginate fibers of the specified density were placed onto it. After ten minutes, heating of the hot plate began. The heating process ceases when the temperature displayed by the first type K thermocouple reaches a pre-set temperature, referred to as the cut-off temperature. As the hot plate retains residual heat, the temperature continues to rise. The maximum temperature of the hot plate is recorded.If the calcium alginate fibers were undercooked, the experiment was terminated when the overall temperature of the sample fell below 100 °C at the end of the undercooking. If the calcium alginate fibers do not undergo smoldering, then the experiment is concluded when the temperatures of the first and second K-type thermocouples drop. However, data should be recorded for at least 90 min in all cases. In this paper, the smoldering temperature was analyzed using the cut-off temperature and the highest temperature recorded for the hot plate.
2.4 Heating method
The heating mode used in this paper is single-mode heating chosen for its investigative advantages in the smoldering test from a range of perspectives, including safety.21 Calcium alginate fiber packs of different densities were reheated to a pre-set temperature, and samples were replaced if smoldering did not occur.3 Experimental results
3.1 Temperature data
When the density of calcium alginate fiber is 60 kg m−3, the heating temperature reaches 440 °C, and the heating table is turned off. Then the temperature reaches 446.09 °C. At this point, no smoldering occurs, as shown in Fig. 2. When the density of calcium alginate fiber is 60 kg m−3, the heating temperature reaches 445 °C, and the heating table is turned off. The temperature then rises to 462.57 °C, at which point smoldering occurs, as shown in Fig. 3. The curve in the figure represents the corresponding thermocouple temperature.The temperatures of five type K thermocouples were measured, as well as their corresponding curves over time, with the first type K thermocouple showing the hot plate temperature. Fig. 2 shows the temperature–time curve when the calcium alginate fibre packs did not undergo smoldering, while Fig. 3 illustrates the temperature–time curve when they underwent smoldering. When the calcium alginate fiber pack undergoes smoldering, the K-type thermocouple contacts flowing cold air post-smoldering, causing a more significant temperature drop.
3.2 Determination of the smoldering generation temperature
Fig. 2 and 3 show the maximum temperature of the hot plate. For both cases, the highest hot plate temperature recorded was determined by the first electric thermocouple above the hot plate, as shown in Fig. 2 and 3. The maximum hot plate temperature corresponds to the cutoff temperature in Fig. 4.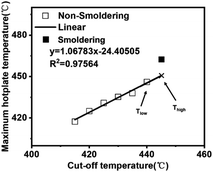 | ||
| Fig. 4 The points corresponding to the highest hot plate temperatures for all cut off temperatures were fitted at a density of 60 kg m−3 for the calcium alginate fiber packs. | ||
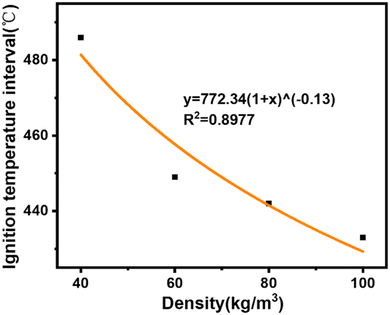
The relationship between the cut-off temperature and the maximum hot plate temperature is linear in the case of non-smoldering, but deviates significantly in the case of smoldering. The recorded hot plate temperature during smoldering (462 °C in Fig. 4) is inaccurate because of heat production from the smoldering of calcium alginate fibers. Therefore, the points corresponding to the highest hot plate temperatures in the absence of smoldering can be fitted to predict the temperature at which smoldering occurs. The maximum hot plate temperature corresponding to the previous cutoff temperature at which smoldering occurs, is called Tlow. The predicted temperature for smoldering, obtained through linear fitting, is called Thigh, as shown in Fig. 4. It is reasonable to assume that the smoldering temperature of the calcium alginate fiber pack is between Tlow and Thigh. This trend can be seen in Table 3 and Fig. 5, showing a general trend decrease in smoldering temperatures with higher specimen density.
3.3 Smoldering temperature and mass loss
The smoldering temperatures and corresponding mass loss of calcium alginate fibers at different densities are shown in Tables 1 and 2. As the density of calcium alginate fibers increases, there is an observed increase in the mass loss at the onset of smoldering, along with a decrease in the smoldering temperature.| Density (kg m−3) | 40 | 60 | 80 | 100 |
| Mass lose (%) | 51.02 | 71.22 | 71.66 | 75.36 |
| Density (kg m−3) | Tlow–Thigh (°C) | Smoldering temperatures (°C) |
|---|---|---|
| 40 | 484–490 | 486 |
| 60 | 446–450 | 449 |
| 80 | 440–444 | 442 |
| 100 | 430–435 | 433 |
| Function law name | g(a) | f(a) = (1/k)(da/dt) |
|---|---|---|
| Ordinary reaction | ||
| Phase–interface reaction | a | 1 |
| Primary reaction | –ln(1 − a) | 1 − a |
| Secondary reaction | (1 − a)−1 | (1 − a)2 |
| Tertiary reaction | (1 − a)−2 | (1 − a)3 |
![[thin space (1/6-em)]](https://www.rsc.org/images/entities/char_2009.gif) |
||
| Stage boundary control reaction | ||
| Shrinking cylinder | 1 − (1 − a)1/2 | 2(1 − a)1/2 |
| Shrinkage sphere | 1 − (1 − a)1/3 | 2(1 − a)2/3 |
![[thin space (1/6-em)]](https://www.rsc.org/images/entities/char_2009.gif) |
||
| Diffusion-controlled reaction | ||
| Power function law | a2 | 1/2a |
| The Valensi equation | (1 − a)ln(1 − a) + a | [−ln(1 − a)]−1 |
| The Jander equation | [1 − (1 − a)1/3]2 | 3/2(1 − a)2/3[1 − (1 − a)1/3]−1 |
| The G–B equation | (1 − 2a/3) − (1 − a)2/3 | 3/2[(1 − a)−1/3 − 1]−1 |
4 Theoretical calculation model for determining the smoldering temperature
In this paper, the influence of density on the temperature at which smoldering of calcium alginate fibers occurs is theoretically calculated using the easiest one-dimensional matrix that incorporates heat flow and heat production. This model assumes that in the absence of smoldering, heat is transported from the smoldering source to cooler portions of the one-dimensional material12,22
 | (3) |
 | (4) |
The lR represents the depth of the reaction zone during the smoldering of calcium alginate fiber, as shown in Table 4. The heat generation in the calcium alginate fiber package is determined by the depth of the calcium alginate fiber sample, mainly due to the negligible contribution of the unit area of the heating table in the equation. This depth can thus be calculated using the following equation12
 | (5) |
 | (6) |
| Function law name | Correlation coefficient | ||
|---|---|---|---|
| 10 °C min−1 | 15 °C min−1 | 20 °C min−1 | |
| Phase–interface reaction | 0.95014 | 0.95021 | 0.95032 |
| Primary reaction | 0.95644 | 0.95657 | 0.95664 |
| Secondary reaction | 0.95478 | 0.95431 | 0.95462 |
| Tertiary reaction | 0.94783 | 0.94693 | 0.94766 |
| Shrinking cylinder | 0.95324 | 0.95364 | 0.95372 |
| Shrinkage sphere | 0.95429 | 0.95413 | 0.95443 |
| Power function law | 0.95016 | 0.95024 | 0.95031 |
| The Valensi equation | 0.7281 | 0.72934 | 0.72914 |
| The Jander equation | 0.72879 | 0.72846 | 0.72903 |
| The G–B equation | 0.72833 | 0.72863 | 0.72874 |
Assuming the heat loss in the smoldering of calcium alginate fiber packs is considered to be primarily due to heat conduction, it is inferred from Fourier's law that the heat loss in the smoldering of calcium alginate fiber packs is the amount of heat generated in the smoldering of calcium alginate fibers in eqn (4). Here, b is the temperature gradient inside the calcium alginate fiber packs. Furthermore, the temperature at which smoldering of calcium alginate fibers occurs can be derived from the following equations12
 | (7) |
The data on the relevant properties of the material are shown in Table 5. The l is the characteristic length of the calcium alginate fiber pack, which represents the length of the reaction zone within the pack and is shown in Fig. 8. The characteristic length of the calcium alginate fiber pack is 0.05 m. This length is determined by the most significant temperature drop observed in the calcium alginate fibers, and, therefore, defines the reaction zone of the calcium alginate fiber pack to be 0.05 m. The convective heat transfer coefficient was established as 10 W m−2 K−1 for natural convection.27 The thermal conductivity of calcium alginate fiber was determined using a thermal conductivity instrument (TC3000E, Xi'an Xiaxi Electronic Technology Co., Ltd), and the results are shown in Table 5.
The activation energy of calcium alginate fiber is calculated based on the chemical reaction kinetics. The reaction rate of calcium alginate fiber can be expressed by eqn (8)
 | (8) |
 | (9) |
Integrating both sides of eqn (9) between 0 to a and T0 to T, respectively, yields
 | (10) |
 side of eqn (10) is called the integral of change rate constructor, while the
  side is called the integral of temperature. The time-continuous integration of eqn (10) does not provide an analytical solution, and numerical analysis must be used to obtain the approximate solution. In the approximation, the Coats–Redfern28 integral formula is commonly employed:
 | (11) |
The experimental data were processed based on different types of reactive constructors, and regression analysis was conducted to examine the correlation between ln[g(a)/T2] and 1/T. The kinetic function with the highest correlation represents the reaction mechanism of the non-isothermal oxidation process of calcium alginate fibers. Then, plotting ln[g(a)/T2] against 1/T for a known reactive machine process yields a linear relationship, from which the dynamic parametric E can be obtained from the slope −E/R.
5 mg calcium alginate fiber was introduced into the apparatus for the experiment. Thermogravimetric analyzer (STA409PC, NETZSCH, Germany) is selected for testing. The experimental conditions were as follows: an airflow of 20 ml min−1, the three temperature rises of 10, 15, 20 °C min−1, and heating from room temperature to 900 °C. The TG/DTG (thermogravimetric/weight loss) curve of calcium alginate fiber was obtained, as shown in Fig. 6.
 | ||
| Fig. 6 TG/DTG curves of calcium alginate fiber: (a) β = 10 °C min−1; (b) β = 15 °C min−1; (c) β = 20 °C min−1. | ||
The correlation coefficients of the linear correlation analysis of calcium alginate fibers with 1/T under various reaction mechanisms were obtained by linear correlation analysis of ln[g(a)/T2] with 1/T for all reaction mechanisms in Table 4 using the Origin data analysis tool. The outcomes are shown in Table 4.
From the table, the correlation coefficient of calcium alginate fiber is the highest only when analyzed through the linear correlation between the first-order chemical dynamic matrix f(a) = (1 − a) and the corresponding g(a) = −ln(1 − a). This indicates that the non-isothermal oxidative decomposition process of calcium alginate fiber belongs to a first-order chemical reaction. According to the kinetic mechanism of the first-level chemical reaction, ln[−ln(1 − a)/T2] was plotted against 1/T to obtain a straight line, as shown in Fig. 7.
 | ||
| Fig. 7 First-order kinetic correlation analysis curves for calcium alginate fibers: (a) β = 10 °C min−1; (b) β = 15 °C min−1; (c) β = 20 °C min−1. | ||
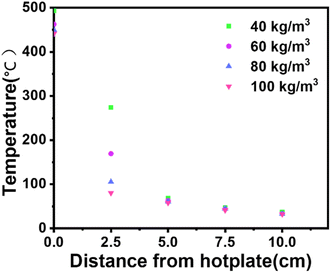 | ||
| Fig. 8 Temperature distribution within the calcium alginate fiber package at the predicted calcium alginate fiber smoldering temperature. | ||
The dynamic parametric E value can be obtained from the slope −E/R. The results of solving the kinetic parameter E of the pyrolytic oxidation process of calcium alginate fiber obtained through this method are shown in Table 5. The calculation method of A is shown in ref. 24, the calculation method of E is shown in ref. 25. The value of h is given by ref. 26, and the value of ΔHc is given by ref. 2.
5 Discussion
Fig. 5 illustrates how the smoldering onset temperature decreases with increasing density. The smoldering occurrence temperatures of calcium alginate fibers at different densities are shown in Table 3, consistent with the experimental results. As the density of the calcium alginate fiber pack increases, the wire mesh container deforms. It is predicted that the smoldering temperature of calcium alginate fibers will reach an asymptotic value, as shown in Fig. 5. It is important to emphasize that the measured smoldering temperature is instrument-dependent and the use of other heating devices, or changes in the shape of the calcium alginate fiber packs, may result in a change in the smoldering temperature of the calcium alginate fibers.12As shown in Fig. 9, the fastest warming occurs at an smoldering temperature of 40 kg m−3. Lower conductivity yields two results: (i) for a given cutoff temperature, the hot plate temperature warms up faster because of lower and slower heat transfer to the fibers above, as shown in Fig. 10; and (ii) heat penetrates the sample more slowly, leading to the slower formation of the pyrolysis layer. Therefore, a higher hot plate temperature is required for smoldering. In addition, Fig. 10 can be derived from the highest rate of temperature increase was observed at 40 kg m−3, indicating that the transfer of heat from the hot plate to the calcium alginate fibers is not as efficient at this density as it is at other densities.29
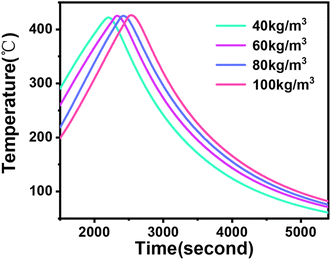 | ||
| Fig. 9 Non-smoldering for different densities of hot plate temperatures with a cutoff temperature of 420 °C. | ||
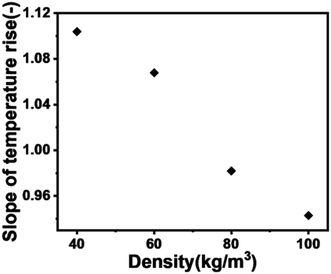 | ||
| Fig. 10 Temperature rise rate as a constructor of density, provided by the fitted curve in Fig. 5. | ||
However, it is supposed that the smoldering matrix is effective for densities from 40 to 100 kg m−3 because of slow heat transfer within calcium alginate fibers. When the density is less than 40 kg m−3, the heat flow conductivity values and characteristic lengths within the calcium alginate fiber packs are affected, which requires the use of new conductivity values and characteristic lengths.
Calcium alginate fibers with a density of 20 kg m−3 were also tested, but no self-propagating smoldering was observed at this density. Similar observations were reported by Walther et al.30 in their study of polyurethane foams.
6 XRD analysis
Fig. 11 shows the XRD images of residual charcoal of calcium alginate fibers after smoldering at different densities. X-ray polycrystalline diffractometer (Smart Lab 9 kW, Japan – Rigaku) was selected for the test, and the scanning range was 5–90°. By importing the image into Jade analysis, it can be determined that the main component of the residual charcoal of calcium alginate fibers is CaCO3. As shown in Fig. 12, at 2θ of 23.1° and 29.4°, it corresponds to the (0 1 2) and (1 0 4) facets of CaCO3; at 2θ of 35.9°, 39.4° and 43.1°, it corresponds to the (1 1 0), (1 1 3) and (2 0 2) faces; at 2θ of 57.4° and 58.0°, they correspond to the (1 2 2) and (1 0 10) faces of CaCO3. Therefore, it can be seen that the main product of calcium alginate fibers undergoing smoldering is CaCO3.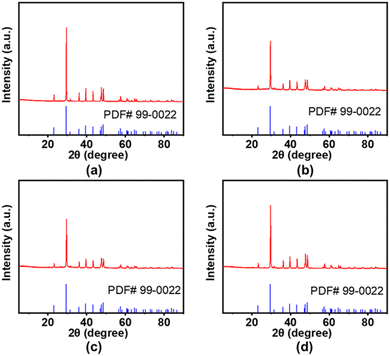 | ||
| Fig. 11 XRD plots of calcium alginate fiber residual charcoal at different densities: (a) 40 kg m−3; (b) 60 kg m−3; (c) 80 kg m−3; (d) 100 kg m−3. | ||
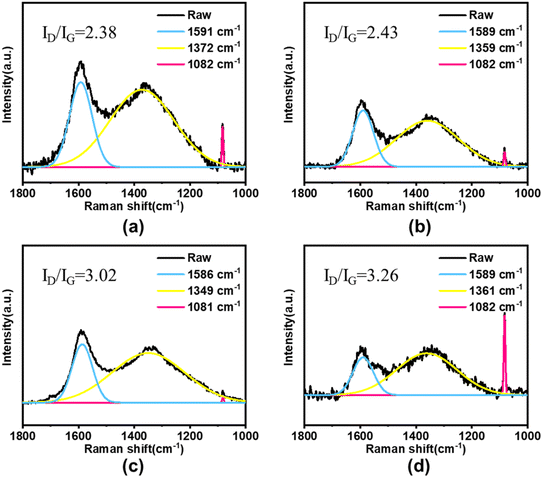 | ||
| Fig. 12 Raman spectra of residue after smoldering: (a) 40 kg m−3; (b) 60 kg m−3; (c) 80 kg m−3; (d) 100 kg m−3. | ||
7 Raman spectral analysis
The structure of the carbon layer on the surface of the residue after the smoldering of calcium alginate fibers was analyzed by Raman spectroscopy. Raman spectrometer (Nicolet 5700, Thermo Field, USA) was selected for the test. As shown in Fig. 12, in Raman spectra, the peak at 1082 cm−1 is due to calcium carbonate generated by Ca-Alg degradation, the peak around 1590 cm−1 (G-band) is due to in-plane telescopic vibrations of sp2 hybridization of carbon atoms, and the peak around 1360 cm−1 (D-band) is due to lattice defects of carbon atoms. Usually, the integral area ratio (ID/IG) of the D and G bands is used to evaluate the degree of graphitization of the residual carbon; the lower the value of ID/IG, the higher the degree of graphitization. As shown in Fig. 12, the ID/IG for 40–100 kg m−3 were 2.38, 2.43, 3.02, and 3.26, respectively, which indicates that as the density of calcium alginate fibers increases, the char layer on the surface of the residue after the smoldering of calcium alginate fibers becomes more relaxed, and thus the smoldering occurs at a lower temperature.8 Conclusion
Theoretical and experimental research on the smoldering generation temperature of calcium alginate fibers at different densities was carried out. The outcomes show that with increasing density, the smoldering onset temperature decreases while the mass loss increases. In order to further study the effect of density on the smoldering of calcium alginate fibers, the residue after smoldering of calcium alginate fibers at different densities was analyzed by Raman spectroscopy for the structure of the surface charcoal layer, and the surface charcoal layer was more relaxed with the increase in the density of calcium alginate fibers. Thus, it can be concluded that density is one of several parameters systematically affecting the smoldering temperature of calcium alginate fibers.Nomenclature
| A | Pre-exponential factor (s−1) |
| b | Smoldering slope of the linear temperature profile (K m−1) |
| E | Activation energy (J mol−1) |
| ΔHc | Heat of combustion (J kg−1) |
| h | Convective heat transfer coefficient (W m−2 K−1) |
| k | Thermal conductivity (W m−1 K−1) |
| l | Characteristic length (m) |
| lR | Reaction layer thickness (m) |
![[q with combining dot above]](https://www.rsc.org/images/entities/i_char_0071_0307.gif) ′′ ′′ | Heat flux pr. area (W m−2) |
![[q with combining dot above]](https://www.rsc.org/images/entities/i_char_0071_0307.gif) ′′′ ′′′ | Heat production pr. volume (W m−3) |
| R | Universal gas constant (J K−1 mol−1) |
| T | Sample temperature (K) |
| Ta | Ambient temperature (K) |
| V | Volume of the sample (m3) |
| W | Mass of cotton (kg) |
| ρ | Density of cotton fibers (kg m−3) |
Data availability
The data supporting this article have been included as part of the ESI.†Conflicts of interest
There are no conflicts to declare.References
- L. Fan, Y. Du and B. Zhang, et al., Preparation and properties of alginate/carboxymethyl chitosan blend fibers, Carbohydr. Polym., 2006, 65(4), 447–452 CrossRef CAS.
- K. Xu, X. Tian and Y. Cao, et al., Suppression of Smoldering of Calcium Alginate Flame-Retardant Paper by Flame-Retardant Polyamide-66, Polymers, 2021, 13(3), 430 CrossRef CAS PubMed.
- Q. Wang, D. Zhang and F. Li, Current status and development of alginate fiber application, Cotton Text. Technol., 2023, 1–6 Search PubMed.
- Q. Kong, B. Wang and Q. Ji, et al., Thermal degradation and flame retardancy of calcium alginate fibers, Chin. J. Polym. Sci., 2009, 6, 807–812 CrossRef.
- J. Zhang, Q. Ji and X. Shen, et al., Pyrolysis products and thermal degradation mechanism of intrinsically flame-retardant calcium alginate fibre, Polym. Degrad. Stab., 2011, 96(5), 936–942 CrossRef CAS.
- J. Zhang, Q. Ji and F. Wang, et al., Effects of divalent metal ions on the flame retardancy and pyrolysis products of alginate fibres, Polym. Degrad. Stab., 2012, 97(6), 1034–1040 CrossRef CAS.
- G. Tian, Q. Ji and D. Xu, et al., The effect of zinc ion content on flame retardance and thermal degradation of alginate fibers, Fibers Polym., 2013, 14(5), 767–771 CrossRef CAS.
- X. Tian, W. Xu and Y. Sha, et al., Preparation and performance of salt- and detergent-resistant alginate fiber, Polym. Sci. Eng., 2020, 36(1), 147–151 CAS.
- X. Huang and J. Gao, A Review of Near-Limit Fire Spread in Opposed Flow, Fire Saf. J., 2020, 103141 Search PubMed.
- J. R. Lawson, Environmental Cycling of Cellulosic Thermal Insulation and its Influence on Fire Performance, NBSIR, 1984, 84–2917 Search PubMed.
- V. Babrauskas, in Ignition Handbook: Principles and Applications to Fire Safety Engineering, Fire Investigation, Risk Management and Forensic Science, Fire Science Publishers/SFPE, Issaquah, WA, 2003 Search PubMed.
- T. J. Ohlemiller, Cellulosic insulation material. III. Effects of heat-flow geometry on smolder initiation, Combust. Sci. Technol., 1981, 26, 89–105 CrossRef.
- T. J. Ohlemiller and F. E. Rogers, Cellulosic insulation material. II. Effect of additives on some smolder characteristics, Combust. Sci. Technol., 1980, 24, 139–152 CrossRef CAS.
- T. K. Chan and D. H. Napier, Smouldering and ignition of cotton fibres and dust, Fire Prev. Sci. Technol., 1973,(4), 13–23 CAS.
- H. Yue and Z. Guo, Effect of packing density on smoldering characteristics and residue morphology of cotton, Fire Sci. Technol., 2023, 42(11), 1462–1466 Search PubMed.
- P. J. Wakelyn and S. E. Hughs, Evaluation of the flammability of cotton bales, Fire Mater., 2002, 26, 183–189 CrossRef CAS.
- L. Yang, Research on flame retardant properties of calcium alginate fiber blended fabrics, Shandong Textile Science and Technology, 2017, 58(3), 8–10 Search PubMed.
- K. Xu, X. Tian and Y. Cao, et al., Preparation and performance of flame-retardant polyester/calcium alginate fiber composite materials, Text. J., 2021, 42(7), 19–24 Search PubMed.
- J. L. Torero and A. C. Fernandez-Pello, Natural convection smolder of polyurethane foam, upward propagation, Fire Saf. J., 1995, 24, 35–52 CrossRef CAS.
- S. Alexopoulos and D. D. Drysdale, The transition from smoldering to flaming combustion, Fire Mater., 1988, 13, 37–44 CrossRef.
- B. C. Hagen, V. Frette, G. Kleppe and B. J. Arntzen, Onset of smoldering in cotton: Effects of density, Fire Saf. J., 2011, 46, 73–80 CrossRef.
- P. C. Bowes and S. E. Townshend, Ignition of combustible dusts on hot surfaces, Br. J. Appl. Phys., 1962, 13, 105 CrossRef.
- P. H. Thomas and P. C. Bowes, Thermal ignition in a slab with one face at a constant high temperature, Trans. Faraday Soc., 1961, 57, 2007 RSC.
- J. C. Jones, Thermal calculations on the ignition of a cotton bale by accidental contact with a hot particle, J. Chem. Technol. Biotechnol., 1996, 65, 176–178 CrossRef CAS.
- J. C. Jones and G. C. Wake, Measured activation-energies of ignition of solid materials, J. Chem. Technol. Biotechnol., 1990, 48, 209–216 CrossRef CAS.
- J. P. Holman, in Heat Transfer, McGraw-Hill, London, 1992 Search PubMed.
- Z. Qin, Research on Heat Transfer Theory and Application, China Water Resources and Hydropower Press, Beijing, 2016, vol. 109, pp. 33–36 Search PubMed.
- A. W. Coats and J. P. Redfern, Kinetic Parameters from Thermogravimetric Data, Nature, 1964, 201–4914 Search PubMed.
- R. P. Tye, Heat transmission in cellulosic fiber insulation materials, J. Test. Eval., 1974, 2, 176 CrossRef.
- D. C. Walther, R. A. Anthenien and A. C. Fernandez-Pello, Smolder ignition of polyurethane foam: effect of oxygen concentration, Fire Saf. J., 2000, 34, 343–359 CrossRef CAS.
Footnote |
| † Electronic supplementary information (ESI) available. See DOI: https://doi.org/10.1039/d4ra04871g |
| This journal is © The Royal Society of Chemistry 2024 |

