 Open Access Article
Creative Commons Attribution 3.0 Unported Licence
Tailoring of structural, morphological, electrical, and magnetic properties of LaMn1−xFexO3 ceramics
Priyanka Thakur a,
Kais Iben Nassar
 b,
Deepak Kumar
 c,
Pawan Kumar
 c,
Prianka Sharma
 d,
Vineet Tirth
 ef,
Ali Saad Alosaimyg,
Ali Algahtanief,
Manel Essidh and
Madan Lal
 *ac
*ac
aDepartment of Physics, Akal College of Basic Sciences, Eternal University, Baru Sahib, HP-173101, India. E-mail: madan.physics26@gmail.com
bDepartment of Physics, 3N-Aveiro, University of Aveiro, 3810-193 Aveiro, Portugal
cDepartment of Physics, Graphic Era (Deemed to be University), Clement Town, Dehradun, UK-248002, India
dDepartment of Physics, School of Basic & Applied Sciences, Maharaja Agrasen University, HP 174103, India
eDepartment of Mechanical Engineering, College of Engineering, King Khalid University, Abha 61421, Asir, Kingdom of Saudi Arabia
fResearch Center for Advanced Materials Science (RCAMS), King Khalid University, Guraiger, Abha-61413, Asir, Kingdom of Saudi Arabia
gDepartment of Mechanical Engineering, College of Engineering, Taif University, Taif 21944, Kingdom of Saudi Arabia
hDepartment of Chemistry, College of Science, King Khaled University (KKU), P.O. Box 9004, Abha 61413, Saudi Arabia
First published on 29th July 2024
Abstract
This study undertakes a comparative analysis of the structural, morphological, electrical, and magnetic characteristics of Fe-doped LaMnO3 ceramics. The solid-state reaction method was used to prepare Fe-doped LaMnO3 at different concentrations (0.00 ≤ x ≤ 1.00) and has been characterized using X-ray diffraction (XRD), Fourier transforms infrared spectroscopy (FTIR), Field emission scanning electron microscopy (FE-SEM), energy-dispersive spectroscopy (EDS), and vibrating sample magnetometry (VSM). The structural transformation from rhombohedral to orthorhombic with Fe-doping is demonstrated by Rietveld's refined XRD patterns. The positive slope in Williamsons–Hall's (W–H) plots confirms the presence of tensile strain with increasing average crystallite size. Quasi-spherical morphology of all the compositions with similar uniformity was confirmed by FESEM images. The chemical distribution of all the elements has been identified by EDS mapping images. Normal dielectric dispersion behaviour of all the samples with NTCR response is confirmed by dielectric and impedance analysis respectively. Increasing lattice volume with Fe-concentration results is increasing Ea. The presence of antiferromagnetic ordering, in addition to weak ferromagnetic ordering, is indicated by the unsaturated magnetization even up to a high external field. The decrease in MS and increase in HC values due to Fe-doping reflect the influence of particle size on various magnetic parameters.
Introduction
Perovskite materials based on lanthanum have been widely used in numerous applications because of their apparent structural, electrical, optical, catalytic, and magnetic capabilities.1–4 Their structures' substitution of metals, varying oxidation states, variable oxygen stoichiometry, and stability of these materials show their wide applicability in solid oxide fuel cell electrodes,5 chemical sensors,6 optoelectronic devices,7 spintronics, and solar cells,8 because of their low power consumptions. The features of lanthanum-based perovskite materials' microwave absorption have been extensively researched to solve issues connected to radiation pollution and electromagnetic interference (EMI), which pose a threat to information security as well as human health and device operation.9–11Lanthanum-based perovskite materials such as LaMnO3, LaFeO3, LaCrO3, LaNiO3, and LaCoO3, have been widely studied due to their ease of manufacture, flexibility, and low production cost. LaMnO3, and LaFeO3, are perovskite-type materials generally having orthorhombic crystal structures at room temperature. LaMnO3 (LMO) is an A-type antiferromagnetic perovskite material that shows orthorhombic crystal symmetry only around its stoichiometric composition.12–14 The magnetoresistance properties of LMO make it an important multiferroic material that can be exploited for the use of LMO as electrode material in supercapacitors.15 On the other hand, LaFeO3 (LFO) is an orthoferrite, has a Néel temperature (TN) of roughly 738 K, and a G-type antiferromagnetic structure.9,16 Orthorhombically distorted LFO-perovskite was found to have multiferroic properties and has potential applications as a spin filter in spintronics.17,18
It has been observed that 3d cations on the B-site (i.e., Mn4+ or Fe3+) of the crystal lattice drive the electrical and magnetic properties of LMO and LFO. The double exchange mechanism (DE) and the Jahn–Teller effect are the two main reasons for the co-existence of two ferroic orders in LMO and LFO ceramics. DE mechanism is the hopping of eg electrons between Mn3+ and Mn4+ mediated by oxygen anions, while the Jahn–Teller effect is strong electron-phonon coupling arises due to the deformation of [MnO6] or [FeO6] octahedral. These two machines were observed in lanthanum-based ceramics by appropriate doping or by introducing oxygen vacancies in the crystal structure.19–21 Lanthanum is a non-magnetic rare earth metal with zero unpaired electrons in its La3+ oxidation state which does not influence magnetic properties directly.22 Hence, due to the presence of unpaired electrons and high magnetic moment values of B-site ions (Fe and Mn ions), a change in magnetic properties has been observed in lanthanum-based perovskite materials. Thus, it is important to study the Mn-site substitution in LaMnO3 as the Mn-site doped ion will consequently result in the distortion of the Mn–O plane, which will cause a considerable change in structural and electrical and magnetic properties.23 In recent years, extensive research has been conducted on the effects of substituting Mn sites with various cations (M = Fe, Cr, Co, Ni) in both charge-delocalized and localized manganite's.24–27 Among these, Fe ions, due to their close ionic radii to Mn3+, are particularly interesting as dopants for LaMnO3, as they can occupy Mn sites as Fe3+ without causing significant lattice distortion.28
Different groups have reported on a number of investigations including Fe doping at the Mn location.29–32 With decreasing temperature, the perovskite system La0.67Ca0.33Mn1−xFexO3 (x = 0.00, 0.01, 0.03, and 0.07) exhibits an essentially paramagnetic (PM) to ferromagnetic (FM) transition, and as Fe concentration increases, the PM to FM transition temperature is decreased.32 Magnetization measurements of the system La0.6Ca0.4Mn1−xFexO3 (x = 0, 0.05, 0.1, 0.15, and 0.2) revealed that the coexistence of ferromagnetic and antiferromagnetic interactions for critical composition x ∼0.1 and that the Curie temperature (TC) decreases upon Fe-doping from 275 K to 75 K for x = 0 and x = 0.2, respectively.31 In their studied system La0.7Ca0.3Mn1−xFexO3 (x = 0.08, 0.1, and 0.12), Sahasrabudhe et al.33 found only one ferromagnetic phase exist below the transition temperature without any spin glass behaviour. Kundaliya et al.34 also noted comparable outcomes for the combination La0.67Ca0.33Mn0.9Fe0.1O3. Fe-doping of La1−xCaxMnO3 results in the suppression of ferromagnetism and conduction in both the ferromagnetic (x = 0.37) and antiferromagnetic (x = 0.53) phases.35 This is because double-exchange interactions are reduced and the number of hopping electrons is reduced. In the La0.67Ca0.33Mn0.9Fe0.1O3 perovskite, the random substitution of Fe3+ with Mn3+ lowers the number of locations where the Mn eg (up) electron can hop, which lowers ferromagnetic exchange. At low temperatures, the system is driven into a randomly canted ferromagnetic state by the competition between the co-existing antiferromagnetic super-exchange interactions and the ferromagnetic double-exchange interactions.36
Fe3+ can readily take the place of Mn3+ in the MnO6 octahedron. Reduced Jahn–Teller distortion from Mn3+ ions results from partial replacement of Fe3+ for Mn3+. In the meantime, resistivity rises as a result of Fe doping, which lessens the double exchange contact between Mn3+ and Mn4+. The degree of the double exchange effect's destruction deepens, the degree of the crystal structure's distortion is lessened, the symmetry of the crystal structure is strengthened, the magnetoresistance (MR) progressively rises, and the temperature coefficient of resistance (TCR) initially rises and then falls with an increase in Fe doping.37–39 Kholil et al.,40 reported in their report that Fe-doping can be used to reduce bandgap in perovskites and also shift the optical conductivity in the visible region. Thus, Fe-doped perovskites provide promising candidates for applications in optoelectronics, solar cells, solid oxide fuel cells and in fabrication of new magnetic devices.41–43
Numerous studies have investigated Fe-doped LaMnO3; however, none have explored the complete substitution of Mn ions with Fe-ions. Thus, this study offers an extensive examination of the structural, morphological, magnetic, and electrical characteristics of LaMn1−xFexO3 ceramics. In addition to examining how magnetic behaviour changes with different Fe doping concentrations in LaMnO3, we also analysed dielectric and impedance characteristics at various temperatures and frequencies.
Results and discussion
FullProf software was utilized to process the Rietveld refinement of XRD data for LaMn1−xFexO3 (x = 0.00, 0.25, 0.50, 0.75, and 1.00), as shown in Fig. 1 (a–e). The refinement confirms the phase transition from rhombohedral to orthorhombic as the concentration of Fe-ions is increased in LaMnO3. Rhombohedral crystal structure with R![[3 with combining macron]](https://www.rsc.org/images/entities/char_0033_0304.gif) C space group was confirmed for 0.00 ≤ x ≤ 0.50 concentration of Fe-doping in LaMnO3, while the orthorhombic crystal structure with the Pbnm space group was obtained for 0.75 ≤ x ≤ 1.00. Different refined parameters along with their residual factors (Rp, Rwp, Re) are summarized in Table 1. The lattice parameters a = b = 5.5227 Å, c = 13.3646 Å and a = 5.5540 Å, b = 5.5637 Å, c = 7.8519 Å for LMO and LFO respectively, were found well-matched with the literature.44,45 Phase transition can be attributed to the ionic radii difference between Mn4+ (0.053 Å) and Fe3+ (0.064 Å) ions. Due to larger ionic radii of Fe3+ ions, as the Mn4+ ions are replaced by Fe3+ ions, it generates high pressure on the grain boundaries and results in structural transformation from rhombohedral to orthorhombic.
C space group was confirmed for 0.00 ≤ x ≤ 0.50 concentration of Fe-doping in LaMnO3, while the orthorhombic crystal structure with the Pbnm space group was obtained for 0.75 ≤ x ≤ 1.00. Different refined parameters along with their residual factors (Rp, Rwp, Re) are summarized in Table 1. The lattice parameters a = b = 5.5227 Å, c = 13.3646 Å and a = 5.5540 Å, b = 5.5637 Å, c = 7.8519 Å for LMO and LFO respectively, were found well-matched with the literature.44,45 Phase transition can be attributed to the ionic radii difference between Mn4+ (0.053 Å) and Fe3+ (0.064 Å) ions. Due to larger ionic radii of Fe3+ ions, as the Mn4+ ions are replaced by Fe3+ ions, it generates high pressure on the grain boundaries and results in structural transformation from rhombohedral to orthorhombic.
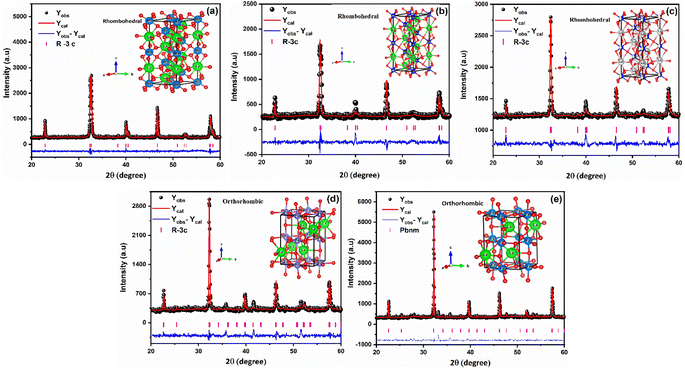 | ||
| Fig. 1 Rietveld refined XRD pattern of LaMn1−xFexO3 ceramics (where (a) x = 0.00, (b) x = 0.25, (c) x = 0.50, (d) x = 0.75, (e) x = 1.00). | ||
| Simulated parameters | x = 0.00 | x = 0.25 | x = 0.50 | x = 0.75 | x = 1.00 | ||
|---|---|---|---|---|---|---|---|
(Rhombohedral) (R![[3 with combining macron]](https://www.rsc.org/images/entities/char_0033_0304.gif) c) c) |
(Orthorhombic) (Pbnm) | ||||||
| Lattice parameters | a (Å) | 5.5227 | 5.524194 | 5.52837 | 5.527039 | 5.5539 | |
| b (Å) | 5.5227 | 5.524194 | 5.52837 | 5.527039 | 5.5635 | ||
| c (Å) | 13.3646 | 13.3869 | 13.4476 | 7.8535 | 7.8517 | ||
| Volume of unit cell | V (Å3) | 353.0115 | 353.7920 | 355.9479 | 241.033 | 242.6303 | |
| Atomic positions | La | x | 0.0000 | 0.0000 | 0.0000 | 0.99211 | 0.99694 |
| y | 0.0000 | 0.0000 | 0.0000 | 0.01920 | 0.02651 | ||
| z | 0.2500 | 0.2500 | 0.2500 | 0.2500 | 0.2500 | ||
| Mn/Fe | x | 0.0000 | 0.0000 | 0.0000 | 0.0000 | 0.0000 | |
| y | 0.0000 | 0.0000 | 0.0000 | 0.5000 | 0.5000 | ||
| z | 0.0000 | 0.0000 | 0.0000 | 0.0000 | 0.0000 | ||
| O1 | x | 0.44736 | 0.45901 | 0.45901 | 0.75178 | 0.70561 | |
| y | 0.0000 | 0.0000 | 0.0000 | 0.70500 | 0.29975 | ||
| z | 0.2500 | 0.2500 | 0.2500 | 0.0159 | 0.03019 | ||
| O2 | x | — | — | — | 0.09087 | 0.07964 | |
| y | — | — | — | 0.48723 | 0.47727 | ||
| z | — | — | — | 0.2500 | 0.2500 | ||
| R-factors (%) | Rp | 25.80 | 27.5 | 41.2 | 26.6 | 41.70 | |
| Rexp | 16.67 | 12.6 | 19.7 | 12.7 | 18.34 | ||
| Rwp | 16.60 | 24.3 | 24.0 | 20.9 | 22.70 | ||
| Rf | 4.28 | 16.2 | 18.2 | 10.9 | 4.50 | ||
| RBragg | 1.930 | 6.28 | 2.43 | 4.88 | 2.664 | ||
| GoF | 1.00 | 1.87 | 0.45 | 1.97 | 1.53 | ||
| Crystallite size (D (nm)) | 81.25 | 119.24 | 120.83 | 128.52 | 132.13 | ||
| Lattice strain (ε) | 5.58 × 10⁻⁴ | 2.94 × 10⁻⁴ | 3.24 × 10⁻⁵ | −2.15 × 10⁻⁴ | 1.79 × 10⁻⁴ | ||
| Dislocation density δ (nm−1) | 1.52 × 10⁻³ | 7.03 × 10⁻⁵ | 6.84 × 10⁻⁵ | 6.05 × 10⁻⁵ | 5.73 × 10⁻⁵ | ||
| X-ray density ρx (g cm−3) | 6.83 | 6.99 | 6.89 | 6.74 | 6.65 | ||
| Specific surface area S (m2 g−1) | 10.81 | 7.20 | 7.19 | 6.93 | 6.83 | ||
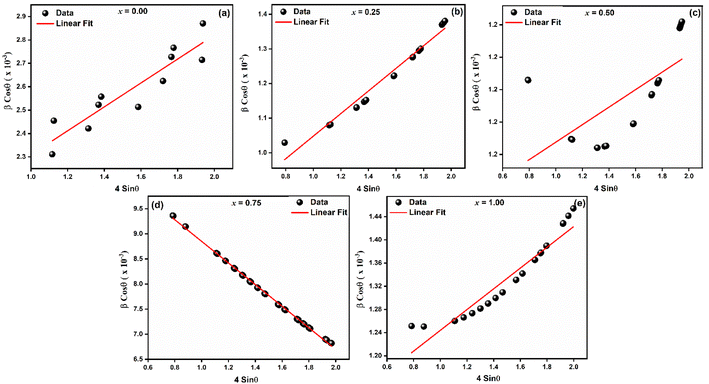
To investigate the kind of micro-strain seen in the crystal structures of LaMn1−xFexO3, the Williamsons–Hall (W–H) method was employed. To determine the crystallite size and micro-strain in the rhombohedral and orthorhombic crystal structures, the linear fitted line (as indicated in Fig. 2) was employed. For all samples except for compositions x = 0.75, which display a negative slope as illustrated in Fig. 2(d), the positive slope of the linear fit validates the tensile strain. The negative slope line confirmed the compressive strain. Because Fe-ions have large ionic radii, it is observed that when Fe-ions are doped in LaMnO3, the average crystallite size increases as the number of Fe-ions increases. The two intrinsic quantities that provide the dislocation network's measure are the lattice strain and the dislocation density. In Fig. 2(c) for x = 0.50 an exceptionally high value is observed. This may be due to the reason of equal concentration of Fe3+ and Mn4+-ions, which results into inhomogeneity at B-site. This inhomogeneity leads to lattice distortion due to the ionic radii of Fe3+ and Mn4+-ions. Therefore, maximum strain in the ceramic at x = 0.50 is observed. Fig. 2(e) a small deviations in the data point is seen, which may be due to the reason B-site is fully occupied by Fe3+-ions. Table 1 shows that a smaller lattice strain value corresponds to a lower concentration of lattice defects, whereas a reduced dislocation density corresponds to the production of a higher-quality sample. Eqn (1) and (2) were used to determine the synthesized NPs' X-ray densities (ρx) and specific surface area (S).
 | (1) |
| S = 6/(Dρx) | (2) |
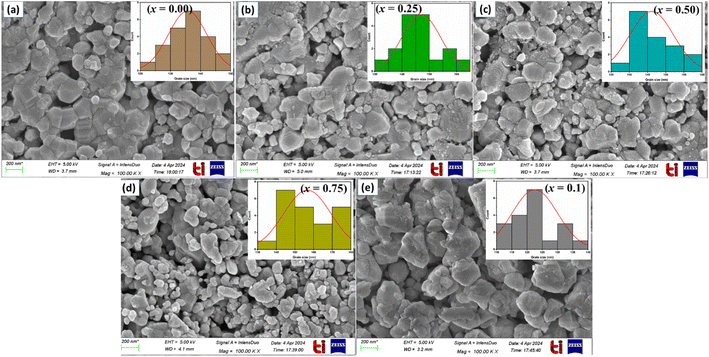
To well understand the microstructural features of LaMn1−xFexO3 (x = 0.00, 0.25, 0.50, 0.75, and 1.00), FESEM was performed as shown in Fig. 3. All the samples appear to contain quasi-spherical particles with shapes of similar uniformity. The microstructure consisted of sub-micron-sized particles with very fine morphology. All ceramics exhibit distinct, well-defined grains and boundaries.
Plotting histograms (inset) from SEM images using Image-J software allowed us to determine the average grain size, which ranged from 122 to 156 nm (see Table 2). The existence of secondary particles created by agglomeration accounts for the smaller average crystallite size found in SEM pictures compared to that found in X-ray diffraction.
| Composition | Elements | O | Mn | La | Fe | Grain size (nm) |
|---|---|---|---|---|---|---|
| x = 0.00 | Wt (%) | 18.68 | 23.14 | 58.18 | — | 135 |
| At (%) | 58.15 | 20.98 | 20.98 | — | ||
| x = 0.25 | Wt (%) | 18.76 | 14.40 | 57.65 | 9.19 | 145 |
| At (%) | 58.21 | 13.01 | 20.60 | 8.17 | ||
| x = 0.50 | Wt (%) | 17.61 | 4.28 | 57.63 | 20.48 | 146 |
| At (%) | 56.14 | 3.98 | 21.17 | 18.71 | ||
| x = 0.75 | Wt (%) | 19.78 | 8.40 | 56.81 | 15.00 | 156 |
| At (%) | 59.82 | 7.40 | 19.79 | 13.00 | ||
| x = 1.00 | Wt (%) | 18.92 | — | 55.50 | 25.58 | 122 |
| At (%) | 57.97 | — | 19.59 | 22.45 |
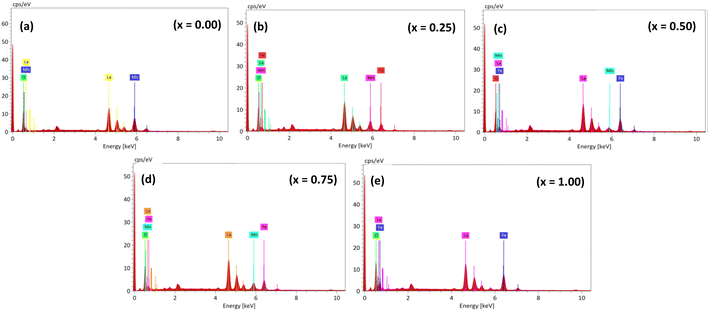
EDS spectra confirm the homogeneous composition of the synthesized samples (as shown in Fig. 4), with elemental distribution mapped in LaMn1−xFexO3 (x = 0.00, 0.25, 0.50, 0.75, and 1.00). La, Mn, Fe, and O elements are detected at their expected energy levels, with atomic and weight percentages listed in Table 2, consistent with the nominal composition. No additional elements are detected, affirming the purity of the synthesized materials.
The thermal variations of dielectric constants (ε) and dielectric loss (tan![[thin space (1/6-em)]](https://www.rsc.org/images/entities/char_2009.gif) δ) in the temperature range 30–250 °C of the samples observed at frequencies 1 kHz, 10 kHz, 100 kHz, and 1 MHz, respectively are shown in Fig. 5(a–e). Typical dielectric dispersion behavior like ferroelectric materials has been observed in all the samples that is with increasing temperature the dielectric constants (ε) first increase and then attain a peak at Curie temperature (TC), and above TC, further increase in the temperature causes a rapid decrease in the dielectric constant (ε). It is noted that at low temperatures, ε is temperature independent and frequency independent for all samples. Then, for x = 0.00, 0.25, 0.50, 0.75, and 1.00, respectively, it increases progressively with increasing temperature to its maximum value (εmax), which corresponds to the change from a ferroelectric to a paraelectric phase, at approximately 60, 110, 150, 230, and 222 °C.
δ) in the temperature range 30–250 °C of the samples observed at frequencies 1 kHz, 10 kHz, 100 kHz, and 1 MHz, respectively are shown in Fig. 5(a–e). Typical dielectric dispersion behavior like ferroelectric materials has been observed in all the samples that is with increasing temperature the dielectric constants (ε) first increase and then attain a peak at Curie temperature (TC), and above TC, further increase in the temperature causes a rapid decrease in the dielectric constant (ε). It is noted that at low temperatures, ε is temperature independent and frequency independent for all samples. Then, for x = 0.00, 0.25, 0.50, 0.75, and 1.00, respectively, it increases progressively with increasing temperature to its maximum value (εmax), which corresponds to the change from a ferroelectric to a paraelectric phase, at approximately 60, 110, 150, 230, and 222 °C.
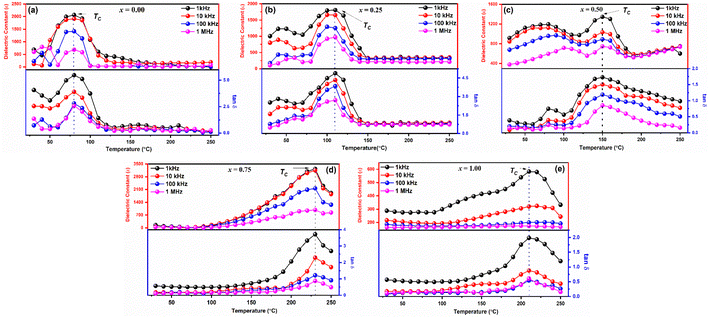 | ||
Fig. 5 Temperature dependent dielectric constant (ε) and dielectric loss (tan![[thin space (1/6-em)]](https://www.rsc.org/images/entities/char_2009.gif) δ) of LaMn1−xFexO3 ceramics. δ) of LaMn1−xFexO3 ceramics. | ||
Moreover, dielectric constant decreases with increasing frequency as shown in Fig. 5(a–e). Change in ε values with frequency depends on the extrinsic as well as intrinsic contribution. For every sample, the contribution (extrinsic) from the grain boundary is greater than the bulk grain, as indicated by the huge values of ε in the low frequency. The Maxwell–Wagner model may provide an explanation for this, as the charges that build at the grain borders cause frequency-dependent behaviour that suggests the conducting grains and insulating grain boundaries that separate the polycrystalline perovskites. According to findings in the literature, the grain borders (extrinsic) contribute more at a low frequency than the grain contribution. The dielectric loss variation with temperature exhibits the same characteristics as the dielectric constant temperature variation, and it might be described using the same methodology as the dielectric constant discussion. It is discovered that the dielectric loss rises as the temperature climbs. Temperature-related increases in charge carrier mobility cause polarization to rise and significant dielectric loss. Charge accumulating at grain boundaries is the cause of the increased dielectric loss value that has been found at high temperatures.
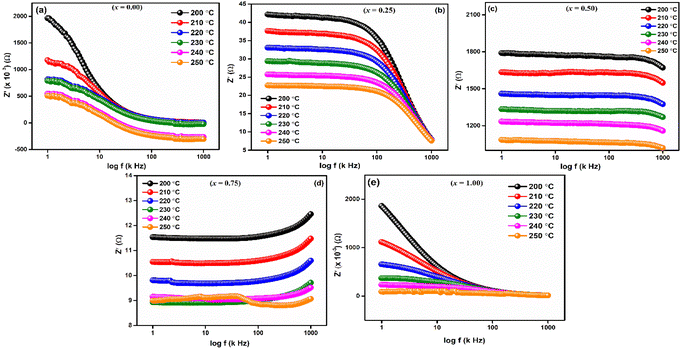
Frequency-dependent of real part of impedance (Z′) is shown in Fig. 6 for LaMn1−xFexO3 (x = 0.00, 0.25, 0.50, 0.75, and 1.00) ceramics at high temperatures 200, 210, 220, 230, 240 and 250 °C, respectively. As shown in the figures, the magnitude of Z′ is higher at lower temperatures and decreases with increasing frequency for all compositions, confirming the NTCR behaviors of these ceramics. This decrease in Z′ corresponds to an increase in electrical conductivity. As frequency increases, Z′ values converge, leading to decreased barrier properties and the disappearance of polarization caused by space charge.46
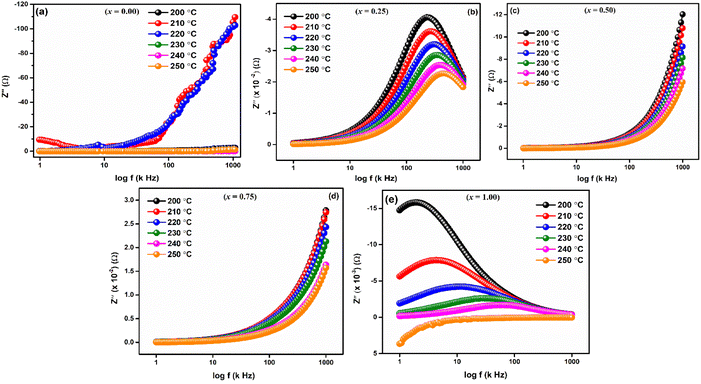
Fig. 7(a–e) displays the imaginary portion of impedance (Z′′) frequency response curves for a wide range of temperatures (200–250 °C) for LaMn1−xFexO3 (x = 0.00, 0.25, 0.50, 0.75, and 1.00). Type and strength of electrical relaxation events in the system can be determined by looking for temperature-dependent peaks  at a specific frequency. The system's space charge is evident from this behaviour.25,26 As frequency and temperature rise, we observe that the value of (Z′′) first rises until peaking at
  , after which it falls. The peaks shift towards higher frequencies as the temperature rises, which is a significant observation. It is significant to observe that as temperature rises, the peaks shift towards higher frequencies. The change in the peaks shows how the system's relaxation period is spreading, and the fact that this relaxation phenomenon evolved as the temperature rose supports the theory that temperature-dependent dielectric relaxation exists. The relaxation process, which causes electrical conduction in materials, may be caused by flaws created at higher temperatures. The fact that all compositions' height peaks or
  values fall as temperature rises further supports the development of thermally activated charge carriers, which power the materials' conduction mechanism.47,48 The confirmation of a non-Debye-type relaxation process in the materials is provided by the asymmetric peak broadening, which reflects the relaxation time distribution. Furthermore, it was discovered that in the higher frequency area, all the curves combine at a particular frequency. This is thought to be caused by the space charge polarization decreasing at higher frequencies.25–28
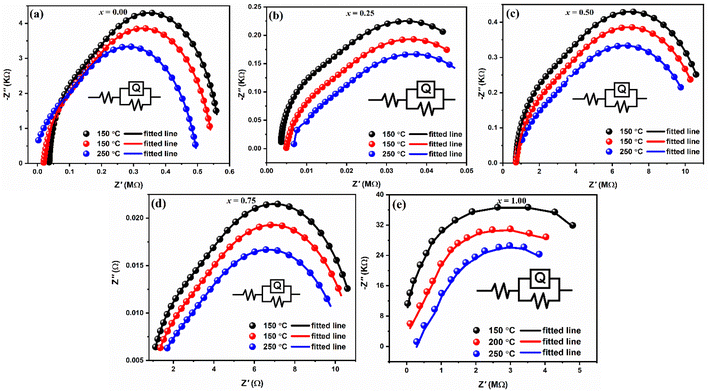
The Nyquist representation, which plots the imaginary part Z′′ vs. the real part Z′ in a Cartesian orthonormal reference frame, is one of the most used graphical representations in complex impedance spectroscopy. The literature23 states that the contribution of the grain boundary is represented by the semicircle in lower frequencies, while the semicircle in higher frequencies symbolizes the phenomena of intrinsic conduction, the response of the grains, and gives rise to the resistances of the grains. Fig. 8(a–e) shows our compound's Nyquist diagrams obtained at various temperatures. Each composition has a single, depressed semi-circular arc, its centre located below the real axis, signifying that it is semiconducting and has an NTCR. Every semicircle's diameter shrinks as temperature rises, suggesting a thermally triggered conduction process.49 The Nyquist plots are fitted with an equivalent circuit made up of two parallel resistances (Rg and Rgb) and a constant phase element (Q) in order to verify the distinct contributions of grains and grain borders. Table 3 lists the fitted values resistance for grain and grain borders, whereas the black, red and blue lines show the fitted lines and dots shows the experimental data, respectively.
| Compositions (x) | Temperature (°C) | Resistance | n | Q | |
|---|---|---|---|---|---|
| Rg (Ωcm2) | Rgb (Ω cm2) | ||||
| 0.00 | 150 | 2.0 × 10⁻⁹ | 2.1 × 10⁴ | 6.0 × 10⁻¹ | 9.6 × 10⁻¹⁰ |
| 200 | 1.5 × 10⁻⁹ | 2.3 × 10³ | 6.0 × 10⁻¹ | 5.7 × 10⁻¹⁰ | |
| 250 | 1.0 × 10⁻⁹ | 2.3 × 10³ | 6.0 × 10⁻¹ | 3.8 × 10⁻¹⁰ | |
| 0.25 | 150 | 3.6 × 101 | 3.3 × 10³ | 6.0 × 10⁻¹ | 3.5 × 10⁻⁹ |
| 200 | 4.7 × 10² | 4.3 × 10³ | 6.0 × 10⁻¹ | 1.1 × 10⁻⁹ | |
| 250 | 1.1 × 101 | 2.9 × 10² | 6.0 × 10⁻¹ | 3.2 × 10⁻⁹ | |
| 0.50 | 150 | 3.0 × 10⁻⁷ | 1.0 × 10² | 6.0 × 10⁻¹ | 7.8 × 10⁻⁸ |
| 200 | 2.0 × 10⁻⁷ | 2.5 × 10⁵ | 6.0 × 10⁻¹ | 2.8 × 10⁻⁹ | |
| 250 | 1.3 × 10⁻⁷ | 5.3 × 10⁵ | 6.0 × 10⁻¹ | 5.9 × 10⁻⁶ | |
| 0.75 | 150 | 2.5 × 10⁻⁷ | 1.2 × 10⁹ | 6.0 × 10⁻¹ | 5.3 × 10⁻⁷ |
| 200 | 3.0 × 10⁻⁷ | 1.6 × 10⁴ | 6.0 × 10⁻¹ | 7.7 × 10⁻⁷ | |
| 250 | 1.6 × 10⁻⁷ | 2.3 × 10⁶ | 6.0 × 10⁻¹ | 2.9 × 10⁻⁷ | |
| 1.00 | 150 | 4.0 × 10⁻⁷ | 6.3 × 10⁸ | 6.0 × 10⁻¹ | 8.6 × 10⁻¹⁰ |
| 200 | 3.0 × 10⁻⁷ | 3.4 × 10⁶ | 6.0 × 10⁻¹ | 2.8 × 10⁻¹⁰ | |
| 250 | 2.0 × 10⁻⁷ | 4.5 × 10⁴ | 6.0 × 10⁻¹ | 1.9 × 10⁻¹⁰ | |
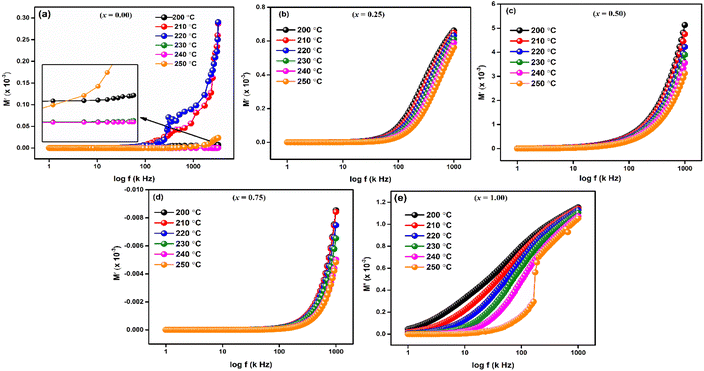
For LaMn1−xFexO3 (x = 0.00, 0.25, 0.50, 0.75, and 1.00) at temperature range 200–250 °C, Fig. 9(a–e) shows the frequency response of the real component of modulus (M′). The Figures show that for all compositions, the value of M′ is extremely low (near zero) in the low-frequency zone, and that it continuously increases as frequency increases, suggesting a tendency to saturate at a maximum temperature. The idea that the conduction process is caused by the charge carriers' short-range mobility is supported by this saturation characteristic.50 These explanations may relate to the idea that the mobility of charge carriers is brought about by an induced electric field when a restoring force isn't present. Because of the long-range mobility of charge carriers and the minimal impact of electrode polarization on the material, the low-frequency side's tiny value of M′ supports the conduction phenomenon.51
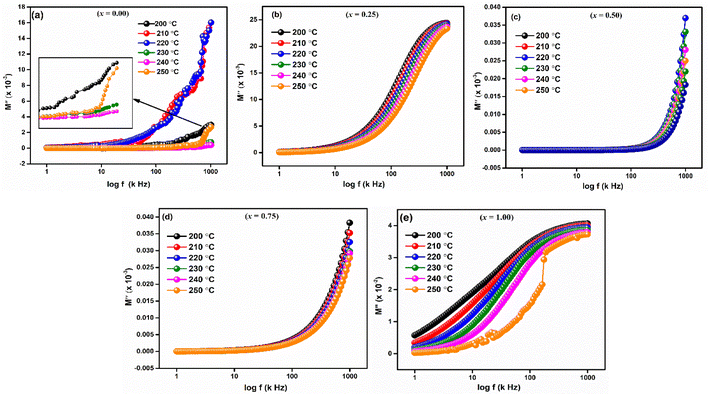
The imaginary component of modulus (M′′) for LaMn1−xFexO3 (x = 0.00, 0.25, 0.50, 0.75, and 1.00) in a temperature range of 200–250 °C is displayed in Fig. 10(a–e). The relaxation peak shifts towards a higher frequency as the temperature rises. The observed asymmetry in peak broadening, which illustrates the spread of relaxation time with different time constants, supports the non-Debye type of relaxation in all the compositions.52
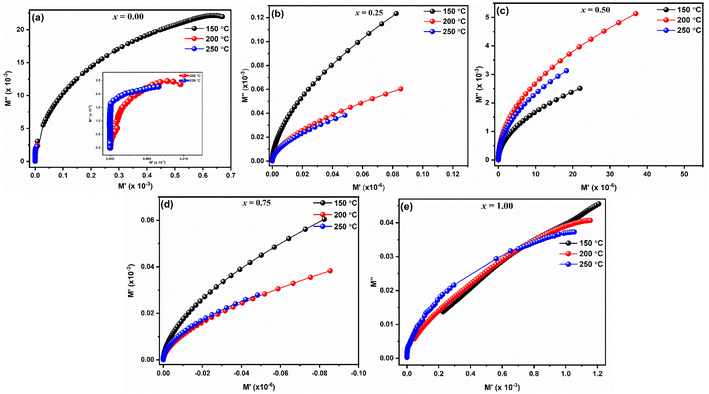
Fig. 11(a–e) displays the complex electric modulus spectrum (M′′ vs. M′) for LaMn1−xFexO3 (x = 0.00, 0.25, 0.50, 0.75, and 1.00) at various temperatures. Electrical transport characteristics, including hopping rate and conductivity relaxation time, are interpreted by the electric modulus graph. By examining even, the tiniest changes in the materials' capacitance, it provides information on electrical processes. When it comes to differentiating the relaxation effects from grains (conducting regions) and grain borders (resistive plates) in materials, the M′′ vs. M′ plot performs better than the Nyquist plot of impedance (Z′′ vs. Z′). The phenomena with the smallest capacitance are identified by the modulus plot, while those with the most resistance is revealed by the impedance plot. Complex modulus analysis is suitable when two materials have similar resistances but differing capacitances.53 As seen in Fig. 11(a–e), the presence of a single semicircle for every composition whose centres are located below the real axis suggests that the grain effect predominates in the conduction mechanism over the grain boundaries effect.
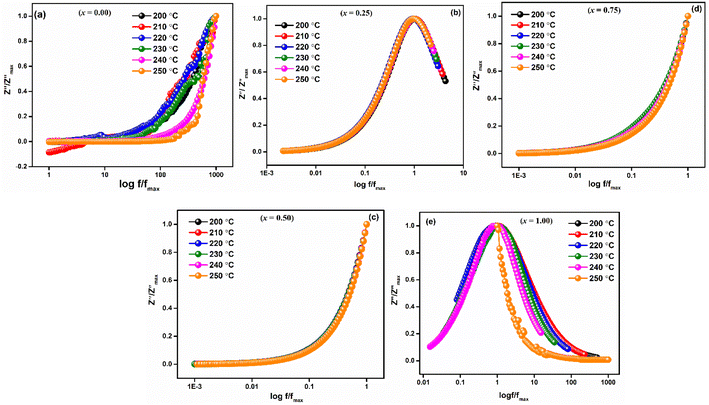
For every composition, a well-resolved semicircle at the higher frequency side is visible. This semicircle indicates the capacitive grain effect and shows that grains actively participate in the conduction mechanism. Furthermore, when temperature rises, a change in the grain semicircle's intercept on the Mx axis towards lower values of M′ is seen, suggesting an increase in capacitance that supports NTCR-type behavior. For LaMn1−xFexO3 ceramic compositions, the normalized plot of  vs. log
![[thin space (1/6-em)]](https://www.rsc.org/images/entities/char_2009.gif) f/fmax at various temperatures nearly overlapped on a single master curve at various temperatures (Fig. 12(a–e)). The Z′′ peak frequencies exhibited a minor variation in full width at half maximum (FWHM) with an increase in temperature, but they still exhibited the same form and pattern at the peak position. The temperature-independent conduction transfer mechanism was confirmed by the master curve. Additionally, the non-symmetry of the curves was noted, suggesting that the conductivity relaxation did not behave in an exponential manner.
f/fmax at various temperatures nearly overlapped on a single master curve at various temperatures (Fig. 12(a–e)). The Z′′ peak frequencies exhibited a minor variation in full width at half maximum (FWHM) with an increase in temperature, but they still exhibited the same form and pattern at the peak position. The temperature-independent conduction transfer mechanism was confirmed by the master curve. Additionally, the non-symmetry of the curves was noted, suggesting that the conductivity relaxation did not behave in an exponential manner.  FWHM as a function of log
![[thin space (1/6-em)]](https://www.rsc.org/images/entities/char_2009.gif) f/fmax was wider than a Debye peak's breadth, suggesting the existence of a relaxation process that is not Debye-type.
f/fmax was wider than a Debye peak's breadth, suggesting the existence of a relaxation process that is not Debye-type.
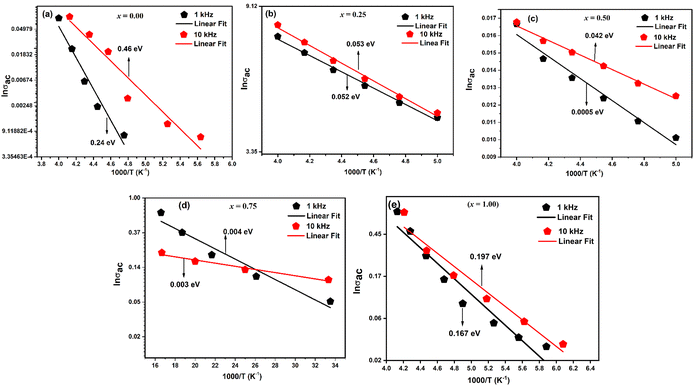
The fluctuation of ln(σac) with reciprocal temperature (103/T) for compounds LaMn1−xFexO3 at certain frequencies (1 and 10 kHz) is displayed in Fig. 13(a–e). The NTCR behaviour of every sample is confirmed by the observation that the ac conductivity increases with temperature. Table 4 lists the activation energy of the relaxation mechanism for each sample. As the Fe content grew, the activation energy decreased, suggesting that the charge carrier concentration was hopping between the adjacent lattice sites more frequently. The obtained activation energies fell as the ceramic's Fe concentration increased, ranging from 0.24 to 0.167 eV. Because of the Fe substituent's larger lattice volume, the conduction-related specimens were released more readily and needed less energy to move.
| Ceramics | Composition (x) | Activation energy ((Ea) eV) | References | |||
|---|---|---|---|---|---|---|
| LaMn1−xFexO3 | 1 kHz | 10 kHz | 100 kHz | 1 MHz | This work | |
| 0.00 | 0.24 | 0.46 | 0.39 | 0.22 | ||
| 0.25 | 0.052 | 0.053 | 0.052 | 0.166 | ||
| 0.50 | 0.0005 | 0.042 | 0.018 | 0.044 | ||
| 0.75 | 0.004 | 0.003 | 0.004 | 0.004 | ||
| 1.00 | 0.167 | 0.197 | 0.149 | 0.028 | ||
| La0.8Ca0.15Na0.05Mn1−xFexO3 | 0.00 | 0.173 | 54 | |||
| 0.25 | 0.248 | |||||
| 0.50 | 0.258 | |||||
| 0.75 | 0.289 | |||||
| La0.7Sr0.3Mn1−xFexO3 | 0.2 | 0.143 | 46 | |||
| 0.3 | 0.108 | |||||
| La0.7Sr0.3Mn1−xFexO3 | 0.08 | 0.135 | 33 | |||
| 0.10 | 0.138 | |||||
| 0.12 | 0.140 | |||||
| La0.7Sr0.3Mn1−xFexO3 | 0.0 | 0.20 | 55 | |||
| 0.10 | 0.19 | |||||
| 0.15 | 0.17 | |||||
| 0.20 | 0.16 | |||||
| La0.67Sr0.33Mn1−xFexO3 | 0.05 | 0.073 | 56 | |||
| 0.1 | 0.152 | |||||
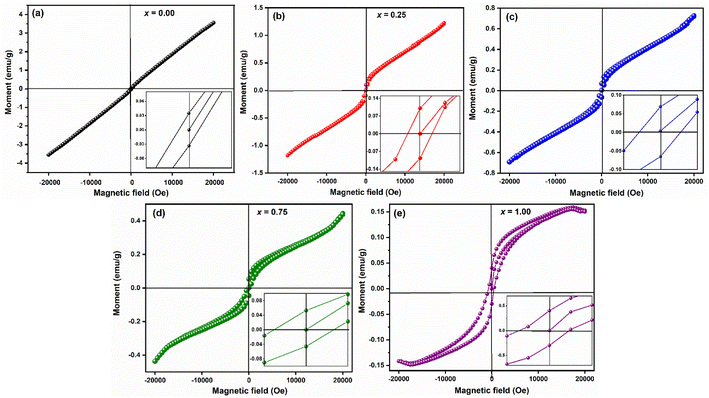
The room temperature hysteresis loop (HL) of LaMn1−xFexO3 is presented in Fig. 14. While La3+ is typically nonmagnetic due to paired electrons,57 the magnetic moments of Mn and Fe are responsible for magnetic ordering in this compound. Although LaMnO3 and LaFeO3 are known as antiferromagnetic materials, the HL of LaMn1−xFexO3 indicates weak ferromagnetism (FM) in all samples. The unsaturation of magnetization, even at high magnetic fields (20 kOe), suggests antiferromagnetic ordering. This weak ferromagnetism is attributed to antiferromagnetic order with canted spins, induced by the presence of a Dzyaloshinskii–Moriya (DM) interaction,58 which leads to a small magnetic moment in LMO and LFO NPs due to the spin canting of Mn and Fe ions.
Table 5 lists the estimated values of the various magnetic characteristics, including squareness ratio (SQR), coercive filed (HC), remanent magnetization (Mr), and saturation magnetization (MS). The MS value was found to be decreased from 3.55 emu g−1 to 0.14 emu g−1 with increasing Fe-concentration. The difference in magnetization values reflects the impact of small particle size resulting in a large surface-to-volume ratio for LaMnO3.
| Compositions | Mr (emu g−1) | HC(if) (Oe) | HC(df) (Oe) | Ms (emu g−1) | SQR = Mr/Ms | μB |
|---|---|---|---|---|---|---|
| x = 0.00 | 0.035 | 84.23 | 159.39 | 3.55 | 0.01 | 0.15 |
| x = 0.25 | 0.086 | 230.73 | 268.66 | 1.25 | 0.07 | 0.05 |
| x = 0.50 | 0.069 | 293.38 | 295.21 | 0.73 | 0.09 | 0.03 |
| x = 0.75 | 0.054 | 333.97 | 360.93 | 0.45 | 0.12 | 0.019 |
| x = 1.00 | 0.033 | 491.50 | 696.08 | 0.14 | 0.24 | 0.006 |
On the other hand, coercive field (HC) was found to be increasing with increasing Fe-concentration, as bigger particles give a higher coercivity (Hc α D6). This is in good agreement with the law of the nano-magnetic particles. The coercivity value calculated at increasing and decreasing field (inset of Fig. 14, Table 5) indicated a shift in the HL around the origin, which confirms the presence of ferromagnetic/antiferromagnetic interfaces.59 The squareness ratio (S) of LaMn1−xFexO3 was found to be nearly equal to zero, while HC ≠ 0, and Mr ≠ 0 which indicates that the prepared samples have particles with multiple domain sizes.
Experimental
Polycrystalline LaMn1−xFexO3 (x = 0.00, 0.25, 0.50, 0.75, 1.00) were synthesized via high-temperature solid–state reaction method using high purity La2O3 (Sigma-Aldrich, 99.98%), MnO2 (Sigma Aldrich, 99%), and Fe2O3 (Merck, 99%) as the starting materials. The stoichiometric proportion of these oxides was weighted and mixed thoroughly (5–6 h) using mortar and pestle in the presence of hot distilled water as media. Following that, all of the sample reactant powders were calcined for five hours at 950 °C. Eqn (3) provides the following description of the suggested chemical reaction that would produce LaMn1−xFexO3.
 | (3) |
After the phase was confirmed by X-ray diffraction, a hydraulic press was used to form the powder into pallets with the appropriate dimensions. For improved densification, these green pellets were sintered for five hours at 1000 °C. Using CuK radiation (λ = 1.5406 Å) and a PANalytical X'Pert Pro Diffractometer at room temperature, the phase purity and crystal structure were once more examined. The surfaces of the sample were examined using Oxford Analytical instruments in combination with a Zeiss Sipra 55 field emission scanning electron microscope to determine micrographs, purity, composition, and chemical compositions. Using an LCR meter, dielectric characteristics were measured. The magnetic characteristics were measured at room temperature using a vibrating sample magnetometer (Microsense, Model: EZ9).
Conclusions
A standard solid-state reaction technique was utilized to effectively synthesize LaMn1−xFexO3 (where x = 0.00, 0.25, 0.50, 0.75, and 1.00). Rietveld refinement of XRD patterns confirms a phase transition from pure rhombohedral to orthorhombic as Fe concentration increases in the LaMnO3 lattice. FESEM images reveal quasi-spherical grain morphology across all compositions. EDS spectra demonstrate elements present in stoichiometric ratios. Temperature-dependent dielectric spectra exhibit typical dispersion behavior, with high ε values at low frequencies attributed to grain boundaries, supported by the Maxwell–Wagner model. Complex impedance and modulus spectroscopy confirm thermally activated conduction mechanisms. Increasing AC conductivity with temperature confirms negative temperature coefficient resistance (NTCR) behavior. Activation energy, calculated from AC conductivity, decreases with higher Fe content due to increased lattice volume, easing specimen mobility with lower energy requirements. The magnetic hysteresis loop (HL) reveals weak ferromagnetism with antiferromagnetic (AFM) ordering, possibly due to Dzyaloshinskii–Moriya (DM) interactions inducing spin-lattice canting. Squareness ratios nearing zero suggest multiple domain sizes, correlating with increasing coercive field values. Based on the above-received properties these ceramics are suitable for the spintronic applications.Future research scope
This study focused on the experimental tailoring of structural, morphological, electrical, and magnetic properties of LaMn1−xFexO3 ceramics, future research could greatly benefit from the integration of Density Functional Theory (DFT) calculations. DFT could provide detailed insights into the electronic structure, predict various material properties, and assist in understanding the behavior of dopants at the atomic level. For instance, DFT calculations could help elucidate the electronic band structure and density of states, providing a deeper understanding of the electrical conductivity mechanisms in these ceramics. Additionally, it could offer predictions on the magnetic interactions within the material, guiding further experimental investigations.A recent study by Wang et al. has demonstrated the utility of DFT in understanding competitive adsorption behaviors in environmental contexts, specifically on the facets of Goethite.60 This approach could be similarly beneficial in studying LaMn1−xFexO3 ceramics, where DFT could help in understanding the coordination structure affinity of different dopants and their influence on the material's overall properties.
The tailored properties of LaMn1−xFexO3 ceramics open up a wide range of potential applications. Due to their tunable electrical and magnetic properties, these materials could be used in electronic devices such as sensors, actuators, and memory devices. Their unique magnetic properties also make them suitable for applications in magnetic storage media and spintronics. Additionally, the structural and morphological versatility of these ceramics could be exploited in catalysis and other industrial applications where specific surface characteristics are crucial. In conclusion, integrating DFT calculations with experimental research could significantly advance the understanding and development of LaMn1−xFexO3 ceramics, enabling the optimization of their properties for various high-performance applications.
Data availability
Data will be made available on reasonable request by corresponding author.Author contributions
P. T.: methodology, writing-original draft, software, visualization. K. I. N.: writing-review & editing. D. K.: writing-review & editing. P. K.: writing-review & editing. P. S.: resources. V. T.: writing-review & editing. A. S. A.: writing-review & editing. A. A.: writing-review & editing. M. E.: writing-review & editing. M. L.: conceptualization, software, visualization, data curation, supervision, writing-review & editing.Conflicts of interest
The authors declare that they have no known competing financial interests or personal relationships that could have appeared to influence the work reported in this paper.Acknowledgements
The authors extend their appreciation to the Deanship of Scientific Research at King Khalid University Abha 61421, Asir, Kingdom of Saudi Arabia for funding this work through the Large Groups Project under the grant number RGP.2/545/44.References
- X. Zhu, H. Wang, R. Hou, J. Li, Y. Li, Q. Chen and H. Zhang, Ceram. Int., 2024, 50, 13258–13265 CrossRef CAS.
- X. Qi, P. Ren, X. Tong, X. Wang and Y. Wan, J. Alloys Compd., 2024, 989, 174342 CrossRef CAS.
- X. Jin, Z. Fu, D. He, Y. Liu, X. Huang, P. Zhao, Q. Zhao and A. Chang, Ceram. Int., 2024, 50, 24743–24753 CrossRef CAS.
- P. Thakur, N. Sharma, D. Pathak, P. Sharma, K. Kishore, S. Dhar and M. Lal, Emergent Mater., 2024, 7, 1–28 CrossRef.
- Q. Zheng, Y. Zhang, C. Wang, C. Zhang and Y. Guo, Energy Fuels, 2021, 36, 1091–1099 CrossRef.
- F. Li, Z. Wang, A. Wang, S. Wu and L. Zhang, J. Alloys Compd., 2020, 816, 152647 CrossRef CAS.
- K. Sebayang, D. Aryanto, S. Simbolon, C. Kurniawan, S. F. Hulu, T. Sudiro, M. Ginting and P. Sebayang, 2018.
- W. Azouzi, W. Sigle, H. Labrim and M. Benaissa, Mater. Sci. Semicond. Process., 2019, 104, 104682 CrossRef CAS.
- L. Huang, L. Cheng, S. Pan, Y. He, C. Tian, J. Yu and H. Zhou, Ceram. Int., 2020, 46, 27352–27361 CrossRef CAS.
- S. Zhang, Z. Jia, B. Cheng, Z. Zhao, F. Lu and G. Wu, Adv. Compos. Hybrid Mater., 2022, 5, 2440–2460 CrossRef.
- J. Su, H. Zhao, R. Yang, B. Wang, Y. Xu, X. Lin, Y. Xie and C. Wang, Ceram. Int., 2023, 49, 32049–32057 CrossRef CAS.
- S. Belhamra, R. Masrour, A. Jabar and E. Hlil, Polyhedron, 2021, 193, 114891 CrossRef CAS.
- A. Ashok, A. Kumar, R. R. Bhosale, F. Almomani, S. S. Malik, S. Suslov and F. Tarlochan, J. Electroanal. Chem., 2018, 809, 22–30 CrossRef CAS.
- G. Takalkar, R. R. Bhosale, F. AlMomani, A. Kumar, A. Banu, A. Ashok, S. Rashid, M. Khraisheh, A. Shakoor and A. al Ashraf, Appl. Surf. Sci., 2020, 509, 144908 CrossRef CAS.
- R. Dhahri, M. Bejar, M. Hajlaoui, N. Sdiri, M. Valente and E. Dhahri, J. Magn. Magn. Mater., 2009, 321, 1735–1738 CrossRef CAS.
- A. Mitra, A. Mahapatra, A. Mallick and P. Chakrabarti, J. Magn. Magn. Mater., 2017, 435, 117–125 CrossRef CAS.
- A. Scholl, J. Stohr, J. Luning, J. W. Seo, J. Fompeyrine, H. Siegwart, J.-P. Locquet, F. Nolting, S. Anders and E. Fullerton, Science, 2000, 287, 1014–1016 CrossRef CAS PubMed.
- A. Mubarak, S. Tariq, B. Alsobhi, F. Hamioud and A. O. Alrashdi, Int. J. Quantum Chem., 2022, 122, e26850 CrossRef CAS.
- A. Mahmood, M. F. Warsi, M. N. Ashiq and M. Sher, Mater. Res. Bull., 2012, 47, 4197–4202 CrossRef CAS.
- S. Ye, W. Song, J. Dai, K. Wang, S. Wang, C. Zhang, J. Du, Y. Sun and J. Fang, J. Magn. Magn. Mater., 2002, 248, 26–33 CrossRef CAS.
- S. Nandi, J. X. Wu, P. Simon, N. Nuns, M. Trentesaux, A. Tougerti, E. Fonda, J.-S. Girardon, J.-F. Paul and A.-S. Mamede, Appl. Catal., B, 2021, 296, 120330 CrossRef CAS.
- J. A. Chavarría-Rubio, D. A. Cortés-Hernández, A. M. Garay-Tapia and G. F. Hurtado-López, J. Magn. Magn. Mater., 2022, 553, 169253 CrossRef.
- W. Khan, A. H. Naqvi, M. Gupta, S. Husain and R. Kumar, J. Chem. Phys., 2011, 135, 054501 CrossRef PubMed.
- A. Barnabé, A. Maignan, M. Hervieu and B. Raveau, Eur. Phys. J. B, 1998, 1, 145–150 CrossRef.
- R. Mahendiran, B. Raveau, M. Hervieu, C. Michel and A. Maignan, Phys. Rev. B, 2001, 64, 064424 CrossRef.
- K. De, R. Ray, R. N. Panda, S. Giri, H. Nakamura and T. Kohara, J. Magn. Magn. Mater., 2005, 288, 339–346 CrossRef CAS.
- P. Thakur, S. Kumari, S. Chaudhary, N. Sharma and M. Lal, Emergent Mater., 2024, 1–20 CAS.
- K. Ahn, X. Wu, K. Liu and C. Chien, Phys. Rev. B, 1996, 54, 15299 CrossRef CAS PubMed.
- G. Huo, D. Song, Q. Yang and F. Dong, Ceram. Int., 2008, 34, 497–503 CrossRef CAS.
- X. Liu, Z. Li, P. Wu, H. Bai and E. Jiang, Solid State Commun., 2007, 142, 525–530 CrossRef CAS.
- S. Othmani, M. Balli and A. Cheikhrouhou, Solid State Commun., 2014, 192, 51–55 CrossRef CAS.
- G. Zhang and J. Lin, J. Alloys Compd., 2010, 507, 47–52 CrossRef CAS.
- M. Sahasrabudhe, S. Patil, S. Date, K. Adhi, S. Kulkarni, P. Joy and R. Bathe, Solid State Commun., 2006, 137, 595–600 CrossRef CAS.
- D. C. Kundaliya, R. Vij, R. Kulkarni, A. Tulapurkar, R. Pinto, S. Malik and W. Yelon, J. Magn. Magn. Mater., 2003, 264, 62–69 CrossRef CAS.
- K. Ahn, X. Wu, K. Liu and C. Chien, J. Appl. Phys., 1997, 81, 5505–5507 CrossRef CAS.
- S. Yusuf, M. Sahana, K. Dörr, U. Rößler and K.-H. Müller, Phys. Rev. B, 2002, 66, 064414 CrossRef.
- X. Jin, Z. Fu, D. He, Y. Liu, X. Huang, P. Zhao, Q. Zhao and A. Chang, Ceram. Int., 2024, 50, 24743–24753 CrossRef CAS.
- Q. Ni, A. Tang, T. Cai, Q. Zhang, Z. Zhang and L. Xiao, Chem. Eng. J., 2024, 490, 151715 CrossRef CAS.
- A. Vazhayil, R. Vinaykumar, J. Thomas, A. A. Jeffery, I. Hasan, N. Thomas, A. K. Yadav and Y.-H. Ahn, J. Energy Storage, 2024, 86, 111145 CrossRef.
- M. Kholil, M. Bhuiyan, M. A. Rahman, M. Ali and M. Aftabuzzaman, AIP Adv., 2021, 11, 035229 CrossRef CAS.
- X. Zhang, Y. Zhang, S. Wang, S. Deng, S. Liu, Q. Lin, H. Zhou, J. Zhao and G. Rao, J. Magn. Magn. Mater., 2022, 563, 169881 CrossRef CAS.
- J. Wang, F. Wang, L. Zhang, Y. Wei, X. Li, X. Xu, Y. Luo and Y. Jia, J. Phys. Chem. C, 2023, 127, 12795–12801 CrossRef CAS.
- N. A. Nik-Jaafar, R. Abd-Shukor and M. A. Kamarudin, Solid State Phenom., 2021, 317, 10–16 Search PubMed.
- W. Wenwei, C. Jinchao, W. Xuehang, L. Sen, W. Kaituo and T. Lin, Adv. Powder Technol., 2013, 24, 154–159 CrossRef.
- M. Gabal, F. Al-Solami, Y. Al Angari, A. Ali, A. Al-Juaid, K.-w. Huang and M. Alsabban, Ceram. Int., 2019, 45, 16530–16539 CrossRef CAS.
- S. Paul, A. K. Manokamna, D. Sharma and A. Singh, Rasayan J. Chem, 2022, 15, 210–216 CrossRef CAS.
- S. Selvasekarapandian and M. Vijayakumar, Mater. Chem. Phys., 2003, 80, 29–33 CrossRef CAS.
- K. Iben Nassar and N. Rammeh, Indian J. Phys., 2023, 97, 1749–1757 CrossRef CAS.
- K. I. Nassar, F. Tayari, M. Benamara, S. S. Teixeira and M. P. F. Graça, RSC Adv., 2023, 13, 24023–24030 RSC.
- K. Padmasree, D. Kanchan and A. Kulkarni, Solid State Ionics, 2006, 177, 475–482 CrossRef CAS.
- M. Belal Hossen and A. Akther Hossain, J. Adv. Ceram., 2015, 4, 217–225 CrossRef.
- B. Kaur, L. Singh, V. A. Reddy, D.-Y. Jeong, N. Dabra and J. S. Hundal, Int. J. Electrochem. Sci., 2016, 11, 4120–4135 CrossRef CAS.
- R. Ranjan, R. Kumar, N. Kumar, B. Behera and R. Choudhary, J. Alloys Compd., 2011, 509, 6388–6394 CrossRef CAS.
- S. Singh and D. Singh, J. Alloys Compd., 2017, 702, 249–257 CrossRef CAS.
- A. A. S. Hassan, W. Khan, S. Husain, P. Dhiman and M. Singh, Int. J. Appl. Ceram. Technol., 2020, 17, 2430–2438 CrossRef CAS.
- M. Baazaoui, S. Zemni, M. Boudard, H. Rahmouni, M. Oumezzine and A. Selmi, Phys. B, 2010, 405, 1470–1474 CrossRef CAS.
- P. Coutinho, F. Cunha and P. Barrozo, Solid State Commun., 2017, 252, 59–63 CrossRef CAS.
- R. Saha, A. Sundaresan and C. Rao, Mater. Horiz., 2014, 1, 20–31 RSC.
- D. Xue, G. Chai, X. Li and X. Fan, J. Magn. Magn. Mater., 2008, 320, 1541–1543 CrossRef CAS.
- X. Wang, Y. Zhang, C. Song, Z. Shen, T. Wang, K. Yang, H. Miao, J. Yang, J. Wang and X. Xu, Chem. Eng. J., 2024, 479, 147677 CrossRef CAS.
| This journal is © The Royal Society of Chemistry 2024 |

