 Open Access Article
Creative Commons Attribution 3.0 Unported Licence
Dissolution of simulated nuclear waste glass at high surface area to solution volume, high pH and 70 °C: comparison of international simple glass and SON68 glass
Felix Brandt *a,
Sébastien Caesb,
Martina Klinkenberga,
Juri Barthel
 c,
Sanheng Liub,
Karel Lemmensb,
Dirk Bosbacha and
Karine Ferrandb
aInstitute of Fusion Energy and Nuclear Waste Management (IFN-2), Forschungszentrum Jülich GmbH, 52425 Jülich, Germany. E-mail: f.brandt@fz-juelich.de
bInstitute of Sustainable Waste & Decommissioning, SCK CEN, B-2400 Mol, Belgium
cErnst Ruska-Centre (ER-C 2), Forschungszentrum Jülich GmbH, 52425 Jülich, Germany
First published on 4th November 2024
Abstract
Long-term static dissolution experiments, lasting up to ∼1500 days, were conducted on International Simple Glass (ISG) and SON68 glass under hyperalkaline pH, at 70 °C, and at a very high glass surface area to solution volume ratio. The study compared (1) glass dissolution kinetics, (2) secondary phase formation, and (3) the microstructure of the altered glass and secondary phase interface. Boron release indicated rapid initial dissolution followed by a slowdown mainly due to a significant pH drop. ISG reached a residual rate regime, while SON68 approached this regime near the experiment's end, with both glasses having similar final dissolution rates. Electron microscopy (SEM, TEM, EDS) of the reacted glass surfaces and the alteration products revealed nontronite formation on SON68, while C(A)SH phases and later rhodesite appeared on ISG, in addition to phillipsite-type zeolite formation observed in both experimental series. TEM observations revealed a porous, foam-like surface altered layer (SAL) near the pristine glass. SON68's SAL nanostructure, more complex than ISG's, had two porous zones, hindering water transfer and glass constituent release, in addition to a pH drop reducing silica network hydrolysis. TEM-EDS showed cation exchange and iron depletion in SON68's SAL, leading to nontronite formation. Secondary phases at the SAL-solution interface did not destabilize the SAL, and no alteration resumption was observed due to the pH drop below the threshold necessary for an alteration resumption due to zeolite formation. In conclusion, the combination of alkaline conditions and very high reaction progress does not lead to the dissolution of the glass by a dissolution-reprecipitation mechanism, as typically observed at much lower SA/V ratios. At the relatively mildly alkaline pH reached within the first year of the experiments, the diffusion of cations through the SAL becomes rate-controlling.
1 Introduction
Reprocessing of spent nuclear fuel and vitrification of the resulting high- and intermediate-level effluents are common steps that are included in the closed nuclear fuel cycle.1–4 The storage of the vitrified waste packages, consisting of glass and stainless-steel containers, in deep geological repositories (DGRs) is currently considered as the preferred disposal option.5–7 Most nuclear waste glasses are borosilicate glasses, due to the high chemical durability and possible waste loadings in the range between 15 and 30 wt% oxide.1,8–10After disposal of the nuclear waste glass, the alteration of the borosilicate glass by aqueous solution leads to the release of radionuclides. The alteration involves several serial and parallel processes,11–13 which include two main mechanisms of chemical attack: (1) the exchange between the mobile ions of the glass network and the protons or hydronium ions and (2) the hydrolysis of the silicate network, which leads to the formation of silanol groups and the release of orthosilicic acid.10,11,14,15 Typically, three kinetic regimes of glass alteration are distinguished: (1) the ‘initial rate’ regime where glass dissolves at the highest rate (Stage I), (2) the ‘residual rate’ regime with a rate typically orders of magnitude lower than in the ‘initial rate’ regime (Stage II), (3) the ‘alteration resumption’ regime (Stage III).16–18
On a microscopic scale, the ‘residual rate’ regime is often linked to the formation of a passivating porous Si-rich surface alteration layer (SAL) by silica precipitation on the glass surface and condensation of the silanol groups with other elements coming from the glass dissolution or supplied by the leaching solution.19 The drop from initial to residual rate is attributed to the combination of a thermodynamic and a transport limiting effect.20–22 Microscopically, the SAL often appears to consist of aggregated Si colloids which sometimes form layers.23–25 According to Gin et al.,26 at neutral pH, this description by dissolution-reprecipitation may be less applicable, and the SAL may be formed more by local rearrangement. The transport of the aqueous species by diffusion through the SAL is slowed down, thus decreasing the glass dissolution rate.
The resumption of glass alteration usually coincides with the precipitation of secondary phases at the SAL-solution interface, which can destabilize the SAL by extraction of a fraction of the network-forming elements, i.e., mostly Si and Al.18,21,27 At conditions typical for the common standardized glass dissolution tests (e.g. MCC-1 static leach tests [ASTM C1220]28 or Product Consistency Tests [ASTM C1285]29), i.e. near neutral starting pH and 90 °C, the ‘residual rate’ regime appears to be a stable state, whereas resumption of glass dissolution typically occurs at high pH and/or temperature.17,30
To improve the mechanistic understanding of its formation and to investigate its structure, the SAL has been probed with high resolution methods, e.g. transmission electron microscopy (TEM), secondary ion mass spectrometry (nano-SIMS), or atom probe tomography (APT),31–33 typically on samples obtained from experiments at near neutral starting pH and low glass surface area to solution volume ratio (SA/V). Essentially three models have been proposed to explain the mechanisms of the SAL formation, which are highly dependent on the experimental conditions, (1) the recondensation model, (2) the dissolution-reprecipitation model, and (3) a combination of the first two models to an intermediate model.
(1) The recondensation model suggests a preferential leaching of the weakly bonded elements. In this model, the in-diffusion of water species (hydration), ion-exchange reactions between protons and network modifying or charge compensating glass species such as the alkali metals and their out-diffusion through the SAL are supposed to control the glass dissolution kinetics.15 As the rate of interdiffusion initially exceeds the rate of silicate network hydrolysis, a hydrated glass layer without the mobile glass species is formed. The concentration of network formers in solution increases, eventually leading to a steady state. This may be seen as a saturation state of the aqueous solution with respect to the SAL in a first approximation.11,18,34 Hydrolysis of the glass network decreases with time due to the development of a transport limiting gel-layer or SAL, which is assumed to form via condensation reactions of the hydrated relict glass structure. Saturation (affinity) effects and transport factors are then seen responsible for the drop in the dissolution rate towards the residual rate.35
(2) In the dissolution-reprecipitation model, the SAL is supposed to be formed after congruent glass dissolution and precipitation of the less soluble elements.32
(3) An intermediate model in which partial hydrolysis of Si species occurs, followed by in situ condensation, has also recently been described. This new concept can be seen as the more general glass dissolution model including the ideas of the first two models as extreme cases. All intermediate mechanisms may be possible as well, even within one dissolution test.18
In the absence of external pH buffers, boron and sodium oxides will largely determine the pH of the leaching solution in contact with the nuclear glass within the pH region between 9 and 10.36,37 However, when cementitious materials are used as backfill, linings or plugs in a DGR, much higher pH values of the (leaching) solution could prevail upon first contact with the glass matrix.38–40 Müller et al.41 observed zeolites and clay minerals as secondary phases and a thick alteration layer after leaching soda-lime boroaluminosilicate glass at low SA/V and high pH. However, only a few studies have addressed the specific case of cementitious materials dominating the solution chemistry in combination with a very high SA/V ratio, which allows investigating the advanced reaction progress stage. Recently, the alteration of the International Simple Glass (ISG) in a synthetic cementitious water (young cement water + Ca, YCWCa) at 70 °C and two different SA/V ratios (i.e. 8240 m−1 and 264![[thin space (1/6-em)]](https://www.rsc.org/images/entities/char_2009.gif) 000 m−1) has shown the formation of a gel-like SAL, Calcium Silicate Hydrate phases (CSH) and zeolites, but no glass alteration resumption.25,42 Although the ISG dissolution rates determined from the boron normalized mass loss were quite similar, the microstructure of the SALs, as observed in these experiments, varied significantly. At SA/V of 8280 m−1, a typical layered structure of a colloidal SAL up to several micrometers thick was visible, whereas at SA/V of 264
000 m−1) has shown the formation of a gel-like SAL, Calcium Silicate Hydrate phases (CSH) and zeolites, but no glass alteration resumption.25,42 Although the ISG dissolution rates determined from the boron normalized mass loss were quite similar, the microstructure of the SALs, as observed in these experiments, varied significantly. At SA/V of 8280 m−1, a typical layered structure of a colloidal SAL up to several micrometers thick was visible, whereas at SA/V of 264![[thin space (1/6-em)]](https://www.rsc.org/images/entities/char_2009.gif) 000 m−1 only a very thin SAL of 80–250 nm thick was observed, covered by CSH phases. Within the time scale of the experiments, a resumption of glass alteration was not observed in any of the experiments.
000 m−1 only a very thin SAL of 80–250 nm thick was observed, covered by CSH phases. Within the time scale of the experiments, a resumption of glass alteration was not observed in any of the experiments.
Very thin SALs were also reported in earlier publications.43 So far, they have not been systematically studied on nuclear waste glasses, although the conditions at which they have occurred are relevant for DGR assessment. In this paper, the long-term alteration of the complex SON68 glass in YCWCa at a very high SA/V, high pH and 70 °C is compared with that of ISG to assess the effect of glass composition upon dissolution. In addition to the determination of the dissolution rates, a detailed characterization of the SAL on the nanoscale was carried out in combination with an identification of the secondary phases. A focus was set on the later stage of glass dissolution up to ∼1500 days.
2 Materials and methods
2.1 Glass samples
Samples of two model systems for nuclear waste glass were used in the experiments: the inactive French nuclear glass SON68 produced by CEA (R7T7 – Lot number: 1865) and the International Simple Glass (ISG) produced by MoSci Corporation (Rolla, MO, USA – Lot number: L12012601-M12042403). The nominal composition of both glasses as provided by the suppliers is given in Table 1. Glass powders were prepared as described in Ferrand et al.42 by milling and sieving to the grain size fraction between 20 and 25 μm and removing ultrafine particles by ultrasonic cleaning. The BET (Kr) specific surface area was determined to be 0.504 ± 0.002 m2 g−1 for SON68 glass and 0.440 ± 0.002 m2 g−1 for ISG.| Oxide | SON68 | ISG |
|---|---|---|
| SiO2 | 45.50 | 56.20 |
| B2O3 | 14.00 | 17.30 |
| Na2O | 9.86 | 12.20 |
| Al2O3 | 4.91 | 6.06 |
| CaO | 4.04 | 4.98 |
| Fe2O3 | 2.91 | — |
| ZrO2 | 2.65 | 3.28 |
| ZnO | 2.50 | — |
| Li2O | 1.98 | — |
| MoO3 | 1.70 | — |
| Nd2O3 | 1.59 | — |
| Cs2O | 1.42 | — |
| Ce2O3 | 0.93 | — |
| La2O3 | 0.90 | — |
| NiO | 0.74 | — |
| MnO2 | 0.72 | — |
| Traces <0.7 wt% of: Ba, U, Cr, Pr, Sr, Th, P, Te, Y, Co, Ag, Cd, Sn, Sb | — | |
2.2 Dissolution experiments
Batch dissolution experiments were carried out in the same setup as described in Ferrand et al.42 The experimental conditions are summarized in Table 2. The experiments consisted of Teflon® containers with a volume of 20 mL, into which 3 g of glass powder and 5 g of the same batch of YCWCa solution, prepared as described in the data publication,44 were added.| Parameter | Setting |
|---|---|
| Temperature (°C) | 70 ± 1 |
| Particle fraction (μm) | 20–25 |
| Mass of glass powder (g) | 3.000 ± 0.005 |
| Specific surface area of glass powder (m2 g−1) | |
| ISG | 0.440 ± 0.002 |
| SON68 glass | 0.504 ± 0.002 |
| pH of YCWCa solution | pH (70 °C) = 12.5 ± 0.2 |
| Weight of YCWCa solution (g) | 5.000 ± 0.005 |
| SA/V (m−1) | |
| ISG | 264![[thin space (1/6-em)]](https://www.rsc.org/images/entities/char_2009.gif) 000 ± 2600 000 ± 2600 |
| SON68 | 302![[thin space (1/6-em)]](https://www.rsc.org/images/entities/char_2009.gif) 400 ± 3000 400 ± 3000 |
Each data point/sample date discussed later represents a separate experiment, which was started at the same time as the other experiments, using the same batch of glass powder of SON68 glass or ISG and the same YCWCa solution. The data were corrected for possible evaporation by checking the weight of the Teflon® containers frequently.
The containers were kept under argon at 70 ± 1 °C in an oven placed in a glove box. The suspension was homogenized manually once a week with a Teflon® coated stirring bar, which was placed inside the container, without opening the container.
The chemical conditions of the experiments were determined by the YCWCa solution, which is characterized by a pH (70 °C) of 12.5 and the chemical composition as summarized in Table 3. Individual batch experiments were ended after 59, 288, 385, 632, 952 and 1462 days. The experimental data of ISG of days 59, 288, 385, 632, and 952 were already reported in Ferrand et al.42 and are used here for comparison with new corresponding data for SON68. In addition, to enable a comparison with the SON68 experiments, a parallel ISG experiment was performed and sampled after 1462 days. At the end of each experiment, the container was removed from the oven, shaken for homogenization of the suspension, and allowed to cool down to room temperature for two hours for sampling. After weighing of the container and settling of the glass particles, the container was opened under argon and a needle attached to a syringe was used to collect the solution. The pH was measured at room temperature.
| Element | Concentration (mg L−1) |
|---|---|
| Al | 0.06 ± 0.04 |
| B | <1 |
| Ca | 17.8 ± 1.8 |
| Na | 3120 ± 310 |
| K | 12![[thin space (1/6-em)]](https://www.rsc.org/images/entities/char_2009.gif) 400 ± 1200 400 ± 1200 |
| Si | 0.48 ± 0.21 |
Then, the solution was filtered through a 0.45 μm membrane filter (GHP acrodisc from PALL). From this sample, an aliquot of 1 mL of solution was diluted with 2 mL of Milli-Q® water (18.2 MΩ cm at 25 °C) and ultrafiltered (10 kD, Microsept TM, advance from Cytiva) at 5000 rotations per minute (RPM) for 20 minutes and analyzed by ICP-OES (IRIS Intrepid II dualview, Thermo Scientific, USA) and ICP-MS (XSERIES2, Thermo Scientific, USA). For the measurements, the sample was diluted and acidified with either 5% HCl and 1% HNO3 (ICP-OES) or 2% HNO3 (ICP-MS), respectively.
The altered glass powder was collected in a polypropylene container at the end of each experiment and rinsed with Milli-Q® water. The excess water was removed using a syringe with a needle and the container was placed in an oven at 30 °C until a constant weight was reached. A minimum of five measurements was carried out.
The dried altered glass powder was kept in a desiccator. For the investigation of the solids and focused ion beam (FIB) preparation, a subsample of each powder was embedded in an epoxy resin (Struers, Germany) and polished with diamond suspensions (9 μm, 3 μm and 1 μm, respectively).
2.3 Calculation of normalized mass loss and dissolution rate
The release of boron is regarded as an indicator for the mass loss of the glass because boron is not supposed to be retained in the secondary phases or in the SAL.The normalized mass loss of the glass at a given time, NL(B) (g m−2), is calculated based on the boron release according to eqn (1):
 | (1) |
The glass dissolution rate (r) is derived from the normalized mass loss of boron, NL(B) according to eqn (2):
| r = d(NL(B))/dt | (2) |
2.4 X-ray diffraction (XRD)
The grain size fraction <5 μm was separated via sedimentation according to the procedure of Ferrand et al.,42 which leads to an enrichment of the crystalline secondary phases. For the XRD measurements, a small amount of powder of the separated grain size fractions was dispersed in 1 mL Milli-Q® water and deposited on a zero-background silicon single crystal wafer. Then, the samples were dried at 40 °C on a heating plate. The XRD measurements were carried out with a D4 Endeavor diffractometer (Bruker AXS GmbH, Karlsruhe, Germany) in Bragg–Brentano geometry using Cu radiation (CuKα1 = 1.5405 Å) at 40 mA and 40 kV. The instrument is equipped with a linear silicon strip LynxEye detector (Bruker-AXS, Karlsruhe, Germany). XRD patterns were collected in the range from 5° to 100° 2Θ using a step size of 0.01°/2Θ and a counting time of 10 s/step at ambient conditions.2.5 Scanning (SEM) and transmission electron microscopy (TEM)
The evolution of the glass alteration and formation of secondary phases were studied using the environmental scanning electron microscope Quanta 200 F (FEI, Eindhoven, The Netherlands) in low vacuum mode at 60 Pa. Additionally, a Phenom scanning electron microscope (Phenom PRO X, Thermo Fisher Scientific, The Netherlands) was used at an accelerating voltage of either 5 kV or 15 kV.The NVision 40 cross beam station (Carl Zeiss AG, Germany) was used for the preparation of thin cross-section lamellae by focused ion beam milling (FIB). The procedure is described in detail in Lenting et al.33 and Ferrand et al.42
Scanning Transmission Electron Microscopy (STEM) and energy dispersive X-ray spectroscopic (EDS) elemental mapping were carried out with a TFS Spectra 300 (Thermo Fischer Scientific, The Netherlands) operated at 200 kV accelerating voltage and with a 230 pA beam current. The focused STEM probe was formed with a convergence semi-angle of 27.5 mrad and corrected for spherical aberration. High-angle annular dark-field (HAADF) images were recorded with a detector covering scattering angles between 62–200 mrad, realizing Z-contrast imaging of the thin cross section, where higher intensity indicates a composition with higher atomic number, larger sample thickness, or higher material density.45 Energy dispersive X-ray mappings were acquired while scanning using a Super X EDS detector (Thermo Fischer Scientific, The Netherlands)46 with 0.7 sr maximum collection angle to determine qualitatively the elemental distribution in the SAL and the surrounding material. The spectrometer was operated with a dispersion of 5 eV per channel covering X-ray energies up to 20 keV and the readout was synchronized with the scan using a dwell time of 10 μs. Total acquisition times for the mappings were between 20 and 30 minutes and empirical background correction was applied. About one quarter of the detector area was shadowed by the sample holder, so the effective solid angle for EDS detection was approximately 0.5 sr.
3 Results and discussion
3.1 Solution analyses
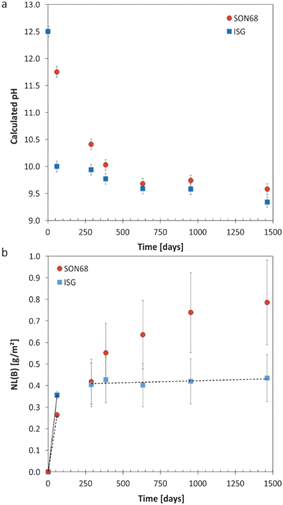 | ||
| Fig. 1 (a) Evolution of calculated pH at 70 °C with time for SON68 glass and ISG in YCWCa at 70 °C; (b) normalized mass loss of boron NL(B) of SON68 and ISG up to 1462 days including the linear regressions from which the dissolution rates were derived (dotted line: initial dissolution rate of SON68 glass: 4.4 × 10⁻³ g per m2 per day, dashed lines: initial and residual dissolution rate of ISG: 6 × 10⁻³ g per m2 per day and 2 × 10⁻⁵ g per m2 per day, respectively). Data for ISG plotted for comparison are taken from Ferrand et al.,42 except for day 1462. | ||
 | ||
| Fig. 2 Evolution of element concentration with time in solution for SON68 and ISG in YCWCa at 70 °C (a) K; (b) Si; (c) Na; (d) Ca. Data for ISG are taken from Ferrand et al.42 except for day 1462. | ||
The evolution of the normalized mass loss of boron NL(B), i.e., of the total amount of glass dissolved at the time of each sampling point based on the boron release in solution, is shown in Fig. 1b. From the NL(B), initial dissolution rates of 6 × 10⁻³ g per m2 per day and 4.4 × 10⁻³ g per m2 per day were calculated for ISG and SON68 glass for the first 59 days, respectively. The boron normalized mass loss and pH are linked at the early stages of the experiments i.e., the earlier pH drop observed for ISG corresponds with an earlier approach to a plateau of NL(B). For ISG, this plateau can be described by a linear fit (indicated by a dashed line in Fig. 1b), resulting in a residual rate of 2 × 10⁻⁵ g per m2 per day. At the very end of the experiments, the SON68 glass dissolution rate also seems to approach a plateau, and a ‘residual’ rate of 9 × 10⁻⁵ g per m2 per day was calculated from the last two data points. At all times after day 288, the SON68 glass appears to dissolve at a significantly higher rate than ISG. At day 1462, the cumulative amount of dissolved glass based on NL(B) was about 0.78 g m−2 for SON68 versus 0.44 g m−2 for ISG.
![[thin space (1/6-em)]](https://www.rsc.org/images/entities/char_2009.gif) 400 mg L−1 is set by the composition of the YCWCa solution as K is not present in ISG or SON68. The decreasing concentration of K (Fig. 2a) with time is related to cation exchange and secondary phase formation, as discussed later in Section 3.2. At the early stage of the experiments, a higher concentration of K in solution was observed for SON68 than for ISG, but in the samples of ≥288 days the K concentrations in solution were similar for both glasses at about 2000 mg L−1.
400 mg L−1 is set by the composition of the YCWCa solution as K is not present in ISG or SON68. The decreasing concentration of K (Fig. 2a) with time is related to cation exchange and secondary phase formation, as discussed later in Section 3.2. At the early stage of the experiments, a higher concentration of K in solution was observed for SON68 than for ISG, but in the samples of ≥288 days the K concentrations in solution were similar for both glasses at about 2000 mg L−1.The evolution of the Si concentration in solution (Fig. 2b) follows a similar trend to the K concentration (Fig. 2a), suggesting the Si retention in a solid phase. Most significant is the difference between ISG and SON68 series during the initial regime of the experiments. On day 59, a Si concentration of about 2700 mg L−1 was measured in the SON68 experiment, while a Si concentration of only 1700 mg L−1 was reached in the ISG experiment. After day 288, the Si concentration in the SON68 experiment decreased down to about 370 mg L−1 and stayed constant, within the experimental uncertainty, until the end of the experiments. For ISG, a Si steady state concentration at about 650 mg L−1 was reached after day 288 but was not maintained until the end of the experiment, as at the last data point it decreased to a concentration like the one measured for SON68.
Na is present in the YCWCa solution as well as in the glass samples. The Na concentration increased with time in both experiments, following a trend similar to NL(B) (Fig. 1b and 2c). Although ISG contains more Na than SON68 (Table 1), less Na was measured in the ISG experiment after 1462 days, revealing less alteration of ISG than SON68 and/or more Na retention in the SAL and/or secondary phases in the ISG experiment. After day 288, a concentration plateau for Na appeared for ISG at about 10![[thin space (1/6-em)]](https://www.rsc.org/images/entities/char_2009.gif) 000–12
000–12![[thin space (1/6-em)]](https://www.rsc.org/images/entities/char_2009.gif) 000 mg L−1. For SON68, after day 288 the Na concentration in solution continuously increased up to about 16
000 mg L−1. For SON68, after day 288 the Na concentration in solution continuously increased up to about 16![[thin space (1/6-em)]](https://www.rsc.org/images/entities/char_2009.gif) 500 mg L−1 at the end of the experiment. Significantly more Na was released into solution than K taken up in the SAL and/or secondary phases in both experimental series. This indicates an exchange of Na for K, as later discussed in detail in Section 3.2, in addition to Na release by congruent dissolution and exchange with H3O+.
500 mg L−1 at the end of the experiment. Significantly more Na was released into solution than K taken up in the SAL and/or secondary phases in both experimental series. This indicates an exchange of Na for K, as later discussed in detail in Section 3.2, in addition to Na release by congruent dissolution and exchange with H3O+.
Ca was present in both glass types as well as in the YCWCa solution. Starting from 18 mg L−1, the concentration of Ca dropped in both experimental series to much lower values, which indicates Ca retention in the SAL and/or secondary phases (Fig. 2d). For ISG, the Ca concentration remained stable between 385 and 952 days at about 7 mg L−1, and then increased up to about 10 mg L−1 at day 1462, suggesting the destabilization of the glass alteration layer. Ca concentrations in the SON68 series were generally higher than in the ISG series and continuously increased up to the final sampling to values of more than 30 mg L−1 – higher than present in the initial YCWCa solution.
3.2 Characterization of the solids
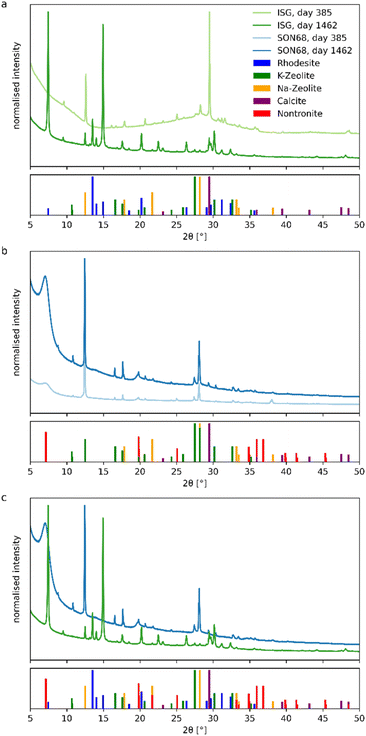
Glass samples taken after 385 and 1462 days were analyzed to investigate whether and how SON68 and ISG glass surface and internal structure, as well as secondary phases changed during the residual rate regime.For the SON68 fraction <5 μm, Na- and K-zeolites (phillipsite-type) and calcite were identified. Unlike ISG, SON68 patterns show a diffuse low-angle peak at 2Θ = 7°. It belongs to nontronite, a 12.6 Å smectite clay mineral (Fig. 3b), which was identified as a secondary phase. Although such phyllosilicates are difficult to characterize by XRD, Muller et al.47 showed the presence of nontronite when glasses formulated to immobilize West Valley nuclear waste were leached in product consistency tests in deionized water at 90 °C and 2000 m−1. Smectites were also identified by Chave48 via XRD after separation of the alteration products formed on the SON68 glass surface. In a more complex system, i.e. glass/iron/claystone the temperature was reported to be a crucial parameter,49 as serpentines are observed at 90 °C whereas at 50 °C they are no longer stable50–52 and the precipitation of smectites such as nontronite is favored. Nontronite is a typical phase used in geochemical modelling allowing to reproduce both the decrease of the initial alteration rate and the so-called residual regime. In de Combarieu et al.,53 the SON68 glass dissolution at 90 °C and 80 cm−1 in pure water or with iron from the canister and overpack or with argillite was modeled with an affinity law with respect to a nontronite-like phase, which saturation state depends on Si, Al, Fe, Na and Ca activities.
Clay minerals such as saponite or nontronite are also commonly observed as basaltic glass alteration products.54 In Parruzot et al.43 the measure of the interplanar spacing on some of these clayey filaments formed during the corrosion of a synthetic basaltic glass at 90 °C and 100![[thin space (1/6-em)]](https://www.rsc.org/images/entities/char_2009.gif) 000 m−1 was similar to that in natural palagonites, suggesting that these clay minerals could be di- or trioctahedral smectites such as nontronites or saponites.55
000 m−1 was similar to that in natural palagonites, suggesting that these clay minerals could be di- or trioctahedral smectites such as nontronites or saponites.55
In both SON68 samples, no significant amorphous background of the glass was detected. Between day 385 and day 1462 the intensity of the nontronite peaks increased as well as the peak intensities of the other secondary phases. In comparison of the two glass samples of SON68 and ISG taken at the final sampling (Fig. 3c), the two zeolites that formed appear to be similar whereas the third secondary phase – nontronite or rhodesite – formed due to the different initial glass compositions.
Zeolites are typical phases formed when nuclear glasses are altered at alkaline pH values. Depending on the solution and glass composition, on the temperature and pH, different zeolites such as merlinoite, analcime, chabazite, and phillipsite have been identified.17,21,27,56,57 The formation of phillipsite, as observed at the glass surface in our study performed in YCWCa, was reported in several glass dissolution studies carried out with the same leaching solution (e.g. ref. 58). K-rich zeolite phases were found to be precipitated during soda-lime glass alteration at 50 °C (ref. 59) and ISG alteration at 70 °C and 8280 m−1.25 In this latter study, rhodesite was also identified by XRD. Unlike previous studies (e.g. ref. 25), no resumption of alteration due to secondary phase formation was observed in our study, likely caused by a pH drop below the threshold for alteration resumption due to zeolite formation (pH 10.5 at 90 °C). This threshold was confirmed by studies such as Gin and Mestre21 and Fournier et al.17 Previous work by Muller et al.47 showed no resumption at pH 9.7 at 90 °C, with resumption occurring above pH 11, linked to phillipsite formation. Similar findings were reported by Neeway et al.60
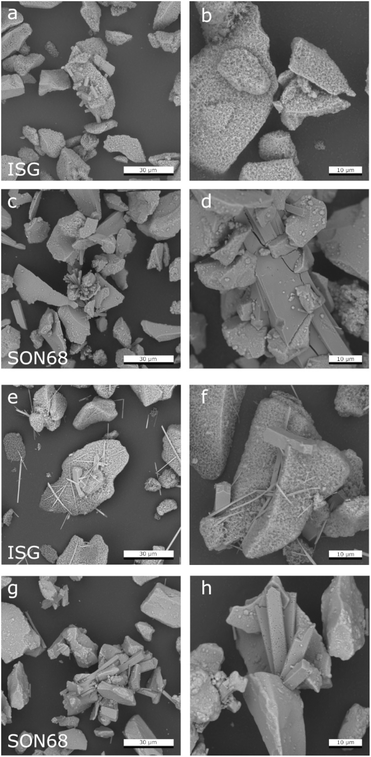 | ||
| Fig. 4 Comparison of SEM images of (a) and (b) ISG after 385 days; (c) and (d) SON68 after 385 days; (e) and (f) ISG after 1462 days (g) and (h) SON68 after 1462 days. | ||
The precipitation of C(A)SH phases on the glass surface in our study agrees with previous observations on the behaviour of nuclear glasses in alkaline solutions. C(A)SH phases were observed at the surface of ISG after leaching in a KOH solution at pH 11.5 or under different humidities.30,61 Under such experimental conditions, these phases were only formed from the Si and Ca released from the glass and not originating from the leaching solution. The presence of C(A)SH phases was also reported with ILW glass corroded in a saturated Ca(OH)2 solution,22,56 and on ISG after alteration in YCWCa.25,42 The presence of C(A)SH phases with a low Ca/Si ratio has also been reported in tests conducted in presence of hardened ordinary Portland cement,62,63 which provides Ca needed for the pozzolanic reaction.
The fraction >5 μm allows for investigating the surfaces of the glass particles after removal of the secondary phases (Fig. 5). Confirming the findings of Ferrand et al.,42 the presence of spherical pores in the pristine ISG was also observed at day 385, indicating areas of preferential dissolution. These were again observed at day 1462, but appear more prominent in the latter sample (Fig. 5a and b). The presence of pits in the glass surfaces after removal of the secondary phases could be attributed to presence of percolation channels in the medium range structural order of the glass and of high alkali concentrated regions, which could lead to a local pH increase in the solution trapped at the interface between the SAL and the pristine glass after alkali release.64,65
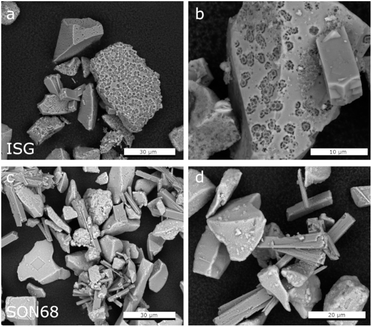 | ||
| Fig. 5 Comparison of SEM images of the separated fraction >5 μm after 1462 days of ISG (a and b) and SON68 (c and d). | ||
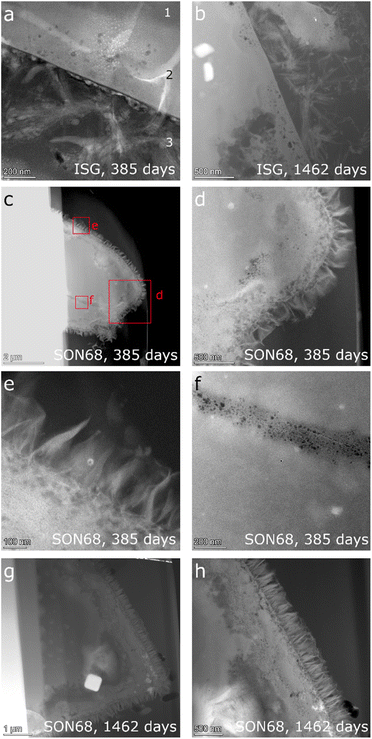
The zeolites in this ISG sample exhibit the typical rod-shaped, rectangular morphology (Fig. 4a). The zeolites of the SON68 sample appeared as aggregates already at day 385 (Fig. 4c and d). Some very large zeolites had formed between glass particles, i.e. appear to have grown in the inter-particle space formed by the SON68 glass (Fig. 4d). The maximum crystal size of the zeolites in the SON68 samples was observed for day 952, with lengths of up to 100 μm. The SON68 sample taken at day 1462 still contained zeolites, but with a porous surface and a smaller grain size than the zeolites observed in earlier samples (Fig. 4g and h). This observation indicates that with time some zeolites in these experiments became unstable and started dissolving due to the decreasing pH. The glass surfaces of the grain size fraction >5 μm of SON68 do not show the spherical pores in the pristine glass as observed for ISG (Fig. 5c and d). No areas of preferential dissolution were observed. In contrast to SON68, in ISG, a new phase occurred at the later stage of the experiments, which was characterized by needle-like crystals with length of 10 to 30 μm on day 1462 (Fig. 4e and f). This is the typical morphology of the mineral rhodesite, which was already identified by XRD. The general morphology of the secondary silicate minerals with well-developed habitus indicates crystal growth at low to moderate supersaturation and were predicted to form for the ISG glass in Ferrand et al.,42 based on the solution composition.
The observations of Ferrand et al.42 for ISG of day 385 (Fig. 6a) were confirmed. Three zones were identified, (1) pristine glass, (2) porous altered layer (SAL), and (3) secondary phases at the glass surface (Fig. 6a). The pores within the SAL (2) were visible as dark round features and between 10 and 50 nm in size, contained no solids and were not connected. The porous altered layer itself had a thickness between 80 and 250 nm. The very bright elongated features in the image are an artefact which is due to Na being mobilized and redeposited during the TEM measurement. This effect of irradiation damage by the electron beam was already observed during the TEM investigations of the reference glass samples. C(A)SH phases appear to grow from the porous layer of ISG.42 The FIB-lamella of ISG taken on day 1462 (Fig. 6b) showed a SAL and secondary phases similar to those observed on day 385 (Fig. 6a). Only details changed e.g., the crystal habitus of the C(A)SH phases which appeared to grow longer and thicker with time. The typical thickness of the porous layer increased slightly up to 300 nm. The general structure of the SON68 glass alteration layer after 385 days has similar features to those of ISG (Fig. 6c–f), including a porous altered layer (SAL) with secondary phases growing from it. Instead of the C(A)SH phases of the ISG sample, on SON68 clay minerals identified as nontronite by XRD have grown from the glass alteration layer. Sometimes they originated from porous layer, with a typical fibrous structure and lengths of about 200 nm to 300 nm (Fig. 6e). After 385 days, the thickness of the SON68 porous layer was heterogeneous, ranging from 250 nm to 750 nm. A crack in the glass was also recognized, which was filled with porous altered glass (Fig. 6f). Between day 385 and day 1462, the general structure of the porous layer and secondary phases remained the same. However, the nontronite layer became denser and the typical size of the nontronite increased slightly up to 300–350 nm, in good agreement with the increase of the XRD peak intensities (see 3.2.1). The thickness of the porous layer of the SON68 sample at day 1462 was in the range of 700 to 1200 nm and contained more pores than the one of day 385.
Detailed TEM-EDS element mappings were taken across the interface between the porous layer and secondary phases on the ISG (Fig. 7 and 8) as well as on the SON68 FIB sections after day 385 and day 1462 (Fig. 9). The Si, Al, Ca mappings confirmed the presence of secondary calcium (aluminum) silicate hydrate phases (C(A)SH) at the glass surface. The mappings of Na and K indicate the uptake of K into the porous layer as well as an enrichment of K at the interface between the porous layer and the C(A)SH phases. Na is enriched at the same interface as well, but the enrichment is located on the solution side of the K enrichment, whereas very little Na remained in the porous layer. The general observations for ISG of day 1462 (Fig. 8) are similar. The exchange of Na by K is now clearly visible, leading to a depletion of Na and an enrichment of K in the porous layer. The porous layer was about 200–400 nm thick, based on the K mapping and the observation of pores in the HAADF image (Fig. 8).
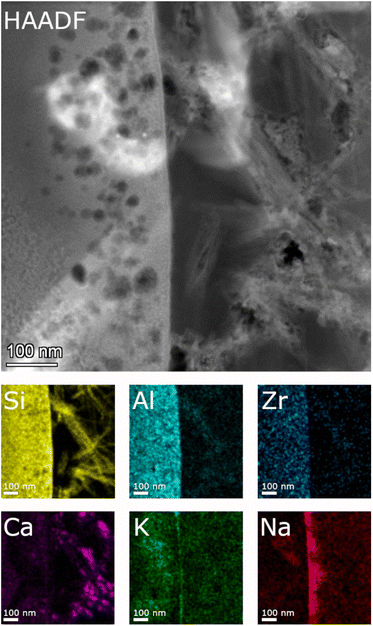 | ||
| Fig. 7 STEM EDS mappings of the alteration zone of ISG after 385 days as observed in the HAADF STEM image. Elemental mappings of Si–K, Al–K, Zr–K, Ca–K, K–K, and Na–K lines. | ||
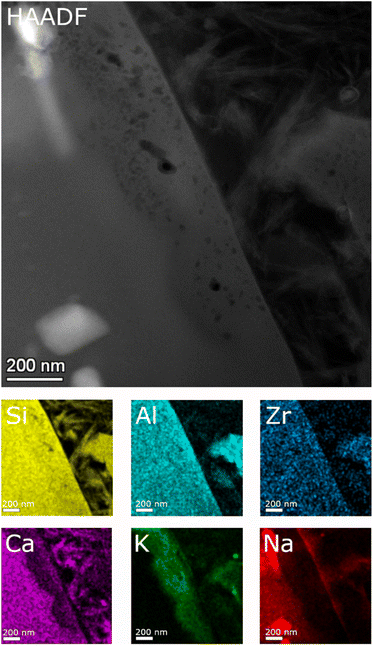 | ||
| Fig. 8 STEM EDS mappings of the alteration zone of ISG after 1462 days as observed in the HAADF STEM image. Elemental mappings of Si–K, Al–K, Zr–K, Ca–K, K–K, and Na–K lines. | ||
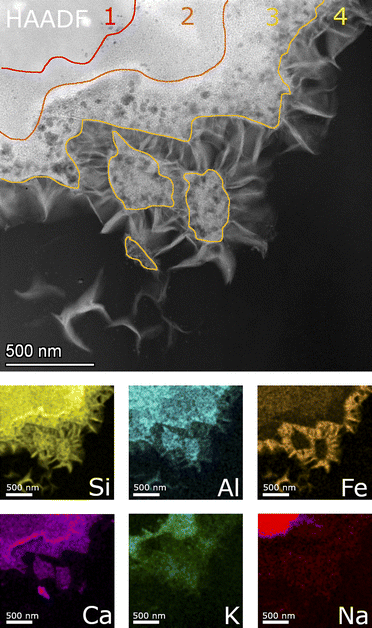
Fig. 9 shows a detailed HAADF image of the SON68 glass alteration layer at day 385. The apparent structure of SAL of SON68 is more complex than that of ISG, consisting of larger pores immediately at the interface with the secondary phases, and finer pores towards the apparently pristine glass. The HAADF images and the EDS mapping of this region reveal four zones which differ in structure and composition, (1) apparently pristine glass, (2) amorphous layer with fine pores, (3) a layer with coarse pores, and (4) secondary phases. The pristine glass can be recognized due to the presence of Na which is depleted in the other zones, whereas no K has been taken up from the solution. A homogeneous distribution of Al, Si, Ca is also typical for the pristine glass. Zone 2 of SON68 is characterized by fine pores and contains the highest concentration of K, compared to the other zones. At the interface between zone 2 and zone 3, an enrichment of Ca can be noted. In addition, zone 3 also contains K, but at a lower K/Si ratio than zone 2. In comparison to zone 1 (pristine glass) and zone 2, zone 3 is depleted in Fe. The secondary phases (zone 4) contain Fe, Si, Al as well as Mn and Zn (mappings of Mn and Zn: data publication ‘SON68 day 385 TEM-EDS Maps’44). This is in good agreement with the mineral nontronite as secondary phase as identified in the XRD patterns of the SON68 sample after 385 days (Section 3.2.1).
SON68 glass taken at day 1462 (Fig. 10) is still characterized by the four zones described above. In contrast with the earlier sample, Ca was also detected in the nontronite layer, apparently in exchange for K.
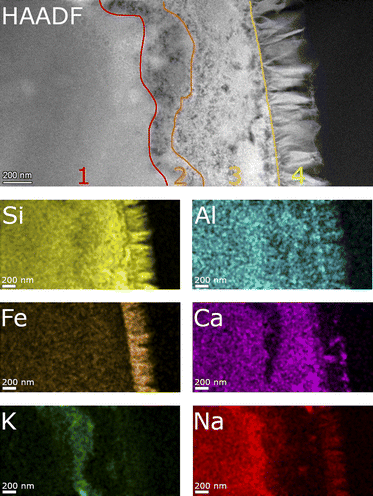 | ||
| Fig. 10 STEM EDS mappings of the alteration zone of SON68 after 1462 days as observed in the HAADF STEM image. Elemental mappings of Si–K, Al–K, Fe–K, K–K, Ca–K and Na–K lines. | ||
In summary, the combined observations of the evolution of pH and element concentrations in solution, XRD and electron microscopy point to a leaching process in which the leached layer(s) form a reactive barrier. A colloidal gel layer, as observed at lower SA/V, was not formed due to the formation of secondary phases. However, a rate drop towards a residual dissolution rate regime can be observed for both glass types, which establishes itself earlier for ISG than for SON68 glass. Since no colloidal SAL can be responsible for the rate drop, the water diffusion and ion exchange kinetics may be responsible for the slowdown in the glass dissolution kinetics, in combination with the drop in pH. The exchange of K with Na as well as the Ca and Fe release out of the respective glass types are indicators for such an interdiffusive leaching reaction. Such a very thin SAL has been described earlier by Grambow and Müller19 and by Jégou et al.66 Grambow and Müller19 describe a diffusion barrier which “can be considered as part of the glass phase” as a condition for a model to simulate nuclear waste glass dissolution. This condition appears to be fulfilled between day 385 and day 1462 for both glass types. The leaching process of SON68 is more far reaching into the solid and creates a more complex microstructure. The leaching of Fe from SON68 and Ca from ISG indicates that the nature and type of the secondary phase which forms directly at the interface has a significant impact upon the leaching process. At the same time, the more mobile alkalis behave similar in both glasses, leading to an uptake of K into the alteration layer and a release of Na out of it (Fig. 10).
4 Conclusions
Long-term dissolution experiments, spanning almost 1500 days, were conducted with two types of glass at high pH, very high SA/V ratio, and 70 °C. Analysis of solution composition and changes in glass and alteration products provided insights into the behaviour of nuclear waste glasses under disposal relevant conditions. Boron release (NL(B)) indicated a rapid initial dissolution, followed by a slowing down of the dissolution, related to a significant pH drop. ISG glass reached a residual rate regime, while SON68 glass only approached it near the experiment's end. SON68 showed a higher total amount of dissolved glass at the end of the experiments (0.78 g m−2) compared to ISG (0.44 g m−2). However, during the final phases of the experiments, the dissolution rates of the two glass types are in a very similar order of magnitude.Secondary phases were identified via XRD, revealing that clay minerals formed on SON68, while C(A)SH phases and at later stages rhodesite appeared on ISG. Nontronite formed on SON68 due to its iron content, which ISG lacks. EDS and SEM analyses of the secondary phillipsite-type zeolites showed similar mineralogical compositions and structures in both glass types.
TEM observations of the SAL near the pristine glass revealed a porous, foam-like structure, contrasting with the usual colloidal SAL seen at alkaline pH and low SA/V. The detailed TEM-EDS observations showed the exchange of K for Na and Ca, as well as the depletion of iron from the SAL of SON68 which then forms nontronite. The SAL nanostructure of SON68 is more complex compared to ISG, consisting of two zones with varying porosity in contrast to only one zone observed in ISG. These layers may have hindered water transfer and glass constituent release, in addition to the positive effect of the pH drop, which decreases the hydrolysis of the silica network. The presence of secondary phases at the SAL-solution interface did not destabilize the SAL. No resumption of alteration due to secondary phase formation was observed, likely also caused by the pH drop below the threshold for alteration resumption due to zeolite formation. Fig. 11 and the graphical abstract summarize the different processes during the glass dissolution as constructed from the individual observations, including ion exchange at the dissolving glass surface, SAL formation and the precipitation of secondary phases at the SAL – aqueous solution interface as well as in the aqueous solution.
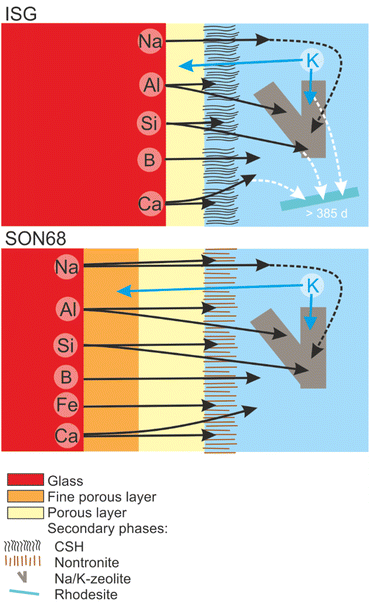 | ||
| Fig. 11 Sketch summarizing the evolution of glass alteration from day 385 to day 1462 for ISG and SON68. | ||
In conclusion, the combination of alkaline conditions and very high reaction progress does not lead to the dissolution of the glass by a dissolution-reprecipitation mechanism, as typically observed at much lower SA/V ratios, probably because the pH decreases quickly to the moderately alkaline domain where diffusion is the driving mechanism. The formation of secondary phases, depending on the glass composition, is favoured for both glasses SON68 and ISG. Already within 1 year the glass particles are covered by a precipitated layer of secondary phases, on top of a very thin, porous surface alteration layer. Afterwards the secondary phases continue to grow. At the relatively mildly alkaline pH reached within the first year of the experiments the growth of secondary phases is not the rate controlling process, but the diffusion of cations through the SAL. The long duration of the experiments has allowed to reach or approach a residual rate regime and has given a precise description of the glass alteration layer for periods exceeding most experimental time frames found in literature. The experiments at very high SA/V show that for the borosilicate glasses SON68 and ISG, confined disposal conditions can lead to a pH decrease that annihilates the deleterious effect of a high initial pH, even for young cement water. Whether or how fast such conditions can be reached will depend on the precise glass composition, local SA/V conditions and the transport properties of the concrete.
Data availability
Data for this article, including results of long-term static dissolution experiments with data of pH evolution as a function of time, element release normalized mass losses of several elements and microscopic data is available at Jülich DATA at https://doi.org/10.26165/JUELICH-DATA/HC3IOI.Author contributions
Conceptualization: F. B. (lead), K. F.; methodology: K. F., M. K., J. B. K. L., investigation: K. F., S. C., M. K., J. B.; writing – original draft preparation: F. B., M. K., K. F.; writing – review and editing: all authors; funding acquisition: D. B., K. L.Conflicts of interest
There are no conflicts to declare.Acknowledgements
The authors would like to thank Murat Güngör, Philip Kegler and Pieter Schroeders for their technical support and Christian Schreinemachers for supporting the data evaluation. This work was performed as part of the programme of the Belgian Agency for Radioactive Waste and Enriched Fissile Materials (ONDRAF/NIRAS) on the geological disposal of high-level/long-lived radioactive waste.References
- I. W. Donald, B. L. Metcalfe and R. N. J. Taylor, Review The immobilization of high level radioactive wastes using ceramics and glasses, J. Mater. Sci., 1997, 32, 5851–5887 CrossRef.
- M. I. Ojovan and W. E. Lee, An Introduction to Nuclear Waste Immobilisation, An Introduction to Nuclear Waste Immobilisation, Elsevier Ltd, 2nd edn, 2013, DOI:10.1016/C2012-0-03562-4.
- J. D. Vienna, Properties of Glass-Forming Melts, ed. D. Pye, I. Joseph and A. Montenero, CRC Press, 2005, pp. 391–404, DOI:10.1201/9781420027310.
- J. D. Barbat and R. Liberge, Nuclear Fuel Cycle: Which Strategy to Support a Sustainable Growth for Nuclear Energy?, Energy Procedia, 2013, 39, 69–80, DOI:10.1016/J.EGYPRO.2013.07.193.
- Nuclear Energy Agency, O., Radioactive Waste Management Moving Forward with Geological Disposal of Radioactive Waste A Collective Statement by the NEA Radioactive Waste Management Committee (RWMC), 2008 Search PubMed.
- IAEA – International Atomic Energy Agency, IAEA Safety Standards Disposal of Radioactive Waste for Protecting People and the Environment, No. SSR-5, IAEA, Vienna, Austria, 2011 Search PubMed.
- N. Chapman and A. Hooper, The disposal of radioactive wastes underground, Proc. Geol. Assoc., 2012, 123, 46–63, DOI:10.1016/J.PGEOLA.2011.10.001.
- W. J. Weber, A. Navrotsky, S. Stefanovsky, E. R. Vance and E. Vernaz, Materials science of high-level nuclear waste immobilization, MRS Bull., 2009, 34, 46–53, DOI:10.1557/mrs2009.12.
- C. Poinssot and S. Gin, Long-term Behavior Science: The cornerstone approach for reliably assessing the long-term performance of nuclear waste, J. Nucl. Mater., 2012, 420, 182–192, DOI:10.1016/J.JNUCMAT.2011.09.012.
- C. L. Thorpe, J. J. Neeway, C. I. Pearce, R. J. Hand, A. J. Fisher, S. A. Walling, N. C. Hyatt, A. A. Kruger, M. Schweiger, D. S. Kosson, C. L. Arendt, J. Marcial and C. L. Corkhill, Forty years of durability assessment of nuclear waste glass by standard methods, npj Mater. Degrad., 2021, 5, 61, DOI:10.1038/s41529-021-00210-4.
- P. Frugier, S. Gin, Y. Minet, T. Chave, B. Bonin, N. Godon, J. E. Lartigue, P. Jollivet, A. Ayral, L. De Windt and G. Santarini, SON68 nuclear glass dissolution kinetics: Current state of knowledge and basis of the new GRAAL model, J. Nucl. Mater., 2008, 380(1–3), 8–21, DOI:10.1016/j.jnucmat.2008.06.044.
- B. Grambow, K. Lemmens, Y. Minet, C. Poinssot, K. Spahiu, D. Bosbach, C. Cachoir, I. Casas, F. Clarens, B. Christiansen, J. de Pablo, C. Ferry, J. Giménez, S. Gin, J. P. Glatz, J. A. Gago, E. Gonzalez-Robles, N. C. Hyatt, E. Iglesias and T. Kienz, Final Synthesis Report RTD Component 1 : Dissolution and Release from the Waste Matrix, Deliverable 1.6.3 of NF-PRO, 2008 Search PubMed.
- S. Gin, P. Frugier, P. Jollivet, F. Bruguier and E. Curti, New Insight into the Residual Rate of Borosilicate Glasses: Effect of S/V and Glass Composition, Int. J. Appl. Glass Sci., 2013, 4, 371–382, DOI:10.1111/IJAG.12048.
- B. C. Bunker, Molecular mechanisms for corrosion of silica and silicate glasses, J. Non-Cryst. Solids, 1994, 179, 300–308 CrossRef CAS.
- B. P. McGrail, J. P. Icenhower, D. K. Shuh, P. Liu, J. G. Darab, D. R. Baer, S. Thevuthasen, V. Shutthanandan, M. H. Engelhard, C. H. Booth and P. Nachimuthu, The structure of Na2O–Al2O3–SiO2 glass: impact on sodium ion exchange in H2O and D2O, J. Non-Cryst. Solids, 2001, 296, 10–26, DOI:10.1016/S0022-3093(01)00890-0.
- J. D. Vienna, J. V. Ryan, S. Gin and Y. Inagaki, Current Understanding and Remaining Challenges in Modeling Long-Term Degradation of Borosilicate Nuclear Waste Glasses, Int. J. Appl. Glass Sci., 2013, 4, 283–294, DOI:10.1111/IJAG.12050.
- M. Fournier, S. Gin and P. Frugier, Resumption of nuclear glass alteration: State of the art, J. Nucl. Mater., 2014, 448, 348–363, DOI:10.1016/j.jnucmat.2014.02.022.
- S. Gin, J. M. Delaye, F. Angeli and S. Schuller, Aqueous alteration of silicate glass: state of knowledge and perspectives, npj Mater. Degrad., 2021, 5, 42, DOI:10.1038/s41529-021-00190-5.
- B. Grambow and R. Müller, First-order dissolution rate law and the role of surface layers in glass performance assessment, J. Nucl. Mater., 2001, 298, 112–124, DOI:10.1016/S0022-3115(01)00619-5.
- P. Van Iseghem, K. Berghman and W. Timmermans, The interaction between nuclear glasses and clay in Scientific Basis for Nuclear Waste Management, Mater. Res. Soc. Symp. Proc., 1990, 176, 291–298 CrossRef.
- S. Gin and J. Mestre, SON 68 nuclear glass alteration kinetics between pH 7 and pH 11.5, J. Nucl. Mater., 2001, 295, 83–96, DOI:10.1016/S0022-3115(01)00434-2.
- S. Mercado-Depierre, F. Angeli, F. Frizon and S. Gin, Antagonist effects of calcium on borosilicate glass alteration, J. Nucl. Mater., 2013, 441, 402–410, DOI:10.1016/j.jnucmat.2013.06.023.
- T. Geisler, A. Janssen, D. Scheiter, T. Stephan, J. Berndt and A. Putnis, Aqueous corrosion of borosilicate glass under acidic conditions: A new corrosion mechanism, J. Non-Cryst. Solids, 2010, 356(28–30), 1458–1465, DOI:10.1016/j.jnoncrysol.2010.04.033.
- L. Dohmen, C. Lenting, R. O. C. Fonseca, T. Nagel, A. Heuser, T. Geisler and R. Denkler, Pattern Formation in Silicate Glass Corrosion Zones, Int. J. Appl. Glass Sci., 2013, 4, 357–370, DOI:10.1111/IJAG.12046.
- C. Mann, K. Ferrand, S. Liu, J. R. Eskelsen, E. Pierce, K. Lemmens and C. Corkhill, Influence of young cement water on the corrosion of the International Simple Glass, npj Mater. Degrad., 2019, 3, 5, DOI:10.1038/s41529-018-0059-9.
- S. Gin, M. Collin, P. Jollivet, M. Fournier, Y. Minet, L. Dupuy, T. Mahadevan, S. Kerisit and J. Du, Dynamics of self-reorganization explains passivation of silicate glasses, Nat. Commun., 2018, 9, 2169, DOI:10.1038/s41467-018-04511-2.
- S. Ribet and S. Gin, Role of neoformed phases on the mechanisms controlling the resumption of SON68 glass alteration in alkaline media, J. Nucl. Mater., 2004, 324, 152–164, DOI:10.1016/J.JNUCMAT.2003.09.010.
- ASTM C1220, Standard Test Method for Static Leaching of Monolithic Waste Forms for Disposal of Radioactive Waste, ASTM C1220-17, 2017 Search PubMed.
- ASTM C1285, Standard Test Methods for Determining the Chemical Durability of Nuclear Waste Glasses: the Product Consistency Test (PCT), ASTM C1285-21, 2014 Search PubMed.
- S. Gin, P. Jollivet, M. Fournier, C. Berthon, Z. Wang, A. Mitroshkov, Z. Zhu and J. V. Ryan, The fate of silicon during glass corrosion under alkaline conditions: A mechanistic and kinetic study with the International Simple Glass, Geochim. Cosmochim. Acta, 2015, 151, 68–85, DOI:10.1016/j.gca.2014.12.009.
- R. Hellmann, R. Wirth, D. Daval, J.-P. Barnes, J.-M. Penisson, D. Tisserand, T. Epicier, B. Florin and R. L. Hervig, Unifying natural and laboratory chemical weathering with interfacial dissolution–reprecipitation: A study based on the nanometer-scale chemistry of fluid–silicate interfaces, Chem. Geol., 2012, 294–295, 203–216, DOI:10.1016/J.CHEMGEO.2011.12.002.
- T. Geisler, T. Nagel, M. R. Kilburn, A. Janssen, J. P. Icenhower, R. O. C. Fonseca, M. Grange and A. A. Nemchin, The mechanism of borosilicate glass corrosion revisited, Geochim. Cosmochim. Acta, 2015, 158, 112–129, DOI:10.1016/j.gca.2015.02.039.
- C. Lenting, O. Plümper, M. Kilburn, P. Guagliardo and M. Klinkenberg, Towards a unifying mechanistic model for silicate glass corrosion, npj Mater. Degrad., 2018, 2, 28, DOI:10.1038/s41529-018-0048-z.
- S. Gin, C. Guittonneau, N. Godon, D. Neff, D. Rebiscoul, M. Cabí and S. Mostefaoui, Nuclear glass durability: New insight into alteration layer properties, J. Phys. Chem. C, 2011, 115, 18696–18706, DOI:10.1021/JP205477Q.
- T. L. Goût, S. Misra, E. T. Tipper, M. S. Bohlin, R. Guo and I. Farnan, Diffusive processes in aqueous glass dissolution, npj Mater. Degrad., 2019, 3, 39, DOI:10.1038/s41529-019-0102-5.
- T. Advocat, J. L. Crovisier, E. Vernaz, G. Ehret and H. Charpentier, Hydrolysis of R7T7 Nuclear Waste Glass in Dilute Media: Mechanisms and Rate as a function of Ph, MRS Proc., 1990, 212, 57–64, DOI:10.1557/PROC-212-57/METRICS.
- E. Curti, Glass Dissolution Parameters: Update for “Entorgungsnachweis”, PSI, 2003 Search PubMed.
- J. J. P. Bel, S. M. Wickham and R. M. F. Gens, Development of the Supercontainer Design for Deep Geological Disposal of High-Level Heat Emitting Radioactive Waste in Belgium, MRS Online Proc. Libr., 2006, 932, 1221, DOI:10.1557/PROC-932-122.1.
- Geological Disposal Steps towards Implementation. Nuclear Decommissioning Authority Report. NDA/RWMD/013, 2010 Search PubMed.
- R. G. W. Vasconcelos, N. Beaudoin, A. Hamilton, N. C. Hyatt, J. L. Provis and C. L. Corkhill, Characterisation of a high pH cement backfill for the geological disposal of nuclear waste: The Nirex Reference Vault Backfill, Appl. Geochem., 2018, 89, 180–189, DOI:10.1016/j.apgeochem.2017.11.007.
- G. Müller, M. B. K. Fritzsche, L. Dohmen and T. Geisler, Feedbacks and non-linearity of silicate glass alteration in hyperalkaline solution studied by in operando fluid-cell Raman spectroscopy, Geochim. Cosmochim. Acta, 2022, 329, 1–21, DOI:10.1016/j.gca.2022.05.013.
- K. Ferrand, M. Klinkenberg, S. Caes, J. Poonoosamy, W. V. Renterghem, J. Barthel, K. Lemmens, D. Bosbach and F. Brandt, Dissolution Kinetics of International Simple Glass and Formation of Secondary Phases at very High Surface Area to Solution Ratio in Young Cement Water, Materials, 2021, 14, 1254, DOI:10.3390/ma14051254.
- B. Parruzot, P. Jollivet, D. Rébiscoul and S. Gin, Long-term alteration of basaltic glass: Mechanisms and rates, Geochim. Cosmochim. Acta, 2015, 154, 28–48, DOI:10.1016/j.gca.2014.12.011.
- F. Brandt, S. Caes, M. Klinkenberg, J. Barthel, S. Liu, K. Lemmens, D. Bosbach, K. Ferrand, “Experimental Data for: Dissolution of Simulated Nuclear Waste Glass at High Surface Area to Solution Volume, High pH and 70 °C: Comparison of International Simple Glass and SON68 Glass”, Jülich DATA, V1, 2024, DOI:10.26165/JUELICH-DATA/HC3IOI.
- S. J. Pennycook, Z-contrast stem for materials science, Ultramicroscopy, 1989, 30, 58–69, DOI:10.1016/0304-3991(89)90173-3.
- P. Schlossmacher, D. O. Klenov, B. Freitag and H. S. V. Harrach, Enhanced Detection Sensitivity with a New Windowless XEDS System for AEM Based on Silicon Drift Detector Technology, Microsc. Today, 2010, 18, 14–20, DOI:10.1017/S1551929510000404.
- I. Muller, S. Ribet, I. Pegg, S. Gin and P. Frugier, Characterization of Alteration Phases on HLW Glasses After 15 Years of PCT Leaching, Ceramic Transactions, 2005, vol. 176, pp. 189–199, DOI:10.1002/9781118407950.ch19.
- T. Chave, Etudes des mécanismes d’altération par l’eau du verre R7T7 en milieu confine, Compréhension et modélisation de la cinétique résiduelle, Université de Montpellier II, 2008 Search PubMed.
- C. Carrière, P. Dillmann, E. Foy, D. Neff, J. J. Dynes, Y. Linard, N. Michau and C. Martin, Use of nanoprobes to identify iron-silicates in a glass/iron/argillite system in deep geological disposal, Corros. Sci., 2019, 158, 108104, DOI:10.1016/j.corsci.2019.108104.
- G. de Combarieu, M. L. Schlegel, D. Neff, E. Foy, D. Vantelon, P. Barboux and S. Gin, Glass–iron–clay interactions in a radioactive waste geological disposal: An integrated laboratory-scale experiment, Appl. Geochem., 2011, 26, 65–79, DOI:10.1016/j.apgeochem.2010.11.004.
- D. Rébiscoul, E. Burger, F. Bruguier, N. Godon, J.-L. Chouchan, J.-P. Mestre, P. Frugier, J.-E. Lartigue and S. Gin, Glass-Iron-Clay interactions in a radioactive waste geological disposal: a multiscale approach, MRS Proc., 2013, 1518, 185–190, DOI:10.1557/opl.2013.67.
- I. Pignatelli, F. Bourdelle, D. Bartier, R. Mosser-Ruck, L. Truche, E. Mugnaioli and N. Michau, Iron–clay interactions: Detailed study of the mineralogical transformation of claystone with emphasis on the formation of iron-rich T–O phyllosilicates in a step-by-step cooling experiment from 90 °C to 40 °C, Chem. Geol., 2014, 387, 1–11, DOI:10.1016/j.chemgeo.2014.08.010.
- G. de Combarieu, P. Barboux, N. Godon, Y. Minet and S. Gin, Modelling The Alteration of Son-68 Glass with Nearfield Materials, MRS Online Proc. Libr., 2006, 932, 861, DOI:10.1557/PROC-932-86.1.
- J.-L. Crovisier, T. Advocat and J.-L. Dussossoy, Nature and role of natural alteration gels formed on the surface of ancient volcanic glasses (Natural analogues of waste containment glasses), J. Nucl. Mater., 2003, 321, 91–109, DOI:10.1016/S0022-3115(03)00206-X.
- N. A. Stroncik and H.-U. Schmincke, Palagonite – a review, Int. J. Earth Sci., 2002, 91, 680–697, DOI:10.1007/s00531-001-0238-7.
- C. A. Utton, R. J. Hand, P. A. Bingham, N. C. Hyatt, S. W. Swanton and S. J. Williams, Dissolution of vitrified wastes in a high-pH calcium-rich solution, J. Nucl. Mater., 2013, 435, 112–122, DOI:10.1016/j.jnucmat.2012.12.032.
- B. Parruzot, J. V. Crum, J. T. Reiser, J. J. Neeway, S. N. Kerisit, R. C. Daniel, J. F. Bonnett, R. A. Reyes, L. M. Seymour, C. A. Burns, J. V. Ryan, G. L. Smith and R. M. Asmussen, Effect of zeolite type, temperature, and pH on Stage III glass alteration behavior for two nuclear waste glasses, J. Nucl. Mater., 2022, 567, 153717, DOI:10.1016/j.jnucmat.2022.153717.
- C. L. Corkhill, C. Mann, J. R. Eskelsen, D. N. Leonard, L. M. Mottram, M. C. Stennett, J. M. S. Ayling, C. L. Thorpe, M. R. Cole, S. Nicholas, R. Tappero and E. M. Pierce, Surface interfacial analysis of simulant high level nuclear waste glass dissolved in synthetic cement solutions, npj Mater. Degrad., 2022, 6, 67, DOI:10.1038/s41529-022-00279-5.
- C. Mann, T. Le Hoh, C. L. Thorpe and C. L. Corkhill, Dissolution of glass in cementitious solutions: An analogue study for vitrified waste disposal, MRS Adv., 2018, 3, 1147–1154, DOI:10.1557/adv.2018.227.
- J. J. Neeway, B. P. Parruzot, J. F. Bonnett, J. T. Reiser, S. N. Kerisit, J. V. Ryan and J. V. Crum, Acceleration of glass alteration rates induced by zeolite seeds at controlled pH, Appl. Geochem., 2020, 113, 104515, DOI:10.1016/j.apgeochem.2019.104515.
- A. Abdelouas, Y. El Mendili, A. Aït Chaou, G. Karakurt, C. Hartnack, J. Bardeau, T. Saito and H. Matsuzaki, A Preliminary Investigation of the ISG Glass Vapor Hydration, Int. J. Appl. Glass Sci., 2013, 4, 307–316, DOI:10.1111/ijag.12055.
- K. Ferrand, S. Liu and K. Lemmens, The Interaction Between Nuclear Waste Glass and Ordinary P ortland Cement, Int. J. Appl. Glass Sci., 2013, 4, 328–340, DOI:10.1111/ijag.12047.
- J. Goethals, K. Ferrand, R. Mosser-Ruck, J. Bonnet, K. David, S. Liu, J. Sterpenich, A. Abdelouas, Y. Morizet and K. Lemmens, Phenomenological description of the effect of glass dissolution on cement paste evolution in an integrated glass dissolution experiment, Appl. Geochem., 2024, 168, 106012, DOI:10.1016/j.apgeochem.2024.106012.
- A. J. Fisher, N. C. Hyatt, R. J. Hand and C. L. Corkhill, The Formation of Pitted Features on the International Simple Glass during Dynamic Experiments at Alkaline pH, MRS Adv., 2019, 993–999, DOI:10.1557/adv.2019.9.
- C. M. Jantzen, C. L. Trivelpiece, C. L. Crawford, J. M. Pareizs and J. B. Pickett, Accelerated Leach Testing of GLASS (ALTGLASS): I. Informatics approach to high level waste glass gel formation and aging, Int. J. Appl. Glass Sci., 2017, 8, 69–83, DOI:10.1111/ijag.12262.
- C. Jégou, S. Gin and F. Larché, Alteration kinetics of a simplified nuclear glass in an aqueous medium: effects of solution chemistry and of protective gel properties on diminishing the alteration rate, J. Nucl. Mater., 2000, 280, 216–229, DOI:10.1016/S0022-3115(00)00039-8.
| This journal is © The Royal Society of Chemistry 2024 |

