 Open Access Article
Accurate and sensitive dual-response fluorescence detection of microRNAs based on an upconversion nanoamplicon with red emission
Lingling Huang†
 *ac,
Yi Zhou†b,
Liang Xua,
Xin Ruanac,
Zhao Huanga,
Yue Keb,
Lisong Lin*ac and
Qiuling Tang*b
aDepartment of Stomatology, The First Affiliated Hospital of Fujian Medical University, Fuzhou, 350001, China. E-mail: huanglings2024@yeah.net; dr_lls@fjmu.edu.cn
bDepartment of Stomatology, Xiangyang Central Hospital, Affiliated Hospital of Hubei University of Arts and Science, Xiangyang, 441000, China. E-mail: 1099524983@qq.com
cDepartment of Stomatology, National Regional Medical Center, Binhai Campus of the First Affiliated Hospital, Fujian Medical University, Fuzhou, 350001, China
First published on 18th October 2024
Abstract
Oral squamous cell carcinoma (OSCC) is the most common type of oral cancer. In recent years, researchers have found a close relationship between microRNAs (miRNAs) and OSCC. In addition, miRNAs are highly stable in tissues and circulation, and are also considered potential biomarkers for cancer detection and prognosis. Among a variety of tools for miRNAs with low abundance, single red-emitting UCNP-based biosensors have attracted special interest due to their unique properties, including deep organizational penetration, weak radiation damage, and low autofluorescence. Additionally, the measurement of low-abundance analytes via enzyme-free signal amplification is also an effective means. Herein, by taking advantage of red-emitting UCNPs and an enzyme-toehold-mediated strand displacement cascade, a dual-signal amplification biosensor was constructed. The recycled miRNA can be regarded as a catalyst for the assembly of multiple H1/H2 duplexes, which promoted the response signal of augmented analyte expression. Moreover, the proposed biosensors improved the measurement accuracy via a dual-signal response to obviously avert false-positive signals. The proposed method was applied to measure miRNA-222 (a model analyte) in serum samples, and the results were similar to those of polymerase chain reaction (PCR), with spiked recoveries ranging from 91.2% to 101.7%. The proposed assay has the merits of high sensitivity, strong recognition, and low background, indicating broad potential for the measurement of diverse analytes in biological samples.
1 Introduction
Oral cancer is one of the most common malignant tumours, belonging to a type of head and neck tumours, of which more than 90% are oral squamous cell carcinoma (OSCC).1 OSCC often develops rapidly, with early metastasis to regional lymph nodes and later distant metastasis, seriously affecting the quality of life of patients and even threatening their lives. Despite significant progress in the treatment of OSCC, the mortality rate remains very high. How to achieve early prevention, early diagnosis, and effective treatment is one of the issues of concern in the modern medical community. MicroRNAs (miRNAs) are a class of stable short sequence non coding small molecule RNAs, whose main function is to participate in the regulation of target genes at the post transcriptional level.2–4 It can not only directly act as an oncogene or tumor suppressor gene, but also regulate the expression level of oncogenes or tumour suppressors by degrading or inhibiting the translation of target messenger RNA (miRNA). Recent studies have found abnormal expression of miRNAs in OSCC patients, for example, miRNA-222 is highly expressed in the peripheral blood of OSCC patients.5 Thus, miRNAs have received considerable attention as important biomarkers and novel therapeutic analytes.6,7 At present, several methods based on biosensing have been used for miRNA testing, including fluorescence,8,9 electrochemistry,10,11 colorimetric methods,12,13 and surface-enhanced Raman spectroscopy.14,15 Among them, the fluorescence assay for miRNA measurement is one of the most extensively applied approaches because of its advantages of easy operation, high sensitivity and homogeneity.Luminescent materials are critical for the construction of miRNA fluorescent biosensors. At present, the commonly used luminescent materials for stimuli-responsive fluorescent sensors for the measurement of miRNAs are organic fluorescent dyes16 or quantum dots.17 The development of these sensors has brought many new perspectives for biochemical research, disease diagnosis, and treatment. Unfortunately, biosensors based on organic fluorescence dyes or quantum dots often suffer from spontaneous fluorescence interference, biological toxicity, and low Stokes shifts, which prevent their dependability and stability. As a new generation of luminescent nanomaterials, lanthanide-doped upconversion nanoparticles (UCNPs) have many unique advantages, such as enhanced organization penetration depth, low radiation detriment, and poor autofluorescence, since they can take up near-infrared (NIR) radiation and then transmit ultraviolet or visible light radiation.18,19 Therefore, assays based on UCNPs for detecting miRNAs have attracted considerable attention because they can effectively overcome the above drawbacks caused by traditional fluorophores (such as quantum dots or organic dyes). In the field of fluorescence sensing, the green emission (wavelength at 550 nm) of UCNPs has been employed in most previous studies.20 Nevertheless, these sensor probes are still restricted due to the strong organizational intake of short wavelength light (below 600 nm).21 To overcome these limitations, red-emitting UCNPs are regarded as promising candidates for bioimaging or optical sensors because the light dispersion, absorption and autofluorescence of the organization are minimal in the red region (600–700 nm).22,23 However, much less attention has been given to constructing red-emitting UCNP-based biosensors for the detection of miRNAs.
Additionally, signal amplification strategies are another effective strategy for sensitive monitoring and analysis of miRNAs because of their small size, likeness between homologues, and low abundance. Currently, several signal amplification approaches, such as strand displacement amplification,24,25 loop-mediated isothermal amplification,26,27 and rolling circle amplification,28,29 are used. Herein, an analyte biomolecule can generate manifold signal exportations with the assistance of enzymes or metal ions, realizing the purpose of signal magnification for low-abundance miRNAs. However, the use of enzymes or metal ions limits their further utility. Furthermore, the accumulation of amplifiers may generate interference signals, resulting in reduced specificity. In contrast, a novel enzyme-free cascade amplification approach, catalytic hairpin assembly (CHA), has attracted much concerns due to its advantages, including reactions without enzyme catalysis, high measurement sensitivity, strong recognition, and simple and convenient operation.30–32
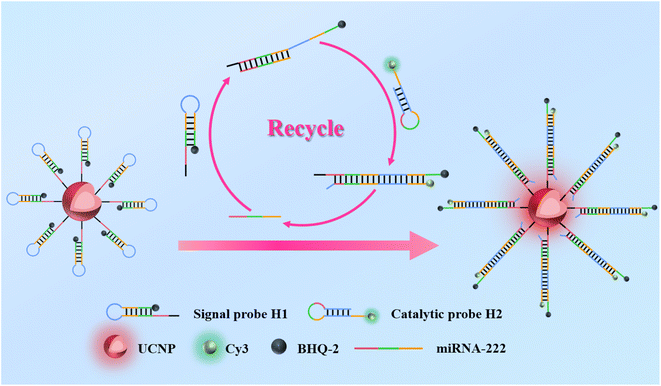
In this study, we established a simple, universal, and enzyme-free fluorescence sensing platform that utilizes a fluorescence signal loop amplification approach for sensitive and accurate determination of miRNAs (as shown in Fig. 1). This sensor emits light from the UCNPs as the main detection signal source. The sensor consists of two DNA hairpin probes (H1 and H2), and due to fluorescence resonance energy transfer, the emission of the UCNPs located at the 5′ end of the H1 hairpin is quenched by the BHQ-2 quencher at the 3′ terminal. In the absence of the objective miRNA-222, H1 and H2 remain largely locked in the hairpin structure. In the presence of the analyte substance, H1 unfolds by hybridization with the analyte substance, and then H2 hybridizes with unfolded H1 to replace the target substance. The detached analyte miRNA will hybridize with H1 again to initiate cyclic amplification. Finally, the UCNPs exhibit significantly enhanced fluorescence signals at 654 nm, and the green fluorescence signal of Cy3 weakens at 566 nm. Therefore, changes in dual-color fluorescence signals can be used to monitor target miRNAs. This detection sensor can serve as a multifunctional sensing platform for miRNA-based molecular diagnosis.
2 Experimental
2.1 Materials
TmCl3·6H2O, YbCl3·6H2O, ErCl3·6H2O, GdCl3·6H2O, 1-octadecene (ODE), oleic acid (OA), methanol, cyclohexane and ammonium fluoride (NH4F), phosphate-buffered saline (PBS), morpholinoethanesulfonic acid (MES), 1-(3-dimethylaminopropyl)-3-ethylcarbodiimide hydrochloride (EDC), sodium citrate, and N-hydroxy succinimide (NHS) were attained from Aladdin (Shanghai, China). All oligonucleotide sequences employed in this study were obtained from Sangon Biotechnology Co., Ltd (Shanghai, China) with high-performance liquid chromatography (HPLC) purity. The chains of the DNA and RNA utilized in this work were as follows:miRNA21: 5′-UAGCUUAUCAGACUGAUGUUGA-3′
miRNA-155: 5′-UUAAUGCUAAUCGUGAUAGGGGU-3′
ssmiRNA-222: 5′-UGGGUCAUCGGUCUACAUCGA-3′
miRNA-222: 5′-AGCUACAUCUGGCUACUGGGU-3′
Signal probe (H1): NH2-TTTACCCAGTAGCCAGATGTAGCTCCATGTGTAGAAGCTACATCTGGC-BHQ2
Catalytic probe (H2): Cy3-TGTAGCTTCTACACATGGAGCTACATCTGGCTACTCCATGTGTAGA
2.2 Instrument
The morphology and structure were observed by a JEM-2100F 200 kV transmission electron microscope (TEM). X-ray powder diffraction (XRD) measurements were made employing Cu-Kα radiation (λ = 0.15418 nm) on a Japanese Miniflex600 diffractometer. The ultraviolet visible absorption spectrum was recorded with a Lambda950 ultraviolet visible spectrophotometer. Fourier transform infrared (FT-IR) spectra were attained with a Nicolet 5700 infrared spectrometer. A zeta potential analyser (Nano-ZS90) was used for zeta potential analysis. Emission and excitation spectra were determined with a FluoroMax-4 fluorescence spectrometer, and an external 1 W CW laser (980 nm) was used as the irritation device to obtain upconversion emission spectra.2.3 Preparation and functionalization of UCNPs
2.4 Preparation of the fluorescent probe
To ensure that the UCNPs modified with sodium citrate and H1 modified with –NH2 formed better amide bonds, 200 μL of Cit–UCNPs dissolved in ultrapure water was dispersed in 1500 μL of MES buffer (10 mM, pH 5.5), and then 5 mg of EDS and 10 mg of NHS-activated carboxyl groups were entered. Then, the mixed liquid was agitated for 30 min. H1 was mixed with the activated Cit–UCNPs and incubated at 37 °C for 3 h. Eventually, the H1–UCNPs were assembled by centrifugation at 12![[thin space (1/6-em)]](https://www.rsc.org/images/entities/char_2009.gif) 000 rpm for 8 min, rinsed in ultrapure water and dispersed in 500 μL of PBS (10 mM, pH 7.4) including 50 mM NaCl and 5 mM MgCl2. H1 and H2 were annealed at 95 °C for 5 min and then placed at room temperature to cool naturally so that they formed a hairpin structure before use. Due to the BHQ2 quencher in the H1 modification and Cy3 in the H2 modification, light protection was carried out during the whole experiment.
000 rpm for 8 min, rinsed in ultrapure water and dispersed in 500 μL of PBS (10 mM, pH 7.4) including 50 mM NaCl and 5 mM MgCl2. H1 and H2 were annealed at 95 °C for 5 min and then placed at room temperature to cool naturally so that they formed a hairpin structure before use. Due to the BHQ2 quencher in the H1 modification and Cy3 in the H2 modification, light protection was carried out during the whole experiment.
2.5 Fluorescence measurement
Before the fluorescence measurement, all the DNA strands were annealed to form a stable hairpin structure. In the experiment to explore the amount of H1, diverse volumes (10, 20, 30, 40, 50, and 60 μL) of H1 (1 μM) and 200 μL of carboxyl-activated UCNP aqueous solution were added, and fluorescence measurements were performed after incubation for 3 h. To explore the effect of incubation time on fluorescence intensity, 20 μL of H1–UCNPs, 20 μL of 500 nM H2, and 10 μL of 500 nM miRNA-222 were added. The overall volume of the mixed liquid was 220 μL, and the mixture was incubated in a 37 °C water bath. Fluorescence measurements were performed every 20 min. The excitation wavelength of the UCNP fluorescence was 980 nm. The fluorescence signal was observed at 654 nm, and the fluorescence spectra in the range of 400–700 nm were recorded. In addition, the excitation wavelength for Cy3 fluorescence was 514 nm. The fluorescence signal was observed at 566 nm, and the fluorescence spectrum from 550 nm to 700 nm was recorded.2.6 Analysis of actual samples
According to ref. 37, the blood sample was collected in a tube without anticoagulant, naturally agglutinated for 30 min at room temperature, and then centrifuged at 3000g for 10 min. The supernatant serum was collected and stored in a 1.5 mL centrifuge tube in a refrigerator at −80 °C. If severe hemolysis occurs, the serum will be reprepared. The subsequent step for the determination of miRNA-222 contents in serum samples is depicted in Section 2.5.3 Results and discussion
3.1 Morphological structure, phase, and spectrum of the UCNPs
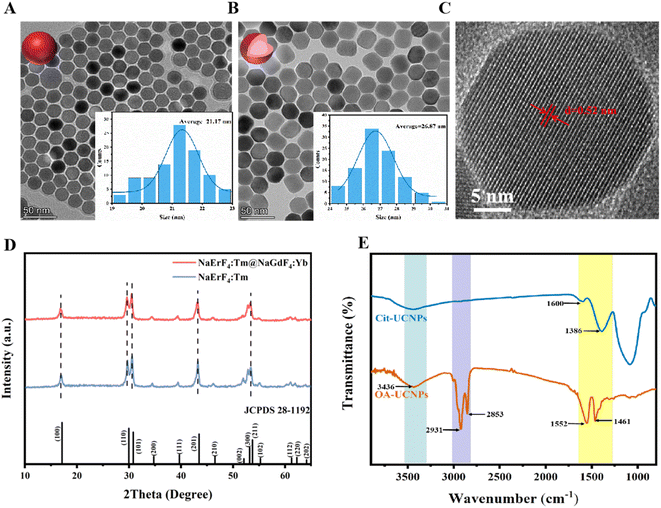
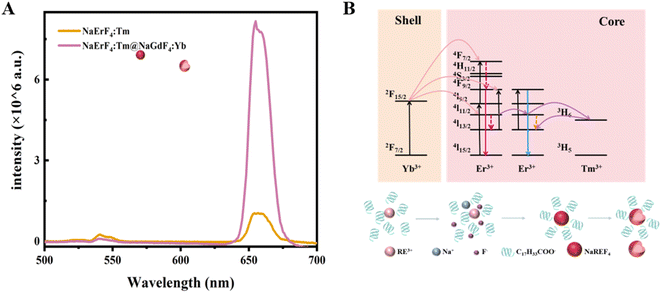
The morphological structure and phase of the as-synthesized UCNPs were characterized by TEM, XRD and FTIR. The TEM image (Fig. 2A) reveals that the synthesized NaErF4:Tm samples have a hexagonal nucleus with a mean diameter of approximately 21.17 nm. After coating the NaGdF4:Yb outer shell, the average diameter increased to 26.87 nm, but the material still exhibited a hexagonal morphology (Fig. 2B), indicating that the core–shell structure was constructed and that this did not affect the morphological characteristics of the nanocrystals. This phenomenon was validated by XRD. To observe the lattice patterns of nanocrystals more clearly, the morphology and structure of the prepared UCNPs with the core–shell structure were characterized by high-resolution TEM (HRTEM). The interplanar spacing of 0.52 nm was also observed in Fig. 2C, which corresponded to the (100) crystallographic plane of β-NaYF4. As displayed in Fig. 2D, the XRD patterns of the NaErF4:Tm and NaErF4:Tm@NaGdF4:Yb nanocrystals are in line with those of the standard hexagonal phase NaErF4 (JCPDS card no. 28-1192). No other miscellaneous peaks were detected, indicating that a pure hexagonal phase of the prepared UCNPs with prominent crystallinity was acquired. Finally, to verify ligand exchange on the outside of the UCNPs, FT-IR was used to analyse the molecular structure and functional groups of the UCNPs before and after ligand exchange. As depicted in Fig. 2E, the peak at 3436 cm−1 originated from the stretching vibrance of –OH with OA molecules, while the peaks at 2931 cm−1 and 2853 cm−1 were attributed to the stretching vibration of methylene in long alkyl chains. In addition, the peaks at 1552 cm−1 and 1461 cm−1 originate from the asymmetric and symmetric stretching vibrances of the carboxyl group. After ligand exchange, the characteristic peaks from OA mentioned above became weak or disappeared; furthermore, new peaks emerged at 1600 and 1386 cm−1, indicating that the oleic acid chains on the face of the UCNPs were successfully exchanged by citrate. Sensors based on Cit–UCNPs with good water solubility are more suitable for detecting analytes in biological samples.Fluorescence spectroscopy analysis was fulfilled on the composite nanocrystals, as shown in Fig. 3A. Under excitation at 980 nm, both the core and core–shell UCNPs emit a single red light at 654 nm. The principle of luminescence is depicted in Fig. 3B. The red emission of Er3+ mainly comes from the transition between the 4F9/2 and 4I15/2 energy levels, and this excited state can be filled with nonradiative relaxation of the 4I7/2 excited state, or it can be directly transitioned to the 4I13/2 activated status through nonradiative relaxation of the 4I11/2 and then transferred to the 4I9/2 activated status by receiving energy from the excited Yb3+. Here, Er3+ has dual functions of energy collection and energy transfer, and its 4I11/2 energy level can be directly stimulated or realized through the energy transfer of neighboring ions. As the concentration of Er3+ increases, the distance between its particles decreases, which intensifies the energy transfer between Er3+. Additionally, the introduction of Tm3+ captures the energy in the 4I11/2 status of Er3+ by the 3H5 level of Tm3+, which then undergoes a reverse energy transfer towards the 4I13/2 level. The energy is then pumped to the 4F9/2 condition of Er3+ by receiving energy transfer from Yb3+. Therefore, the red emission at 654 nm manipulates the upconversion luminescence (UCL) process. Furthermore, the fluorescence intensity of the nanoparticles in the core–shell structure reaches 7.8 × 10⁵, while that of the core is 1 × 10⁵. It is evident that the fluorescence intensity of core–shell UCNPs is much greater than that of bare nuclei. This is mainly because the energy capture centers of the Tm3+ and NaGdF4:Yb active shell layers achieve efficient energy transfer of near-infrared photons to the upconversion field, reducing the luminescence quenching arisen by surface defects and thus leading to high-intensity red light emission.
3.2 Characterization of H1-functionalized UCNPs
To design enzyme-free toehold-mediated signal amplification biosensors, the UCNPs were modified by ligand exchange and functionalization with H1–NH2, as depicted in Fig. 4A. The H1–UCNPs were first characterized by UV-visible spectroscopy, as shown in Fig. 4B. Compared to Cit–UCNPs (black curves), H1–UCNPs (red curve) exhibited a UV-visible absorption peak of DNA at 260 nm, indicating successful grafting of hairpin H1 on the surface of the UCNPs. In addition, the zeta potentials of the OA–UCNPs, Cit–UCNPs and H1–UCNPs were measured. Fig. 4C shows that the zeta potential of the OA–UCNPs was positive, but the zeta potential of the Cit–UCNPs was negative, indicating that citrate successfully replaced oleic acid on the face of the UCNPs. Additionally, compared to the zeta potential of Cit–UCNPs, the zeta potential of H1–UCNPs increased to −20.2 mV, indicating that DNA strand H1 may have been modified on the surface of Cit–UCNPs.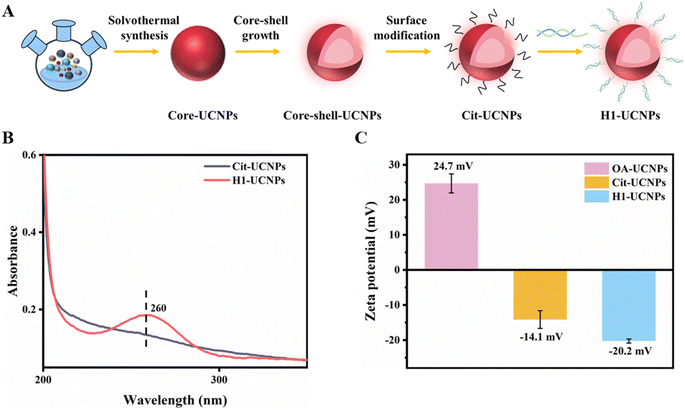 | ||
| Fig. 4 (A) Modification process, (B) UV visible absorption spectrum, and (C) zeta potential of the resulting UCNPs. | ||
3.3 The mechanism and feasibility of measuring miRNAs
As shown in Fig. 1, the designed sensor includes UCNPs and two hairpin structures (H1 and H2). H1 comprises complementary strand sequences targeting miRNA, and H2 is a DNA strand that can hybridize with H1. The UCNPs can emit a single red light under excitation at 980 nm. Due to fluorescence resonance energy transfer (FRET), the emission of the UCNPs located at the 5′ end of the H1 hairpin is quenched by the BHQ-2 quencher at the 3′ end. When the target miRNA is present, the complementary sequence between H1 and the target miRNA will be fully hybridized, the hairpin structure of H1 will be untucked, and H2 will hybridize with the untucked H1, causing the analyte miRNA to detach through the chain displacement principle. After detachment, the analyte miRNA hybridized with the hairpin progression of H1 again, initiating a chain shift cycle. Therefore, the emission of the UCNPs at 654 nm was restored, and the fluorescence of Cy3 at 566 nm was quenched by BHQ2, achieving dual signal amplification for determination of the target miRNA.To validate the feasibility of the designed biosensor, the UCL spectra under 980 nm irradiance and fluorescence spectra under 514 nm excitation of the different measurement systems were measured. As shown in Fig. 5A and B, when the target miRNA-222 and H1–UCNPs are mixed, the H1 hairpin is opened by the target, causing the UCNPs to stay away from the BHQ2 quencher, resulting in an increase in the fluorescence strength of the UCNPs. With the accession of H2, the fluorescence strength of the UCNPs was clearly significantly restored. Moreover, the fluorescence intensity of Cy3 decreased significantly (Fig. 5C and D). The above phenomenon indicates that dual signal amplification for detecting the target miRNA is feasible.
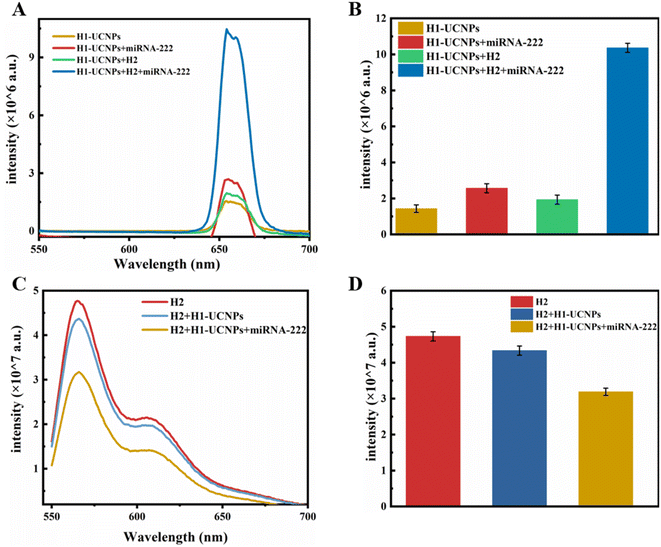 | ||
| Fig. 5 (A) and (B) Upconversion luminescence spectra under 980 nm excitation and (C) and (D) fluorescence spectra under 514 nm excitation of the different detection systems. | ||
3.4 Influence of the experimental parameters
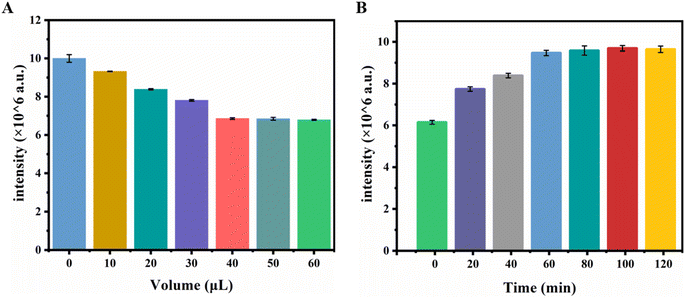
In the constructed biosensor, BHQ2 serves as an UCL source for the receptor-quenched UCNPs. Therefore, the effect of the amount of H1 with BHQ2 on the UCL intensity was first investigated. As shown in Fig. 6A, as the volume of H1 raised, the fluorescence strength of the UCNPs at 654 nm progressively decreased. When the volume reached 40 μL, it remained basically unchanged. Therefore, 50 μL was selected as the dose of H1 for subsequent experiments. The effect of incubation time on the sensing system was also investigated. Fig. 6B shows that the luminescence signal progressively raised with enlarging incubation time and amounted to a plateau at 60 min. The results indicated that the hybridization reaction was fundamentally complete, 60 min of incubation was selected as the optimal incubation time.3.5 Dual-signal determination of miRNA-222
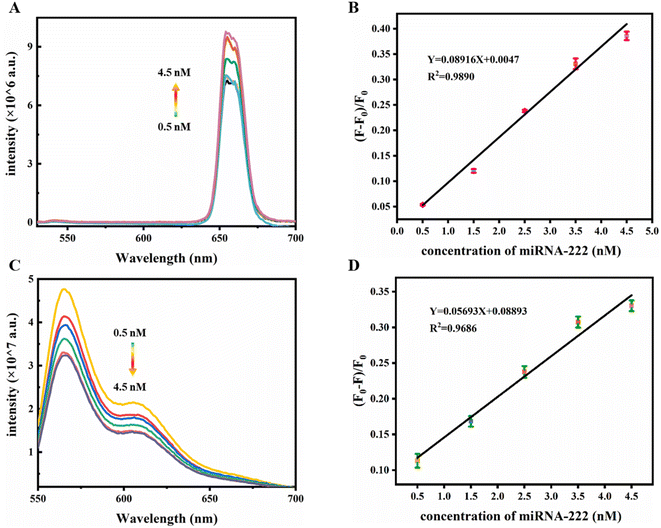
Based on the optimized experimental conditions mentioned above, the dual-signal fluorescence response of the detection system to miRNA-222 was tested by adding different concentrations of miRNA-222. As depicted in Fig. 7A, as the contents of miRNA-222 gradually augmented, the UCL strength of the UCNPs at 654 nm gradually increased. As shown in Fig. 7B, there was a linear relevance between the UCL signal response and the concentration of miRNA-222 in the range of 0.5–4.5 nM. The fitted linear equation can be denoted as y = 0.08916x + 0.0047 (R2 = 0.9890). Moreover, the fluorescence intensity of Cys at 566 nm (Fig. 7C) gradually decreased with increasing miRNA-222 concentration. In addition, the fluorescence intensities within the miRNA-222 concentration range of 0.5–4.5 nM (Fig. 7D) were linearly correlated, and the fitted linear data can be expressed as y = 0.05693x + 0.08893 (R2 = 0.9686). The limit of detection (LOD) is computed based on the expression: LOD = 3 × δ/S, where δ is the noise level, which is the standard deviation from 10 blank tests, and S is the slope of the linear regression equation in sensitivity testing. Therefore, the LOD of the UCL detection is 0.23 nM, and the LOD of fluorescence detection is 0.44 nM.3.6 Stability of the constructed sensor
In addition, to investigate the stability of the constructed sensor, the recovery efficiency of the UCL at 654 and the fluorescence quenching efficiency of Cy3 at 566 nm were investigated within one week. The concentration of miRNA-222 was 2.5 nM, and the detection process was described above. Fig. 8 shows that the recovery efficiency of the UCL at 654 (A) and the fluorescence quenching efficiency of Cy3 at 566 nm (B) of the initial value are still 89.87% and 89.61% after being placed away from light for a week, indicating that the constructed sensor has good stability.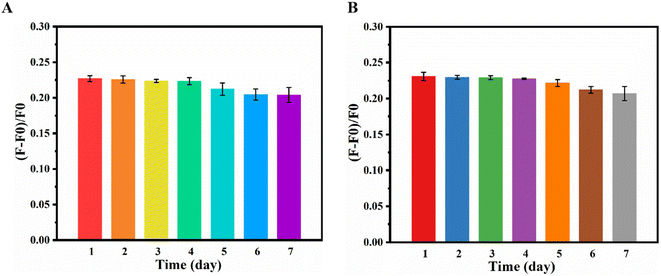 | ||
| Fig. 8 (A) The recovery efficiency of the UCL at 654 and (B) the fluorescence quenching efficiency of Cy3 at 566 nm. | ||
3.7 Selective measurement of miRNA-222
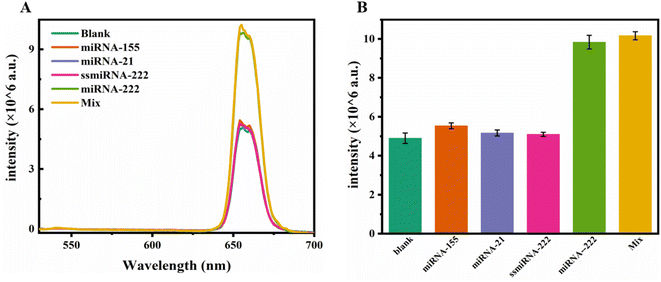
To assess the selectivity of the established fluorescent probe in response to miRNA-222, we investigated the interactions between other miRNAs and the fluorescent probe. Under the same reaction conditions, the proposed biosensor detected miRNA-222, miRNA-155, miRNA-21 and ssmiRNA-222 at a concentration of 2.5 nM. As shown in Fig. 9, other miRNAs could hardly restore the luminescence of the UCNPs, while the recovery of the luminescence triggered by miRNA-222 was significantly greater than that triggered by other miRNAs, indicating that the fluorescent biosensor has good selectivity and can distinguish miRNA-222 well from its analogues. The anti-interference ability of the fluorescent biosensor was also investigated. Compared to that of the blank group, the luminescence of the mixed sample still revealed significant recovery, and the fluorescence biosensor was still able to respond to miRNA-222, indicating that the proposed biosensor has good anti-interference ability.3.8 Measurement of miRNA in actual samples
To validate the applicability of the determination method, serum samples spiked with distinct concentrations of miRNA-222 (1.5, 2.5 and 3.5 nM) were analysed. Table 1 shows that the polymerase chain reaction (PCR) results within a reasonable range were between 91.2% and 101.7%, with a relative standard deviation (RSD, n = 3) less than 4.48%. These detection data suggest that the established approach has good detection capability for miRNAs in complex serum samples.| Sample | Added (nM) | Upconversion luminescence (654 nm) | Fluorescence (566 nm) | PCR (nM) | ||||
|---|---|---|---|---|---|---|---|---|
| Found (nM) | Recovery (%) | RSD (%) | Found (nM) | Recovery (%) | RSD (%) | |||
| Serum | 1.5 | 1.46 | 97.3 | 4.13 | 1.41 | 94 | 4.48 | 1.52 |
| 2.5 | 2.53 | 101.2 | 3.76 | 2.28 | 91.2 | 4.12 | 2.53 | |
| 3.5 | 3.56 | 101.7 | 4.25 | 3.31 | 94.6 | 3.87 | 3.52 | |
4 Conclusions
MiRNA dual-signal detection based on signal amplification was developed by taking advantage of red-emitting UCNPs and an enzyme-free toehold-mediated strand displacement cascade. In the sensing system, the recycled miRNA analyte served as a catalyst for sensor self-assembly via a nonenzymatic toehold-mediated strand displacement cascade, which produced a luminescence signal of increased analyte level. Compared with conventional single-response biosensors, the proposed biosensors, which exhibit dual-signal responses, including UCL at 654 nm and fluorescence at 566 nm, effectively excluded false-positive signals and enhanced the accuracy of the determination results. Furthermore, utilizing single red-emitting UCNPs as luminescent donors can effectively reduce the background interference caused by biological tissue absorption. This sensing platform could be utilized to measure different low-abundance biomarkers by altering the complementary strand.Ethical statement
Human serum samples were attained from The First Affiliated Hospital of Fujian Medical University. Before the laboratory study, written informed consent was signed by all volunteers. All procedures were performed under the guidelines approved by The First Affiliated Hospital of Fujian Medical University. The experimental procedure was approved by the Medical Ethics Committee of The First Affiliated Hospital of Fujian Medical University.Data availability
The authors confirm that the data supporting the findings of this study are available within the article.Author contributions
Lingling Huang, Yi Zhou, Lisong Lin and Qiuling Tang designed research. Lingling Huang, Yi Zhou, Liang Xu and Xin Ruan performed the experiments. Zhao Huang, Yue Ke, Lisong Lin and Qiuling Tang analyzed data. All author wrote and revised the manuscript.Conflicts of interest
The authors declare that they have no known competing financial interests or personal relationships that could have appeared to influence the work reported in this paper.Acknowledgements
This work was supported by Joint Funds for the Innovation of Science and Technology, Fujian province (2023Y9066), Natural Science Foundation of Fujian Province (2021J01220), and Fujian Provincial Health Science and Technology Plan Project (2018-1-53).References
- F. Bray, J. Ferlay and I. Soerjomataram, et al., Global cancer statistics 2018: GLOBOCAN estimates of incidence and mortality worldwide for 36 cancers in 185 countries, Ca-Cancer J. Clin., 2018, 68(6), 394–424, DOI:10.3322/caac.21492.
- Y. Piao, M. Piao and K. H. Ryu, Multiclass cancer classification using a feature subset-based ensemble from microRNA expression profiles, Comput. Biol. Med., 2017, 80, 39–44, DOI:10.1016/j.compbiomed.2016.11.008.
- A. Keller, P. Leidinger and A. Bauer, et al., Toward the blood-borne miRNome of human diseases, Nat. Methods, 2011, 8(10), 841–843, DOI:10.1038/nmeth.1682.
- S. Li, D. Lv and H. Yang, et al., A review on the current literature regarding the value of exosome miRNAs in various diseases, Ann. Med., 2023, 55(1), 2232993, DOI:10.1080/07853890.2023.2232993.
- Y. A. Chang, S. L. Weng and S. F. Yang, et al., A three-microRNA signature as a potential biomarker for the early detection of oral cancer, Int. J. Mol. Sci., 2018, 19(3), 758, DOI:10.3390/ijms19030758.
- E. S. Lobera, M. A. Varela and R. L. Jimenez, et al., MiRNA as biomarker in lung cancer, Mol. Biol. Rep., 2023, 50(11), 9521–9527, DOI:10.1007/s11033-023-08695-9.
- B. Martinez and P. V. Peplow, MicroRNAs as diagnostic markers and therapeutic targets for traumatic brain injury, Neural Regener. Res., 2017, 12(11), 1749–1761, DOI:10.4103/1673-5374.219025.
- A. Wang, Q. Lin and S. Liu, et al., Aptamer-tethered self-assembled FRET-flares for microRNA imaging in living cancer cells, Chem. Commun., 2020, 56(16), 2463–2466, 10.1039/c9cc09919k.
- W. Zhao, Y. Jiang and H. Zhou, et al., Hairpin-functionalized DNA tetrahedra for miRNA imaging in living cells via self-assembly to form dendrimers, Analyst, 2022, 147(10), 2074–2079, 10.1039/d2an00080f.
- X. Jiang, Y. Xie and D. Wan, et al., GUITAR-enhanced facile discrimination of aged Chinese Baijiu using electrochemical impedance spectroscopy, Anal. Chim. Acta, 2019, 1059, 36–41, DOI:10.1016/j.aca.2019.01.050.
- X. Peng, J. Yang and W. Liang, et al., Double loop-stem hairpins mediated hybridization chain reaction: a multifunctional DNA molecular tool to produce the intact aptamer for label-free biosensing, Sens. Actuators, B, 2022, 369, 132327, DOI:10.1016/j.snb.2022.132327.
- J. Lee, H. K. Na and S. Lee, et al., Advanced graphene oxide-based paper sensor for colorimetric detection of miRNA, Microchim. Acta, 2022, 189(1), 35, DOI:10.1007/s00604-021-05140-1.
- X. Peng, J. Yang and W. Liang, et al., Double loop-stem hairpins mediated hybridization chain reaction: a multifunctional DNA molecular tool to produce the intact aptamer for label-free biosensing, Sens. Actuators, B, 2022, 369, 132327, DOI:10.1016/j.snb.2022.132327.
- J. Cui, Q. Guan and H. Lv, et al., Three-dimensional nanorod array for label-free surface-enhanced Raman spectroscopy analysis of microRNA pneumoconiosis biomarkers, Spectrochim. Acta, Part A, 2021, 261, 120015, DOI:10.1016/j.saa.2021.120015.
- P. Li, F. Long and W. Chen, et al., Fundamentals and applications of surface-enhanced Raman spectroscopy-based biosensors, Curr. Opin. Biomed. Eng., 2020, 13, 51–59, DOI:10.1016/j.cobme.2019.08.008.
- F. U. Jiye, T. U. Tiantian and W. E. N. Tian, et al., High specific microRNA detection based on G-quadruplex sensitive fluorescence under isothermal amplification, Chin. J. Anal. Chem., 2023, 51(8), 100292, DOI:10.1016/j.cjac.2023.100292.
- F. Ma, Q. Zhang and C. Zhang, Catalytic self-assembly of quantum-dot-based microRNA nanosensor directed by toehold-mediated strand displacement cascade, Nano Lett., 2019, 19(9), 6370–6376, DOI:10.1021/acs.nanolett.9b02544.
- K. Yadav, A. C. Chou and R. K. Ulaganathan, et al., Targeted and efficient activation of channelrhodopsins expressed in living cells via specifically-bound upconversion nanoparticles, Nanoscale, 2017, 9(27), 9457–9466, 10.1039/c7nr03246c.
- W. Li, Z. Liu and Z. Chen, et al., An intelligent near-infrared light activatable nanosystem for accurate regulation of zinc signaling in living cells, Nano Res., 2017, 10, 3068–3076, DOI:10.1007/s12274-017-1522-6.
- K. Yadav, A. C. Chou and R. K. Ulaganathan, et al., Targeted and efficient activation of channelrhodopsins expressed in living cells via specifically-bound upconversion nanoparticles, Nanoscale, 2017, 9(27), 9457–9466, DOI:10.1016/j.optmat.2020.110144.
- C. Ding and T. Ren, Near infrared fluorescent probes for detecting and imaging active small molecules, Coord. Chem. Rev., 2023, 482, 215080, DOI:10.1016/j.ccr.2023.215080.
- W. J. Hou, Y. Liu and Y. Jiang, et al., Aptamer-based multifunctional ligand-modified UCNPs for targeted PDT and bioimaging, Nanoscale, 2018, 10(23), 10986–10990, 10.1039/c8nr01096j.
- Z. Gerelkhuu, D. Jung and B. T. Huy, et al., Highly selective and sensitive detection of catecholamines using NaLuGdF4: Yb3+/Er3+ upconversion nanoparticles decorated with metal ions, Sens. Actuators, B, 2019, 284, 172–178, DOI:10.1016/j.snb.2018.12.135.
- Z. Chi, Y. Wu and L. Chen, et al., CRISPR-Cas14a-integrated strand displacement amplification for rapid and isothermal detection of cholangiocarcinoma associated circulating microRNAs, Anal. Chim. Acta, 2022, 1205, 339763, DOI:10.1016/j.aca.2022.339763.
- S. Feng, H. Chen and Z. Hu, et al., Ultrasensitive detection of miRNA via CRISPR/Cas12a coupled with strand displacement amplification reaction, ACS Appl. Mater. Interfaces, 2023, 15(24), 28933–28940, DOI:10.1021/acsami.3c03399.
- C. Li, Z. Li and H. Jia, et al., One-step ultrasensitive detection of microRNAs with loop-mediated isothermal amplification (LAMP), Chem. Commun., 2011, 47(9), 2595–2597, 10.1039/c0cc03957h.
- K. Hashimoto, M. Inada and K. Ito, Multiplex real-time loop-mediated isothermal amplification using an electrochemical DNA chip consisting of a single liquid-flow channel, Anal. Chem., 2019, 91(5), 3227–3232, DOI:10.1021/acs.analchem.8b05284.
- Y. J. Lee, J. Y. Jeong and J. Y. Do, et al., Rapid and ultrasensitive miRNA detection by combining endonuclease reactions in a rolling circle amplification (RCA)-based hairpin DNA fluorescent assay, Anal. Bioanal. Chem., 2023, 1–9, DOI:10.1007/s00216-023-04618-6.
- C. Hong, A. Baek and S. S. Hah, et al., Fluorometric detection of microRNA using isothermal gene amplification and graphene oxide, Anal. Chem., 2016, 88(6), 2999–3003, DOI:10.1021/acs.analchem.6b00046.
- X. Chen, C. Huang and F. Nie, et al., Enzyme-free and sensitive method for single-stranded nucleic acid detection based on CHA and HCR, Anal. Methods, 2023, 15(34), 4243–4251, 10.1039/d3ay00975k.
- D. Li, W. Cheng and Y. Li, et al., Catalytic hairpin assembly actuated DNA nanotweezer for logic gate building and sensitive enzyme-free biosensing of microRNAs, Anal. Chem., 2016, 88(15), 7500–7506, DOI:10.1021/acs.analchem.5b04844.
- X. Li, W. Cheng and D. Li, et al., A novel surface plasmon resonance biosensor for enzyme-free and highly sensitive detection of microRNA based on multi component nucleic acid enzyme (MNAzyme)-mediated catalyzed hairpin assembly, Biosens. Bioelectron., 2016, 80, 98–104, DOI:10.1016/j.bios.2016.01.048.
- D. Giust, M. I. Lucío and A. H. El-Sagheer, et al., Graphene oxide-upconversion nanoparticle based portable sensors for assessing nutritional deficiencies in crops, ACS Nano, 2018, 12(6), 6273–6279, DOI:10.1021/acsnano.8b03261.
- H. S. Naher, B. A. H. Al-Turaihi and S. H. Mohammed, et al., Upconversion nanoparticles (UCNPs): synthesis methods, imaging and cancer therapy, J. Drug Delivery Sci. Technol., 2023, 80, 104175, DOI:10.1016/j.jddst.2023.104175.
- J. Wang, S. Zheng and H. Zhang, et al., Unraveling the Growth Process of Core-Shell Structured Upconversion Nanoparticles: Implications for Color Tuning of Upconversion Luminescence, ACS Appl. Nano Mater., 2023, 6(7), 6398–6406, DOI:10.1021/acsanm.3c00998.
- T. Zhao, D. Wu and X. Zhang, et al., A fluorescent sensor based on single band bright red luminescent core-shell UCNPs for the high-sensitivity detection of glucose and glutathione, Anal. Chim. Acta, 2024, 1295, 342323, DOI:10.1016/j.aca.2024.342323.
- M. E. Rhéaume, J. Perreault and D. Fournier, et al., Preparation and growth factor characterization of cord blood-derived plasma, serum, growth factor-rich plasma and induced serum, Cytokine, 2022, 149, 155756, DOI:10.1016/j.cyto.2021.155756.
Footnote |
| † These authors contributed equally to this work. |
| This journal is © The Royal Society of Chemistry 2024 |

