 Open Access Article
Preparation of superhydrophobic nanowires on polypropylene surface via injection compression molding for efficient fog collection†
Xing-Yu Wang * and
Han-Xiong Huang
Lab for Micro Molding and Polymer Rheology, Guangdong Provincial Key Laboratory of Technique and Equipment for Macromolecular Advanced Manufacturing, South China University of Technology, Guangzhou 510640, People's Republic of China. E-mail: 1437751926@qq.com
First published on 14th October 2024
Abstract
In this work, a superhydrophobic polypropylene (PP) replica with nanowires is fabricated using an injection compression molding (ICM) process. The morphology, superhydrophobicity and fog water harvesting efficiency of the as-prepared PP replica surface are investigated. Morphological characterization indicates that the PP replica surface exhibits nanowires with intertwined tips. Compared to the untreated PP surface (referred to as the PP counterpart), the PP replica surface shows a higher contact angle (CA) and lower rolling angle (RA). Furthermore, the complete transfer of a water droplet with no volume loss from the PP replica surface to the filter paper shows that nanowires on the PP replica surface are responsible for the superhydrophobic and low-adhesive properties of the surface. The Cassie–Baxter state with a CA of ∼153°, low ice adhesion strength (13.3 kPa at −20 °C) and good fog water harvesting efficiency (∼7.26 g m−2 s−1) demonstrate that the prepared PP replica has economic potential for fog water harvesting applications.
Introduction
Water is vital for the survival of all living organisms. Nowadays, dry weather and severe drought have brought many problems, as seen in many countries across the world.1 Fresh water shortage has become a major global concern. The deterioration of water quality, urbanization, climate change, population growth and rising industrial demand have intensified this crisis. In order to solve the problem of fresh water shortage, several possible solutions have been proposed, such as fresh water transportation, atmospheric water harvesting, wastewater purification, and seawater desalination.2,3 Among these methods, atmospheric harvesting, especially fog collection, as a largely undeveloped clean water resource, has become one of the most promising solutions to solve the water crisis due to its simple device, no need for additional treatment and wide availability in terms of operational and maintenance costs. Fog collection has attracted great attention from researchers and is currently being investigated.4–7In nature, many plants8,9 and animals10,11 have evolved distinct surface morphologies to collect water from the atmosphere. After in-depth research, it has been found that the factors affecting fog collection performance include droplet capture, relative humidity, surface structure and surface chemical composition.12–14 Among them, the micro-/nano-structure and wetting characteristics of the collection surface are the key factors affecting fog collection performance.15–18 Learning from nature has been a biological inspiration for scientists and engineers to design and construct novel materials and devices. Inspired by the biological surface morphologies of various organisms in nature, such as cacti,8 nepenthes,9 spider silk10 and desert beetles,11 scientists have designed and developed artificial surfaces with unique micro-/nano-structures that can be used for water collection applications from humid air.19,20 At present, research on constructing efficient fog water harvesting surfaces are in a positive development stage. The superhydrophobic/superhydrophilic surfaces with micro-/nano-scale textures have been fabricated successfully, which show good fog collecting ability.12,13,18 And in the reported literature, fog water harvesting was studied under different fog flow rates, collection distances, and relative humidities (RH). For better comparison, the detailed parameters are summarized in Table 1. These studies well addressed the theoretical design of the pattern on a hydrophilic–hydrophobic hybrid surface for fog water harvesting. Although many methods have been developed to manufacture various superhydrophobic surfaces for water harvesting, designing a surface that can efficiently collect fog remains a challenging task. It is necessary to develop a facile and scalable manufacturing technology to prepare stable superhydrophobic surfaces at low cost.
| Substrate | Method | Fog flow rate/distance/RH | FHR | Ref. |
|---|---|---|---|---|
| a NG means not given, units of distance and fog harvesting rate (FHR) are cm and g cm−2 h−1. | ||||
| Al–PMMA | Dip coating | 250 g h−1/8/93.5% | 3.20–4.50 | 10 |
| PDMS | Facile lithography | 2.5 cm s−1/5/80% | 5.66 | 16 |
| PAN substrate | Chemical modification and surface coating | 0.1 L min−1/20/80% | 4.45 | 17 |
| Black silicon, hydroxy-terminated polydimethylsiloxane | Etching and coating | NGa/5/NGa | 0.35 | 21 |
| SHB–SHL fabric | Textile weaving | ∼300 mL h−1/20/90% | 1.43 | 22 |
| PET film | Surface oxidation | 50 cm s−1/10/65 ± 5% | 0.46 | 23 |
| Al sheet | Water bath and spray coating | 40 cm s−1/16/75 ± 5% | 0.45 | 24 |
| 3D fiber network | In situ synthesis | 75 cm3 s−1/NGa/90% | 3.60 | 25 |
| Patterned Zn plate | Extrusion forming, surface treatment | 25 cm s−1/6/65% | 2.09 | 26 |
| Resin | 3D printing | NGa/NGa/75% | 1.09 | 27 |
| Copper sheet | Laser structuring | 25–30 cm s−1/5/90% | 0.56 | 28 |
Injection compression molding (ICM) is usually used to fabricate micro- and nano-structured polymer surfaces, and has advantages of mass production and short cycle time, and is especially fit for preparing complex devices. In this work, a promising ICM process is used to rapidly prepare nanowire arrays with high aspect ratios from nickel templates, resulting in superhydrophobic polypropylene (PP) surfaces. The structure, static wettability and dynamic wettability of the as-prepared PP replicas were investigated. The feasibility and effectiveness of this structure in the field of fog collection were explored through an investigation of the static and dynamic wetting properties on the surface, demonstrating the potential application of the prepared superhydrophobic PP replica surface in solving water resource problems and providing a scientific basis for the application of water resource management in arid and semi-arid regions.
Experimental
Materials and equipment
Commercial PP (grade CJS700, China Petrochemical Co. Ltd) was used as a material for molding the replicas in the ICM process. The equipment used in the ICM process comprised an 80-ton injection molding machine (KM80SP180CX, Krauss-Maffei, Germany) and an injection compression mold equipped with a temperature controller.Preparation of PP replicas with nanowires
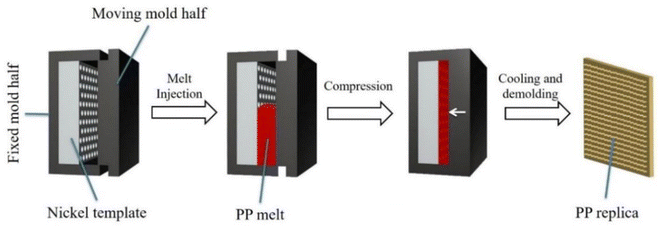
The preparation process of the PP replicas is shown in Fig. 1. Firstly, a silicon (Si) wafer substrate was prepared by chemical etching. Then a nickel (Ni) template with a micro-/nano-structure surface with a thickness of ∼220 μm was formed on the etched Si wafer by electroless plating and electroplating processes (for details, see ESI S1†). Then the fabricated Ni template was mounted on the surface of a fixed mold (as shown in Fig. 1), and the mold cavity was partially filled with molten PP. The mold was then compressed to complete the melt filling. After cooling and demolding, the PP replica was obtained. In addition, the Ni template is reusable. For comparison, PP counterparts with a smooth surface were molded under the same molding parameters without an Ni template. ICM was performed with the following parameters: (i) melt temperature of 230 °C, (ii) compression force of 280 kN, (iii) mold temperature of 95 °C, and (iv) cooling time of 50 s.Characterization
The surface morphologies of the replicas were observed by scanning electron microscopy (SEM; Phenom Nano, Phenom Scientific, The Netherlands) at an accelerating voltage of 10 kV. The 3D surface morphology of the PP replica was obtained by confocal microscopy (VK-X150K, KEYENCE, Japan). The heights and diameters of the nanowires on the PP replica surface were quantitatively analyzed with Nanomeasure Analysis software (Version 1.6). The contact angle (CA) and rolling angle (RA) of a water droplet (with a volume of 4 μL) on the replica surfaces were measured with an optical contact angle meter (OCA40, Data Physics Corporation, Germany). The CAs and RAs at five different locations on the replica surfaces were obtained and the average values were calculated. Contact angle hysteresis (CAH) was measured (only for the PP replica) by increasing the volume of a demineralized water droplet from 4 to 8 μL and decreasing it from 8 to 4 μL at a rate of 0.5 μL s−1. The delay time was 0.5 s. All the measurements were taken at room temperature (25 °C). The CA test was repeated 3 times. The advancing and receding CAs for the PP counterpart were not measured, as the RA was >90° and the droplets did not roll off the surface, even when the surface was inverted.Droplet impact test
The droplet impact test devices mainly include a precision syringe pump, a high-speed camera (TS5, Fastec Imaging Co. USA) and an LED lamp (for details, see ESI S2†). The high-speed camera records the impact processes of the droplets at 1250 fps. A water droplet with an initial diameter of ∼3.0 mm was released from a syringe at different heights to obtain different droplet impact velocities (0.71–1.87 m s−1). Droplet impact tests were conducted at room temperature of 25 ± 1 °C with a relative humidity of 60–70% to evaluate the dynamic wettability on the replicas. The impact droplet tests were repeated 3 times for each falling height, and the total number of tests was performed 500 times. The sizes of the droplets during the impact were quantitatively analyzed using Nanomeasure Analysis software (Version 1.6).Droplet transfer test
A droplet transfer test was performed by placing a water droplet on the PP replica surface. Filter paper was moved down toward the water droplet until it made contact with the droplet. Then the transfer of the droplet from the surface to the filter paper was observed. The camera used for these tests was the same as that used for the droplet impact. The test was repeated 3 times.Fog water harvesting and ice adhesion test
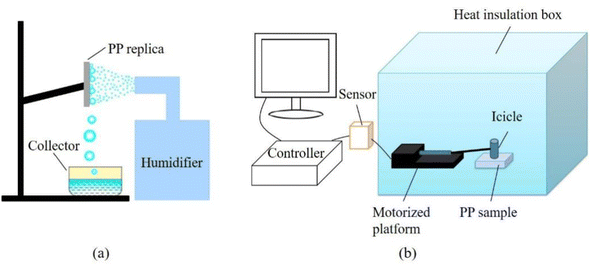
A fog water harvesting device (Fig. 2a) was used to analyze the water harvesting performance of the PP replica. The PP replica was vertically fixed on the support with the nanowires facing the humidifier. The humidifier was used to generate a spray at a 5 cm distance from the PP replica at a flow rate of 0.5 mL s−1. The tests were conducted at a temperature of 25 °C with a relative humidity of 90% to evaluate the water harvesting performance on the replicas. In total, 4.0 g of water was collected, and the collection time was recorded for every 0.2 g increase. The test of fog water harvesting was repeated 3 times. The water harvesting efficiency is defined as the mass of water collected per unit area per unit time:
 | (1) |
Fig. 2b shows a schematic diagram for the ice adhesion test. The PP sample was fixed on a platform in an incubator with a relative humidity of 40%. Measurements were taken at −5 °C, −10 °C, −15 °C and −20 °C, respectively. After the temperature stabilized, a fluorosilane-treated glass column with an 11.8 mm inner diameter was placed on the surface of the sample. Deionized water (1 mL) was injected into the glass column. When the water was completely frozen, an icicle was formed in 2 h. A string was used to connect the sensor and icicle, and no stress was applied on the icicle before the measurement. The icicle was pulled by moving the tension sensor to separate it from the surface of the PP sample to measure the ice adhesion strength. Three different locations on the PP sample were selected for the measurements, and the average values were calculated. The test was repeated 3 times.
Results and discussion
Morphology and structure of replica surfaces
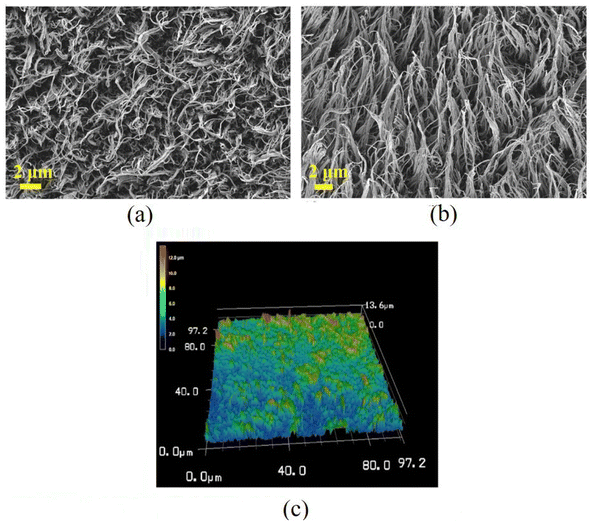
The surface morphology of the PP replica prepared by the ICM process was observed with SEM and confocal microscopy, and the results are shown in Fig. 3. Fig. 3a and b show the surface and oblique view (45°) SEM images of the PP replica. Fig. 3c shows the 3D morphology of the nanowires on the PP replica surface. It is found that the nanowires on the PP replica surface have sharp tips and display a nonuniform distribution and a flexural nature, with their tips mostly intertwined. The average diameter, height and aspect ratio are 145 nm, 9.6 μm and 66, respectively. Although the PP replica displays patterns similar to the Ni template, there are significant differences (the morphology of the Ni template is shown in ESI S1†). The nanowires on the PP replica are flexural and have intertwined tips, unlike the morphology on the Ni template surface. The reasons for the deformation of the nanowires may be as follows. Firstly, the gaps on the Ni template surface are filled with PP melt, and PP is stretched due to its good strength and ductility during the demolding.29 Secondly, these nanowires are softened and bent during the electron beam bombardment during SEM characterization.Static wettability on PP surfaces
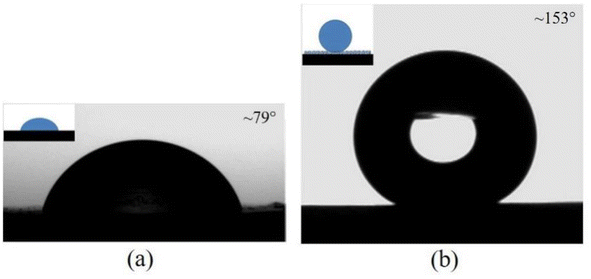
It is accepted that both CAs and RAs are significantly influenced by surface structures,30 and the wettability of the PP counterpart and replica surfaces were examined, as illustrated in Fig. 4. The CA and RA of a water droplet on the PP counterpart are ∼79° and >90°, respectively, while on the PP replica surface they are ∼152° and ∼3°, respectively. In addition, the CAs of the water droplet on the PP replica surfaces obtained after using the mold 50 times remained essentially unchanged. The details of the droplets rolling on the PP replica surface are shown in ESI Video S1.† The advancing and receding CAs for the PP replica are ∼157° and ∼152°, respectively. The water droplet wets and adheres to the PP counterpart surface, while the water droplet forms a spherical shape and easily rolls off the PP replica surface. A CAH of 5° and RA of ∼3° are observed for the PP replica surface, indicating the poor adhesion of the droplet to the PP replica surface. That is, the PP replica surface exhibits good superhydrophobicity and low adhesion.An ethanol–water solution is used to identify the influence of surface tension on the static wettability of the PP surface. The surface tension of the solution can easily be tuned by changing the ethanol concentration.31,32 The relationship between the CA, surface tension and ethanol concentration for the PP counterpart and replica are shown in Fig. 5. An increase in the concentration of ethanol from 0 to 50 wt% is accompanied by a decrease in the surface tension from 72.0 to 28.0 mN m−1. As shown in Fig. 5a, the CAs of an aqueous alcohol droplet on the PP counterpart surface decrease from 79° to 42° with the increase in ethanol concentration, and aqueous alcohol droplet cannot roll off the PP counterpart surface. In contrast, the CAs of an aqueous alcohol droplet on the PP replica (Fig. 5b) decrease drastically from 153° to 45°, and the shape of an aqueous alcohol droplet on the replica surface has changed from spherical to hemispherical. These results indicate that the wetting state of an aqueous alcohol droplet on the PP replica surface changes significantly. It can be concluded that the surface tension of the droplet has an obvious effect on the wetting behavior of the surface, and liquid with a lower surface tension obviously shows smaller CA and higher adhesion on the surface.
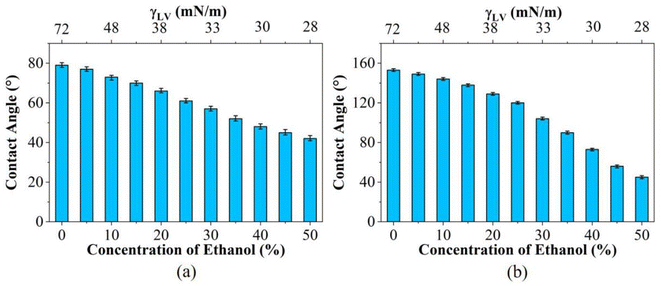 | ||
| Fig. 5 Contact angle of an aqueous alcohol droplet with different concentration on the PP (a) counterpart and (b) replica surfaces. | ||
It can be observed that liquid droplets with different surface tensions have different CA values on the PP surface. This is due to the difference in the interaction between the liquid droplets and the PP surface, leading to different wetting behaviors of liquid droplets on solid surfaces. When the surface tension of a liquid droplet is higher, the CA is also larger. A high CA indicates that the liquid droplet does not easily wet the solid surface and has a low affinity with the solid surface, and vice versa. Understanding the different CAs of liquid droplets with different surface tensions on the PP surface reveals the interaction between a liquid droplet and the PP surface, providing important information for controlling and optimizing the behavior of liquid on solid surfaces to a certain extent.
Fig. 6 shows snapshots of the water droplet transfer test for the PP replica (for details, see ESI Video S2†). Upon contact with the filter paper, the water droplet (∼3.0 mm in diameter) detaches from the PP replica surface and adheres to the filter paper. No residual droplets are observed. The experimental phenomena indicate that complete transfer occurs with no volume loss. This is consistent with the results of the high CA and low RA of a water droplet on the PP replica surface. No water droplet transfer test for the PP counterpart was performed, since the water droplets cannot detach from the surface, even after the counterpart is inverted.
Durability in harsh conditions for the PP replica surface
Durability in harsh conditions was tested by examining the change in contact angles of a water droplet on the PP replica surface after immersion in solutions with various pH values (pH: 1–13) for 12 h. After washing and drying, the contact angles of a water droplet on the PP replica surface were measured. The results are shown in Fig. 7. It can be observed that the contact angle on the PP replica surface remained at a high value after exposure to solutions with different pH values, still exhibiting excellent hydrophobic properties. These results indicate that the nanostructures on the PP replica surface exhibit excellent chemical stability.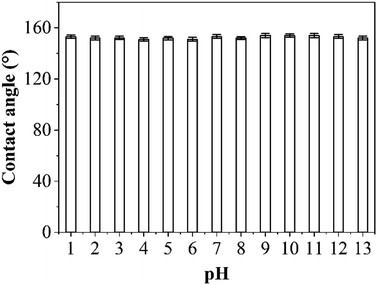 | ||
| Fig. 7 CA variation of a water droplet on the PP replica surface after immersion in solutions with different pH values. | ||
Physical durability for the PP replica surface
Physical durability was tested by examining the change in contact angles of a water droplet on the PP replica surface after an adhesive tape peeling test and a sandpaper abrasion test. For the adhesive tape peeling test, pressure was applied to the replicas with adhesive tape, followed by a tearing action. The tape was replaced with a fresh one after every set of 10 peeling cycles. For the sandpaper abrasion test, the PP replica was placed on sandpaper (500#), and a certain force (e.g., 100 g) was applied to the replica, and it was moved horizontally and uniformly at a velocity of 0.05 m s−1. Each movement of 10 cm constitutes one cycle, and the data was recorded at each cycle. The test consisted of a total of 25 cycles. The results of the test on the PP replica surface are shown in Fig. 8. As shown in Fig. 8a, it was found that the PP replica surface still showed a high CA even after multiple taping and tearing processes. This experimental result indicates that the nanostructure on the surface was not significantly damaged by adhesion and tearing of the tape, and its hydrophobic properties were maintained. As shown in Fig. 8b, in the sandpaper abrasion test, a high contact angle was maintained on the PP replica surface even though the surface experienced different degrees of abrasion. These results collectively indicate that the PP replica surface shows good anti-wetting properties, not only in terms of initial hydrophobicity, but also with persistent hydrophobicity after the application of external forces and abrasion.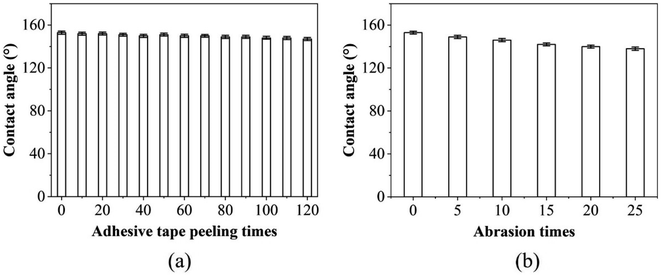 | ||
| Fig. 8 CA variations of the replica surfaces after (a) the adhesive tape peeling test and (b) sandpaper abrasion. | ||
Droplet impact on the PP replica surfaces
A droplet impact test can be used to investigate the non-wettability of a superhydrophobic surface.33 The dynamic behaviors of a water droplet on surfaces can be revealed by observing and analyzing its impacting process. Fig. 9 presents typical snapshots of a water droplet (∼3.0 mm in diameter) impacting on the horizontally placed PP counterpart and replica surfaces at different impact velocities (for a sample test, see ESI Videos S3 and S4†). As can be seen in Fig. 9a, when impacting on the PP counterpart surface at a low impact velocity (0.71 m s−1), the droplet spreads rapidly, and reaches a maximum spreading diameter (Dmax) at ∼4.0 ms. Then the droplet retracts. Finally, the water droplet is pinned on the counterpart surface and cannot rebound from the surface even after the counterpart is inverted. As the impact velocity increases from 0.71 to 1.87 m s−1, the rim of the droplet becomes thinner when the droplet reaches its maximum spreading diameter. These results mean that the droplets can be captured on the PP counterpart surface, which may result in surface contamination and droplet freezing in practical applications.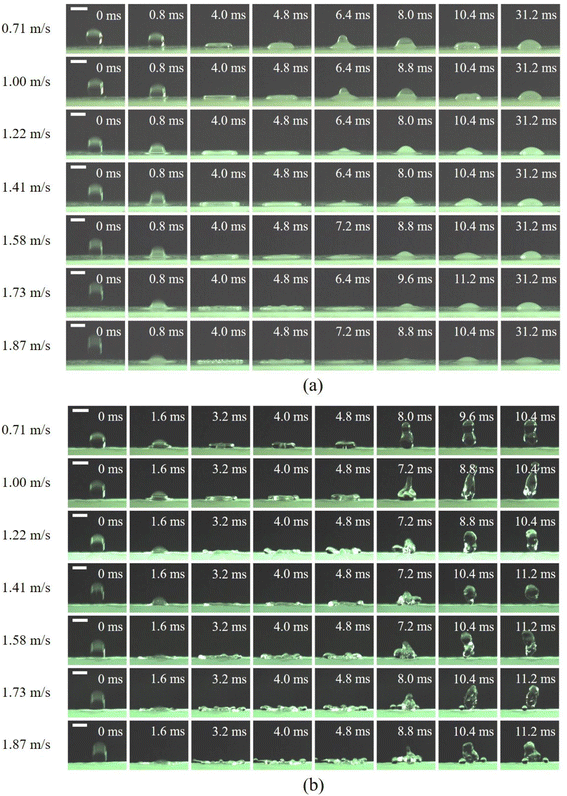 | ||
| Fig. 9 Typical snapshots of droplets with different velocities impacting on the PP (a) counterpart and (b) replica surfaces at room temperature (scale bar: 3 mm). | ||
For the PP replica surface (Fig. 9b), the droplet impacting on the replica surface exhibits obviously different dynamic behavior from that on the PP counterpart surface. At a low impact velocity (0.71 m s−1), the droplet spreads and develops into a pyramidal shape at ∼1.6 ms and continues to spread. At ∼3.2 ms, the water droplet becomes flat and reaches its Dmax. Then the droplet begins to retract due to surface tension, and a ring is formed with a cylindrical cavity in the center at ∼4.0 ms. The top of the droplet retracts faster than the bottom, and the air within the cavity is squeezed out to form a residual cavity at ∼4.8 ms. Thereafter, the contact diameter of the droplet on the replica surface continues to decrease, and the droplet finally rebounds completely from the surface in ∼9.6 ms. At higher impact velocities (from 1.00 to 1.87 m s−1), the thickness of the droplet rim decreases with increasing impact velocity at the spreading stage. The difference from the process of the droplet impact at the low velocity (0.71 m s−1) is that some small satellite droplets are separated from the edge of the droplet lamella at the end of the spreading stage, and the main droplet can collect satellite droplets and take them off the surface. When the impact velocity increases to 1.87 m s−1, some of the satellite droplets can rebound from the surface with the main droplet, and others are left on the replica surface. A similar phenomenon was also observed on a PP surface with lotus-leaf-like dual-scale micro-/nanostructures.29 These results suggest that the PP replica surface shows superior anti-wetting performance to that of the counterpart, and that usage of the PP replica can facilitate separation of the droplet and reduce the possibility of freezing. Therefore, it is concluded that the PP replica is a promising candidate for fog water harvesting.
Fig. 10 shows the spreading factor (D/D0, the ratio of wetting area diameter D to initial droplet diameter D0) of a droplet impacting onto the PP counterpart and replica surfaces versus time curves. The spreading factor reflects the deformation ability of the droplet during impact, and plays an important role in understanding the dynamic behavior of the solid–liquid interaction. As can be seen in Fig. 10a, the D/D0 first increases rapidly, reaches a maximum value at ∼4.0 ms, and finally decreases until it becomes constant in the case of the PP counterpart surface. This indicates that the droplet stabilizes on the PP counterpart surface. As the droplet impact velocity increases, the Dmax/D0 increases and reaches a maximum at almost the same time (∼4.0 ms), which means that the impact velocity only affects the value of Dmax. This indicates that the impact velocity has an effect on the maximum spreading degree of the droplets. As can be seen in Fig. 10b, the value of D/D0 increases at first and then begins to decrease after reaching its maximum value. This means that the droplets first spread and then retract during the impact process (Fig. 9b). It is worth noting that spreading is faster than retraction, which may be due to the fact that the droplet is subjected to a higher force during impact, causing it to spread more easily. Rebounding is indicated by the zero value of D/D0. The contact time of the droplet at a higher velocity is slightly higher than that at the lowest velocity. Notably, the evolution of D/D0 depends on the impact velocity. The slope of D/D0 increases with increasing impact velocity. Above all, the spreading factor of a droplet impacting an object is an important parameter, which reflects the deformation ability of the droplet during the impact process. By observing the change in D/D0 with time, the spreading and retracting of the droplet and the effect of impact velocity can be understood. This is important for understanding the dynamic behavior of solid–liquid interaction.
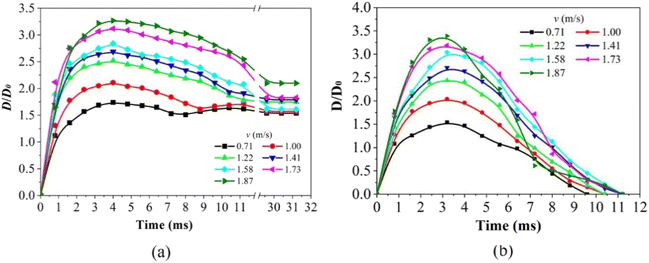 | ||
| Fig. 10 Time evolution of spreading factor (D/D0) of a droplet impacting on the PP (a) counterpart and (b) replica surfaces at different impact velocities. | ||
Ice adhesion on the PP replica surfaces
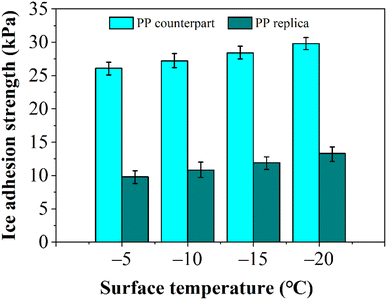
When fog encounters a surface at lower temperatures, thermal transfer prompts consideration of ice accretion and adhesion. The ice adhesion strength is a key parameter for evaluating the anti-icing performance of fog water harvesting devices for use in subzero temperature conditions. Fig. 11 shows the ice adhesion strengths of the PP counterpart and replica surfaces at various temperatures. The water droplet exhibits a much lower ice adhesion strength on the PP replica (13.3 kPa at −20 °C) than that on the PP counterpart (29.6 kPa at −20 °C). The lower ice adhesion performance indicates that the force between the frozen droplet and the PP replica surface is weaker, making it easier for the droplet to detach from the PP replica surface and effectively reducing the possibility of the droplet freezing on the PP replica surface. In addition, a surface with low ice adhesion can reduce damage caused by freezing, and extend the maintenance cycle and service life of the PP replica. It is found that the ice adhesion strength on the PP replica surface began to increase after 25 measurements, which indicates that damage to the nanostructures on the surface is beginning to occur. It is noted that the ice adhesion strength increases when the surface temperature of the PP sample decreases from −5 °C to −20 °C, which may be attributed to the increase in the number of anchor points and the nucleation and growth of ice crystals.34,35 In addition, the nanowires on the PP replica surface facilitate the suspension of water droplets at the top rather than allowing them to infiltrate, which can reduce the solid–liquid contact area and result in lower ice adhesion strength. When the temperature decreases, the low-temperature brittleness of PP causes the nanowires on the surface to become more susceptible to fracturing. This increased fragility decreases the heights of the nanowires, allowing droplets to infiltrate the spaces between the nanowires, thereby enhancing the ice adhesion strength of the replica surface.Fog water harvesting on the PP replica surface
Surface wettability plays a crucial role in fog collection, and it is directly related to the interaction and adhesion characteristics between fog droplets and the surface. The water droplets on superhydrophobic surfaces have high mobility, facilitating their rapid deposition into a water collection device. During the fog collection process, collision between droplets and the surface is the initial stage of fog collection. A droplet can quickly bounce up and be removed from the surface after impact, improving the fog collection capability of the surface to some extent. The fog water harvesting properties of the PP replica surface were investigated (for a sample test, see ESI Video S5†), and the results are presented in Fig. 12.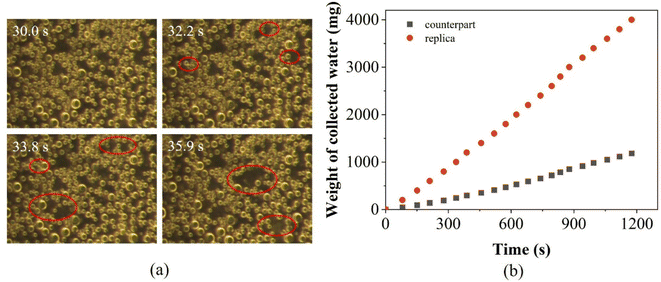 | ||
| Fig. 12 (a) The fog capture process on the PP replica surface and (b) the relationship between weight and collection time. | ||
Fig. 12a shows the fog capture process of the PP replica surface: when the fog comes into contact with the PP replica surface, the fog initiates a slow nucleation process and gradually condenses into small droplets on the replica surface. As the fog collection progresses, the small droplets start to accumulate and merge into one large droplet, resulting in a decrease in the density of small droplets. Once the droplets reach a critical size, they separate from the replica surface under gravity. Over an extended period, the volume and size range of the droplets captured on the replica surface gradually increase. Some smaller droplets remain adhered to the replica surface for subsequent nucleation and accumulation. In addition, the low adhesion of the replica surface can also facilitate the release of water droplets (see the section on the static wetting performance test). The nanowires on the PP replica surface not only endow it with superhydrophobicity but also provides sufficient nucleation sites for minuscule water droplets, contributing to an enhancement in fog collection efficiency.
The relationship between weight and collection time was established for water collection, and the results are shown in Fig. 12b. As can be seen in Fig. 12b, the replica surface shows higher water collection performance, and the efficiency is found to be ∼7.26 g m−2 s−1. Compared with the counterpart PP surface, which has a fog water harvesting efficiency of only ∼2.15 g m−2 s−1, the efficiency of the replica surface is ∼3.38 times that of the counterpart surface. This indicates that the prepared nanowires on the replica surface can effectively improve fog collection efficiency.
Uddin et al.36 reported TiO2-coated polyacrylonitrile (PAN) and polymethyl methacrylate (PMMA) polymer nanocomposite fiber mats for atmospheric fog water harvesting. These nanocomposites demonstrated the feasibility of fresh water production with a daily water productivity of more than 1.49 L m−2. Nioras et al.37 fabricated a series of surfaces with different surface wetting properties, and evaluated their ability in fog collection. Their results for fog collection show good performance for the superhydrophobic surfaces (1171 mg cm−2 h−1). In summary, these results demonstrate that the formation of a nanostructure on the surface is responsible for the good water collection performance.
A fog collection experiment was conducted for ∼30 min per session, and to ensure the accuracy and consistency of the results, three separate repeated experiments were carried out. This cumulative approach resulted in a total fog collection time of ∼100 min. The experimental data clearly indicate that the surface exhibits good fog collection ability, suggesting potential applications in water harvesting and environmental conservation efforts. Additionally, the change in contact angle on the replica surface after 6 h of droplet impact was tested, and the results are shown in ESI S3.† The results revealed that the surface maintained a high contact angle, indicating that the surface material exhibits good stability in water collection applications, and is suitable for use in water collection systems that require long-term stable operation.
The wetting properties of the PP counterpart and replica are compared in Table 2. From Table 2 and the snapshots of the water droplet impacting on the surface (Fig. 9), it is inferred that the PP counterpart is in the Wenzel state, in which water droplets would impregnate the surface and would not roll off. In contrast, the PP replica is in the Cassie–Baxter state, in which water droplets would be suspended on the top of the surface with air trapped underneath. According to the Cassie wetting model, CA is represented by:38
cos![[thin space (1/6-em)]](https://www.rsc.org/images/entities/char_2009.gif) θ = fS θ = fS![[thin space (1/6-em)]](https://www.rsc.org/images/entities/char_2009.gif) cos cos![[thin space (1/6-em)]](https://www.rsc.org/images/entities/char_2009.gif) θS + fG θS + fG![[thin space (1/6-em)]](https://www.rsc.org/images/entities/char_2009.gif) cos cos![[thin space (1/6-em)]](https://www.rsc.org/images/entities/char_2009.gif) θG θG
| (2) |
cos![[thin space (1/6-em)]](https://www.rsc.org/images/entities/char_2009.gif) θ = fS θ = fS![[thin space (1/6-em)]](https://www.rsc.org/images/entities/char_2009.gif) cos cos![[thin space (1/6-em)]](https://www.rsc.org/images/entities/char_2009.gif) θS + fS − 1 θS + fS − 1
| (3) |
| Contact angle (°) | Rolling angle (°) | Advancing angle (°) | Receding angle (°) | Water harvesting efficiency [g m−2 s−1] | Ice adhesion strength (kPa) (−20 °C) | |
|---|---|---|---|---|---|---|
| PP counterpart | 79 ± 2 | >90 | — | — | 2.15 | 29.6 |
| PP replica | 153 ± 2 | 3 ± 2 | 157 | 152 | 7.26 | 13.3 |
For the PP replica and counterpart surfaces, the contact angles of the droplets are 153° and 79°, respectively. According to eqn (3), the calculated value of fs is 0.092. In addition, by analyzing the SEM images of the PP replica, it can be concluded that the value of fS is 0.088 in the case of the PP replica. This verifies that the PP replica is in the Cassie–Baxter state. Therefore, air pockets would form in the nanowires, resulting in a reduction in contact area between the water droplet and the surface. This would lead to low adhesion strength and facilitate the rolling-off of the droplet from the surface. Furthermore, droplet impact experiments have demonstrated that the PP replicas exhibit superhydrophobicity, and the droplets rebound immediately without adhesion. And the PP replica surface is found to maintain a Cassie–Baxter wetting state, which diminishes droplet adhesion to the replica surface and facilitates accelerated droplet roll-off, thereby enhancing fog collection performance to a certain extent. The PP replica surface exhibits good fog water harvesting efficiency (∼7.26 g m−2 s−1) and the Cassie–Baxter state is consistent with the lower ice adhesion strength value of 13.3 kPa on the PP replica surface. All these results indicate that the nanowires on the PP replica surface play an important role in maintaining superhydrophobic characteristics and reducing ice adhesion.
Conclusions
In this work, PP replicas with high-aspect-ratio nanowires on the surfaces were fabricated based on the ICM process. The morphology of the PP replica surface shows that these nanowires with sharp tips are densely arranged on the surface and that their tips are mostly intertwined with each other. Complete transfer of a water droplet with no volume loss is observed in the case of the PP replica. The PP replica surface shows a higher CA and lower RA compared to those of the PP counterpart. Water droplet can rebound from the PP replica surface indicates that the PP replica surface is superhydrophobic and shows poor adhesion. In addition, the PP replica surface exhibits good fog water harvesting efficiency (∼7.26 g m−2 s−1) and low ice adhesion strength (13.3 kPa at −20 °C). All the results show that the PP replica surface is superhydrophobic and could be a potential candidate for water harvesting.Data availability
The data supporting this article have been included as part of the ESI.†Conflicts of interest
The authors declare that they have no known competing financial interests or personal relationships that could have appeared to influence the work reported in this paper.Acknowledgements
The experiments in this work were carried out in the Guangdong Provincial Key Laboratory of Technique and Equipment for Macromolecular Advanced Manufacturing. The author is grateful to Han-Xiong Huang for providing all necessary guidance to carry out this work. The author would also like to sincerely thank Wei Yuan, Guo Jiang, and Xiao-Qing Zhang for their help.References
- C. H. Wang, J. M. Li, F. M. Zhang and K. Yang, Clim. Dyn., 2023, 61, 543–557 CrossRef.
- A. Tiwari, M. K. Rathod and A. Kumar, Environ. Dev. Sustainability, 2022, 25, 1052–1083 CrossRef.
- Y. H. Lin, X. J. Zhao, Q. Jin, Y. Chen, W. T. Yang, Q. H. Pan, Y. Chen and F. X. Wang, J. Porous Mater., 2023, 30, 767–774 CrossRef.
- W. Chen and Z. G. Guo, Nanoscale, 2019, 11, 15448–15463 RSC.
- C. Li, Y. F. Liu, C. L. Gao, X. Li, Y. Xing and Y. M. Zheng, ACS Appl. Mater. Interfaces, 2019, 11, 4507–4513 CrossRef.
- Y. H. Feng, R. Z. Wang and T. S. Ge, Adv. Sci., 2022, 9, 2204508 CrossRef.
- H. Jarimi, R. Powell and S. Riffa, Int. J. Low-Carbon Technol., 2020, 15, 253–276 CrossRef.
- L. Kundanati, N. G. Di Novo, G. Greco, S. Siboni, C. D. Volpe, A. Bagolini and N. M. Pugno, Phys. Fluids, 2022, 34, 012003 CrossRef.
- K. Wan, X. L. Gou and Z. G. Guo, J. Bionic Eng., 2021, 18, 501–533 CrossRef.
- H. F. El-Maghraby, A. Alhumaidi, M. A. Alnaqbi, M. Sherif, Y. L. Tai, F. Hassan and Y. E. Greish, ChemNanoMat, 2022, 8, e202200327 CrossRef.
- H. Y. Li, P. Mu, J. Li and Q. T. Wang, J. Mater. Chem. A, 2021, 9, 4167–4175 RSC.
- G. Y. Mei and Z. G. Guo, Adv. Mater. Interfaces, 2022, 9, 2102484 CrossRef CAS.
- W. X. He, L. L. Jin, X. J. Ma, X. Li, J. Li and X. W. Wang, Curr. Appl. Phys., 2023, 53, 126–131 CrossRef.
- B. Wang, X. C. Zhou, Z. G. Guo and W. M. Liu, Nano Today, 2021, 40, 101283 CrossRef.
- A. Balachandran, H. Parayilkalapurackal, S. Rajpoot and S. Lone, ACS Appl. Bio Mater., 2023, 6, 44–63 CrossRef PubMed.
- E. H. Foday, T. Sesay, Y. M. Baion, E. B. Koroma, A. Y. Jalloh, K. Kokofele and F. W. Baion, ACS Omega, 2022, 7, 43574–43581 CrossRef.
- Y. Guo, Y. Li, G. K. Zhao, Y. Zhang, G. Y. Pan, H. Yu, M. H. Zhao, G. Q. Tang and Y. Q. Liu, Langmuir, 2023, 39, 4642–4650 CrossRef PubMed.
- A. Shome, A. Das, A. Borbora, M. Dhar and U. Manna, Chem. Soc. Rev., 2022, 51, 5452–5497 RSC.
- J. L. Lu, C. V. Ngo, S. C. Singh, J. J. Yang, W. Xin, Z. Yu and C. L. Guo, Langmuir, 2019, 35, 3562–3567 CrossRef CAS PubMed.
- J. L. Yang, Y. Y. Song, X. Zhang, Z. Q. Zhang, G. G. Cheng, Y. Liu, G. J. Lv and J. N. Ding, RSC Adv., 2023, 13, 27839–27864 RSC.
- X. M. Dai, N. Sun, S. O. Nielsen, B. B. Stogin, J. Wang, S. K. Yang and T. S. Wong, Sci. Adv., 2018, 4, eaaq0919 CrossRef PubMed.
- Z. H. Yu, H. M. Zhang, J. Y. Huang, S. H. Li, S. N. Zhang, Y. Cheng, J. J. Mao, X. L. Dong, S. W. Gao, S. C. Wang, Z. Chen, Y. X. Jiang and Y. K. Lai, J. Mater. Sci. Technol., 2021, 61, 85 CrossRef CAS.
- J. B. Lin, X. H. Tan, T. L. Shi, Z. R. Tang and G. L. Liao, ACS Appl. Mater. Interfaces, 2018, 10, 44815 CrossRef CAS.
- Y. Cheng, S. N. Zhang, S. K. Liu, J. Y. Huang, Z. B. Zhang, X. D. Wang, Z. H. Yu, S. H. Li, Z. Chen, Y. Zhao, Y. K. Lai, X. M. Qian and C. F. Xiao, J. Cleaner Prod., 2021, 315, 127862 CrossRef CAS.
- C. Li, Y. F. Liu, C. L. Gao, X. Li, Y. Xing and Y. M. Zheng, ACS Appl. Mater. Interfaces, 2019, 11, 4507 CrossRef.
- H. Zhou, X. S. Jing, S. P. Li and Z. G. Guo, Chem. Eng. J., 2021, 417, 129215 CrossRef.
- L. Y. Liu, S. Y. Liu, M. Schelp and X. F. Chen, ACS Appl. Mater. Interfaces, 2021, 13, 29122–29129 CrossRef PubMed.
- J. Wang, S. Z. Yi, Z. L. Yang, Y. Chen, L. L. Jiang and C. P. Wong, ACS Appl. Mater. Interfaces, 2020, 12, 21080 CrossRef PubMed.
- H. X. Huang and X. Wang, Mater. Today Commun., 2019, 19, 487–494 CrossRef.
- H. P. Wang, M. J. He, H. Liu and Y. C. Guan, ACS Appl. Mater. Interfaces, 2019, 11, 25586–25594 CrossRef PubMed.
- G. Vázquez, E. Alvarez and J. M. Navaza, J. Chem. Eng. Data, 1995, 40, 611–614 CrossRef.
- S. Khosharay, S. Tourang and F. Tajfar, Fluid Phase Equilib., 2017, 454, 99–110 CrossRef.
- Z. F. Hu, F. Q. Chu, H. Shan, X. M. Wu, Z. C. Don and R. Z. Wang, Adv. Mater., 2024, 36, 2310177 CrossRef PubMed.
- S. Hatte, K. Kant and R. Pitchumani, Langmuir, 2023, 39, 11898–11909 CrossRef PubMed.
- X. F. Yue, W. D. Liu and Y. Wang, Int. J. Heat Mass Transfer, 2018, 126, 442–451 CrossRef.
- M. N. Uddin, F. J. Desai, M. M. Rahman and R. Asmatulu, Nanoscale Adv., 2020, 2, 4627–4638 RSC.
- D. Nioras, K. Ellinas, V. Constantoudis and E. Gogolides, ACS Appl. Mater. Interfaces, 2021, 13, 48322–48332 CrossRef PubMed.
- A. B. D. Cassie and S. Baxter, Trans. Faraday Soc., 1944, 40, 546–551 RSC.
Footnote |
| † Electronic supplementary information (ESI) available: The preparation of the Ni template, and surface SEM images of the etched Si wafer and Ni template, and the schematics of droplet impact. Video S1 shows the dynamic rolling process of a water droplet on the PP replica surface. Video S2 shows the water droplet transfer test on the PP replica surface. Video S3 shows droplets with different velocities impacting on the PP counterpart surface. Video S4 shows droplets with different velocities impacting on the PP replica surface. Video S5 shows fog water harvesting on the PP replica surface. See DOI: https://doi.org/10.1039/d4ra05074f |
| This journal is © The Royal Society of Chemistry 2024 |

