 Open Access Article
Detection of low-concentration heavy metal exploiting Tamm resonance in a porous TiO2 photonic crystal
Asmaa M. Elsayeda,
Ashour M. Ahmedbd,
Arafa H. Aly *ac,
M. F. Eissad and
M. T. Tammamd
aTH-PPM Group, Physics Department, Faculty of Science, Beni-Suef University, Beni-Suef 62514, Egypt. E-mail: arafaaly@aucegypt.edu; arafa.hussien@science.bsu.edu.eg
bPhysics Department, College of Science, Imam Mohammad Ibn Saud Islamic University (IMSIU), Riyadh 11623, Saudi Arabia
cDepartment of Technical Sciences, Western Caspian University, Baku 1001, Azerbaijan
dFaculty of Science, Beni-Suef University, Beni-Suef 62514, Egypt
First published on 19th August 2024
Abstract
The detection of heavy metal ions, particularly Hg2+, has gained significant attention due to their severe adverse effects on human health and ecosystems. Conventional methods for monitoring these metals in freshwater often suffer from limitations in sensitivity, accuracy, and cost-effectiveness. This work introduces a novel heavy metal sensor based on Tamm resonance within a one-dimensional (1D) porous TiO2 photonic crystal structure. The sensor design includes a prism, a silver (Ag) layer, a cavity, and a ternary multilayer porous TiO2 layer. Reflectance spectra are analyzed using the transfer matrix method. A key aspect of this study is the optimization of sensor performance, which involves adjusting the thicknesses of all layers and the porosity of the multilayer porous TiO2. This optimization strategy is critical for achieving high sensitivity. The results demonstrate that the optimized sensor exhibits a high sensitivity of 0.045 nm ppm−1 for Hg2+ solutions. This sensitivity arises from the effective integration of Tamm resonance with the properties of the porous TiO2 photonic crystal. The proposed structure shows great potential for applications in heavy metal sensing, especially for detecting Hg2+ ion contamination in drinking water with high sensitivity and accuracy. In addition to its high performance, the photonic crystal sensor offers extended lifetime, rapid measurement capabilities, cost-effectiveness, and potential for integration into compact devices, making it a promising solution for environmental monitoring and water quality assessment.
1. Introduction
Over the past few decades, water quality has significantly deteriorated worldwide due to population growth, quick growth in industrialization, expanding urbanization, and also unsustainable utilization of natural resources.1,2 Shockingly, an estimated 14![[thin space (1/6-em)]](https://www.rsc.org/images/entities/char_2009.gif) 000 individuals lose their lives each day due to causes related to water pollution.3 The contamination of water with heavy metals has significantly increased owing to rapid industrial, agricultural, and domestic practices.4,5
000 individuals lose their lives each day due to causes related to water pollution.3 The contamination of water with heavy metals has significantly increased owing to rapid industrial, agricultural, and domestic practices.4,5
Heavy metals include chromium, lead, cadmium, mercury, arsenic, nickel, and copper are dense metallic elements that pose a threat.6 Such heavy metals are not biodegradable and therefore tend to accumulate in living organisms through a process called bioaccumulation.7,8 Even at low concentrations, heavy metal ions can be carcinogenic to humans and can damage multiple organs. Exposure to mercury (Hg2+) ions can lead to a range of health effects and diseases.9,10 These include central nervous system defects, erethism, cardiomyopathy, lymphoproliferation, hyporeactivities, neurological issues, nephrological problems, immunological dysfunctions, motor impairments, and genetic disorders. Additionally, it can impact organs such as the brain, lungs, and immune system. Furthermore, mercury exposure has been linked to birth defects, impotency, and infertility.11 Therefore, the development of efficient technologies to detect heavy metals in water is crucial. Various spectroscopic techniques including X-ray fluorescence (XRF), atomic absorption (AAS), inductively coupled plasma mass spectrometry (ICP-MS), and inductively coupled plasma optical emission (ICP-OES) spectroscopies have been employed for this purpose.12–14 However, these spectroscopic techniques have limitations in terms of sensitivity, accuracy, cost, and ecological impact.15,16 On the other hand, electrochemical techniques provide alternative detection methods, including potentiometric, amperometric, voltammetric, coulometric, impedance, and electrochemiluminescent measurements. It is necessary to notice that electrochemical techniques may not be the most suitable choice when multiple metal cations are simultaneously present in a sample, as this can lead to reduced detection sensitivity.17
Optical technologies offer several benefits, including extended sensor lifetimes, rapid measurement capabilities, and cost-effectiveness.4,18 Among these technologies, photonic crystals (PCs) stand out as a revolutionary optical technology.19 PCs are composed of periodic structures that vary the refractive index of a material on the scale of the wavelength of light.20,21 This allows PCs to regulate the light behavior, similar to how semiconductors manipulate electrons. Photons passing through a photonic crystal experience frequency band gaps, which give rise to unique optical properties known as photonic bandgaps (PBGs).22–24 The presence of PBGs in photonic crystals enables precise control over the propagation. This control offers a range of advantages for sensor applications, including improved sensitivity, versatility, and integration into small, compact devices. These unique properties make PCs highly promising candidates for a wide range of sensor applications.25,26
Recently, sensor systems have increasingly utilized PCs for various applications.27 Lu et al.28 proposed the use of inverse opal polymeric photonic crystals (IOPPCs) with effective urease catalysis and pH-responsive characteristics. Their research achieved a minimum detectable concentration of 5 × 10⁻¹⁶ g L−1.28 Taha et al. also proposed a model of a PC consisting of gyroidal Ag and TiO2 for detecting Cu2+ and Mg2+ ions. This PC design achieved sensitivity values of 573.50 and 570.70 nm RIU−1, respectively.29 Additionally, Chou et al. presented a method for detecting heavy metal ions using PCs composed of polymer brushes, in conjunction with a reflective laser beam system, achieved a low detection limit of 10 μg L−1 for Cr(III).30 These studies demonstrate the promising potential of PCs in detecting low concentrations of contaminants in water.31
The one-dimensional photonic crystal (1DPC) constructed using multilayered porous TiO2 takes advantage of the optical characteristics of the porous TiO2 (PTO) layer. This renders it an exceptionally intriguing and versatile material for various applications. PTO possesses nanoscale dimensions and high surface area. They demonstrate remarkable chemical stability and corrosion resistance, making them biocompatible and non-toxic. One notable attribute of PTO has exceptional photocatalytic properties. They effectively harness light energy to facilitate chemical reactions, making them particularly valuable for applications in water treatment.32,33 Additionally, porous TiO2 photonic crystal (PTO-PC) can self-organize into ordered arrays, which proves advantageous for applications in photonics and optoelectronics. Furthermore, the synthesis of PTO nanotubes is relatively simple and cost-effective, making them easily accessible for research and potential large-scale applications.34,35
Tamm resonance has been successfully achieved in photonic crystals (PCs) for sensing techniques.36–38 The structure involves depositing plasmonic metals such as Ag onto the PC. Tamm resonance occurs at the interface between the Ag and PC materials, resulting in localized optical resonance. This resonance improves the interaction between the sensing environment molecules and incident light, allowing for the detection of small variations or low concentrations.39,40 Tamm sensor photonic crystals offer high sensitivity, a selective wavelength response, and an improved signal-to-noise ratio. They enable label-free detection, can be integrated with other optical components or systems, and reduce costs in the sensing process.
This work aims to explore the innovative application of Tamm sensor photonic crystals for detecting heavy metals, with a particular focus on mercury (Hg2+) ions in water. The proposed structure involves a prism/Ag/cavity/porous TiO2 photonic crystal (PTO-PC). The PTO-PC is composed of a ternary multilayer porous TiO2 (PTO) layer. The optimization of layer thicknesses and porosity in the multilayer PTO is carried out to achieve superior sensor performance.
2. Design of sensor
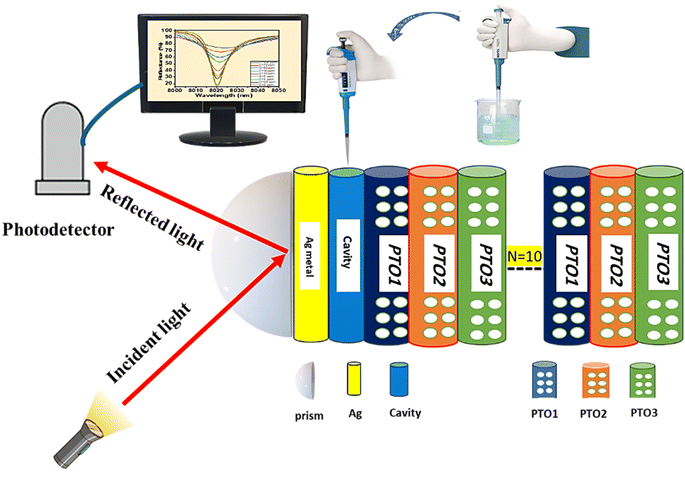
The PTO-PC sensor design utilizes a ternary PC structure composed of three multilayers of PTO material, denoted as PTO1, PTO2, and PTO3. These layers are repeated 10 times (N = 10) to enhance the interaction of light with the target sensing environment. The sensor is built on a prism with a refractive index of 1.4. A silver (Ag) layer is placed on a prism to enable plasmonic effects. Positioned above the Ag layer, a cavity layer acts as a confined reservoir, facilitating the introduction of polluted water containing Hg2+ heavy metal ions. The overall structure is represented as prism/Ag/cavity/[PTO1, PTO2, PTO3]N=10 as represented in Fig. 1.The refractive indices of different materials are determined using specific equations and models. The complex refractive index for various concentrations of mercury ion solutions was obtained from the referenced paper.41
For the silver film, the Debye–Drude dispersion model is employed to characterize its relative permittivity (ε) using the equation42,43
 | (1) |
![[thin space (1/6-em)]](https://www.rsc.org/images/entities/char_2009.gif) 913 × 1011 (rad s−1) is the plasma frequency and γ = 273.4494 × 10¹¹ (rad s−1) is the damping frequency.44 By taking the square root of ε, the refractive index (n) of silver can be obtained.
913 × 1011 (rad s−1) is the plasma frequency and γ = 273.4494 × 10¹¹ (rad s−1) is the damping frequency.44 By taking the square root of ε, the refractive index (n) of silver can be obtained.
The refractive index of the TiO2 layer varies with wavelength and is determined using the equation45
 | (2) |
The Bruggeman effective medium approximation (BEMA) equation is used for calculating the effective refractive index (neff) of the PTO layer. This equation takes into account the refractive indices of TiO2 (nTiO2) and the material filling the pores (nv), as well as the porosity ratio (P). The equation is given by46,47
 | (3) |
Indeed, solving the BEMA equation provides valuable insights into the optical characteristics of the PTO layer.
Photonic crystals based on multilayer porous TiO2 (PTO) layers can be fabricated using a conventional electrochemical anodizing method.48 Typically, the anodization process is conducted in an electrochemical cell with two electrodes under ambient conditions. A Pt electrode is used as the counter electrode, while high-purity Ti foil serves as the working electrode in an HF aqueous electrolyte. Periodic variations in the applied voltage lead to changes in porosity and the effective refractive index, resulting in porous TiO2 photonic crystals.49 The Ag layer can be deposited onto the prism using a magnetron sputtering system.50 The cavity is created by depositing a polymer such as benzocyclobutene (BCB) through spin coating on the Ag layer, followed by chemical etching.51
3. Theoretical model
The theoretical model employed in this study is built on the transfer matrix method (TMM).52 This method allows us to analyze the reflectance characteristics of a periodic structure consisting of a prism/Ag/cavity/PTO-PC. The PC comprises multilayers, denoted as [PTO1/PTO2/PTO3].10 By applying the TMM, the interaction between the incident light and the designed structure can be investigated. This interaction yields the overall optical characteristics of the structure, which can be derived using a subsequent matrix.18The total transfer matrix for the proposed structure can be computed using eqn (4)
 | (4) |
 | (5) |
 | (6) |
 | (7) |
 for air (0) and prism substrate (s)
The n0,s represents the refractive index of both air (0) and prism substrate (s), while θ0,s denotes the incident angle on the layer and substrate, respectively. Lastly, the reflectance (R) is determined as the magnitude squared of the reflectance coefficient
| R = |r2| | (8) |
4. Result and discussion
4.1 Reflectance spectra
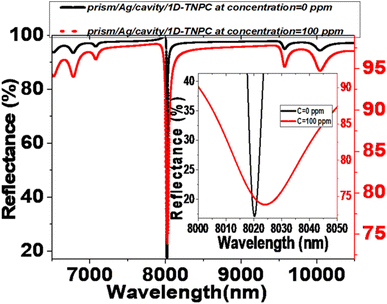
Fig. 2 represents the reflectance spectra of electromagnetic (EM) waves. The spectra are plotted against the incident wavelength for two configurations: prism/PTO-PC and prism/cavity/PTO-PC. In both configurations, the pore of PTO is filled with pure water (0 ppm). The PC structure comprises three layers: PTO1, PTO2, and PTO3. The thicknesses of these layers are specified as d1 = 850 nm, d2 = 700 nm, and d3 = 550 nm, respectively. The corresponding porosities of the layers are P1 = 20%, P2 = 87%, and P3 = 15%. The layer sequence is repeated ten times within the structure.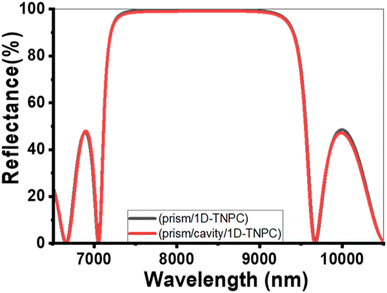 | ||
| Fig. 2 Reflectance spectra at 0 ppm (pores filled with pure water) for the (a) prism/PTO-PC and (b) prism/cavity/PTO-PC. | ||
In the prism/PTO-PC configuration, a photonic bandgap (PBG) is observed in the infrared (IR) spectrum, with a width of 2613.3 nm. The extensive width of the PBG is attributed to the significant difference in refractive indices between the layers of the structure. The PBG refers to a range of wavelengths in which the propagation of certain frequencies of light is forbidden within the structure. It arises as a result of the interference and scattering of light waves within the periodic layers of the photonic crystal. Additionally, the presence of ripples outside PBG can be attributed to the constructive and destructive interference effects within the PC structure. When a 12 μm-thick cavity layer is introduced in front of the existing PTO multilayer, the resulting configuration is known as prism/cavity/PTO-PC. The presence of the cavity layer does not affect the reflectance and does not provide an opportunity for resonance to occur. The primary function of the cavity layer is to accommodate the analyte within the structure.
The red shift observed in the reflectance spectra in the presence of Hg2+ ions is due to changes in the optical properties of the sensor's structure. As the concentration of Hg2+ ions increase, the refractive index of the sensing medium also increases. Hg2+ ions diffuse into the porous TiO2 layers and the cavity, raising the refractive indices of these components. This increase in refractive index alters the phase shift of the standing wave conditions within the sensor.54 As a result, the resonant defect mode shifts to longer wavelengths in accordance with the Bragg–Snell law.55,56
The sensor's sensitivity (S) has been determined by evaluating the relationship between the change in position of the Tamm resonance mode (ΔλT) and the corresponding variations in heavy metal concentrations (ΔC). It is calculated using the equation18
 | (9) |
From the data in Fig. 3,  .
.
4.2 Optimization of parameters
The proposed structure undergoes parameter adjustments to improve the sensitivity and overall performance of the sensor design. The optimization focuses on optimizing the porosities and thicknesses of all layers in the following sections. During the optimization process, the reflectivity is calculated as a function of the incidence wavelength to determine the Tamm mode position at two different concentrations (0 and 100 ppm) using eqn (8). Then, the shift in Tamm mode position corresponds is variations in heavy metal concentrations used to determine the sensitivity using eqn (9).![[thin space (1/6-em)]](https://www.rsc.org/images/entities/char_2009.gif) 000 nm. The structure parameters used are N = 10, P1 = 20%, P2 = 87%, P3 = 15%, dAg = 10 nm, d1 = 850 nm, d2 = 700 nm, and d3 = 550 nm.
000 nm. The structure parameters used are N = 10, P1 = 20%, P2 = 87%, P3 = 15%, dAg = 10 nm, d1 = 850 nm, d2 = 700 nm, and d3 = 550 nm.
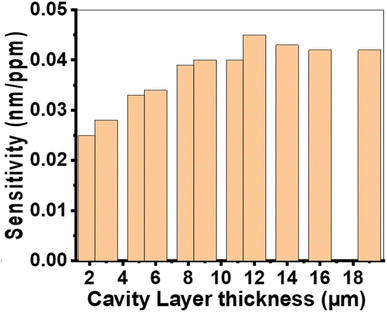 | ||
| Fig. 4 The sensitivity of the suggested sensor varies with the thickness of the cavity layer at N = 10, P1 = 20%, P2 = 87%, P3 = 15%, dAg = 10 nm, d1 = 850 nm, d2 = 700 nm, and d3 = 550 nm. | ||
The sensitivity value gradually increases and then decreases, as shown in Fig. 4. The maximum sensitivity of 0.045 nm RIU−1 is achieved when the cavity layer thickness is 12![[thin space (1/6-em)]](https://www.rsc.org/images/entities/char_2009.gif) 000 nm. Changes in the thickness of the cavity layer modify the path of the incident light, influencing optical interferences within the prism/Ag/cavity/PTO-PC structure. A very thin cavity layer fails to support constructive interference, resulting in weak plasmon resonance. Conversely, an excessively thick cavity layer dissipates the energy of the plasmon wave, reducing coupling. Therefore, the optimal cavity layer thickness for maximizing sensor sensitivity is determined to be 12
000 nm. Changes in the thickness of the cavity layer modify the path of the incident light, influencing optical interferences within the prism/Ag/cavity/PTO-PC structure. A very thin cavity layer fails to support constructive interference, resulting in weak plasmon resonance. Conversely, an excessively thick cavity layer dissipates the energy of the plasmon wave, reducing coupling. Therefore, the optimal cavity layer thickness for maximizing sensor sensitivity is determined to be 12![[thin space (1/6-em)]](https://www.rsc.org/images/entities/char_2009.gif) 000 nm.
000 nm.
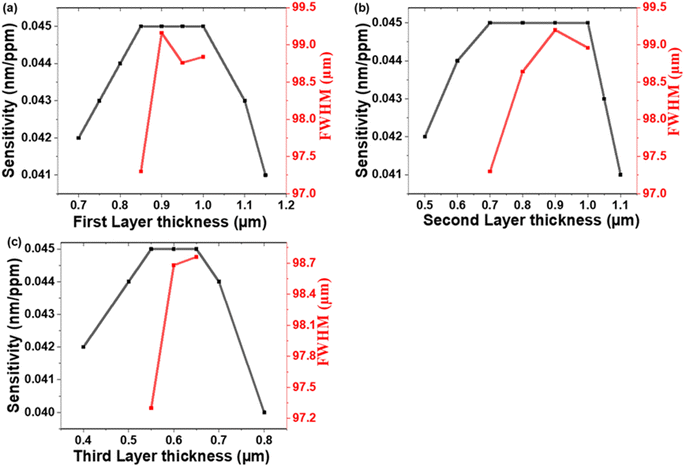
![[thin space (1/6-em)]](https://www.rsc.org/images/entities/char_2009.gif) 000 nm). The obtained results demonstrate that sensitivity increases as the thickness of the PTO layers is increased. It reaches a plateau and remains constant within a certain range of thickness values before gradually declining. This trend is visually depicted in Fig. 5. The incident light is a partial transmission and reflection of light at each interface between the PTO layers. This results in constructive or destructive interference within the structure. The presence of a cavity in the PC leads to the confinement of electromagnetic waves at the resonance frequency of the defect mode. The formation of this defect mode is influenced by light interference within the PC. Optimizing the thickness of the PTO layers is required to enhance light confinement in the cavity. If the cavity layer is either too thin or too thick, the localization of light becomes weak, leading to reduced sensitivity.57
000 nm). The obtained results demonstrate that sensitivity increases as the thickness of the PTO layers is increased. It reaches a plateau and remains constant within a certain range of thickness values before gradually declining. This trend is visually depicted in Fig. 5. The incident light is a partial transmission and reflection of light at each interface between the PTO layers. This results in constructive or destructive interference within the structure. The presence of a cavity in the PC leads to the confinement of electromagnetic waves at the resonance frequency of the defect mode. The formation of this defect mode is influenced by light interference within the PC. Optimizing the thickness of the PTO layers is required to enhance light confinement in the cavity. If the cavity layer is either too thin or too thick, the localization of light becomes weak, leading to reduced sensitivity.57
To evaluate the sensor's performance, the full width at half-maximum (FWHM) of the resonance mode is a crucial factor.58 A narrower FWHM corresponds to a sharper and more precise resonance, indicating higher resolution and better sensor performance. Therefore, minimizing the FWHM is essential for optimizing the sensor's sensitivity and accuracy.59 Fig. 5(a)–(c) presents the behavior of FWHM concerning the thicknesses of the PTO layers. Based on the observed low FWHM values, the optimal thicknesses for the PTO layers are determined as follows: d1 = 850 nm, d2 = 700 nm, and d3 = 550 nm. These specific thickness values are selected to achieve a narrow resonant dip and enhance the sensor's resolution.
![[thin space (1/6-em)]](https://www.rsc.org/images/entities/char_2009.gif) 000 nm.
000 nm.Fig. 6(a) illustrates the sensitivity behavior when the porosity of the first layer is changed from 20% to 60%. It can be observed that sensitivity gradually decreases with increasing porosity, indicating that the optimal porosity value for the first layer is 20%. Similarly, Fig. 6(b) depicts the sensitivity trend as the porosity of the second layer varied from 50% to 87%. It shows that sensitivity increases gradually with increasing porosity, suggesting that the optimal porosity value for the second layer is 87%. In Fig. 6(c), the porosity of the third layer is varied from 15% to 80%. The highest sensitivity is obtained at a porosity of 15% and then decreases beyond that point.
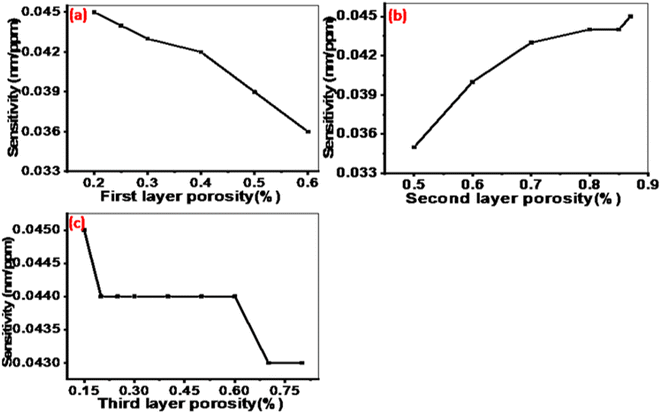 | ||
Fig. 6 The sensitivity of the designed sensor as a function of the porosities for layers (a) P1, (b) P2, and (c) P3 at N = 10, d1 = 850 nm, d2 = 700 nm, d3 = 550 nm, dAg = 10 nm, and dc = 12![[thin space (1/6-em)]](https://www.rsc.org/images/entities/char_2009.gif) 000 nm. 000 nm. | ||
The obtained results demonstrate that the sensitivity of the proposed sensor structure is influenced by the porosities of the PTO layers. The refractive index of the PTO layer is directly related to its porosity as described by eqn (3). This relationship allows for the estimation of changes in the average refractive behavior of the composite material as the proportion of voids within it varies.60 Specifically, as the porosity of the PTO layers increases, their effective refractive index decreases. This occurs because higher porosity introduces more voids, which reduces the overall density of the TiO2 material and thus lowers its refractive index. Optimizing the porosities of the PTO layers is crucial because it affects the phase shift of light interference within the sensor, as outlined in eqn (3) and (6). The phase shift influences the reflection spectrum of the sensor, which, in turn, affects its sensitivity. The optimal values for the porosities of the layers were determined to be P1 = 20%, P2 = 87%, and P3 = 15% as shown in Fig. 6.
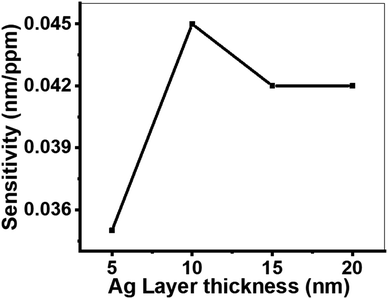
![[thin space (1/6-em)]](https://www.rsc.org/images/entities/char_2009.gif) 000 nm, d1 = 850 nm, d2 = 700 nm, and d3 = 550 nm. The highest sensitivity was observed at an Ag layer thickness of 10 nm. In contrast, thicknesses of 5, 15, and 20 nm resulted in lower sensitivity due to poor resonance and suboptimal sensor performance. A 10 nm Ag layer thickness allows for efficient coupling of light to the surface plasmons, yielding high sensitivity. When the Ag layer is too thin (e.g., 5 nm), the surface plasmons are poorly confined, leading to reduced sensitivity. Conversely, a thicker Ag layer (e.g., 15 or 20 nm) prevents effective light penetration, also resulting in low sensitivity.61,62
000 nm, d1 = 850 nm, d2 = 700 nm, and d3 = 550 nm. The highest sensitivity was observed at an Ag layer thickness of 10 nm. In contrast, thicknesses of 5, 15, and 20 nm resulted in lower sensitivity due to poor resonance and suboptimal sensor performance. A 10 nm Ag layer thickness allows for efficient coupling of light to the surface plasmons, yielding high sensitivity. When the Ag layer is too thin (e.g., 5 nm), the surface plasmons are poorly confined, leading to reduced sensitivity. Conversely, a thicker Ag layer (e.g., 15 or 20 nm) prevents effective light penetration, also resulting in low sensitivity.61,62
![[thin space (1/6-em)]](https://www.rsc.org/images/entities/char_2009.gif) 000 nm, d1 = 850 nm, d2 = 700 nm, and d3 = 550 nm. The sensor is designed to operate at room temperature, and small temperature changes do not significantly impact its sensitivity. This is due to the stability of the materials used in the sensor across a range of temperatures.
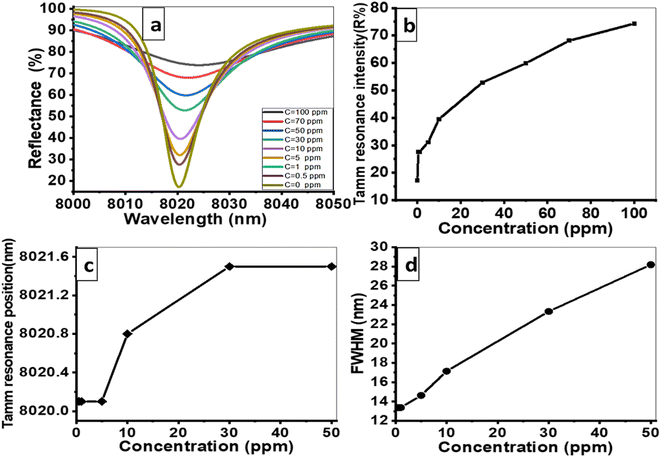
000 nm, d1 = 850 nm, d2 = 700 nm, and d3 = 550 nm. The sensor is designed to operate at room temperature, and small temperature changes do not significantly impact its sensitivity. This is due to the stability of the materials used in the sensor across a range of temperatures.Fig. 8(a) illustrates the change in the resonance mode shape and reflectance values as the concentration of Hg2+ metal ions increases from 0 ppm to 5, 10, 30, 50, 70, and 100 ppm, under the ideal conditions. The reflection peak flattens considerably with increasing Hg2+ ions concentration, indicating reduced diffraction. Fig. 8(b) demonstrates the resonance intensity as a function of Hg2+ ions concentration. The Tamm resonance intensity increases with the concentration, reaching a minimum value of 17.17 at 0 ppm and a maximum value of 74.34 at 100 ppm. Hence, the suggested sensor exhibits a strong response to varying concentrations of Hg2+ metal ions, highlighting its sensitivity. In Fig. 8(c), the spectral position of the Tamm dips shifts to higher wavelengths with increasing concentrations of Hg2+ metal ions. This shift is attributed to the alteration of the guided mode resonance as the Hg2+ ions concentration rises. These changes in the resonance peak position further emphasize the sensor's sensitivity to even small variations in the concentration of Hg2+ metal ions. Fig. 8(d) describes the relationship between the FWHM and the Hg2+ ions concentration. The FWHM tends to increase with the Hg2+ ions concentration due to the imaginary parts of the refractive index for Hg2+ ions.
Many parameters including sensitivity, quality factor (QF), and figure of merit (FoM) used to evaluate the performance of the proposed sensor.18 These parameters can be calculated using eqn (10) and (11). The values are presented in Table 1. From 0 to 100 ppm, the FoM increases from 4.08 × 10⁻³ to 9.19 × 10⁻⁴, while the QF decreases from 600.3 to 175.6.
| QF = λT/FWHM | (10) |
| FoM = S/FWHM | (11) |
| Hg2+ ions concentration (ppm) | FoM (ppm−1) | QF |
|---|---|---|
| 0 | — | 600.3 |
| 5 | — | 548.2 |
| 10 | 4.08 × 10⁻³ | 467.96 |
| 30 | 2.00 × 10⁻³ | 343.98 |
| 50 | 9.94 × 10⁻⁴ | 284.7 |
| 70 | 8.22 × 10⁻⁴ | 219.8 |
| 100 | 9.19 × 10⁻⁴ | 175.6 |
5. Conclusions
This study introduced a novel structure for sensing Hg2+ ions concentration utilizing a ternary one-dimensional photonic crystal. The sensor relies on the generation of Tamm resonance within a photonic crystal composed of Ag and porous TiO2 layers. The sensitivity of the sensor was determined to be 0.045 nm ppm−1. These promising results have inspired future research endeavors, focusing on the development of tailored photonic crystals as nanophotonic devices for heavy metal sensing applications.Data availability
The data that support the findings of this study are available from the corresponding author upon reasonable request.Conflicts of interest
There are no conflicts to declare.References
- K. H. Vardhan, P. S. Kumar and R. C. Panda, J. Mol. Liq., 2019, 290, 111197 CrossRef CAS.
- C. F. Carolin, P. S. Kumar, A. Saravanan, G. J. Joshiba and M. Naushad, J. Environ. Chem. Eng., 2017, 5, 2782–2799 CrossRef CAS.
- C. FN, M. MF and J. Ecosyst, Ecography, 2017, 7, 5–8 Search PubMed.
- A. H. M. Almawgani, J. Surve, T. Parmar, A. Armghan, K. Aliqab, G. A. Ali and S. K. Patel, Photonics, 2023, 10, 56 CrossRef CAS.
- L. Burratti, E. Sgreccia, F. Bertelà and F. Galiano, Chemosphere, 2024, 362, 142636 CrossRef CAS.
- Z. A. Alrowaili, H. Makhlouf Fathy, H. A. Elsayed, M. Aouassa, M. H. Mahmoud, K. S. El-Nasser, T. A. Taha and A. Mehaney, Ultrasonics, 2023, 130, 106928 CrossRef CAS.
- A. Kumar, M. Cabral-Pinto, A. Kumar, M. Kumar and P. A. Dinis, Appl. Sci., 2020, 10, 7078 CrossRef CAS.
- M. M. S. Cabral Pinto, M. M. V. Silva, E. A. Ferreira da Silva and A. P. Marinho-Reis, Geosci., 2017, 7, 78 CrossRef.
- Y. Pu, Z. Gu, T. F. H. Bovee, Y. Yang, Y. Ying, M. Li and X. Hong, Food Chem., 2024, 140354 CrossRef CAS PubMed.
- K. H. Kim, E. Kabir and S. A. Jahan, J. Hazard. Mater., 2016, 306, 376–385 CrossRef CAS PubMed.
- A. M. Elsayed, A. M. Ahmed, M. T. Tammam, M. F. Eissa and A. H. Aly, Sci. Rep., 2024, 141, 1–9 Search PubMed.
- L. A. Malik, A. Bashir, A. Qureashi and A. H. Pandith, Environ. Chem. Lett., 2019, 17, 1495–1521 CrossRef CAS.
- B. K. Bansod, T. Kumar, R. Thakur, S. Rana and I. Singh, Biosens. Bioelectron., 2017, 94, 443–455 CrossRef CAS.
- Y. Wang, X. Wang, J. Mu, H. Yu, X. Lv, T. Liang and C. Cheng, Chem. Eng. Sci., 2024, 299, 120473 CrossRef CAS.
- F. A. Sayed, H. A. Elsayed, M. Al-Dossari, M. F. Eissa, A. Mehaney and A. H. Aly, Sci. Rep., 2023, 13, 21793 CrossRef CAS.
- P. Kurup, C. Sullivan, R. Hannagan, S. Yu, H. Azimi, S. Robertson, D. Ryan, R. Nagarajan, T. Ponrathnam and G. Howe, Indian Geotech. J., 2017, 47, 421–436 CrossRef.
- Q. Chen, Y. Yao, X. Li, J. Lu, J. Zhou and Z. Huang, J. Water Process Eng., 2018, 26, 289–300 CrossRef.
- A. M. Elsayed, A. M. Ahmed and A. H. Aly, Appl. Opt., 2022, 61, 1668 CrossRef CAS.
- Z. A. Alrowaili, M. Aouassa, M. H. Mahmoud, K. S. El-Nasser, H. A. Elsayed, T. A. Taha, A. M. Ahmed, A. Hajjiah and A. Mehaney, J. Mol. Liq., 2023, 369, 120964 CrossRef CAS.
- A. H. Aly and H. A. Elsayed, Phys. Scr., 2019, 94, 125501 CrossRef CAS.
- H. A. Elsayed and A. Mehaney, Appl. Nanosci., 2021, 11, 149–157 CrossRef CAS.
- A. M. Ahmed, H. A. Elsayed and A. Mehaney, Plasmonics, 2021, 16, 547–557 CrossRef CAS.
- M. Shaban, A. M. Ahmed, E. Abdel-Rahman and H. Hamdy, Sci. Rep., 2017, 71(7), 1–10 Search PubMed.
- D. Devashish, O. S. Ojambati, S. B. Hasan, J. J. W. Van Der Vegt and W. L. Vos, Phys. Rev. B, 2019, 99, 075112 CrossRef CAS.
- F. Segovia-Chaves, H. A. Elsayed, A. Mehaney and A. M. Ahmed, Optik, 2021, 242, 167161 CrossRef CAS.
- N. R. Ramanujam, H. J. El-Khozondar, V. Dhasarathan, S. A. Taya and A. H. Aly, Phys. B Condens. Matter, 2019, 572, 42–55 CrossRef CAS.
- T. Li, G. Liu, H. Kong, G. Yang, G. Wei and X. Zhou, Coord. Chem. Rev., 2023, 475, 214909 CrossRef CAS.
- L. Lu, X. Dong, Z. Liu, J. Wei, J. Li, H. Zhou, J. Zhu and X. Shi, Dyes Pigm., 2021, 195, 109676 CrossRef.
- T. A. Taha, A. Mehaney and H. A. Elsayed, Mater. Chem. Phys., 2022, 285, 126125 CrossRef CAS.
- P. C. Chou, S. H. Chen, C. J. Chang, C. H. Lu and J. K. Chen, Appl. Surf. Sci., 2022, 585, 152718 CrossRef CAS.
- A. Das, P. K. Panigrahi, G. Palai and R. Satpathy, J. Opt., 2024, 1–9 DOI:10.1007/s12596-024-01744-x.
- A. M. Elsayed, M. Shaban, A. H. Aly, A. M. Ahmed and M. Rabia, Mater. Sci. Semicond. Process., 2022, 139, 106348 CrossRef CAS.
- A. M. Elsayed, M. Rabia, M. Shaban, A. H. Aly and A. M. Ahmed, Sci. Rep., 2021, 111, 1–12 Search PubMed.
- J. Huang, H. Ren, X. Liu, X. Li and J. J. Shim, Superlattices Microstruct., 2015, 81, 16–25 CrossRef CAS.
- W. T. Kim and W. Y. Choi, Sens. Actuators, A, 2017, 260, 178–184 CrossRef CAS.
- Z. A. Zaky, M. R. Singh and A. H. Aly, Photonics Nanostructures: Fundam. Appl., 2022, 49, 100995 CrossRef.
- Z. Wang, C. Wang, F. Sun, Z. Fu, Z. Xiao, J. Wang and H. Tian, J. Opt. Soc. Am. B, 2019, 36, 215 CrossRef CAS.
- A. Juneau-Fecteau and L. G. Fréchette, Opt. Mater. Express, 2018, 8, 2774 CrossRef CAS.
- B. Auguié, M. C. Fuertes, P. C. Angelomé, N. L. Abdala, G. J. A. A. Soler Illia and A. Fainstein, ACS Photonics, 2014, 1, 775–780 CrossRef.
- A. M. Ahmed and A. Mehaney, Sci. Rep., 2019, 9, 1–9 CrossRef PubMed.
- Y. W. Fen and W. M. M. Yunus, Opt. Photonics J., 2011, 01, 116–123 CrossRef CAS.
- H. Gai, J. Wang and Q. Tian, Appl. Opt., 2007, 46, 2229–2233 CrossRef CAS PubMed.
- C. J. Wu, Y. H. Chung, B. J. Syu and T. J. Yang, Prog. Electromagn. Res., 2010, 102, 81–93 CrossRef.
- M. R. Querry, M. A. Ordal, R. J. Bell, L. L. Long and R. W. Alexander, Appl. Opt., 1985, 24(24), 4493–4499 CrossRef.
- Refractive Index of TiO2 (Titanium Dioxide) – Bodurov, https://refractiveindex.info/?shelf=main%26book=TiO2%26page=Bodurov, accessed 28 August 2021 Search PubMed.
- D. G. Mohan, S. Gopi, V. Rajasekar, K. Krishnan, D. G. Mohan, S. Gopi, L. Selvarajan, R. Rajavel, B. Prakash, D. G. Mohan, S. Gopi, A. A. Alloys, U. Taguchi, L. Selvarajan, R. Sasikumar, D. G. Mohan, P. Naveen Kumar and V. Muralidharan, Mater. Today Proc., 2019, 27, 31 Search PubMed.
- S. Farsinezhad, A. Mohammadpour, A. N. Dalrymple, J. Geisinger, P. Kar, M. J. Brett and K. Shankar, J. Nanosci. Nanotechnol., 2013, 13, 2885–2891 CrossRef CAS PubMed.
- Y. Fu and A. A. Mo, Nanoscale Res. Lett., 2018, 13, 187 CrossRef PubMed.
- O. Zakir, R. Idouhli, M. Elyaagoubi, M. Khadiri, A. Aityoub, Y. Koumya, S. Rafqah, A. Abouelfida and A. Outzourhit, J. Nanomater., 2020, 2020, 4745726 Search PubMed.
- E. T. Hu, H. Zhao, M. Wang, J. Wang, Q. Y. Cai, K. Yu and W. Wei, Nanomater, 2023, 13, 2108 CrossRef CAS PubMed.
- S. Chowdhury, Microelectron. Reliab., 2022, 138, 114689 CrossRef CAS.
- A. H. M. Almawgani, H. M. Fathy, G. A. Ali, H. A. Elsayed and A. Mehaney, Micromachines, 2023, 14, 204 CrossRef PubMed.
- S. Kumar, M. K. Shukla, P. S. Maji and R. Das, J. Phys. D Appl. Phys., 2017, 50, 375106 CrossRef.
- A. H. Aly, Z. A. Zaky, A. S. Shalaby, A. M. Ahmed and D. Vigneswaran, Phys. Scr., 2020, 95, 035510 CrossRef CAS.
- A. M. Ahmed, M. Shaban and A. H. Aly, Optik, 2017, 145, 121–129 CrossRef CAS.
- N. Ayyanar, P. G. Kuppusamy, G. Thavasi Raja, D. Vigneswaran and A. H. Aly, IET Optoelectron., 2019, 13(3), 118–123 CrossRef.
- J. Tang, Y. Ye, J. Xu, Z. Zheng, X. Jin, L. Jiang, J. Jiang and Y. Xiang, Nanomaterials, 2020, 10(3), 500 CrossRef CAS.
- Q. Q. Meng, X. Zhao, C. Y. Lin, S. J. Chen, Y. C. Ding and Z. Y. Chen, Sensors, 2017, 17, 1846 CrossRef PubMed.
- Z. A. Zaky, A. M. Ahmed, A. S. Shalaby and A. H. Aly, Sci. Rep., 2020, 10, 9736 CrossRef CAS PubMed.
- T. Galy, M. Marszewski, S. King, Y. Yan, S. H. Tolbert and L. Pilon, Microporous Mesoporous Mater., 2020, 291, 109677 CrossRef CAS.
- M. Mohamedi, F. Challali, T. Touam, M. Konstantakopoulou, V. Bockelée, D. Mendil, S. Ouhenia, D. Djouadi and A. Chelouche, Appl. Phys. A: Mater. Sci. Process., 2023, 129, 1–16 CrossRef.
- O. Pluchery, R. Vayron and K. M. Van, Eur. J. Phys., 2011, 32, 585 CrossRef.
| This journal is © The Royal Society of Chemistry 2024 |

