 Open Access Article
The use of peanut shells as a bio-template to prepare K-doped In2O3 porous sheets for chlorine detection†
Lin Zhu *a and
Heyong Hanb
aSchool of Materials Science and Engineering, Taiyuan University of Science and Technology, Taiyuan 030024, China. E-mail: tyustcl@126.com
bSchool of Mechanical Engineering, Taiyuan University of Science and Technology, Taiyuan 030024, China
First published on 16th October 2024
Abstract
Chlorine (Cl2) is highly toxic and pungent, and can cause irreversible harm to humans even at low concentrations. Therefore, it is significant to develop a sensor that is highly sensitive to trace amounts of Cl2 leakage. In this work, inexpensive peanut shells are used as a biological template to prepare K-doped indium oxide (K-In2O3) porous sheets through a simple three-step process. The characterization results reveal the porous sheet microstructure of the prepared K-In2O3 derived from the peanut shell bio-template, and the obtained material possesses rich oxygen vacancies and a high specific surface area. Gas-sensing tests demonstrate that the K-In2O3 porous sheet sensor exhibits excellent sensitivity to low concentrations of Cl2.
1 Introduction
Chlorine (Cl2) is significant to our daily life, and is commonly used as an effective sterilization agent. Additionally, Cl2 is widely used in industrial and medical applications. In industry, it is employed in the production of chemicals such as oxalic acid, chlor-alkali, and disinfectants. In the medical field, Cl2 is used to clean and disinfect medical devices. However, Cl2 also poses various potential hazards because it is a toxic gas with a yellow-green colour and a strong irritating odour. If low concentrations of Cl2 are inhaled for a sustained period of time, they will cause harm to human skin, mucous membranes, and respiratory and gastrointestinal systems. In severe cases, coma and even death can occur.1 Therefore, the development of a Cl2 gas sensor is of great significance. Efficient detection of toxic gases has been a continuous focus of scientific researchers.2A gas-sensing material is the key component used by gas sensors for direct measurement.3,4 Thus far, various Cl2-sensing materials based on metal oxides have been reported, such as ZnO,5 In2O3,6 WO3,7 and SnO2.8 There are many methods for preparing gas-sensing materials based on metal oxide, including electrospinning,9 the hydrothermal method,10 chemical vapor deposition,11 the sol–gel method,12 the microemulsion method,13 the template method,14 et al.15 Among these, the template method has attracted attention for its diversity, controllability, low cost, and ease of operation.16 Furthermore, the bio-template method utilizes naturally formed complex structures of biomolecules to achieve precise control and customization of synthetic material structure and properties.17,18 Thus, the bio-template method can produce new materials with specific functionalities and performances. Additionally, due to the diverse morphology, inexpensive and easy removal, and renewability of biomolecules, the bio-template method is regarded as a promising research focus in nanomaterial synthesis.19,20
In this work, peanut shells were used as a bio-template to prepare potassium-doped indium oxide (K-In2O3) for Cl2 detection. Peanut shells are mainly composed of cellulose and lignin, and their fiber contains hydroxyl groups, which are a green, inexpensive, and hydrophilic bio-template.21 Characterization by scanning electron microscopy (SEM) proved that K-In2O3 exhibits a porous sheet-like structure. The Brunauer–Emmett–Teller (BET) results indicated a relatively high surface area for the K-In2O3 porous sheets, which was attributable to the use of peanut shell templates. The gas-sensing test results demonstrated that the K-In2O3 porous sheets showed satisfactory gas response and excellent selectivity to low concentrations of Cl2. The superior Cl2-sensing properties were mainly attributed to the porous sheet-like microstructure and large surface area of the K-In2O3 porous sheets that were prepared by the peanut shell bio-template method.
2 Materials and methods
2.1 Synthesis
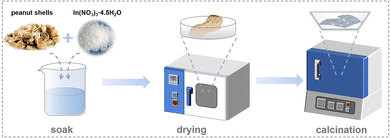
First, 2.0 g of indium(III) nitrate [In(NO3)3·4.5H2O] (Innochem Co., Ltd, 99.9%) was added to 80 mL of deionized (DI) water. Next, small pieces of peanut shells (3.0 g) were soaked in the above mixture at room temperature for 0.5 d. Afterward, the peanut shells were dried at 80 °C for 14 h. Finally, K-In2O3 porous sheets were obtained by calcination of the dried peanut shells at 550 °C for 3 h. In addition, pure In2O3 was prepared using the same synthetic process, except that the peanut shells were treated with 100 mL of 1 M hydrochloric acid (HCl) (Sinopharm Chemical Reagent Co., Ltd, 36 wt%) for 2 d. The prepared process is illustrated in Fig. 1.2.2 Characterization
The phase of the K-In2O3 porous sheets was analyzed by X-ray diffraction (XRD, Rigaku Miniflex 600). The microstructure was determined by scanning electron microscopy (SEM, FEI Talos F200X G2). The chemical state was characterized by X-ray photoelectron spectroscopy (XPS, Thermo Scientific ESCALAB 250Xi). The specific Brunauer–Emmett–Teller (BET) surface area was measured using a microporous physisorption instrument (Micromeritics ASAP 2460).2.3 Gas-sensing testing
First, a paste of sensing material and terpilenol was applied onto the surface of an alumina tube. Second, the sensor was calcinated at 300 °C for 2 h. Third, four platinum wires on the alumina tube and the additional heating wire were attached to the base using a soldering iron. Then, the base was placed on the aging apparatus (Weisheng, TS-60). Last, the gas sensing properties were tested by employing the testing system (Weisheng, WS-30A). The gas response was defined as |Rgas/Rair| (>1), where Rgas and Rair denote the resistance in the tested gas and air, respectively.3 Results and discussion
3.1 Characterization
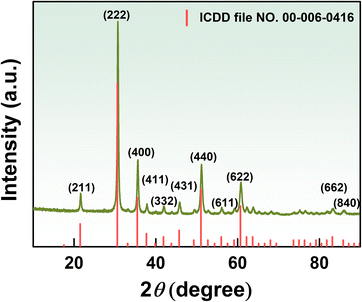
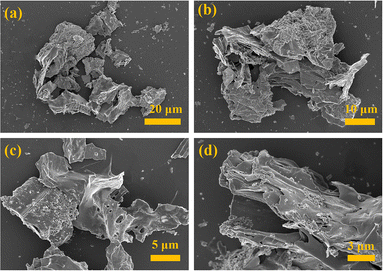
The crystal structure of K-In2O3 fabricated with peanut shells as a bio-template was characterized by XRD, and the result is illustrated in Fig. 2. The peanut shells were not acid treated, and therefore, it was expected that the resultant In2O3 would contain elemental K as well. However, because the K content in peanut shells is low, peaks of K were not observed in the XRD pattern. The diffraction peaks of K-In2O3 aligned well with those of the standard card (ICDD file no. 00-006-0416),22,23 indicating a cubic crystal structure.To observe the microstructure of the K-In2O3 fabricated by the peanut shell bio-template method, SEM was performed. Fig. 3(a) shows that the morphology of the K-In2O3 synthesized using peanut shells as a bio-template exhibits a skeletal structure. The skeletal structure mainly inherits the microstructure of peanut shells. Fig. 3(b) reveals that the skeletal structure is formed by the accumulation of many sheets, while the surface of the sheets is densely packed with particles. The layered surface exhibits numerous irregularly shaped pores, as shown in Fig. 3(c), which may be due to the removal of the bio-template during the calcination process. From Fig. 3(d), it is apparent that the layers are arranged in overlapping sheets with gaps. Thus, the morphology of the K-In2O3 porous sheets is largely inherited from that of the peanut shells.
XPS characterization was performed to further determine the elemental composition of the material, and the result is illustrated in Fig. 4. The XPS survey spectrum (Fig. 4(a)) verifies that the K-In2O3 porous sheets synthesized using peanut shells as the bio-template mainly consist of In, O, and K elements. The C 1s peak located at 284.6 eV is an external carbon source for calibration. No other elemental peaks were detected in the XPS survey spectrum. This indicates that the K-In2O3 porous sheets were pure, which is in agreement with the XRD analysis. The high-resolution In 3d spectrum is exhibited in Fig. 4(b), and the two peaks at 451.3 eV and 443.8 eV correspond to In 3d5/2 and In 3d3/2, respectively. The spin–orbit splitting of 7.5 eV matches the standard values for In2O3.24
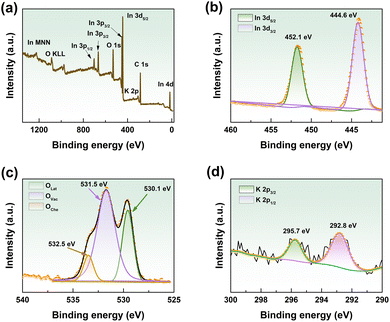 | ||
| Fig. 4 XPS survey spectra of the K-In2O3 porous sheets: (a) fully scanned spectra, (b) In 3d, (c) O 1s, and (d) K 2p. | ||
Fig. 4(c) presents the high-resolution O 1s spectrum, with peaks at 530.1 eV, 531.5 eV, and 532.5 eV relating to lattice oxygen, oxygen vacancies, and hydroxyl groups, respectively.6 Obviously, the concentration of oxygen vacancies is high. The reason for this may be ascribed to the consumption of oxygen and the production of CO2 during the calcination of the peanut shell template,25 where a low oxygen atmosphere facilitates the generation of oxygen vacancies.26 Oxygen vacancies are significant for gas-sensing performance and are components in the gas-sensing mechanism. Additionally, the K 2p peak was found in the fully scanned XPS spectra (Fig. 4(a)). As shown in Fig. 4(d), there are two peaks in the K 2p spectrum at 292.8 and 295.7 eV, which correspond to K 2p3/2 and K 2p1/2, respectively.27 This indicates the K-doping of In2O3 (K-In2O3) that was prepared by the peanut shell bio-template method. The content of K calculated using the atomic percentage of the XPS results is 9.7%. Fig. S1† shows the XPS spectrum of the pure In2O3 that was prepared by the acid-leached peanut shell bio-template method, and indicates that the obtained In2O3 does not contain elemental K.
Fig. 5 shows the nitrogen adsorption–desorption curve of the K-In2O3 porous sheets synthesized using peanut shells as the bio-template. The isotherm exhibits an H3-type pattern,28 which lacks a distinct saturation plateau, and indicates that the pore structure is highly irregular. H3-type isotherms are commonly observed in aggregates of layered structures, resulting in slit-shaped mesopores or macroporous materials. These networks consist of large pores that are not filled by pore condensates. As depicted in Fig. 5, the BET surface area of the K-In2O3 porous sheets is 22.5727 m2 g−1. The pore size distribution (the inset of Fig. 5) illustrates that the average pore diameter of the K-In2O3 porous sheets is approximately 12.4 nm, which is in the mesopore range.29
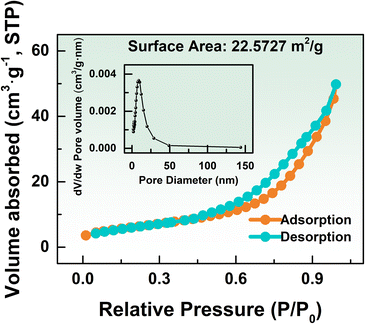 | ||
| Fig. 5 N2 isothermal adsorption/desorption isotherms (the inset shows the BJH pore size distribution plot). | ||
3.2 Gas-sensing performance
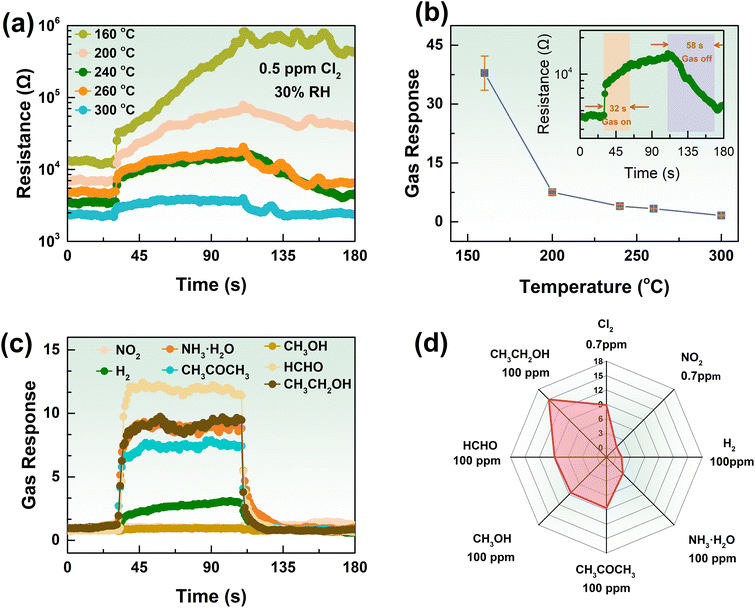
The gas-sensing properties of a gas sensor based on a metal oxide semiconductor mainly depend on the operating temperature. In other words, the working temperature is the most critical factor for gas-sensing properties. Consequently, the optimal operation temperature was determined to assess the gas-sensing performance of the K-In2O3 porous sheets prepared using peanut shells as the bio-template. Fig. 6(a) and (b) exhibit the dynamic response curves and sensitivity of the K-In2O3 porous sheet sensor to 0.5 ppm Cl2 at various temperatures, respectively. The result of Fig. 6(b) reveals that with increasing operating temperature, the sensitivity decreases by degrees, and the recovery process becomes increasingly complete.Considering the sensitivity and the recovery degree, the optimal working temperature for the K-In2O3 porous sheet sensor was determined to be 240 °C. Thus, all subsequent gas-sensing tests were conducted at 240 °C. The inset in Fig. 6(b) shows that the response and recovery times for 0.5 ppm Cl2 at 240 °C are 32 s and 58 s, respectively. According to a previous study,22 it is generally observed that the lower the gas concentration, the longer the response/recovery times. Therefore, the response/recovery times for the K-In2O3 porous sheet sensor at 0.5 ppm Cl2 are acceptable. The gas-sensing properties of the pure In2O3 sensor were also investigated. Fig. S2† shows that the gas response of the pure In2O3 sensor to 0.5 ppm Cl2 was low (<2) at various working temperatures. Thus, the gas-sensing properties of the K-In2O3 porous sheet sensor were superior to those of the pure In2O3 sensor, and demonstrated that the K content greatly affects the gas-sensing performance.
In practical gas detection, selectivity is the ability of sensors to recognize a specified gas. Therefore, selectivity is another crucial indicator for gas detection, and the gas-sensing properties of the K-In2O3 porous sheet sensor were tested using oxidizing gases (Cl2, NO2) and reducing gases (H2, NH3·H2O, CH3COCH3, CH3OH, HCHO, CH3CH2OH). Fig. 6(c) displays the transient response curves of the K-In2O3 porous sheet sensor to 0.7 ppm oxidizing gases and 100 ppm reducing gases at 240 °C. Fig. 6(d) presents a radar chart of the response values to various gases at different concentrations. The gas response of the K-In2O3 porous sheet sensor to Cl2 was significantly higher as compared to the response to other gases, demonstrating its excellent selectivity.
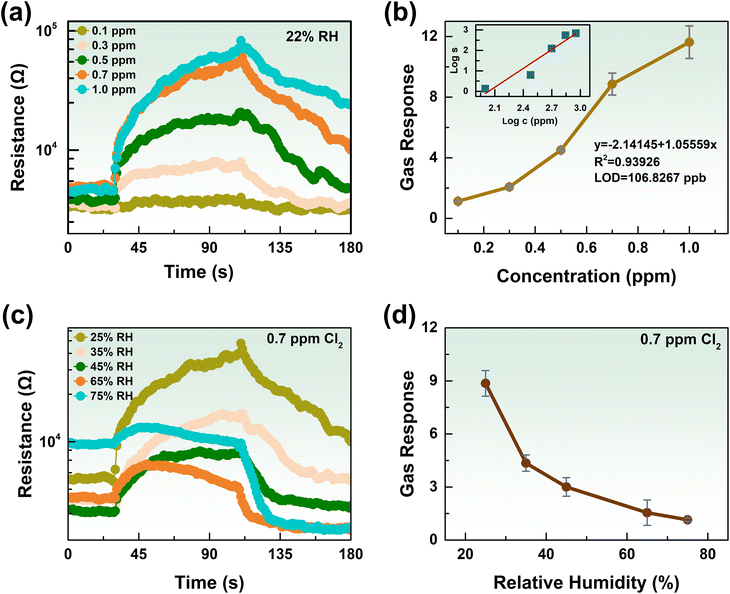
Furthermore, an excellent gas sensor can detect low concentrations of hazardous gas.30 Thus, it is ideal for the gas sensor to exhibit a significant response at low concentrations. To investigate the lowest limit of detection (LOD), the gas-sensing properties of the K-In2O3 porous sheet sensor were tested under the optimum working temperature of 240 °C with various concentrations of Cl2. Fig. 7(a) exhibits the dynamic resistance curves of the K-In2O3 porous sheet sensor for 0.1–1.0 ppm Cl2. Fig. 7(b) illustrates the sensitivity of the K-In2O3 porous sheet sensor to a series of Cl2 concentrations. From Fig. 7(a) and (b), as the concentration of Cl2 increases, the gas response becomes increasingly intense. However, as the concentration of Cl2 reaches a certain level, the recovery of the sensor becomes less ideal. The inset in Fig. 7(b) demonstrates the satisfactory linear relationship between the logarithm of the sensitivity and the logarithm of the Cl2 concentration. The LOD for Cl2 was calculated to be 106.8267 ppb for the K-In2O3 porous sheet sensor.
As is well known, Cl2 is highly soluble in water and also reacts with water,31 which complicates the detection of chlorine gas. Thus, it was necessary to test the Cl2 sensing performance under various levels of humidity. Fig. 7(c) and (d) show the transient response curves and sensitivity of the K-In2O3 porous sheet sensor, respectively, for 0.7 ppm Cl2 under 25–75% relative humidity (RH). As illustrated in Fig. 7(c), with increasing humidity, the response value of the K-In2O3 porous sheet sensor gradually decreased. Fig. 7(d) reveals that the sensitivity significantly decreased as the RH increased from 25% to 35%. Subsequently, the sensitivity to Cl2 exhibited a uniform decreasing trend within the higher humidity range of 35% RH to 55% RH. Under high humidity (65% RH to 75% RH), the sensitivity stabilized and greatly decreased.
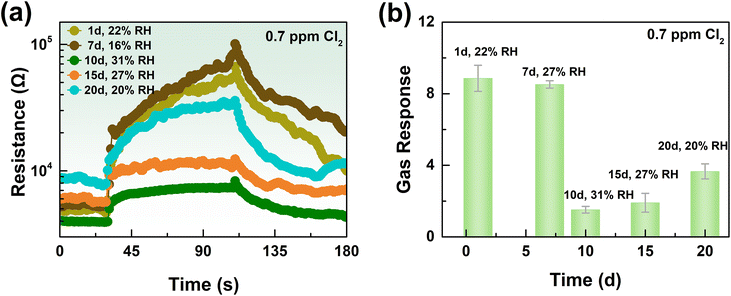
In practical detection processes, the service life of gas sensors is also a vital element.32 If the service life is too short, it will be necessary to frequently replace the gas sensor, which is inconvenient. Moreover, if the gas sensor is not replaced in a timely manner, it may result in inaccurate detection and even cause accidents. Therefore, the service life is an indispensable performance indicator in practical detection applications. Systematic gas-sensing tests for the K-In2O3 porous sheet sensor were conducted over different days. Fig. 8(a) and (b) display the gas-response transient curves and the response value of the K-In2O3 porous sheet sensor for 0.7 ppm Cl2 at different times, respectively. As observed in Fig. 8(b), the sensitivity of the K-In2O3 porous sheet sensor to Cl2 is significantly influenced by the working time and the environmental humidity, which is a challenge for Cl2 sensors in practical applications. Stability tests were conducted over 20 days under varying times and humidities, and although the response value of the K-In2O3 porous sheet sensor to Cl2 decreased with working time, notable sensitivity was maintained. Thus, the general stability of the K-In2O3 porous sheet sensor synthesized using peanut shells as a bio-template has been demonstrated.
Lastly, a comparison of Cl2-sensing properties of In2O3 sensors is given in Table 1. Compared to other preparation methods, the peanut shell bio-template method is simple, easy to perform, and cost-efficient. Additionally, the BET surface area of the K-In2O3 porous sheets prepared by the peanut shell bio-template method was larger than that of In2O3 synthesized by hydrothermal methods, electron beam evaporation, and other bio-template methods. Although the operating temperature was moderate, the sensor based on K-In2O3 porous sheets prepared using a peanut shell bio-template is excellent for detection of low concentrations of Cl2.
| Sensor | Method | BET surface area (m2 g−1) | Complexity/cost | T (°C) | Cl2 (ppm) | Gas response |
|---|---|---|---|---|---|---|
| In2O3 microstructures33 | Hydrothermal method | 0.0081 | Simple/normal | 300 | 100 | 1385 |
| Fe2O3–In2O3 porous sheets34 | Hydrothermal method | 0.5328 | Simple/normal | 300 | 100 | 1739 |
| In2O3 mesoporous35 | Hydrothermal method | 0.0034 | Simple/normal | 260 | 100 | 1540 |
| In2O3 hollow microtubules36 | Degreasing cotton bio-template | 11.6500 | Simple/low | 200 | 10 | 1051 |
| In2O3 microspheres25 | Yeast bio-template | 9.9000 | Simple/low | 240 | 10 | 96 |
| Fe2O3–In2O3 thin film37 | Electron beam evaporation | — | Complex/high | 400 | 5 | 69 |
| In2O3 porous sheets (this work) | Peanut shell bio-template | 22.5727 | Simple/low | 240 | 0.5 | 3.97 |
3.3 Gas-sensing mechanism
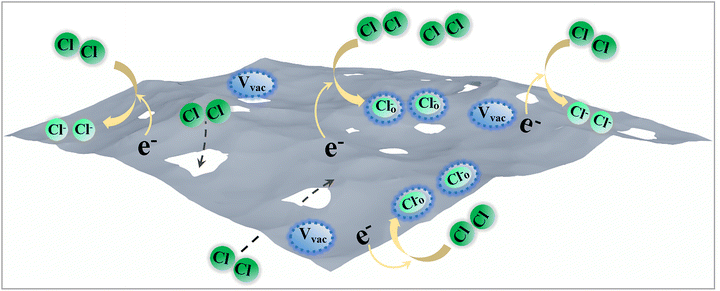
Based on the results of gas-sensing tests, the resistance of the K-In2O3 porous sheets (an n-type semiconductor) increased upon exposure to Cl2 (Fig. 6(a)). The gas-sensing mechanism is deduced as follows:38,39| Cl2 + 2e− → 2Cl− | (1) |
| Cl2 + 2 Ovac + 2e− → 2Cl–O | (2) |
Reaction (1) describes the direct adsorption of Cl2 molecules to capture electrons. Reaction (2) describes the adsorption of Cl2 onto oxygen vacancies. In both reactions, electrons are depleted, leading to increased resistance. The gas-sensing mechanism of the K-In2O3 porous sheets is schematically displayed in Fig. 9.
The high sensitivity of the K-In2O3 porous sheet sensor in the detection of low concentrations of Cl2 may be ascribed to the following. First, the K-In2O3 porous sheets synthesized using the peanut shell bio-template method retained the morphological features of peanut shells. This resulted in a large BET surface area that was favorable for facilitating reaction (1). Second, the formation of CO2 and H2O vapour during the calcination of the peanut shells created a temporary low-oxygen environment that promoted the generation of oxygen vacancies in In2O3. Consequently, the high concentration of oxygen vacancies in the K-In2O3 porous sheets enhanced reaction (2).
4 Conclusions
K-In2O3 porous sheets were prepared through a three-step process using the peanut shells as the bio-template. The morphology of the porous sheets was mainly inherited from the peanut shells. The high concentration of oxygen vacancies and the large BET surface area of the K-In2O3 porous sheets were due to the use of the peanut shell bio-template. The K-In2O3 porous sheet sensor exhibited an excellent gas response to low concentrations of Cl2. Based on the analysis of the gas-sensing mechanism, the high specific surface area and abundant oxygen vacancies of the K-In2O3 porous sheets are conducive to Cl2 detection.Data availability
The data supporting this article have been included within the manuscript and its ESI.†Author contributions
Lin Zhu: conceptualization, resources, data, curation, formal analysis, supervision, funding acquisition, validation, investigation, visualization, writing – original draft, writing – review and editing. Heyong Han: writing – review & editing.Conflicts of interest
There are no conflicts to declare.Acknowledgements
This work was supported by Key Projects of Shanxi Province Key Research and Development Plan (Grant No. 201703D111003) and the Shanxi Province Scientific and Technological Achievements Transformation Guidance Project (Grant No. 202204021301054).Notes and references
- C. W. White and J. G. Martin, Proc. Am. Thorac. Soc., 2010, 7, 257–263 CrossRef PubMed.
- A. K. Saroha, J. Chem. Health Saf., 2006, 13, 5–11 CrossRef CAS.
- J. Ma, H. Zhai, Z. Zhang, M. Di, Z. Sun, K. Zhang, J. Hu and H. Fan, ACS Appl. Nano Mater., 2023, 6, 19797–19806 CrossRef CAS.
- A. Dey, Mater. Sci. Eng. B, 2018, 229, 206–217 CrossRef CAS.
- X. Meng, R. Gao, M. Zheng, X. Zhou, X. Zhang, X. Cheng, Y. Xu, S. Gao and L. Huo, Chem. Eng. J., 2024, 493, 152631 CrossRef CAS.
- J. Ma, H. Fan, W. Zhang, J. Sui, C. Wang, M. Zhang, N. Zhao, A. Kumar Yadav, W. Wang, W. Dong and S. Wang, Sens. Actuators, B, 2020, 305, 127456 CrossRef CAS.
- F. Bender, C. Kim, T. Mlsna and J. F. Vetelino, Sens. Actuators, B, 2001, 77, 281–286 CrossRef CAS.
- J. Ma, H. Fan, X. Ren, C. Wang, H. Tian, G. Dong and W. Wang, ACS Sustainable Chem. Eng., 2019, 7, 147–155 CrossRef CAS.
- S. Ma and J. Xu, J. Mater. Chem. A, 2023, 11, 23742–23771 RSC.
- T. T. Nguyet, D. T. Thanh Le, N. Van Duy, C. T. Xuan, S. Ingebrandt, X. T. Vu and N. D. Hoa, RSC Adv., 2023, 13, 13017–13029 RSC.
- V. S. Bhati, M. Kumar and R. Banerjee, J. Mater. Chem. C, 2021, 9, 8776–8808 RSC.
- S. M. Majhi, S. T. Navale, A. Mirzaei, H. W. Kim and S. S. Kim, Inorg. Chem. Front., 2023, 10, 3428–3467 RSC.
- N. Baig, I. Kammakakam and W. Falath, Adv. Mater., 2021, 2, 1821–1871 RSC.
- T. Xu, J. Zhao, F. Zhao, W. Cong and G. Wang, Sens. Actuators, B, 2023, 394, 134338 CrossRef CAS.
- Z. Wang, L. Zhu, J. Wang, R. Zhuang, P. Mu, J. Wang and W. Yan, RSC Adv., 2022, 12, 24614–24632 RSC.
- B. Y. Song, C. Li, X. F. Zhang, R. Gao, X. L. Cheng, Z. P. Deng, Y. M. Xu, L. H. Huo and S. Gao, J. Mater. Chem. A, 2022, 10, 14411–14422 RSC.
- T. Xu, H. Wang, J. Zhao, F. Zhao, W. Cong, G. Wang and J. Li, Dalton Trans., 2023, 52, 10835–10843 RSC.
- P. Song, H. Zhang, D. Han, J. Li, Z. Yang and Q. Wang, Sens. Actuators, B, 2014, 196, 140–146 CrossRef CAS.
- M. B. Guerrero, J. M. Valverde, A. Perejon, P. E. S. Jimenez and L. A. P. Maqueda, Appl. Energy, 2018, 210, 108–116 CrossRef.
- T. Chen, M. Li, S. Song, P. Kim and J. Bae, Nano Energy, 2020, 71, 104549 CrossRef CAS.
- J. Zhou, Y. Guo, C. Liang, J. Yang, J. Wang and Y. Nuli, Electrochim. Acta, 2018, 273, 127–135 CrossRef CAS.
- K. K. Pawar, L. S. Chaudhary, S. S. Mali, T. S. Bhat, A. D. Sheikh, C. K. Hong and P. S. Patil, J. Colloid Interface Sci., 2020, 561, 287–297 CrossRef CAS PubMed.
- H. Wang, G. Fan, Z. Yang, N. Han, Y. Chen and J. Yang, ACS Appl. Nano Mater., 2022, 5, 7983–7992 CrossRef CAS.
- J. Mu, B. Chen, M. Zhang, Z. Guo, P. Zhang, Z. Zhang, Y. Sun, C. Shao and Y. Liu, ACS Appl. Mater. Interfaces, 2012, 4, 424–430 CrossRef CAS PubMed.
- J. Ma, H. Fan, N. Zhao, W. Zhang, X. Ren, C. Wang, Y. Wen and W. Wang, Ceram. Int., 2019, 45, 9225–9230 CrossRef CAS.
- L. Liu, F. Gao, H. Zhao and Y. Li, Appl. Catal., B, 2013, 134–135, 349–358 CrossRef CAS.
- X. Lu, D. Zhang, J. Zhong, L. Wang, L. Jiang, Q. Liu, G. Shao, D. Fu, J. Teng and W. Yang, Chem. Eng. J., 2022, 432, 134416 CrossRef CAS.
- K. S. W. Sing, Pure Appl. Chem., 1985, 57, 603–619 CrossRef CAS.
- J. C. Groen, L. A. A. Peffer and J. P. Ramírez, Microporous Mesoporous Mater., 2003, 60, 1–17 CrossRef CAS.
- R. Kumar, O. A. Dossary, G. Kumar and A. Umar, Nano-Micro Lett., 2015, 7, 97–120 CrossRef PubMed.
- G. L. Squadrito, E. M. Postlethwait and S. Matalon, Am. J. Physiol. Lung Cell Mol. Physiol., 2010, 299, 289–L300 CrossRef PubMed.
- A. C. Romain and J. Nicolas, Sens. Actuators, B, 2010, 146, 502–506 CrossRef CAS.
- P. Li and H. Fan, Mater. Sci. Semicond. Process., 2015, 29, 83–89 CrossRef CAS.
- P. Li, Y. Cai and H. Fan, RSC Adv., 2013, 3, 22239–22245 RSC.
- P. Li, H. Fan and Y. Cai, Colloids Surf., A, 2014, 453, 109–116 CrossRef CAS.
- J. Ma, H. Fan, H. Tian, X. Ren, C. Wang, S. Gao and W. Wang, Sens. Actuators, B, 2018, 262, 17–25 CrossRef CAS.
- J. Tamaki, C. Naruo, Y. Yamamoto and M. Matsuoka, Sens. Actuators, B, 2002, 83, 190–194 CrossRef CAS.
- D. H. Dawson and D. E. Williams, J. Mater. Chem., 1996, 6, 409–414 RSC.
- T. Van Dang, N. Duc Hoa, N. Van Duy and N. Van Hieu, ACS Appl. Mater. Interfaces, 2016, 8, 4828–4837 CrossRef CAS PubMed.
Footnote |
| † Electronic supplementary information (ESI) available. See DOI: https://doi.org/10.1039/d4ra05208k |
| This journal is © The Royal Society of Chemistry 2024 |

