 Open Access Article
Zinc oxide/tin oxide nanoflower-based asymmetric supercapacitors for enhanced energy storage devices
Vandana Molahalli a,
Gowri Somanb,
Vinay S. Bhat
 c,
Apoorva Shetty
 b,
Abdullah Alodhaybd and
Gurumurthy Hegde
 *be
*be
aDepartment of Physics, B.M.S. College of Engineering, Bull Temple Road, Bengaluru 560019, India
bDepartment of Chemistry, Christ University, Hosur Road, Bangalore 560029, India. E-mail: murthyhegde@gmail.com
cDepartment of Materials Science, Mangalore University, Mangalagangotri, Mangaluru, Karnataka 574199, India
dDepartment of Physics and Astronomy, College of Science, King Saud University, Riyadh 11451, Saudi Arabia
eCentre for Advanced Research and Development (CARD), Christ University, Hosur Road, Bangalore 560029, India
First published on 14th October 2024
Abstract
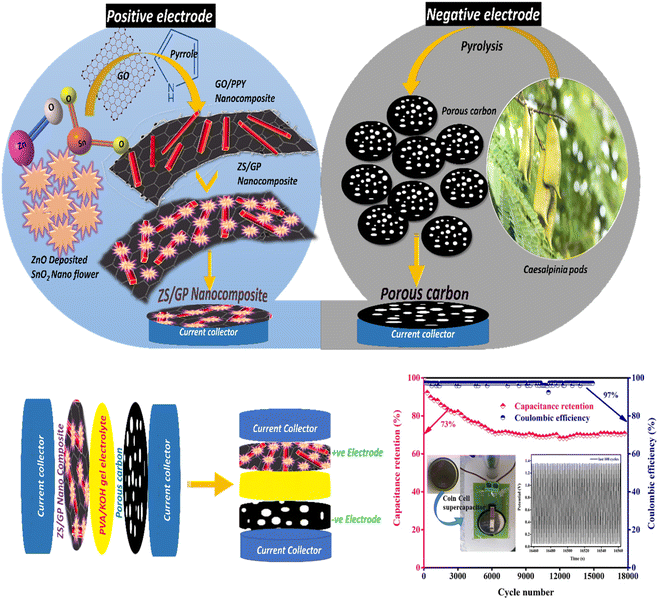
Research on energy storage devices has focused on improving asymmetric supercapacitors (ASCs) by utilizing two different electrode materials. In this work, we have successfully prepared a unique material, ZnO/SnO2 nanoflower, via the hydrothermal method. Graphene oxide (GO) was synthesized by applying the modified Hummers' technique. The ZnO/SnO2 nanoflower was deposited on a polypyrrole (PPY) nanotube/graphene oxide composite (ZS/GP) in two steps: in situ chemical polymerization, followed by a hydrothermal method. Electrochemical properties of the prepared material nanocomposite were analyzed by applying cyclic voltammetry (CV), galvanostatic charge–discharge (GCD) and electrochemical impedance spectroscopy (EIS) techniques. An asymmetric supercapacitor (ASC) was constructed using ZS/GP nanocomposite as the positive electrode and Caesalpinia pod-based carbonaceous material as the negative electrode material, and its performance was investigated. As a result, the fabricated ASCs were found to have an excellent specific capacitance of 165.88 F g−1 at 1.4 V, with an energy density of 5.12 W h kg−1 and a power density of 2672 W kg−1. The prepared nanocomposite material for the ASC showed a cycle stability of 17k cycles at a current density of 5 A g−1. This study revealed that the electrode material ZS/GP nanocomposite is highly suitable for supercapacitor applications. The ASC device's extended cycle life experiments for 17k cycles produced a coulombic efficiency of 97% and a capacitance retention of 73%, demonstrating the promising potential of the electrode materials for greener as well as efficient energy storage applications while converting abundant bio waste into effective energy.
1 Introduction
The demand for energy storage devices and their usage has drastically increased over the years and is a major issue in the 21st century.1 Conventionally used energy storage devices, such as fuel cells,2 batteries3–8 and capacitors, are not able to meet the growing demands of the increasing population. This situation has urged the need for a clean, sustainable and renewable source of energy.9 The invention of supercapacitors (SCs) has managed to resolve this issue to a greater extent. SCs have drawn the attention of researchers due to their improved electrochemical performance, which includes high cycle stability, specific capacitance, power density and fast charge/discharge speed. Despite their advantages, SCs also face few problems when it comes to the self-discharge rate. SCs are not ideal for long-term energy storage as their discharge rate is far higher than that of lithium-ion batteries; they can lose up to 10 to 20% of their charge per day via self-discharge .10 Supercapacitors also face gradual voltage loss with their charges, whereas batteries provide almost near-constant voltage output.11 This has led to the need for new functional materials for energy consumption, generation and storage. There exist a variety of materials and methods for the enhancement of supercapacitors.12 The field of energy storage has undergone a complete transformation as a result of the development of nanotechnology and the creation of nanodevices. One way in which the energy density was increased was through the development of asymmetric supercapacitors (ASCs).13Researchers are currently concentrating their efforts on asymmetric supercapacitors because they have the potential to produce much higher energy densities across a wide range of operational voltage windows.14 The specific capacitance can still be improved by optimization of parameters, such as electrical conductivity, porosity and chemical stability of the electrode material, as well as by using low-dimensional nanostructures (nanorods, nanoflower, nano-foam, nanosheets, quantum dots, etc.) .15,16 Over the years, carbon-based materials have been the most favored candidates for anode materials in ASCs due to their merits, such as low-cost, nontoxicity, environment friendly nature, high conductivity17 and mechanical stability.18 These carbon materials follow the mechanism of an electric double layer. Recently, biomass-derived carbon materials have gained much attention because of their availability and renewable nature.19 The usage of bio-waste is a reasonable solution to the world's economic problems. For energy storage devices, bio-waste's cellulose and hemicellulose, which are the structural components of cells, are ideal.20 Most solid bio-wastes are made up of ligno-cellulosic biomass, which contains 35–50 percent cellulose.21 The energy storage sector has a wide range of options for raw materials made from bio-waste. Using bio-waste materials reduces dependence on fossil fuels, is cost-effective, and generally has minimal negative environmental effects.
The primary components of biomass are carbon, sulfur, nitrogen, and phosphorus.19 Biomass-derived carbon materials have unique hierarchical structures and rich surface characteristics that are suitable for electrochemical reaction mechanisms, such as ion transfer and diffusion. Thus far, numerous porous carbon materials have been prepared using biomass as a precursor by applying hydrothermal and pyrolysis methods in the field of supercapacitor electrode materials. Currently, a prominent topic in the field of energy storage and conversion is the use of diverse biomass as carbon sources to create self-doped porous carbon electrodes.19
Since then, many studies have relied on biomass-derived carbonaceous materials as electrodes for the development of ASCs. Recently, Keqi Qu and his team worked on biomass-derived carbon dots and improved the capacitance of nickel cobalt-layered double hydroxide to much higher values.22
In this study, we use Caesalpinia pods as the biomass precursor to obtain the carbon electrode material using the pyrolysis method.23 However, we use a ZnO/SnO2 nano flower that is fixed on a graphene–polypyrrole composite on the positive electrode. Metal oxides are found to enhance the electrochemical performance of energy storage devices to a greater extent, with higher energy density and specific capacitance values. The metal oxides mainly employed include RuO2 and NiO.24–26 Irrespective of their excellent electrochemical performance, these metal oxides also possess few drawbacks. RuO2 is very expensive and harmful. Similarly, NiO does not perform well beyond the potential window of 0.6 V.27 Hence, it is very important to identify the metal oxides that offer exceptionally high electrochemical performance and are simultaneously less toxic and inexpensive. Zinc oxide (ZnO) is found to be a reasonably priced transition metal oxide with sufficient pseudocapacitance due to its accessible redox characteristics and semiconducting nature. The best efficiency obtained to date is that of ZnO coated with SnO2 at about 6.3%.28 ZnO composites are chemically unstable, which is one of the challenges faced by researchers, and ZnO–SnO2 composite is found to be a promising option to overcome this issue.29
Recently, conducting polymers have been employed in pseudocapacitors because they have a high specific capacitance, which is obtained by reversible redox reactions. One conducting polymer that has demonstrated excellent high conductivity as well as great mechanical and environmental resilience is polypyrrole. Carbon-based materials, such as nanoflakes and composites, are extensively used as electrode materials to enhance the SC performance via synergistic effect.30 Graphene has been the researcher's choice for electrode material over the years due to its unique features, such as high specific area, high electrical conductivity and chemical stability. Hence, it would be an ideal solution if both the properties of graphene and polypyrrole could be incorporated together. Several researchers have worked in graphene oxide–polypyrrole composites and have reported their supercapacitor applications. One of them is the study carried out by Parl and his team, who worked on graphene oxide polypyrrole composite for supercapacitor studies with a capacitance value of about 400 F g−1.31 Chee et al. investigated two electrode studies of ternary polypyrrole/graphene oxide/zinc oxide composite for electrode material and achieved a capacitance of 94.6 F g−1 at 1 A g−1.31 Lim et al. reported a supercapacitor capacitance of about 320.6 F g−1 at 1 mV s−1 with ternary polypyrrole/graphene/nano manganese oxide composite.31 Wang and his team also carried out their studies with polypyrrole/graphene oxide and poly(3,4-ethylenedioxythiophene) composite and constructed a flexible asymmetric supercapacitor that retained a capacitance of 99.3% of its initial value.32
Motivated by the studies that have been conducted to date, in this study, we present the synthesis and performance of a specifically designed electrode material, i.e., ZnO/SnO2 nanoflower, which was anchored on a graphene oxide–polypyrrole nanotube composite as the positive electrode material. Simultaneously, the negative electrode is coated with carbonaceous material derived from the biomass precursor Caesalpinia pods. This work aims to explore the electrochemical performance of fabricated asymmetric supercapacitors (ASCs) through studies such as cyclic voltammetry and galvanostatic charging–discharging. To demonstrate its capability for developing highly effective supercapacitors, experiments were conducted using both a three-electrode system and a two-electrode system. This allowed us to estimate the influence of each component and its synergistic effect.
2 Materials, synthesis and characterization methods
2.1 Materials
Zinc acetate dehydrate (Zn(CH3COO)2·2H2O) (Sigma-Aldrich, 98%), sodium hydroxide (NaOH) (Sigma-Aldrich, 97%), methyl orange (Sigma-Aldrich, 85%), pyrrole monomer (C4H5N) (Sigma-Aldrich, 99%), ferric chloride (FeCl3) (Sigma-Aldrich, 97%), tin(IV) chloride pentahydrate (SnCl4·5H2O) (Sigma-Aldrich, 98%), graphite powder (Sigma-Aldrich, 99.99%), and polyvinylidene difluoride (PVDF) (Sigma-Aldrich, 99%) were used without further purification. Potassium Hydroxide (KOH), N-methyl-2-pyrrolidone (NMP), and activated carbon were purchased from Merck Chemicals. Nitric acid (HNO3) and sulphuric acid (H2SO4) were purchased from Merck Chemicals (99.99%), and polyvinyl alcohol (PVA) was purchased from Sigma-Aldrich (99%). All the reagents were used as received without further purification. Ultra-pure water is used throughout the experiments, which is obtained from a Milli-Q system from Millipore (Milford MA, USA).2.2 Synthesis of ZnO-deposited SnO2 nanoflower
An equal amount of ethanol and distilled water in a 100 ml mixture solution contained 0.025 mM of Zn(CH3COO)2·2H2O, 1.2 mM of SnCl4·5H2O, and 15 mM of NaOH. The combination solution was then placed into a stainless steel autoclave (100 ml) and heated to 180 °C for 24 hours. ZnO-deposited SnO2 nanoflower powder was produced when the product was centrifuged at 4000 rpm for 20 minutes, rinsed multiple times with distilled water and ethanol, and dried at 70 °C for two hours.2.3 Synthesis of GO
Using the modified Hummers' method, GO was prepared. Subsequently, 25 ml of concentrated H2SO4 and 1 g of dissolved NaNO3 were combined with 1 g of graphite powder (99% Carbon, −100 mesh (80%), natural) and held at 0 °C while being stirred continuously. 3 g of KMnO4 was added to the above-mentioned mixture, which was stirred continuously for two hours. Dropwise, 50 ml of distilled water was added, and the mixture was heated at 70 °C with constant stirring for two hours. With steady stirring for an hour, 10 ml of H2O2 was added, and a yellowish-brown graphite oxide suspension was obtained. 200 ml of water was placed in two separate beakers, and an equal amount of the solution prepared was added, stirred for 1 hour and then kept without stirring for 3–4 hours, where the particles settled at the bottom and the remaining water were filtered. The resulting mixture was washed repeatedly by centrifugation with 10% HCl and then with deionized (DI) water several times until it formed a gel-like substance (pH-neutral). After centrifugation, the gel-like substance was vacuum dried at 70 °C for more than 7 hours to obtain GO powder.2.4 Synthesis of PPY nanotubes
The soft template technique was used to create PPY nanotubes. Initially, 250 ml of deionized water was used to dissolve 0.362 g of methyl orange (MO) and 1.924 g of FeCl3 while stirring it magnetically for 40 minutes. To start pyrrole polymerization onto the template by FeCl3 oxidant, 0.84 ml of pyrrole was added to the above template solution drop by drop and stirred at room temperature for 24 hours. Simultaneously, the reduction of oxidizing cations causes the template to degrade. The precipitate was then filtered and cleaned with ethanol and deionized water. The precipitate was then dried for 24 hours at 60 °C in a vacuum oven.2.5 Synthesis of GO-incorporated PPY nanotubes
250 ml of distilled water was used to dissolve 0.362 g of MO, and 1.924 g of FeCl3 was added to the above solution with continuous stirring for 40 min. The mixture was mixed with 0.84 ml of pyrrole monomer and 0.2 mg of GO powder for 24 hours at room temperature. To obtain black GO-incorporated PPY nanotube powder, the resultant mixture was repeatedly centrifuged with distilled water and dried under a vacuum for 24 hours at 60 °C.2.6 Preparation of ZS/GP1 and ZS/GP2 nanocomposite
0.3 g of ZnO/SnO2 nanoflower powder was dissolved in 30 ml of 0.3% aqueous solution of acetic acid, and the mixture was sonicated for 1 hour. Then, 5 mg of GO-incorporated PPY nanotube was added to the resulting solution and sonicated for 30 minutes. The entire mixture was transferred to an autoclave and heated at 170 °C for 7 hours. The above mixture was filtered by washing it several times with DI water and ethanol and dried at 60 °C for 12 hours to obtain ZnO/SnO2 nanoflower/GO decorated polypyrrole (PPY) nanotube nanocomposites (Scheme 1).2.7 Synthesis of bio-waste-derived carbonaceous material used for the negative electrode
The Caesalpinia sappan pods collected from Thailand were used as precursors after drying at 80 °C, crushing, and mesh screening through 55–60 mm sieves. The one-pot pyrolysis method23 was used to create porous carbon materials in a quartz tube furnace (Nopo Nanotechnologies, India) at 800 °C for one hour. The resulting carbon residues were coded as CSPCN8, where 8 represents the corresponding pyrolysis temperatures at 800 °C.2.8 Electrode assembling for three- and two-electrode systems
The working electrodes were prepared by pre-cleaning a nickel foam substrate and coating it with a homogenized combination of 90% active material (ZS/GP), 5% carbon black, and 5% polyvinylidene difluoride (PVDF). The working electrodes were crushed under a pressure of 100 kg cm−2 and dried at 80 °C overnight with an active material mass of 2.61 mg. The electrochemical performance in 3.0 M KOH was first evaluated using a 3-electrode system, with a saturated calomel electrode acting as a reference and a platinum rod acting as a counter electrode.An asymmetric solid-state supercapacitor was created using a ZS/GP sample as the +ve electrode and microporous carbon as the −ve electrode, which were separated by Whatman glass-microfiber filter paper saturated in PVA-KOH gel electrolyte. Our earlier papers contain a thorough description of the procedure for creating porous carbons from the Caesalpinia sappan pod precursor.23 The gel electrolyte was made by dissolving 3.0 g of PVA in 50 ml of distilled water while stirring continuously at 80 °C and then gradually adding 3.0 g of KOH until a homogenous dispersion was achieved. The PVA-KOH suspension was applied to the positive and negative electrodes for 15 minutes. Later, by leaving the electrodes at room temperature for 12 hours, the water was allowed to evaporate. This produced the gel, which was crimped at a pressure of 100 kg cm−2 to obtain a final device.
The microporous carbon negative electrode's active mass was 0.00252 g, and the ZS/GP electrode's active mass was 0.00261.
2.9 Electrochemical performance
The multichannel potentiostat/galvanostat was used for all electrochemical studies (AUTOLAB M204.S, from the Netherlands). A working voltage window of 0 to −1 V was used to record the results of the 3-electrode system's cyclic voltammetry (CV) and constant current galvanostatic charge–discharge tests (GCD). Similar to this, CV and GCD analyses were carried out for the asymmetric device with a 3.0 M KOH electrolyte and PVA-KOH gel electrolyte, respectively, in the potential window of 0–1.4 V.Eqn (1) is used to determine the gravimetric specific capacitance (C) for the electrodes in a three-electrode cell:
 | (1) |
Similarly, eqn (2) is used to determine the gravimetric specific capacitance (C) for asymmetric supercapacitors:
 | (2) |
Eqn (3) and (4) are used to derive the actual energy performance metrics for the devices, including energy density (E) and power density (P):
 | (3) |
 | (4) |
3 Characterization methods
FTIR was recorded by applying SHIMADZU (FTIR: Shimadzu IR Spirit-L) with a scan range of 4000–400 cm−1 and a total of 1024 scans per analysis. The samples were measured using a vertical ATR accessory containing a LiTaO3 detector and a Germanium-coated KBr Beam splitter, and XRD was recorded using a Rigaku Model: Smart Lab X-ray Diffractometer. The optical absorbance was studied by an Ocean Insight HR2000 plus UV-visible spectrometer (wavelength 190–1100 nm). The RAMAN was recorded by applying the Horiba Model: Lab RAM HR: 532 nm, 786 nm laser installed. The electrochemical performances of the prepared sample were studied using the Metrohm M204 multichannel Autolab (PGSTAT Module), Netherlands. The surface morphology of the materials was determined using a Scanning Electron Microscope (SEM, Apreo, Thermo Fisher Scientific, India), and structural and morphological studies of the materials were conducted using a Transmission Electron Microscope (Titan-Themis 300 kV, FEI, Thermo).4 Results and discussions
4.1 FTIR and XRD analysis
The chemical composition present in PPY nanotubes, ZnO/SnO2 nanoflower and ZS/GP nanocomposites was confirmed by performing FT-IR studies, as shown in Fig. 1(a). The band at 3742.78 cm−1 is the PPY nanotube peak that corresponds to the symmetric stretching of the N–H bond.33 The conjugated polymer exhibits C–C and C![[double bond, length as m-dash]](https://www.rsc.org/images/entities/char_e001.gif) C stretching vibrations in the vicinity of 1544.85 cm−1. The stretching vibration of C–N is shown by the peak at 1152.47 cm−1. The peak at 927.54 cm−1 indicates that the
C stretching vibrations in the vicinity of 1544.85 cm−1. The stretching vibration of C–N is shown by the peak at 1152.47 cm−1. The peak at 927.54 cm−1 indicates that the ![[double bond, length as m-dash]](https://www.rsc.org/images/entities/char_e001.gif) C–N plane is deformed. The PPY polymer's
C–N plane is deformed. The PPY polymer's ![[double bond, length as m-dash]](https://www.rsc.org/images/entities/char_e001.gif) C–H in-plane vibration reaches its peak at 1299 cm−1. The presence of hydroxyl groups in graphene oxide is revealed by a wide peak in the FTIR spectra of the composite's GO at 3429 cm−1 in the high-frequency region, which is attributable to the stretching mode of the O–H bond. The carboxyl group was assigned to the band at 1720 cm−1.34 The FTIR spectra of ZnO/SnO2 nanoflower exhibit a peak at 475.3 cm−1 owing to the stretching vibration of zinc and oxygen in ZnO. The O–Sn–O band is attributed to the peak at 523.05 cm−1, while the O
C–H in-plane vibration reaches its peak at 1299 cm−1. The presence of hydroxyl groups in graphene oxide is revealed by a wide peak in the FTIR spectra of the composite's GO at 3429 cm−1 in the high-frequency region, which is attributable to the stretching mode of the O–H bond. The carboxyl group was assigned to the band at 1720 cm−1.34 The FTIR spectra of ZnO/SnO2 nanoflower exhibit a peak at 475.3 cm−1 owing to the stretching vibration of zinc and oxygen in ZnO. The O–Sn–O band is attributed to the peak at 523.05 cm−1, while the O![[double bond, length as m-dash]](https://www.rsc.org/images/entities/char_e001.gif) C
C![[double bond, length as m-dash]](https://www.rsc.org/images/entities/char_e001.gif) O mode of ZnO vibration is observed at 2364.92 cm−1, which implies the presence of ZnO, in the composite. A shift in the peak from 1544.55 cm−1 to 1568.25 cm−1 is clearly visible in the ZS/GP spectra as a result of the synergistic impact produced by the combination of the four materials. Thus, the findings make it evident that the formation of ZnO/SnO2 nanoflower-deposited GO/PPY composite is present.
O mode of ZnO vibration is observed at 2364.92 cm−1, which implies the presence of ZnO, in the composite. A shift in the peak from 1544.55 cm−1 to 1568.25 cm−1 is clearly visible in the ZS/GP spectra as a result of the synergistic impact produced by the combination of the four materials. Thus, the findings make it evident that the formation of ZnO/SnO2 nanoflower-deposited GO/PPY composite is present.
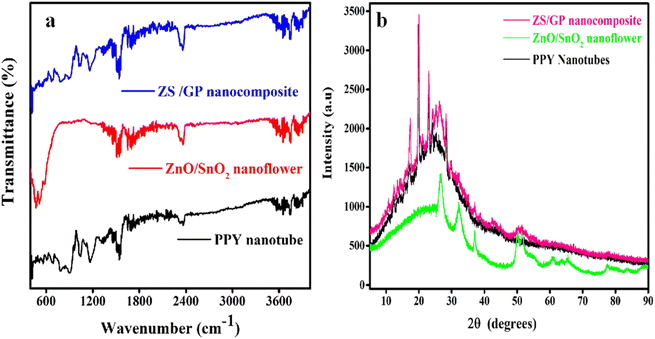 | ||
| Fig. 1 (a) FTIR and (b) XRD spectra of PPY nanotubes, ZnO/SnO2 nanoflower, and ZS/GP nanocomposites. | ||
Fig. 1(b) shows XRD patterns of the PPY nanotube, ZnO/SnO2 nanoflower and ZS/GP nanocomposites. From the XRD data, PPY shows a broad peak at 23.54°, indicating its amorphous nature.35 The XRD spectrum of ZnO/SnO2 nanoflower showed distinctive peaks at 32°, 36.5°, 50.3°, 54.5°, 60.2° and 63.4° attributed to ZnO corresponding to Bragg reflection planes (100), (101), (102), (110), (103), and (202). However, the 2θ values 26.3°, 51.4°, 65.7°, and 71.4° related to planes (110), (211), (301), and (202) imply SnO2 nanoflower. As can be observed, all peaks can be attributed to SnO2, and no more peaks were discovered. Because Zn was deposited into SnO2, all the peaks had a slight shift to a smaller angle.36 The XRD pattern of ZS/GP reveals sharp peaks at 17.4° and 20.04°, showing that oxygen atoms are not fully interlinked with GO. The XRD pattern of GO around 2θ = 11° demonstrates a shift in the peak from 10° to 17° caused by the interaction of GO with the ZnO/SnO2 nanoflower with the polymer composites.37 ZS/GP also has a broad peak at 2θ = 25° attributed to the presence of conjugation in the polymer composite. The XRD pattern confirms the formation of the ZS/GP composite, showing its characteristic peak, and no other impurity peaks are observed.36
4.2 Raman and UV-visible analysis
Raman spectra enabled us to investigate in detail at the micrometer level and aid in achieving structural uniformity of the synthesized sample, as illustrated in Fig. 2(a). The Raman spectra of PPY nanotubes show a strong narrow peak at 1576 cm−1 (G-band) corresponding to the C![[double bond, length as m-dash]](https://www.rsc.org/images/entities/char_e001.gif) C stretching frequencies, and the ring stretching is indicated by another peak at 1363 cm−1 (D-band). The results suggest that the PPY nanotubes are amorphous.38 The Raman pattern of ZnO/SnO2 nanoflower shows a broad band at 520 cm−1, confirming the presence of ZnO nanoparticles on the surface of SnO2 nanoflower. The Raman spectra of ZS/GP exhibit two broad peaks at 1453 cm−1 and 1576 cm−1, corresponding to the G and D bands of graphene oxide in the nanocomposite. Therefore, the Raman spectrum of the PPY nanotube, ZnO/SnO2 nanoflower and the ZS/GP composite reveals the successful formation of nanocomposites.
C stretching frequencies, and the ring stretching is indicated by another peak at 1363 cm−1 (D-band). The results suggest that the PPY nanotubes are amorphous.38 The Raman pattern of ZnO/SnO2 nanoflower shows a broad band at 520 cm−1, confirming the presence of ZnO nanoparticles on the surface of SnO2 nanoflower. The Raman spectra of ZS/GP exhibit two broad peaks at 1453 cm−1 and 1576 cm−1, corresponding to the G and D bands of graphene oxide in the nanocomposite. Therefore, the Raman spectrum of the PPY nanotube, ZnO/SnO2 nanoflower and the ZS/GP composite reveals the successful formation of nanocomposites.
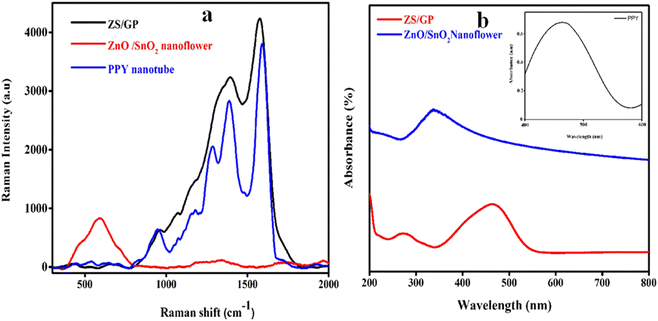 | ||
| Fig. 2 Raman and UV-visible spectra of PPY nanotubes, ZnO/SnO2 nanoflower, and ZS/GP nanocomposites. | ||
The UV-visible spectroscopy studies were carried out using a PerkinElmer UV-visible instrument with a wavelength range of 200–800 nm, as depicted in Fig. 2(b). The photo-absorption ability of the ZnO/SnO2 nanoflower composite is depicted in Fig. 2(a) with a characteristic peak observed at 326.3 nm, which confirms the intrinsic band absorption of ZnO. The absorption of the polypyrrole nanotube depicted in Fig. 2(b), inset indicates the presence of a band at 460 nm, which shows π*–π* transition and the bipolaronic transition. The polypyrrole neutral, unprotonated portion is attributed to the absorption band.39 ZnO/SnO2 and graphene oxide polypyrrole nanocomposite, i.e. ZS/GP, show a characteristic peak at 268.2 nm, and the graphene oxide present in the composite exhibits peaks at 262 nm and 465 nm, corresponding to the graphene oxide π*–π* plasmon peak. The intensity of the composite peak decreases because of the synergetic effect of the three materials with the characteristic peak of the PPY nanotube. Thus, the ZS/GP composite is found to possess all the characteristics of ZnO, SnO2, GO and PPY nanotubes.
4.3 FE-SEM study
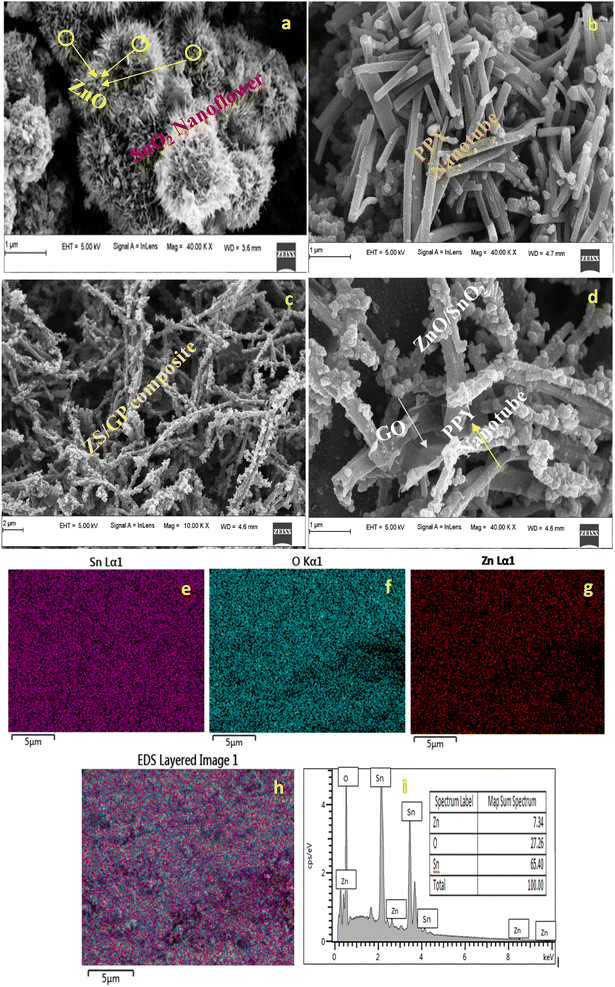
FE-SEM images allow us to thoroughly evaluate the crystallographic and microstructural structure properties of ZnO/SnO2 nanoflower, PPY nanotube, and ZS/GP composite, as illustrated in Fig. 3. From the FE-SEM image of ZnO/SnO2 nanoflower (Fig. 3(a)), a flower-like structure of the nanoflower with a uniform arrangement of the nanosheets as petals is observed. After carefully examining the FE-SEM images (Fig. 3(c)), ZnO nanoparticles can be observed attached to the surface of SnO2 nanoflower. The PPY was prepared by applying the existing method that used ferric chloride as the oxidant.40As shown in Fig. 3(b), we can clearly observe the tubular nature of the PPY nanotube, which is interlinked to each other, forming a network with an average diameter of 167 nm.41 The formation of the ZS/GP composite is very well confirmed by the enlarged tube size in the FE-SEM images, as depicted in Fig. 3(c and d), where the ZnO/SnO2 nanoflower composite is perfectly linked to the surface of the PPY nanotubes, resulting in a rough texture. The 1 μm FE-SEM image (Fig. 3(d)) shows the presence of GO sheets connected with PPY nanotubes using ZnO/SnO2 nanoflower, as depicted in Fig. 3(d). EDS mapping images (Fig. 3(e–i)) of ZnO/SnO2 nanoflower composites also confirm the presence of ZnO in the ZnO/SnO2 nanoflower composite. EDS elemental analysis shows the percentage contributions of zinc and tin oxygen elements in the ZnO/SnO2 nanoflower composite. This confirms the ZnO nanoparticle present in the ZS/GP nanocomposite.
4.4 TEM study
Through the TEM study, structural analyses of PPY nanotube, ZnO/SnO2 nanoflower, and ZS/GP nanocomposites were performed. The TEM image of a 1D hollow PPY nanotube with an average diameter of 97 nm is shown in Fig. 4(a). Under high pressure and temperature, hydrothermal conditions enable the hierarchical flower-like architectures of ZnO/SnO2 nanocrystals produced during nucleation to self-assemble into SnO2 nanosheets. According to Fig. 4(c), the ZS/GP2 nanocomposite's TEM picture reveals that the PPY nanotube is attached to a ZnO/SnO2 nanoflower and that the tube's average diameter increases as a result of the composite's development (Fig. 4(c)).42 Fig. 4(d) displays the SAED Pattern ZS/GP nanocomposite. In the presence of GO, ZnO nanoparticle aggregation is reduced, increasing the surface area of the composite material.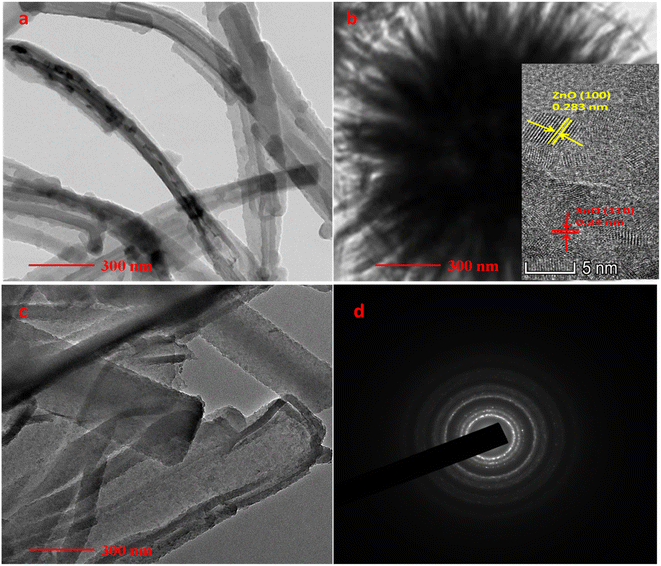 | ||
| Fig. 4 TEM images of PPY nanotubes (a), ZnO/SnO2 nanoflower (b), ZS/GP nanocomposites (c), and SAED pattern of ZS/GP nanocomposite (d). | ||
5 Electrochemical studies of PPY nanotube, ZnO/SnO2 nanoflower and ZS/GP nanocomposite
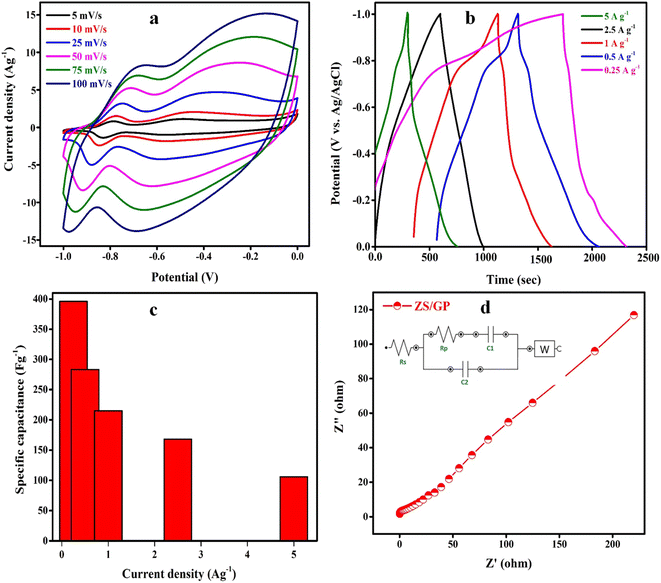
The electrochemical studies of the prepared ZS/GP nanocomposite are evaluated using a multichannel Metrohm Autolab 204 electrochemical analyzer at room temperature in 3 M KOH as an electrolytic medium. In the three electrode systems, the potential was determined with respect to calomel as the reference electrode and platinum as the counter electrode. The working electrode was fabricated by mixing the synthesized ZS/GP nanocomposite (90%), polyvinylidene fluoride (PVDF, 5 wt%) and N-methyl pyrrolidine (NMP) (5 wt%) solution, which was later coated on nickel foam (1 cm × 1 cm) as the current collector. The electrode was then dried at 60 °C overnight; then, the electrode was weighed to measure the electrode material, which was approximately 0.0026 g. The electrochemical performance was monitored using techniques such as cyclic voltammetry (CV), galvanostatic charge–discharge (GCD) and electrochemical impedance spectroscopy (EIS) carried out at room temperature.Fig. 5(a) shows the CV curves of the prepared ZS/GP nanocomposite at different scan rates ranging from 5 to 100 mV s−1. As the scan rate increased, the CV peaks showed variations in the pattern, thereby showing the interaction of the electrode material and ions.37 The CV shape is not distorted to a greater extent, while the peak current is shown to increase because the volumetric ZS/GP nanocomposite exhibited a current density value of 14.2 A g−1, indicating its capacitive nature. As the scan rate increases, the area of the CV curve increases because a higher scan rate of diffusion is more than the rate of reaction. During cyclic voltammetry, the working electrode's potential is swept back and forth between two specified values, causing oxidation and reduction reactions to occur at the electrode surface. The current response is recorded, and these data can provide insights into the composite nanoparticle redox properties, stability, and other electrochemical characteristics. In the case of ZnO and SnO2 composites, the specific redox reactions depend on the oxidation states of zinc (Zn) and tin (Sn) in the nanoparticles. ZnO can undergo reversible redox reactions involving the conversion between Zn2+ and Zn metal, while SnO2 can undergo similar redox reactions involving Sn4+ and Sn2+.
The GCD curves of charge–discharge of ZS/GP electrode material are shown in Fig. 5(b). From the data, it is clear that as we increase the current density from 0.25 A g−1 to 5 A g−1, the discharge time decreases because at a higher current density, less time is required to build the same voltage and all the curves are triangular, showing excellent reversibility and capacitive nature. The specific capacitance of the ZS/GP nanocomposite material was obtained from the GCD data, as shown in Fig. 5(c). It is noted that as the specific capacitance value drops, the current density increases. The maximum specific capacitance achieved by ZS/GP nanocomposite is 396.12 F g−1. At 5.0 A g−1, the specific capacitance exhibited by the ZS/GP nanocomposite is about 106 F g−1. The decrease in specific capacitance at higher values of current density is caused by the ESR drop (otherwise known as internal resistance) and the electrochemical kinetics, as the nanocomposite could not efficiently participate in electrochemical reactions at higher current densities. Further, the internal resistance of the prepared nanocomposite was studied using the Nyquist plot, as depicted in Fig. 5(d). The EIS is measured from 100 kHz to 0.1 Hz. The small semicircle at a lower frequency (0–1 ohm) range indicates the presence of charge transfer resistance. The inclined line that follows the semicircle at a higher frequency region suggests the diffusion of ions in the electrolyte–electrode interface. The synthesized ZS/GP nanocomposite shows less charge transfer resistance, indicating the charge–discharge rate of the electrode material.
The asymmetric CR2032 type coin cells were fabricated with PVA-KOH gel electrolyte using ZS/GP composite as the positive electrode and Caesalpinia sappan pod-based microporous carbon as the negative electrode separated by glass microfiber filter paper (Whatman®, GF/A) in PVA/KOH gel electrolyte. Polyvinyl alcohol (PVA)-KOH was used as the gel electrolyte and ZS/GP served as the active material. The gel electrolyte was made by dissolving 3.0 g of PVA in 30 ml of distilled water while stirring continuously at 80 °C and then gradually adding 3.0 g of KOH until a homogenous dispersion was achieved. PVA-KOH suspension was applied to both ZS/GP +ve and microporous carbon −ve electrodes for 20 minutes. Afterwards, by leaving the electrodes at room temperature for 12 hours, the water is allowed to evaporate. This solidifies the gel that was crimped at 100 kg cm−2 to fabricate the final device. The active mass of the ZS/GP electrode was 0.00261 g, and the microporous carbon negative electrode was 0.00252 g. The full cell weight is 0.00513 g, and the half-cell weight is 0.002565 g.
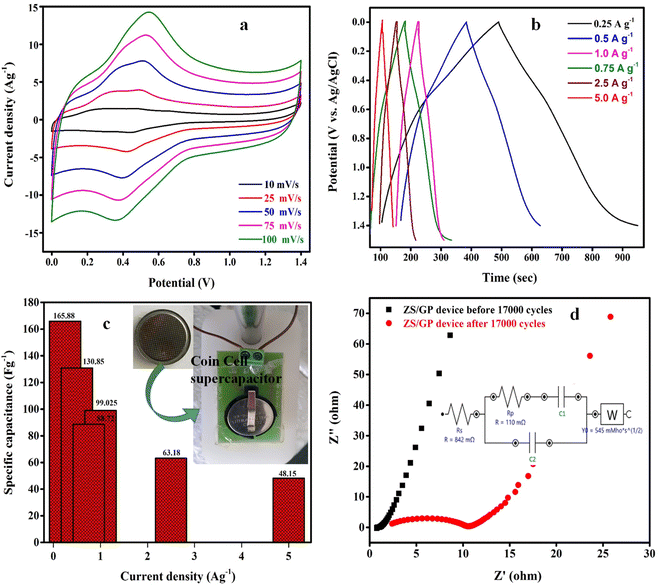
Fig. 6(a–d) illustrates the analysis of electrochemical properties by a two-electrode system using the CV, GCD, and EIS methodologies. As illustrated in Fig. 6(a), the CV curves of the ZS/GP asymmetric supercapacitor device were created using a potential range of 0–1.4 V and scan rates ranging from 10 to 100 mV s−1. Due to the high interfacial interaction between the hybrid materials and their effective synergistic effect in nanostructured materials, the CV curve exhibits both EDLC and pseudocapacitive characteristics, indicating that the device is hybrid. The excellent capacitive nature of different scan rates is displayed by a minor change in the oxidation peaks as the scan rate increases, demonstrating the material's extremely stable electrochemical behaviour. Fig. 6(b) shows the GCD curves for the ZS/GP asymmetric device that were obtained in the potential range of 0–1.4 V with various current densities ranging from 0.25 to 5 A g−1. The charge transfer diffusion coefficient is constrained as the current density increases, which reduces the discharge time. All triangle-shaped GCD curves exhibit capacitive behaviour. The modest voltage drop in the GCD curve shows good coulombic efficiency and excellent electrochemical reversibility.
The ZS/GP asymmetric device displays a specific capacitance of 165.88 F g−1 at current densities of 0.25 A g−1 and 48.15 F g−1 at CDs of 5 A g−1, demonstrating the material's outstanding storage stability. The Csp of the ZS/GP device is shown in Fig. 6(c) at various current densities. Due to the insufficient redox reaction in the material, the specific capacitance declines as the current density increases from 0 to 5 A g−1. The EIS analysis of a ZS/GP device in the frequency range of 100 kHz–0.1 Hz on various impedances (80 kHz–120 kHz) is shown in Fig. 6(d). An almost vertical line with low diffusion resistance shows the best supercapacitive behavior. The inset of Fig. 6(d) shows the Randles circuit model used to fit the EIS spectra of the device after 17k cycles. The Rp value of the symmetric ZS/GP device is found to be 0.110 Ω with a solution resistance of 0.842 Ω. These remarkable results show that the ZS/GP asymmetric device exhibits a promising potential for storage device applications. The CSPCN8 symmetric cell showed a specific capacitance of 142 F g−1 at 1.4 V with an energy density of 9.7 W h kg−1 (published in the Journal of energy storage).23 The maximum specific capacitance obtained for the asymmetric device is around 165.88 F g−1 at 1.4 V. Although the increase in capacitance is around 18% when it is clubbed with a 0.2 V increase in voltage, it might enhance the energy density.
The energy and power density plot of the ZS/GP device was calculated from the GCD profiles using eqn (3) and (4), as shown in Fig. 7(a). As shown in Fig. 7(b), the charge/discharge efficiency can be calculated by applying the following formula: η = tD/tC × 100%, where η is coulombic efficiency and tD and tC are the discharge and charge times in second, respectively.43 The constructed ASCs had a great specific capacitance of 165.88 F g−1 at 1.4 V, 5.12 W h kg−1 of energy density, and 2672 W kg−1 of power density. With a current density of 5 A g−1, the developed nanocomposite material for ASCs displayed cycle stability of 17k cycles. The research showed that the ZS/GP nanocomposite electrode material is ideal for supercapacitor applications. With a coulombic efficiency of 97% and capacitance retention of 73%, the ASC device's extended cycle life experiments for 17k cycles showed the potential of the electrode materials used as energy storage.
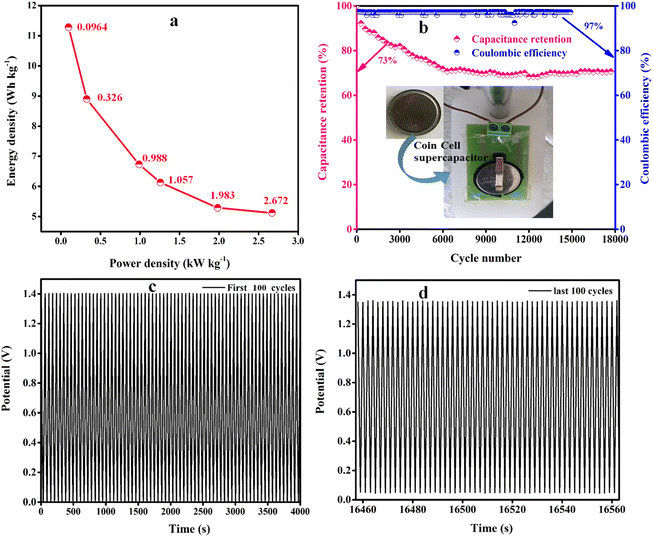 | ||
| Fig. 7 (a) Ragone plots showing the energy vs. power density. (b) capacitance retention. Coulombic efficiency vs. cycle number, and (c and d) cycle stability of device up to 17k cycles. | ||
When paired with PPY's conductive properties and GO's high surface area and good electrical conductivity (although lower than graphene), the composite's overall conductivity is enhanced. By acting as a support matrix, GO aids in the uniform dispersion of PPY and inhibits aggregation. Because of GO's huge surface area, there are more active sites available for PPY to be deposited, resulting in a composite with a greater active surface area. GO can assist the composite in creating a porous structure that improves ion diffusion. This is crucial for high-rate charge/discharge performance.
ZnO-deposited SnO2 nanoflowers have a flower-like morphology that gives them a high surface area, which is advantageous for energy storage applications. Because of this structure, PPY may be distributed more evenly throughout the nanoflowers, increasing the electrode/electrolyte interface and specific capacitance. By adding more charge carriers and narrowing SnO2's band gap, ZnO increases the composite's conductivity. ZnO-doped SnO2 nanoflowers help form a composite with better electrical conductivity than PPY alone or even PPY mixed with undoped SnO2 when combined with the conductive polymer PPY. ZnO-doped SnO2 nanoflowers and PPY work together to produce synergistic effects that increase the composite's total capacitance. Although PPY offers conductive paths and extra charge storage, the metal oxides contribute to pseudocapacitance.
Due to the quick and reversible redox reactions at its surface, PPY displays pseudocapacitance. This results in a larger specific capacitance because PPY can store charge chemically and electrostatically, similar to electric double-layer capacitors. When paired with other substances, such as graphene, metal oxides, or carbon nanotubes (CNTs), PPY can improve the composite's overall electrical conductivity. Sustaining high power density and efficiency requires this combination. These factors contribute to a high-performance supercapacitor material that can store more energy, deliver power more efficiently, and maintain its performance over a longer period.
The energy metrics attained for several of the carbon-based electrodes made from biomass and metal oxide/polymer composites are shown in Table 1.
| Electrode material | Negative electrode | Electrolyte | Specific capacitance (F g−1) | Energy density (W h kg−1) | References |
|---|---|---|---|---|---|
| (ZnO/SnO2) | ZnO/SnO2@NF//AC@NF | 3 M KOH | 133 | 47.28 | 44 |
| MoS2,/SnO2 | — | 2 M KOH | 61.6 | — | 45 |
| SnO2/RGO | N doped graphene | 2 M H2SO4 | 98.3 | 48.7 | 46 |
| NiCo2S4@ polypyrrole | Activated carbon | 3 M KOH | 97.37 | 34.62 | 47 |
| GCNSs (Garlic peel) | — | 3 M KOH | 119.2 | 32.6 | 48 |
| Pinecone | — | 1 M Na2SO4 | 137 | 19 | 49 |
| Cinnamon sticks CDC-1, CDC-2, CDC-3 | — | Organic electrolyte (NaClO4 in EC/DMC) | 158, 134, 151 | ∼70, 66, 68 | 50 |
| Caesalpinia pods based porous carbon | — | PVA/KOH gel | 142 | 9.7 | 23 |
| ZS/GP nanocomposite | Porous carbon | PVA/KOH gel electrolyte | 165.88 | 5.12 | Our work |
A single hydrothermal process was used to create a honeycomb-like ZnO/SnO2 nanocomposite on nickel foam (NF) to achieve high electrochemical performance.44 After 4000 GCD cycles, an asymmetric supercapacitor (ASC, ZnO/SnO2@NF//AC@NF) showed maximum Cs of 133 F g−1 with 92.8% retention. The computed power density was 10.4 kW kg−1 and the energy density was 47.28 W h kg−1. The MoS2 nanosheets serve as the support structure of the SnO2 nanoparticles.45 Cyclic voltammetry and galvanostatic charge–discharge experiments are used to assess the SnO2 nanoparticle- and MoS2 nanosheet-based nanocomposite electrode materials. According to the calculations, the MoS2–SnO2 nanocomposite has a specific capacity of 61.6 F g−1, which is 4.4 times greater than that of pure SnO2 nanoparticles. An asymmetric supercapacitor having SnO2/RGO (ref. 46) has been shown to operate under a wide working potential window of up to 1.8 V and exhibit a high energy density of 48.7 W h kg−1, and excellent electrochemical stability in 2 M H2SO4 aqueous electrolyte. NiCo2S4@PPy-50/NF was used as the positive electrode in the construction of the asymmetric supercapacitor, and activated carbon (AC) served as the negative electrode. The resulting NiCo2S4@PPy-50/NF//AC device demonstrates good cycling performance (80.64% of the initial capacitance retention at 50 mA cm−2 over 2500 cycles) and a high energy density of 34.62 W h kg−1 at a power density of 120.19 W kg−1.
In comparison to some of the earlier efforts, the obtained specific capacitance of the ZS/GP asymmetric device is significantly higher. The obtained energy values for the ZS/GP device are shown in Table 1. The significance of the current work was the use of bio-waste-based carbonaceous material instead of carbon-based negative electrodes, which are conventionally used. The results showed good capacitance value, energy and power density for the device application. This is a bold step toward converting bio-waste materials into useful products, thereby reducing pollution in the environment.
6 Conclusions
In summary, the in situ chemical synthesis and hydrothermal techniques were used for the preparation of ZS/GP nanocomposite and examined as a supercapacitor electrode. The fabricated electrode exhibits a higher Csp, excellent performance, and better cycle stability of up to 17k cycles due to the synergistic effects between the ZnO, SnO2 nanoflower, and GO in the polymer composites. The asymmetric CR2032-type coin cells were fabricated with PVA-KOH gel electrolyte using ZS/GP composite as the positive electrode and Caesalpinia sappan pod-based microporous carbon as the negative electrode, separated by applying glass microfiber filter paper in PVA/KOH gel electrolyte, and their performance was investigated. The asymmetric device's highest specific capacitance is around 165.88 F g−1 at 1.4 V, with an energy density of 5.12 W h kg−1 and a power density of 2672 W kg−1. This research showed that the ZS/GP nanocomposite electrode material is ideal for supercapacitor applications. Experiments on the ASC device's prolonged cycle life for 17k cycles led to results with 97% coulombic efficiency and 73% capacitance retention. The energy density and power density may be further increased by changes to the synthesis mechanism and the development of an electrolyte system that is more effective. Consequently, this study presents a method for producing sustainable energy from abundant and renewable wastes.Data availability
Data supporting this study are available from the authors upon request.Conflicts of interest
There are no conflicts to declare.Acknowledgements
The authors acknowledge the Centre for Nanoscience and Engineering (CeNSE), Indian Institute of Science (IISc), Bangalore, for providing the FESEM facility. The authors acknowledge the CHRIST (Deemed to be University) management, for the research fellowship to carry out the research work. One of the author Gurumurthy Hegde thank Center for Research Projects, CHRIST (Deemed to be University) for providing the seed money grant with file number SMSS-2214. Author ANA acknowledges Researchers Supporting Project Number (RSP2024R304), King Saud University, Riyadh, Saudi ArabiaReferences
- P. Simon and Y. Gogotsi, Acc. Chem. Res., 2013, 46, 1094–1103 CrossRef CAS.
- W. Smith, J. Power Sources, 2000, 86, 74–83 CrossRef CAS.
- G. Crabtree, E. Kócs and L. Trahey, MRS Bull., 2015, 40, 1067–1078 CrossRef CAS.
- L. Yang, G. Liang, H. Cao, S. Ma, X. Liu, X. Li and R. Che, Adv. Funct. Mater., 2022, 32, 2105026 CrossRef CAS.
- L. Yang, X. Xiong, G. Liang, X. Li, C. Wang, W. You and R. Che, Adv. Mater. Lett., 2022, 34, 2200914 CrossRef CAS PubMed.
- G. Liang, L. Yang, X. Xiong, K. Pei, X. Zhao, C. Wang and R. Che, Adv. Funct. Mater., 2022, 32, 2206129 CrossRef CAS.
- G. Liang, X. Xiong, L. Yang, X. Liu and R. Che, J. Mater. Chem. A, 2021, 9, 25663–25671 RSC.
- G. Liang, L. Yang, X. Xiong, X. Liu, X. Zhang and R. Che, J. Mater. Chem. A, 2022, 10, 23675–23682 RSC.
- A.-T. Hoang, V. V. Pham and X. P. Nguyen, J. Cleaner Prod., 2021, 305, 127161 CrossRef.
- K. Sharma, A. Arora and S.-K. Tripathi, J. Energy Storage, 2019, 21, 801–825 CrossRef.
- J.-S. Jayan, A. Saritha and K. Joseph, Int. J. Res., 2022, 663–695 Search PubMed.
- E.-E. Miller, Y. Hua and F.-H. Tezel, J. Energy Storage, 2018, 20, 30–40 CrossRef.
- V.-K. Mariappan, K. Krishnamoorthy, P. Pazhamalai, S. Sahoo, S. S. Nardekar and S.-J. Kim, Nano Energy, 2019, 57, 307–316 CrossRef CAS.
- X. Zang, C. Shen, M. Sanghadasa and L. Lin, ChemElectroChem, 2019, 6, 976–988 CrossRef CAS.
- N. Choudhary, C. Li, J. Moore, N. Nagaiah, L. Zhai, Y. Jung and J. Thomas, Adv. Mater., 2017, 29(21), 1605336 CrossRef PubMed.
- W. Liu, R. Yin, X. Xu, L. Zhang, W. Shi and X. Cao, Adv. Sci., 2019, 6, 1802373 CrossRef.
- Z.-Y. Wu, H.-W. Liang, L.-F. Chen, B.-C. Hu and S.-H. Yu, Acc. Chem. Res., 2016, 49, 96–105 CrossRef CAS.
- S. Zhou, L. Zhou, Y. Zhang, J. Sun, J. Wen and Y. Yuan, J. Mater. Chem. A, 2019, 7, 4217–4229 RSC.
- Z. Bi, et al., J. Mater. Chem. A, 2019, 7, 16028–16045 RSC.
- A. Divyashree and G. Hegde, RSC Adv., 2015, 5, 88339–88352 RSC.
- A. Gupta and J. P. Verma, Renewable Sustainable Energy Rev., 2015, 41, 550–567 CrossRef CAS.
- K. Qu, et al., J. Colloid Interface Sci., 2022, 616, 584–594 CrossRef CAS PubMed.
- V.-S. Bhat, A. Toghan, G. Hegde and R. S. Varma, J. Energy Storage, 2022, 52, 104776 CrossRef.
- Y. S. Nagaraju, H. Ganesh, S. Veeresh, H. Vijeth, M. Basappa and H. Devendrappa, J. Electroanal. Chem., 2021, 900, 115741 CrossRef CAS.
- A. Ali, M. Ammar, Z. Yahya, M. Waqas, M. A. Jamal and E. H. M. Salhabi, New J. Chem., 2019, 43, 10583–10589 RSC.
- V. Shanmugapriya, S. Arunpandiyan, G. Hariharan, S. Bharathi, B. Selvakumar and A. Arivarasan, J. Alloys Compd., 2023, 935, 167994 CrossRef CAS.
- S. Chakraborty, A. Raj and N.-L. Mary, J. Energy Storage, 2020, 28, 01275 Search PubMed.
- S. Ito, Y. Makari, T. Kitamura, Y. Wada and S. Yanagida, J. Mater. Chem., 2004, 14, 385–390 RSC.
- Y.-S. Nagarajua, H. Ganesha, S. Veeresha, H. Vijeth, M. Basappaa and H. Devendrappaa, J. Electroanal. Chem., 2021, 900, 115741 CrossRef.
- K. Namsheer and C. S. Rout, RSC Adv., 2021, 11, 5659–5697 RSC.
- S. Ishaq, et al., Sci. Rep., 2019, 9, 1–11 CrossRef CAS.
- N. Wang, et al., J. Alloys Compd., 2020, 835, 155299 CrossRef CAS.
- M.-A. Chougule, S. G. Pawar, P.-R. Godse, R. N. Mulik, S. Sen and V.-B. Patil, Soft Nanosci. Lett., 2011, 1, 6–10 CrossRef CAS.
- N.-I. Zaaba, K.-L. Foo, U. Hashim, S.-J. Tan, W.-W. Liu and C.-H. Voon, Procedia Eng., 2017, 184, 469–477 CrossRef CAS.
- Z. Ahmad, M.-A. Choudhary, A. Mehmood, R. Wakeel, T. Akhtar and M.-A. Rafiq, Macromol. Res., 2016, 24, 596–601 CrossRef CAS.
- X. Dou, D. Sabba, N. Mathews, L.-H. Wong, Y.-M. Lam and S. Mhaisalkar, Chem. Mater., 2011, 233938–233945 Search PubMed.
- K. Li, et al., Nat. Commun., 2019, 10, 1–10 CrossRef.
- M. Šetka, R. Calavia, L. Vojkůvka, E. Llobet, J. Drbohlavová and S. Vallejos, Sci. Rep., 2019, 9, 1–10 CrossRef.
- M. Trchová and J. Stejskal, J. Phys. Chem. A, 2018, 122, 9298–9306 CrossRef.
- Q. Wei, P. Song, Z. Li, Z. Yang and Q. Wang, Mater. Lett., 2017, 191, 173–177 CrossRef CAS.
- H.-K. Chitte, G.-N. Shinde, N.-V. Bhat and V.-E. Walunj, J. Sens. Technol., 2011, 1, 47–56 CrossRef CAS.
- J. Hu, X. Li, X. Wang, Y. Li, Q. Li and F. Wang, J. Mater. Res., 2018, 33, 1433–1441 CrossRef CAS.
- A.-J. Smith, J.-C. Burns and J.-R. Dahn, Electrochem. Solid-State Lett., 2010, 13, A177 CrossRef CAS.
- A. Ali, M. Ammar, Z. Yahya, M. Waqas, M.-A. Jamal and E. H. M. Salhabi, New J. Chem., 2019, 43, 10583–10589 RSC.
- C. Prabukumar, M.-M. Sadiq, D.-K. Bhat and K.-U. Bhat, Mater. Res. Express, 2019, 6, 085526 CrossRef CAS.
- F.-N.-I. Sari and J.-M. Ting, Surf. Coat. Technol., 2016, 303, 176–183 CrossRef CAS.
- M. Yan, et al., ACS Appl. Mater. Interfaces, 2016, 8, 24525–24535 CrossRef CAS.
- V.-S. Bhat, P. Kanagavalli, G. Sriram, R. Prabhu, N.-S. John, M. Veerapandian, M. Kurkuri and G. Hegde, J. Energy Storage, 2020, 32, 101829 CrossRef.
- A. Bello, N. Manyala, F. Barzegar, A.-A. Khaleed, D.-Y. Momodu and J.-K. Dangbegnon, RSC Adv., 2015, 6, 1800–1809 RSC.
- R. Thangavel, K. Kaliyappan, H.-V. Ramasamy, X. Sun and Y.-S. Lee, ChemSusChem, 2017, 10, 2805–2815 CrossRef CAS.
| This journal is © The Royal Society of Chemistry 2024 |

