 Open Access Article
Electrochemical performance and structural evolution of spray pyrolyzed Mn3O4 thin films in different aqueous electrolytes: effect of anions and cations†
Pramitha Adoor.a,
Shreeganesh Subraya Hegde b,
Badekai Ramachandra Bhat
 b,
Sajan D. George
 c and
Raviprakash Yeenduguli
 *a
*a
aSemiconductor and Photovoltaics Lab, Department of Physics, Manipal Institute of Technology, Manipal Academy of Higher Education, Manipal 576104, Karnataka, India. E-mail: raviprakash.y@manipal.edu
bCatalysis and Materials Chemistry Laboratory, Department of Chemistry, National Institute of Technology Karnataka, Surathkal, Mangalore 575025, Karnataka, India
cCentre for Applied Nanosciences, Department of Atomic and Molecular Physics, Manipal Academy of Higher Education, Manipal, 576104, Karnataka, India
First published on 18th September 2024
Abstract
This work presents the impact of cycling in different cationic and anionic aqueous electrolytes on the electrochemical storage performance of the Mn3O4 thin film electrode prepared using the chemical pyrolysis method. Studies on the as-deposited electrode confirmed the formation of Mn3O4 phase. Extensive electrochemical analysis was performed using Na2SO4, NaCl, Li2SO4, K2SO4, and MgSO4 electrolytes to examine the influence of cations and anions on charge storage behaviour. Considerable changes were observed in the specific capacitances owing to different ionic sizes as well as hydrated ionic radius of the electrolyte ions. Accordingly, the electrode unveiled a good performance showing a specific capacitance of around 187 F g−1 at 0.5 A g−1 in K2SO4 electrolyte. Further, the electrode properties are examined after 500 CV cycles to trace the changes in the structural and morphological properties. X-ray diffraction (XRD) and Raman spectroscopic studies illustrate a partial phase transformation of electrodes from Mn3O4 to MnO2 irrespective of the electrolytes. These results are further corroborated with X-ray photoelectron spectroscopic (XPS) analysis where there was an increment in the oxidation state of manganese. It has been observed that the surface properties were significantly changed with cycling, as manifested by the wettability studies of the electrodes. The obtained results brings out the significance of electrolyte ions on the charge storage characteristics of Mn3O4 thin film electrodes in light of their possible application in electrochemical capacitors.
1. Introduction
In the realm of energy storage, supercapacitors (SCs) or electrochemical capacitors (ECs) play a pivotal role owing to their high power density, high cyclic stability, fast charge/discharge rate, moderate energy density, etc.1–4 Compared to other frontrunners in the field, such as conventional capacitors and batteries, supercapacitors cover a large area on the Ragone plot, making them highly significant in the research community.5 From the viewpoint of storage mechanism, SCs are classified as electric double-layer capacitors (EDLCs), pseudocapacitors (PCs), and hybrid capacitors.6 In EDLCs, storage is achieved through the electrostatic attraction of electrolyte ions on the electrode surface, which is a non-faradaic process. In contrast, PCs operate via fast redox reactions occurring at the interface of electrode and electrolyte, characteristic of faradaic processes. Hybrid capacitors synergistically incorporate both faradaic and non-faradaic processes, combining the benefits of electrostatic charge accumulation with rapid redox reactions.7–9 Transition metal oxides (TMOs) and conducting polymers are among the primary electrode options employed in pseudocapacitors.10,11 TMOs are particularly advantageous due to their cost effectiveness, superior electrical conductivity, as well as excellent electrochemical stability, and the potential to afford higher energy density.12 Additionally, TMOs exhibit a variety of oxidation states and possess rich redox chemistry, enabling diverse and efficient energy storage mechanisms.13 To date, various studies have been performed on many TMOs to assess their suitability as potential electrode materials. Among these, manganese oxide is regarded as one of the promising candidate as it has very good electrochemical behaviour alongside their cost-effectiveness and environmental friendliness.14,15 They have a variety of phases due to their multiple oxidation states, among which Mn3O4 (hausmannite) is most stable at higher temperatures. Mn3O4 usually finds applications in catalysis, Li-ion batteries, supercapacitors etc.16–19 Moreover, the mixed valence of Mn2+ and Mn3+ in Mn3O4 results in rich redox chemistry with high theoretical capacitance.20,21However, it is a familiar fact that the specific capacitance of an electrode is also altered by the type of electrolyte used.22–24 It has been observed that electrodeposited Mn3O4 exhibited great pseudocapacitance and stability over a potential window of −0.1 V to 1 V in 1 M Na2SO4 compared to 1 M NaOH and 1 M KOH mixed with 0.04 M K4Fe (CN)6. 25 This is because, when Na2SO4 is used as the electrolyte, the phase has been altered from tetragonal Mn3O4 to tetragonal MnO2 with a significant change in the morphology as well. On the other hand, Mn3O4 on carbon cloth (CC) showed higher specific capacitance and low resistance in KOH, while better rate capability and cyclic stability in Na2SO4. 26 The low resistance in KOH is attributed to its better ionic conductivity as compared to Na2SO4. In another work, the electrolyte cation effect was tested on the electrochemical activation of the Mn3O4 electrode prepared through the hydrothermal method.27 The electrode exhibited different activation or phase transitions in Li2SO4, MgSO4, and K2SO4 electrolytes. A reasonably good capacitive performance was observed in K2SO4, whereas poor cyclic stability was noticed in MgSO4. Similarly, Mn3O4 nanoparticles showed enhanced electrochemical performance in KOH electrolyte when compared with KCl because of the lesser anion size of OH− than that of Cl−.28 Thus, it is evident that both anion and cation of the electrolyte can effectively determine the storage performance.
The charge storage mechanism in Mn3O4 involves surface redox reactions with electrolyte ions. Many studies have been done on predicting the storage mechanism in Mn3O4. Previously, it was seen that, during charging Mn3O4 nanofibers will transform into NaδMnOx·nH2O through surface adsorption of solvated ions.29 Mn3O4 thin films treated at a high temperature (900 °C) showed a phase transformation to a layered birnessite structure by cycling in Na2SO4 electrolyte.30 This transformation brought a significant change in the specific capacitance owing to the electrochemical activation. Thus a significant research emphasis has been on the study of phase transformation upon cycling.31–33 However, the impact of different electrolytes in the phase transformation is rarely investigated. On the other hand, Mn3O4 has been synthesized in various forms including different nanostructures and thin films.34–37 Most of the nanostructures are in powder form which imposes the use of binders that cause extra resistance and stability issues with the current collector.38 To avoid these limitations, thin film electrodes are gaining attention which ensures good stability and shorter ion diffusion length with good charge transport.39 In this direction, different synthesis techniques were explored for the preparation of Mn3O4 thin films, involving, physical methods as well as chemical methods.40–44 Spray pyrolysis is a low-cost, chemical, and solution-based technique that has a high demand when it comes to industrial purposes.45 However, deposition technique significantly impact the electrode properties, mainly the morphology and other surface parameters, and to the best of our knowledge, no studies have reported on the electrochemical properties of spray-pyrolyzed thin films in different electrolytes.
From this perspective, this work focuses on understanding the consequences of various aqueous electrolytes on the electrochemical behaviour of Mn3O4 thin film electrodes synthesized using the chemical spray pyrolysis technique. To realize a better understanding, some of the characterizations were done that promote the interpretation of electrode properties before and after electrochemical testing. Subsequently, the structural and morphological changes brought by the electrochemical testing in different electrolytes were presented.
2. Experimental
All the chemicals utilised were of analytical grade and used without further purification. Mn3O4 thin film electrodes were deposited over the conducting fluorine-doped tin oxide (FTO) coated glass substrate employing spray pyrolysis technique as described in our previous work.46 Initially, the substrate was subjected to cleaning through ultrasonication in isopropyl alcohol and then by UV-Ozone treatment for a time interval of 10 min. Manganese acetate tetrahydrate (Mn(CH3COO)2·4H2O) (Sigma-Aldrich, ≥99%) was dissolved in double distilled water to make the optimized molar concentration of 0.06 M and the solution was made to stir at room temperature. Meanwhile, the cleaned substrate was kept on the hot plate maintained at an optimized temperature of 325 °C. The precursor was sprayed on the hot substrate at a flow rate of 1 mL min−1 using compressed air at a pressure of 1 bar as the carrier gas. The spray nozzle to substrate distance was retained at 14.5 cm. The active mass loading of the film was observed to be around 0.4 mg cm−2 and the film thickness was around 0.790 μm.47 Then the films were characterized to study their structural, topographical, morphological, elemental as well as electrochemical properties. A set of electrodes was then subjected to electrochemical testing in various aqueous electrolytes. The cyclic voltammetry (CV), galvanostatic charge/discharge (GCD), and electrochemical impedance spectroscopy (EIS) studies were performed in electrolytes with different anions (Na2SO4 and NaCl) as well as different cations (Li2SO4, MgSO4, and K2SO4). All the electrolytes were made to the concentration of 0.1 M using double distilled water.X-ray diffraction (XRD) pattern was acquired using Cu Kα radiation of wavelength, λ = 1.5405 Å within 2θ between 10° to 70° (Rigaku Miniflex 600) to probe the structural properties of the deposited film. Raman spectrum was obtained with the Renishaw-inVia Raman microscope at the excitation wavelength of 532 nm. Surface morphology studies were done using scanning electron microscopy (SEM) at an accelerating voltage of 5 kV (Oxford Zeiss Sigma Microscope). Further, compositional studies were carried out through energy dispersive spectroscopy (EDS) at an accelerating voltage of 15 kV. X-ray photoelectron spectroscopy (XPS) spectra were acquired using an Axis Supra spectrometer with a non-monochromatic source of Al Kα (hν = 1486.6 eV). CASAXPS was used for the analysis with Shirley background subtraction for the charge-corrected data. Additionally, a wettability test was done to measure the contact angle using a water droplet. All electrochemical characterizations (cyclic voltammetry (CV), galvanostatic charge/discharge (GCD), and electrochemical impedance spectroscopy (EIS)) were conducted using Metrohm, Autolab PGSTAT204 workstation in three-electrode setup with the as-prepared electrode as working electrode, Ag/AgCl as reference electrode and platinum as counter electrode. The CV tests were carried out at different scan rates ranging from 5 to 100 mV s−1, and the GCD analyses were conducted at current densities from 0.5 to 2 A g−1. The EIS measurements were conducted in the frequency range from 10 mHz to 1 MHz. All the measurements were done at ambient temperature.
3. Results and discussion
3.1. Characterizations of the electrode before cycling
The phase as well as crystal structure of the as-prepared electrode was validated using XRD. Fig. 1a depicts the XRD pattern of the Mn3O4 thin film coated over the FTO substrate. All the peaks were identified and indexed comparing with the standard JCPDS card (Mn3O4: 24-0734, FTO: 44-1445). The observed pattern resembles with the tetragonal phase of Mn3O4 with the space group 141/amd.48 Major peaks at 32.8° and 36.3° is due to the reflections from (103) and (211) planes respectively. However, intense reflections from the FTO substrates also appeared in the pattern owing to the higher penetration of X-rays. The crystallite size (D) was estimated utilizing Scherrer's equation:
 | (1) |
 | (2) |
 | (3) |
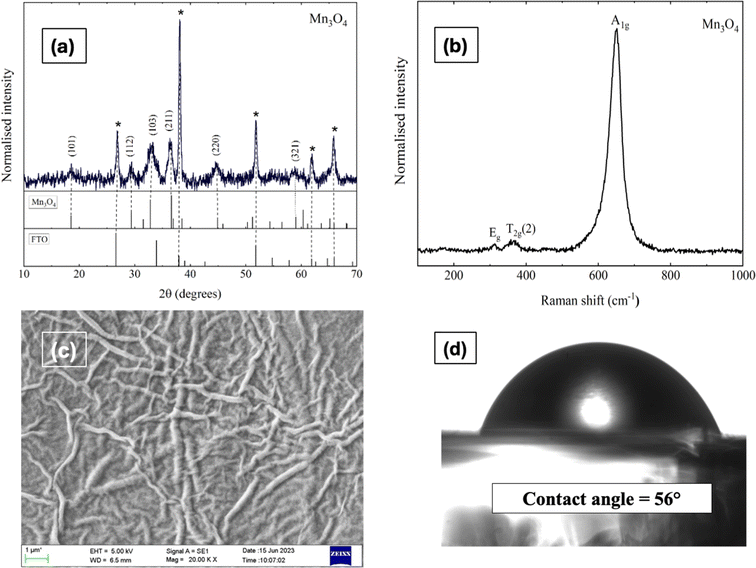 | ||
| Fig. 1 (a) X-ray diffractogram, (b) Raman spectra, (c) SEM micrograph (magnification: 20KX), and (d) contact angle measurement of Mn3O4 thin film electrode. | ||
The values obtained were approximately 12.9 × 10⁻³ and 1.4 × 10¹⁶ m−2 respectively.
Fig. 1b illustrates the Raman spectrum of the Mn3O4 electrode, revealing three characteristic vibrational modes indicative of spinel Mn3O4 formation. The peak with high intensity at 651 cm−1 (A1g mode) corresponds to the Mn–O symmetric stretching vibration, while the peaks at 310 cm−1 and 363 cm−1 (Eg and T2g(2) modes, respectively) are attributed to the asymmetric bending vibrations of the Mn–O bond. The phase purity of the deposited film is confirmed by the absence of additional peaks in the spectrum. Fig. 1c presents the SEM micrograph (Fig. S4† shows the images with different magnifications) of the Mn3O4 electrode, showcasing a fibre-like morphology with a uniform coating across the substrate, free of voids, cracks, or pinholes. Additionally, Fig. 1d displays the wettability test of the Mn3O4 thin film electrode surface, indicating its hydrophilic nature with a contact angle of around 56°.49
3.2. Electrochemical characterizations: effect of electrolyte anions and cations
The impact of different electrolyte anions and cations on the electrochemical performance of the synthesized Mn3O4 thin film electrodes was investigated using CV in a three-electrode setup. Na2SO4 and NaCl were chosen as electrolytes with different anions. Fig. 2a and b represent the CV curves of the Mn3O4 thin film electrodes in Na2SO4 and NaCl, respectively, over a potential window (PW) of −0.2 V to 0.8 V at different scan rates. The electrodes demonstrated pseudocapacitive behaviour in both electrolytes, with the current increasing with the scan rate, consistent with previous CV results obtained in Na2SO4.46 Fig. 2c compares the CVs at a scan rate of 5 mV s−1, showing no significant differences in shape or peak current values. From the figure, it is apparent that the oxidation and reduction processes were roughly similar in both electrolytes, regardless of the anions (SO42− and Cl−). The specific capacitance was estimated by making use of the following formula:
 | (4) |
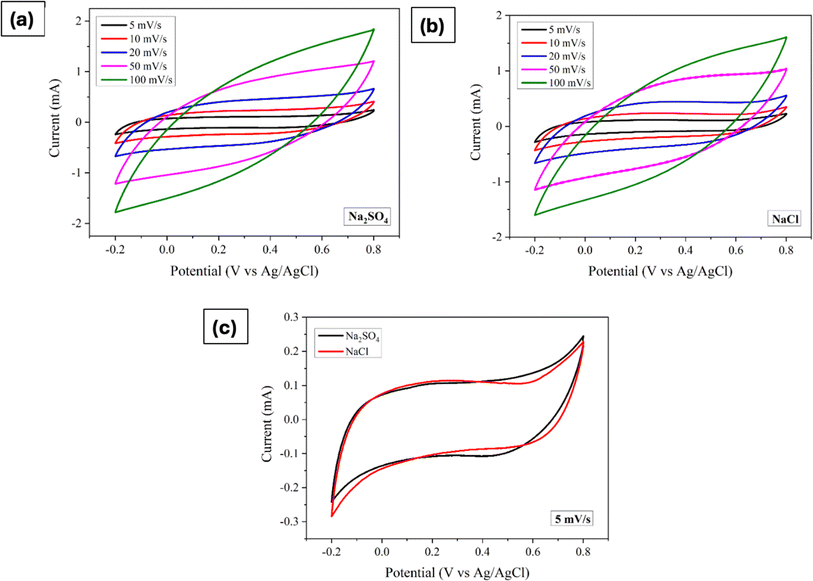 | ||
| Fig. 2 Cyclic voltammograms of Mn3O4 thin film electrode in (a) Na2SO4, and (b) NaCl. (c) Comparison of CVs at a scan rate of 5 mV s−1. | ||
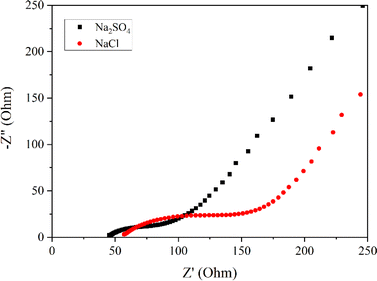
To delve into the kinetic differences induced by varying anions, electrochemical impedance spectroscopic studies were executed. Fig. 3 portrays the Nyquist plots of the Mn3O4 electrode in Na2SO4 and NaCl electrolytes. It is evident from the figure that the storage kinetics were notably superior in the Na2SO4 electrolyte, presenting lower solution resistance and charge transfer resistance compared to NaCl. Additionally, the slope or inclination of the curve in the lower frequency region, indicating the Warburg impedance related to the ion diffusion process, suggests excellent capacitive behaviour in the Na2SO4 electrolyte, despite the larger size of SO42− ions compared to Cl− ions. This trend may be ascribed to the higher concentration of Na+ ions in Na2SO4 compared to NaCl. Upon dissociation, Na2SO4 yields two Na+ ions and one SO42− ion, whereas NaCl yields only one Na+ ion and one Cl− ion. Given that these ions directly participate in redox reactions, the surplus of Na+ ions in Na2SO4 provides more opportunities for adsorption and redox reactions. Consequently, the electrode in Na2SO4 exhibits better storage behaviour compared to NaCl.
Furthermore, the GCD processes were investigated in Na2SO4 and NaCl electrolytes at various current densities, as depicted in Fig. 4a–c shows the comparison at a particular current density. The linear relation between the charge/discharge potential and time indicates good capacitive behaviour.50 The observed outcomes were found to be in good agreement with the findings obtained from CV and EIS analyses. The specific capacitance was derived from the GCD plot employing the following formula:
 | (5) |
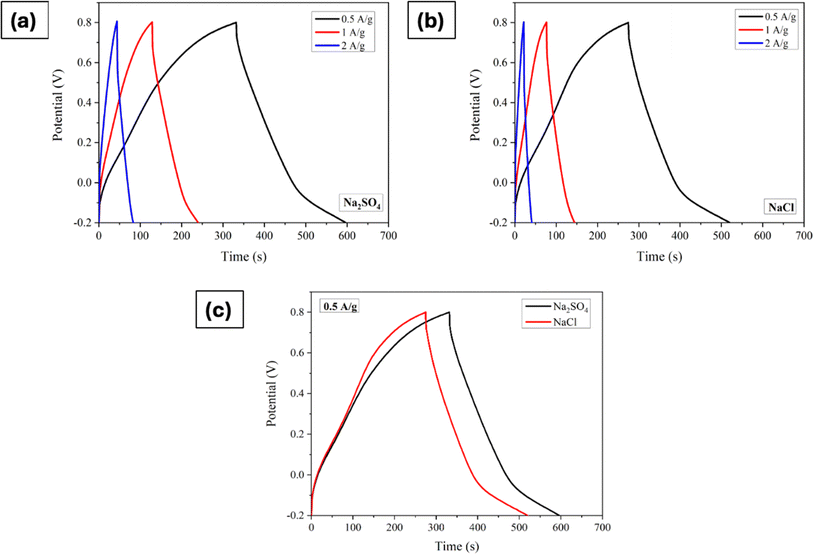 | ||
| Fig. 4 Galvanostatic charge/discharge curves of Mn3O4 thin film electrode in (a) Na2SO4, and (b) NaCl. (c) Comparison of GCDs at a current density of 0.5A g−1. | ||
Likewise, with anion fixed as sulphate ions, the influence of varying cations on electrochemical properties was investigated. Consequently, Li2SO4, MgSO4, and K2SO4 were employed as electrolytes, and Fig. 5a–d depicts the corresponding CVs obtained across a PW of −0.2 V to 0.8 V at different scan rates. Consistently, similar to the findings across different anions, all electrodes displayed pseudocapacitive behaviour, with the current trending increased with scan rate. Upon closer examination at a scan rate of 5 mV s−1, it becomes evident that K2SO4 electrolyte yielded the highest curve area, indicative of superior capacitive behaviour, while MgSO4 exhibited the lowest. This disparity in curve areas hints at varying degrees of charge storage capability among the different cationic species.
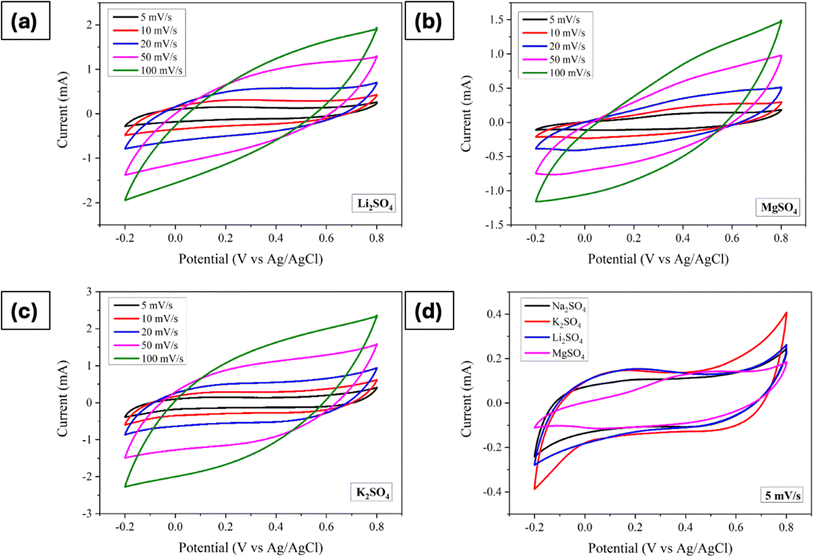 | ||
| Fig. 5 Cyclic voltammograms of Mn3O4 thin film electrode in (a) Li2SO4, (b) MgSO4, (c) K2SO4, and (d) comparison of CVs at a scan rate of 5 mV s−1. | ||
Further analysis of specific capacitance values, calculated using eqn (4), revealed distinct trends. The values varied as 94 F g−1, 112 F g−1, 132 F g−1 and 73 F g−1 for Na2SO4, Li2SO4, K2SO4, and MgSO4, respectively. This order of specific capacitance (K+ > Li+ > Na+ > Mg2+) can be rationalized by considering the ionic radii of these cations. Also, it is well known fact that, ions in the electrolyte are surrounded by water molecules, forming a hydration shell. The size of this hydration sphere impacts the ion's effective size. Larger hydration spheres can hinder ion mobility, thus slowing the charge transfer process at the electrode surface. Specifically, the larger size of K+ ions enables easier diffusion and adsorption owing to their smaller hydration sphere radius.28,51,52 Conversely, the lower specific capacitance observed in MgSO4 electrolytes may be attributed to the lower ionic size and higher hydration sphere radius of Mg2+ ions. However, an intriguing observation arises when comparing Na+ and Li+. Despite Na+ offering better ionic conductivity and a smaller hydration sphere compared to Li+, Li2SO4 demonstrated a higher specific capacitance. This discrepancy suggests that smaller size of Li+ may facilitate more favourable adsorption and desorption/intercalation processes. A comparable trend was seen for hydrothermally grown Mn3O4 on carbon cloth.26
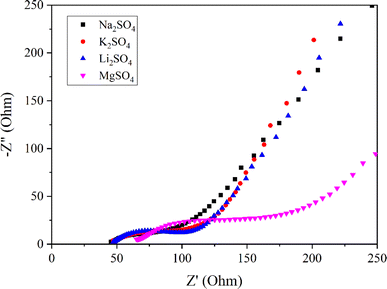
Fig. 6 presents Nyquist plots of the Mn3O4 thin film electrode in various electrolytes, obtained from the EIS experiments. The electrodes in Na2SO4, K2SO4, and Li2SO4exhibit a similar capacitive trend with a vertical profile in the low-frequency region, indicating low diffusion resistance. Nevertheless, a significant deviation is witnessed in the inclination of the vertical line for the MgSO4 electrolyte, suggesting its high ionic resistance. This can be related to the lower mobility of Mg2+ ions due to their large hydration sphere radius.53 Additionally, the high charge density of Mg2+ ions also results in strong electrostatic interactions with surrounding electrolyte molecules, contributing to the high solution resistance and charge transfer resistance observed for MgSO4.54
Fig. 7a–d displays the GCD curves of electrodes processed in electrolytes containing different cations with a comparison at a current density of 0.5 A g−1. The trends observed in the CV and EIS measurements are consistent here as well. Furthermore, it is apparent that the charge/discharge processes are linear with time irrespective of the cations. The specific capacitance values, determined using eqn (5), are 131 F g−1 for Na2SO4, 136 F g−1 for Li2SO4, 187 F g−1 for K2SO4, and 96 F g−1 for MgSO4 at 0.5A g−1.
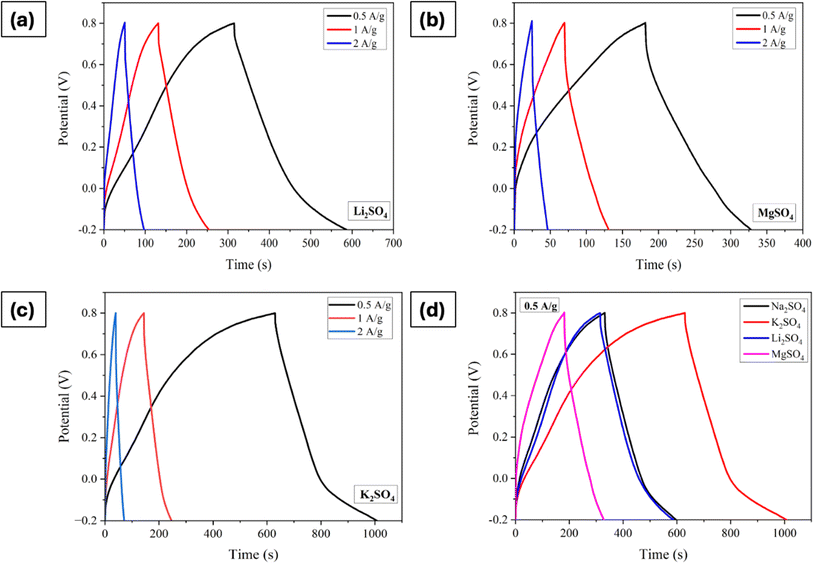 | ||
| Fig. 7 GCD curves of Mn3O4 thin film electrode in (a) Li2SO4, (b) MgSO4, (c) K2SO4, and (d) comparison of GCDs at a current density of 0.5 A g−1. | ||
3.3. Characterization of the electrodes after cycling
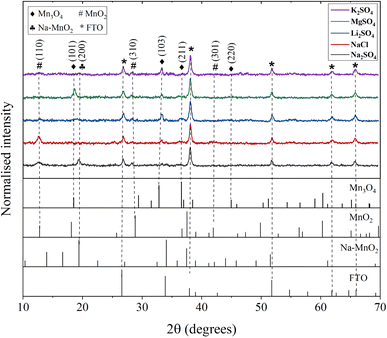
The electrode properties were further investigated post-cycling to assess the structural and morphological changes. The electrodes were cycled for 500 CV cycles at a scan rate of 50 mV s−1 and then subjected to various characterizations. Fig. 8 presents the XRD pattern of the electrodes after cycling in different electrolytes. As initially discussed with reference to Fig. 1, the electrode exhibited the Mn3O4 phase before cycling. However, cycling induced changes in the electrode structure, evidenced by a decrease in the intensities of the Mn3O4 planes. Additionally, new manganese oxide phases emerged, as reflected in the XRD patterns. For electrodes cycled in Na2SO4 electrolyte, MnO2, and Na–MnO2 (sodium birnessite) phases were detected, while in NaCl, only MnO2 phases were observed. Previous literature has reported the conversion of Mn3O4 to MnO2 (termed as electrochemical activation) after certain CV and GCD cycles.25,55,56 This phase transformation is due to the continuous redox reactions or intercalation/deintercalation of electrolyte ions within the spinel structure of Mn3O4.57 According to the studies, this electrochemical activation will generally enhance the specific capacitance by creating new adsorption sites.58 However, there was no complete phase transformation observed which might be due to the insufficient number of CV cycles.To further validate the partial phase transformations, Raman spectra of the processed/activated electrodes were examined. Fig. 9a–e presents the deconvoluted Raman spectra of electrodes that underwent 500 CV cycles in various electrolytes, with the peak positions summarized in Table 1. Significant differences were seen in the activated electrodes when compared to the Raman spectra of the electrode prior to cycling (shown in Fig. S1†). Notably, there are intense peaks at 640–645 cm−1, along with peaks at around 490 cm−1 and 580 cm−1, which are the features of vibrations in birnessite.27 The vibrational mode in the lower wavenumber region (P1) is associated with the external vibration caused by the translational motion of MnO6 octahedra.59 Additionally, there were significant shifts in the Eg and T2g(2) peaks, indicating variations in the Mn–O bending vibrations. These shifts are attributed to the formation of new phases during the electrochemical activation process.
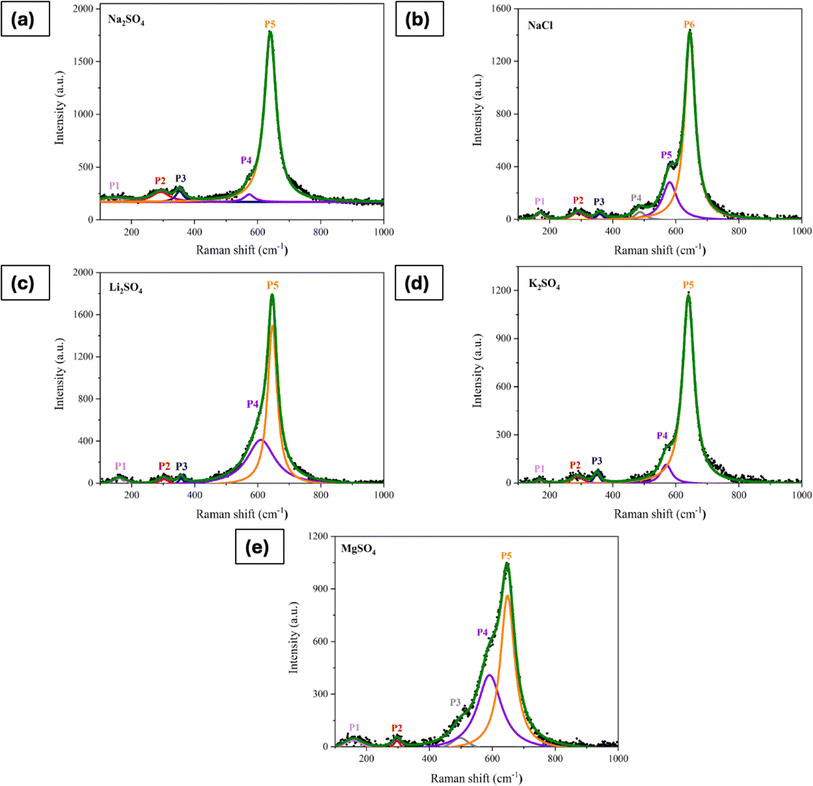 | ||
| Fig. 9 Raman spectra of electrode processed in (a) Na2SO4, (b) NaCl, (c) Li2SO4, (d) K2SO4, and (e) MgSO4 for 500 CV cycles at 50 mV s−1. | ||
| Mode | Peak position (cm−1) | |||||
|---|---|---|---|---|---|---|
| Before CV | Na2SO4 | NaCl | Li2SO4 | MgSO4 | K2SO4 | |
| Translational vibration of MnO6 octahedra | — | 141 | 168 | 161 | 157 | 167 |
| Eg | 310 | 292 | 290 | 300 | 296 | 287 |
| T2g (2) | 363 | 352 | 358 | 357 | — | 350 |
| — | — | — | 487 | — | 497 | — |
| — | — | 573 | 580 | 609 | 590 | 570 |
| Ag | 651 | 640 | 644 | 646 | 648 | 640 |
XPS survey spectra of the electrodes cycled in different electrolytes are shown in Fig. S3.† The spectra reveal the presence of Mn 2p, O 1s along with C 1s in all the samples. In addition to that, as a consequence of cycling some of the peaks related to Na, K, and Mg also appeared in their respective spectra indicating the presence of surface adsorbed ions. Further, auger peaks of Mn and O have appeared in the spectra around the binding energy (BE) of 903.7 eV and 972.4 eV respectively.
Further, Fig. 10a shows the high-resolution C 1s spectra, which have been resolved into three peaks resembling with C![[double bond, length as m-dash]](https://www.rsc.org/images/entities/char_e001.gif) C, C–O, and C
C, C–O, and C![[double bond, length as m-dash]](https://www.rsc.org/images/entities/char_e001.gif) O positioned in the rages of 284.46–284.61 eV, 285.33–286.11 eV and 288.02–288.26 eV respectively after charge correction. Here the third component (C
O positioned in the rages of 284.46–284.61 eV, 285.33–286.11 eV and 288.02–288.26 eV respectively after charge correction. Here the third component (C![[double bond, length as m-dash]](https://www.rsc.org/images/entities/char_e001.gif) O) in the higher binding energy appeared as a result of cycling. This peak was absent in the C 1s spectra of the electrode before cycling as shown in Fig. S2a.† These changes were also reflected in the O 1s core spectra as represented in Fig. 10b. The spectra have been deconvoluted into three peaks lying in the range of 529.46–529.79 eV, 530.76–531.07 eV, and 532.10–533.24 eV. The peak at the lower binding energy features the lattice oxygen associated with the Mn–O covalent bond and the peak between 530.76-531.07 eV represents some surface adsorbed hydroxyl groups. The higher binding energy peak indicates the surface adsorbed water 60 or some carboxyl groups 61 as a result of continuous CV cycles. This intern supports the C
O) in the higher binding energy appeared as a result of cycling. This peak was absent in the C 1s spectra of the electrode before cycling as shown in Fig. S2a.† These changes were also reflected in the O 1s core spectra as represented in Fig. 10b. The spectra have been deconvoluted into three peaks lying in the range of 529.46–529.79 eV, 530.76–531.07 eV, and 532.10–533.24 eV. The peak at the lower binding energy features the lattice oxygen associated with the Mn–O covalent bond and the peak between 530.76-531.07 eV represents some surface adsorbed hydroxyl groups. The higher binding energy peak indicates the surface adsorbed water 60 or some carboxyl groups 61 as a result of continuous CV cycles. This intern supports the C![[double bond, length as m-dash]](https://www.rsc.org/images/entities/char_e001.gif) O component observed in C 1s spectra. However, this component was not observed in the electrode prior to the cycling (Fig. S2b†). The peak area under each component varies with the electrolyte used implying a variation of compositions with respect to the electrolytes.
O component observed in C 1s spectra. However, this component was not observed in the electrode prior to the cycling (Fig. S2b†). The peak area under each component varies with the electrolyte used implying a variation of compositions with respect to the electrolytes.
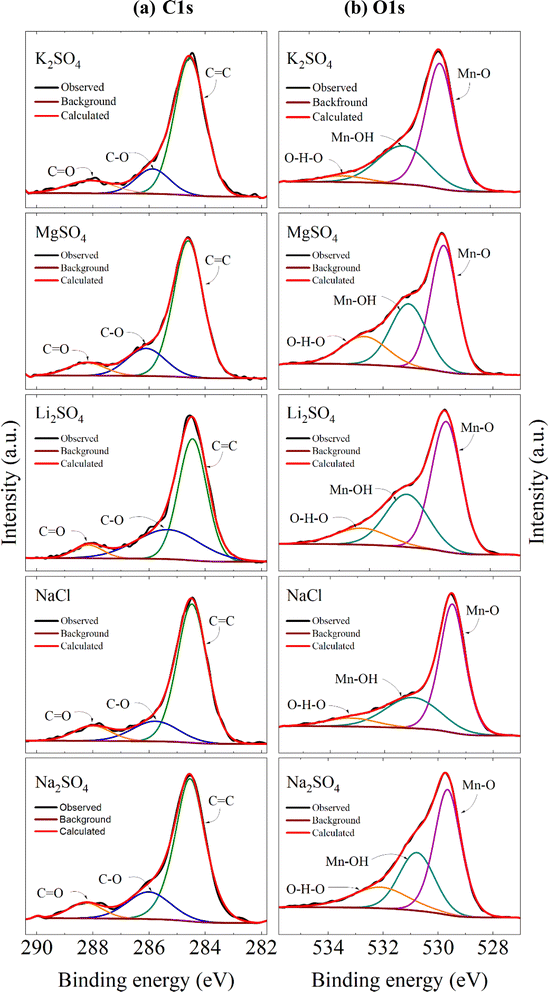 | ||
| Fig. 10 Core level spectra of (a) C 1s and (b) O 1s for electrodes processed in different electrolytes. | ||
The Mn 2p spectra as shown in Fig. 11 exhibit the spin–orbit coupling, resulting in two peaks, Mn 2p3/2 and Mn 2p1/2 with an BE separation ranging from 11.69–11.79 eV for all the electrodes. In general, any energy separation greater than 11.05 eV (for metallic Mn) indicates the oxidative state of Mn.61 Moreover, the BE difference between Mn 2p3/2 and O 1s spectra (given in Table S1†) indicates an increment in the Mn4+ state in the electrodes after cycling. It can be discerned that for the electrode before cycling the value of ΔE(Mn 2p3/2–O 1s) was 111.58 eV, which implies the electrode was rich in Mn2+. But electrochemical cycling resulted in a change in energy difference ranging from 112.31–112.5 eV, pointing out the evolution of the Mn4+ state.62 These observations are in accordance with the XRD as well as Raman results where there was evidence of MnO2 phase as a consequence of cycling. Further, the Mn 2p3/2 and Mn 2p1/2 peaks are deconvoluted into three peaks each revealing the presence of Mn2+, Mn3+ as well as Mn4+ states. The peak positions, FWHM, and area under each peak are tabulated in Table S1.† However, for the electrode before cycling, the presence of Mn4+ was evident (shown in Fig. S2c†), which was not the case for a pure Mn3O4. It is known that, for manganese oxide, surface cation defects are common along with oxygen defects.63 Thus, the appearance of Mn4+ might be due to the cation vacancies.64 Notably, for all the electrodes, after cycling there was an increase in the Mn4+ state and a decrease in the Mn2+ state, which suggests that cycling causes the oxidation of Mn thereby tending to form MnO2 as seen in XRD.
Fig. 12 displays the SEM images of electrodes activated in different electrolytes (Fig. S5† shows SEM images with different magnifications). It is evident from the figures that CV cycling significantly affected the surface of the electrodes which might be due to the phase transformation as seen in XRD and Raman studies. For the Na2SO4-activated electrode, the morphology was changed from fibrous (before cycling) to a dense thin nanosheet-like structure whereas these nanosheets were more defined in the case of NaCl electrolyte. For Li2SO4 the morphology was somewhat similar to that of Na2SO4. In case of MgSO4, the nanosheets were more compact with lesser pore size whereas the K2SO4-activated electrode exhibited a very thin layer of nanosheets. These layered nanosheets indicate the formation of birnessite (α-MnO2) as reported in the earlier report.27
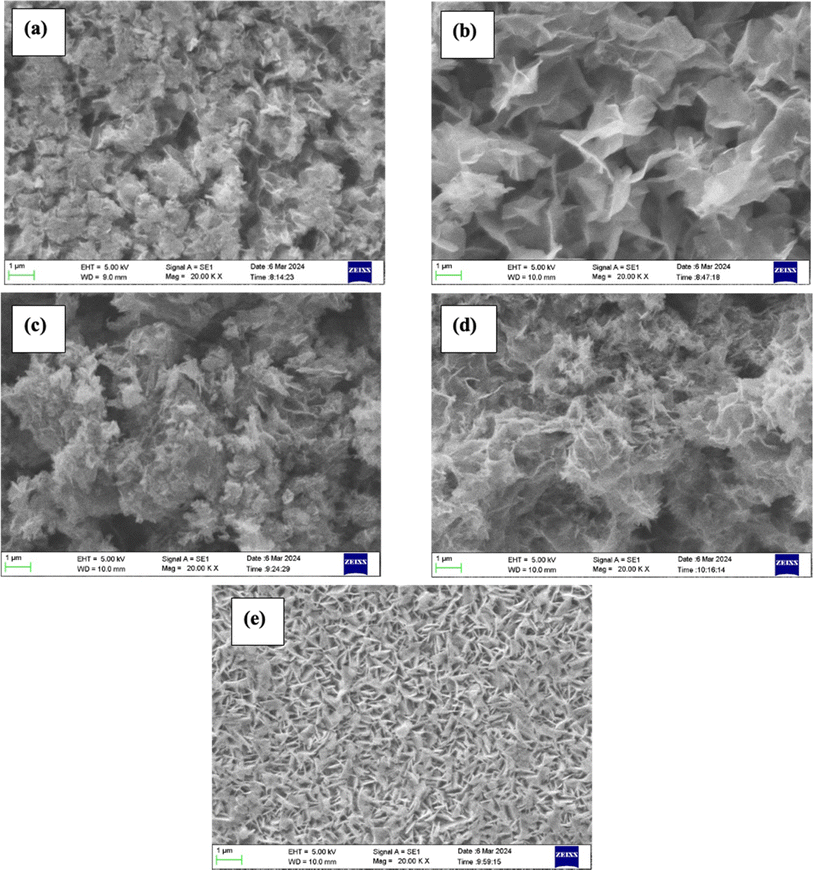 | ||
| Fig. 12 SEM images of the electrodes processed in (a) Na2SO4, (b) NaCl, (c) Li2SO4, (d) K2SO4, and (e) MgSO4 for 500 CV cycles at 50 mV s−1. | ||
Further, Fig. 13 shows the contact angle measurements of electrodes processed in different electrolytes for 500 CV cycles at 50 mV s−1. Compared to the Mn3O4 electrode before cycling (as shown in Fig. 3c), all the electrodes exhibit very good wettability, where there was a significant decrease in the contact angle. The hydrophilicity of the electrodes was improved and the electrode processed in K2SO4 electrolyte was found to be highly hydrophilic. This can be witnessed from the SEM image of the K2SO4 processed electrode where there are very thin layered structures. This further implies that the K2SO4 processed electrode has higher surface energy and surface area compared to other electrodes.65 On the other hand, MgSO4 processed electrode has high contact angle which might be due to its lesser surface area and surface roughness. However, surface wettability was significantly improved after cycling which indicates better storage performance.
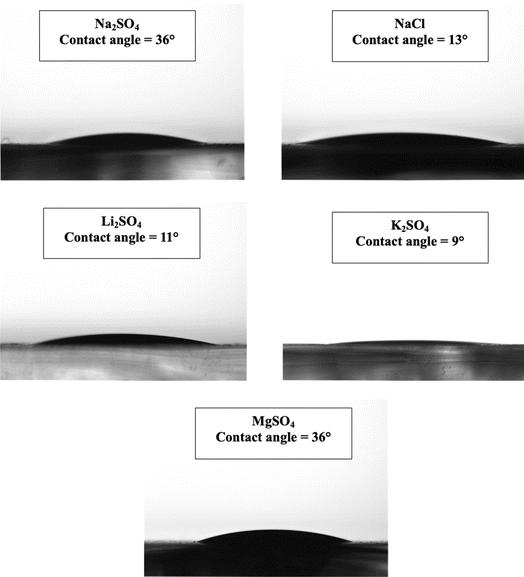 | ||
| Fig. 13 Contact angle measurements of the electrodes processed in (a) Na2SO4, (b) NaCl, (c) Li2SO4, (d) K2SO4 and (e) MgSO4 for 500 CV cycles at 50 mV s−1. | ||
| Electrolyte | Areal capacitance (mF cm−2) | ||
|---|---|---|---|
| 1st cycle | 500th cycle | Increment (times) | |
| Na2SO4 | 28.34 | 37.48 | 1.3 |
| NaCl | 22.20 | 35.52 | 1.6 |
| Li2SO4 | 29.40 | 40.66 | 1.4 |
| MgSO4 | 19.95 | 36.60 | 1.8 |
| K2SO4 | 33.12 | 42.94 | 1.3 |
4. Conclusions
In summary, the Mn3O4 thin film electrodes were synthesised using the chemical spray pyrolysis technique, and its electrochemical properties in different aqueous electrolytes were examined. The as-synthesized electrode is crystalized in a tetragonal crystal structure and the observed Raman modes are agreeing with the spinel Mn3O4. Electrochemical testing in electrolytes with dissimilar anions and cations revealed the consequences of ion size and hydration sphere radius on the charge storage kinetics. Accordingly, the electrode processed in K2SO4 electrolytes exhibited the highest specific capacitance of around 187 F g−1 at a current density of 0.5 A g−1. Moreover, post-cycling structural studies implied that there was a partial phase transformation of the electrodes from Mn3O4 to MnO2 phase after 500 CV cycles. Consequently, XPS results support this by showing higher oxidation states of Mn. Also, the electrochemical cycling significantly altered the morphology from fibrous to layered, whereas the wettability of the electrodes was also improved accordingly. A comparison of capacitance between the first and 500th cycle illustrate that, the electrode processed in MgSO4 electrolyte has more tendency to undergo oxidation with cycling as evidenced by its capacitance value which improved 1.8 times of its initial capacitance. The results outlined here thus help to access the influence of cations and anions on the electrochemical performance of Mn3O4 thin films in aqueous electrolytes, thereby pointing their suitability for supercapacitor application.Data availability
Data can be made available on a reasonable request to the corresponding author. The most data pertaining to this article is mentioned in the article itself. Additionally, the data supporting this article have been included as part of the ESI.†Author contributions
Pramitha A: conceptualization, investigation, formal analysis, writing – original draft. Shreeganesh Subraya Hegde: validation, writing – review & editing. Badekai Ramachandra Bhat: validation, resources, writing – review & editing. Sajan D. George: validation, resources. Raviprakash Y: conceptualization, visualization, validation, writing – review & editing, resources, supervision.Conflicts of interest
There are no conflicts to declare.Acknowledgements
Pramitha Adoor is thankful to Manipal Academy of Higher Education (MAHE) for supporting the work through Dr TMA Pai Scholarship and instrument facilities. The author, Shreeganesh Subraya Hegde acknowledges the National Institute of Technology Karnataka for the essential research and library facilities. Pramitha Adoor also acknowledges Mr Lozil Denzil Mendonca and Mr Pramod R Nadig, for their helpful suggestions on the XPS analysis.References
- P. Simon, Y. Gogotsi and B. Dunn, Science, 2014, 343, 1210–1211 CrossRef CAS PubMed.
- M. R. Lukatskaya, B. Dunn and Y. Gogotsi, Nat. Commun., 2016, 7, 12647 CrossRef PubMed.
- S. S. Hegde and B. R. Bhat, RSC Adv., 2024, 14, 8028–8038 RSC.
- S. S. Hegde and B. R. Bhat, in Sustainable Materials for Electrochemical Capacitors, John Wiley & Sons, Ltd, 2023, pp. 19–31 Search PubMed.
- C. Zhong, Y. Deng, W. Hu, J. Qiao, L. Zhang and J. Zhang, Chem. Soc. Rev., 2015, 44, 7484–7539 RSC.
- B. K. Kim, S. Sy, A. Yu and J. Zhang, Handbook of Clean Energy Systems, 2015, pp. 1–25 Search PubMed.
- A. Pramitha and Y. Raviprakash, J. Energy Storage, 2022, 49, 104120 CrossRef.
- P. Simon and Y. Gogotsi, Nat. Mater., 2020, 19, 1151–1163 CrossRef CAS PubMed.
- V. Augustyn, P. Simon and B. Dunn, Energy Environ. Sci., 2014, 7, 1597–1614 RSC.
- M. A. A. Mohd Abdah, N. H. N. Azman, S. Kulandaivalu and Y. Sulaiman, Mater. Des., 2020, 186, 108199 CrossRef CAS.
- S. Fleischmann, J. B. Mitchell, R. Wang, C. Zhan, D. E. Jiang, V. Presser and V. Augustyn, Chem. Rev., 2020, 120, 6738–6782 CrossRef CAS PubMed.
- F. Shi, L. Li, X. L. Wang, C. D. Gu and J. P. Tu, RSC Adv., 2014, 4, 41910–41921 RSC.
- R. Liu, A. Zhou, X. Zhang, J. Mu, H. Che, Y. Wang, T. T. Wang, Z. Zhang and Z. Kou, Chem. Eng. J., 2021, 412, 128611 CrossRef CAS.
- M. N. Sakib, S. Ahmed, S. M. S. M. Rahat and S. B. Shuchi, J. Energy Storage, 2021, 44, 103322 CrossRef.
- W. Wei, X. Cui, W. Chen and D. G. Ivey, Chem. Soc. Rev., 2011, 40, 1697–1721 RSC.
- Z. Y. Tian, P. Mountapmbeme Kouotou, N. Bahlawane and P. H. Tchoua Ngamou, J. Phys. Chem. C, 2013, 117, 6218–6224 CrossRef CAS.
- S. Raha, D. Mohanta and M. Ahmaruzzaman, Sci. Rep., 2021, 11, 1–19 CrossRef PubMed.
- T. Kozawa, F. Kitabayashi, K. Fukuyama and M. Naito, Sci. Rep., 2022, 12, 1–11 CrossRef PubMed.
- Y. Hu, C. Guan, G. Feng, Q. Ke, X. Huang and J. Wang, Adv. Funct. Mater., 2015, 25, 7291–7299 CrossRef CAS.
- S. A. Beknalkar, A. M. Teli, T. S. Bhat, K. K. Pawar, S. S. Patil, N. S. Harale, J. C. Shin and P. S. Patil, J. Mater. Sci. Technol., 2022, 130, 227–248 CrossRef CAS.
- A. F. Seliem, A. Y. A. Mohammed, A. Attia, S. Aman, N. Ahmad and M. M. Ibrahim, ACS Omega, 2024, 9, 17563–17576 CAS.
- B. Pal, S. Yang, S. Ramesh, V. Thangadurai and R. Jose, Nanoscale Adv., 2019, 1, 3807–3835 RSC.
- M. Sajjad, M. I. Khan, F. Cheng and W. Lu, J. Energy Storage, 2021, 40, 102729 CrossRef.
- S. Subraya Hegde and B. Ramachandra Bhat, Fuel, 2024, 371, 131999 CrossRef CAS.
- S. G. Sayyed, H. M. Pathan, A. V. Shaikh, S. F. Shaikh and A. M. Al-Enizi, J. Energy Storage, 2021, 33, 102076 CrossRef.
- H. Jiang, C. Zhou, X. Yan, J. Miao, M. You, Y. Zhu, Y. Li, W. Zhou and X. Cheng, J. Energy Storage, 2020, 32, 101898 CrossRef.
- C. Liu, Y. Chen, X. Sun, B. Chen, Y. Situ and H. Huang, Electrochim. Acta, 2019, 324, 134894 CrossRef CAS.
- K. V. Sankar, D. Kalpana and R. K. Selvan, J. Appl. Electrochem., 2012, 42, 463–470 CrossRef CAS.
- P. Suktha, N. Phattharasupakun, P. Dittanet and M. Sawangphruk, RSC Adv., 2017, 7, 9958–9963 RSC.
- Y. Dai, K. Wang and J. Xie, Appl. Phys. Lett., 2007, 90, 3–6 Search PubMed.
- D. P. Dubal, D. S. Dhawale, R. R. Salunkhe and C. D. Lokhande, J. Electrochem. Soc., 2010, 157, A812 CrossRef CAS.
- X. Y. San, B. Zhang, J. Wang, B. Wu and X. L. Ma, Electrochem. Commun., 2016, 72, 166–170 CrossRef CAS.
- J. Hao, J. Mou, J. Zhang, L. Dong, W. Liu, C. Xu and F. Kang, Electrochim. Acta, 2018, 259, 170–178 CrossRef CAS.
- M. Gao, X. Wu, H. Qiu, Q. Zhang, K. Huang, S. Feng, Y. Yang, T. Wang, B. Zhao and Z. Liu, RSC Adv., 2018, 8, 20661–20668 RSC.
- Y. Qiao, Q. Sun, H. Cui, D. Wang, F. Yang and X. Wang, RSC Adv., 2015, 5, 31942–31946 RSC.
- B. K. Lesel, J. S. Ko, B. Dunn and S. H. Tolbert, ACS Nano, 2016, 10, 7572–7581 CrossRef CAS PubMed.
- H. Xia, Y. S. Meng, X. Li, G. Yuan and C. Cui, J. Mater. Chem., 2011, 21, 15521–15526 RSC.
- D. Govindarajan, K. Kirubaharan, M. Selvaraj, A. Sanni, J. Theerthagiri, M. Yong Choi and S. Kheawhom, Appl. Surf. Sci., 2023, 630, 157475 CrossRef CAS.
- M. Yu and X. Feng, Joule, 2019, 3, 338–360 CrossRef CAS.
- W. Pan, J. Zhang, L. Feng, J. Xie, Q. Xiao and Q. Xie, Mater. Res. Express, 2020, 7, 106408 CrossRef CAS.
- L. Bigiani, M. Hassan, D. Peddis, C. Maccato, G. Varvaro, C. Sada, E. Bontempi, S. Martí-Sánchez, J. Arbiol and D. Barreca, ACS Appl. Nano Mater., 2019, 2, 1704–1712 CrossRef CAS.
- A. Ramírez, P. Hillebrand, D. Stellmach, M. M. May, P. Bogdanoff and S. Fiechter, J. Phys. Chem. C, 2014, 118, 14073–14081 CrossRef.
- A. Gasparotto, C. Maccato, A. Petala, S. Bebelis, C. Sada, D. I. Kondarides and D. Barreca, ACS Appl. Energy Mater., 2019, 2, 8294–8302 CrossRef CAS.
- P. Adoor, S. S. Hegde, B. R. Bhat, S. N. Yethadka and R. Yeenduguli, ACS Omega, 2023, 0–12 Search PubMed.
- C. Guild, S. Biswas, Y. Meng, T. Jafari, A. M. Gaffney and S. L. Suib, Catal. Today, 2014, 238, 87–94 CrossRef CAS.
- A. Pramitha, S. Subraya, B. Ramachandra, S. D. George, Y. N. Sudhakar and Y. Raviprakash, Mater. Chem. Phys., 2023, 307, 128213 CrossRef CAS.
- Y. Adoor, S. S. Hegde, B. Ramachandra Bhat, C. Yadav, S. Chakraborty, A. Ravikumar, S. D. George, Y. N. Sudhakar and R. Y, Phys. Scr., 2024, 99, 105922 CrossRef.
- I. N. Reddy, C. V. Reddy, K. Ravindranadh, M. Cho, D. Kim and J. Shim, J. Electroanal. Chem., 2020, 874, 114488 CrossRef CAS.
- D. P. Dubal, D. S. Dhawale, R. R. Salunkhe, S. M. Pawar, V. J. Fulari and C. D. Lokhande, J. Alloys Compd., 2009, 484, 218–221 CrossRef CAS.
- Y. Xiao, Y. Cao, Y. Gong, A. Zhang, J. Zhao, S. Fang, D. Jia and F. Li, J. Power Sources, 2014, 246, 926–933 CrossRef CAS.
- M. M. Vadiyar, S. C. Bhise, S. K. Patil, S. S. Kolekar, A. R. Shelke, N. G. Deshpande, J. Y. Chang, K. S. Ghule and A. V. Ghule, Chem. Commun., 2016, 52, 2557–2560 RSC.
- M. M. Vadiyar, S. C. Bhise, S. K. Patil, S. S. Kolekar, J. Y. Chang and A. V. Ghule, ChemistrySelect, 2016, 1, 959–966 CrossRef CAS.
- F. Barzegar, D. Y. Momodu, O. O. Fashedemi, A. Bello, J. K. Dangbegnon and N. Manyala, RSC Adv., 2015, 5, 107482–107487 RSC.
- T. Yu and S. J. Chen, Biophys. J., 2018, 114, 1274–1284 CrossRef CAS PubMed.
- H. Xia, X. Zhu, J. Liu, Q. Liu, S. Lan, Q. Zhang, X. Liu, J. K. Seo, T. Chen, L. Gu and Y. S. Meng, Nat. Commun., 2018, 9, 5100 CrossRef PubMed.
- Y. Zhang, L. Liu, S. Jamil, J. Xie, W. Liu, J. Xia, S. Nie and X. Wang, Appl. Surf. Sci., 2019, 494, 1156–1165 CrossRef CAS.
- C. Liu, Y. Chen, W. Huang, Y. Situ and H. Huang, Appl. Surf. Sci., 2018, 458, 10–17 CrossRef CAS.
- Y. T. Lu, W. Y. Jao, C. W. Tai and C. C. Hu, J. Taiwan Inst. Chem. Eng., 2024, 154, 104978 CrossRef CAS.
- R. Roychaudhuri, D. Acharyya and P. Bhattacharyya, 2018 Int. Symp. Devices, Circuits Syst. ISDCS 2018, 2018, 4, pp. 1–4 Search PubMed.
- H. R. Barai, N. S. Lopa, F. Ahmed, N. A. Khan, S. A. Ansari, S. W. Joo and M. M. Rahman, ACS Omega, 2020, 5, 22356–22366 CrossRef CAS PubMed.
- J. F. Moulder, G. E. Muilenberg Perkin-Elmer Corp, C. D. Wanger, W. M. Riggs and L. E. Davis, Handbook of X-ray Photoelectron Spectroscopy, 1979 Search PubMed.
- P. Decorse, G. Caboche and L. C. Dufour, Solid State Ionics, 1999, 117, 161–169 CrossRef CAS.
- T. He, Y. Zhou, D. Ding and S. Rong, ACS Appl. Mater. Interfaces, 2021, 13, 29664–29675 CrossRef CAS PubMed.
- V. C. Bose and V. Biju, Bull. Mater. Sci., 2015, 38, 865–873 CrossRef CAS.
- A. Kozbial, Z. Li, C. Conaway, R. McGinley, S. Dhingra, V. Vahdat, F. Zhou, B. Durso, H. Liu and L. Li, Langmuir, 2014, 30, 8598–8606 CrossRef CAS PubMed.
Footnote |
| † Electronic supplementary information (ESI) available. See DOI: https://doi.org/10.1039/d4ra05426a |
| This journal is © The Royal Society of Chemistry 2024 |

