 Open Access Article
Cu-doped ZnO/Ag/CuO heterostructure: superior photocatalysis and charge transfer†
Abbay Gebretsadika,
Bontu Kefalea,
Chaluma Soria,
Dereje Tsegayea,
H. C. Ananda Murthy‡
 *b and
Buzuayehu Abebe
 *a
*a
aDepartment of Applied Chemistry, Adama Science and Technology University, 1888, Adama, Ethiopia. E-mail: buzea8@gmail.com; anandkps350@gmail.com
bSchool of Applied Sciences, Papua New Guinea University of Technology, Lae, Morobe Province 411, Papua New Guinea
First published on 18th September 2024
Abstract
Doped semiconductor heterostructures have superior properties compared to their components. In this study, we observed the synthesis of Cu-doped ZnO/Ag/CuO heterostructure with the presence of charge transfer and visible light-harvesting properties resulting from doping and heterojunction. The porous heterostructures were prepared using the bottom-up combustion (BUC) approach. This method generated porous heterostructures by eliminating gaseous by-products. X-ray diffraction (XRD) optimization revealed that the ideal conditions included 1.00 g of polyvinyl alcohol (PVA), a synthesis temperature of 50 °C, and a 1 hour calcination time. Introducing copper (Cu) into the zinc oxide (ZnO) lattice caused a high-angle shift in the XRD pattern peaks. High-resolution transmission electron microscopy (HRTEM) images and XRD patterns confirmed the formation of Cu-doped ZnO/Ag/CuO (c-zac) heterostructures. Elemental mapping analysis confirmed the even surface distribution of Ag metal. The c-zac heterostructures exhibited superior optoelectrical and charge transfer properties compared to single ZnO. The heterostructures demonstrated improved methylene blue (MB) dye degradation potential (k = 0.065 min−1) compared to single ZnO (k = 0.0041 min−1). This photocatalytic potential is attributed to enhanced light absorption and charge transfer properties. The extended visible light absorption resulted from CuO and Ag's surface plasmon resonance properties. The selected 15c-zac heterostructure also performed well in a reusability photocatalytic test, remaining effective until the 3rd cycle. Consequently, this heterostructure holds promise for scaling up as a catalyst for environmental remediation.
1. Introduction
A large volume of non-biodegradable pollutants that induce toxicity in human and aquatic systems are discharged into water bodies without treatment.1 Therefore, researchers should develop efficient organic pollutants remediation techniques using nanotechnology. Metal oxides such as zinc oxide (ZnO) and titanium oxide (TiO2) have decent optoelectronic properties, environmental friendliness, stability, and photocatalytic activities.2 However, light-induced electron–hole recombination and a lack of harvesting visible light are the main ZnO drawbacks. Porous metal or metal oxide heterostructures and doping strategies are the two novel approaches to improving host material drawbacks.3–5 Besides, material with visible light absorption properties, which constitute about 40% of the solar spectrum, has valuable use in several applications.2,6Copper ion (Cu2+) has comparable ionic radii with zinc ion (Zn2+). The ionic radius of Cu2+ is 0.58 Å in tetrahedral and 0.73 Å in octahedral coordination, while the ionic radius of Zn2+ is 0.60 Å in tetrahedral and 0.74 Å in octahedral coordination. Thus, the penetration and inclusion of these slightly smaller ionic radii of Cu2+ result in lattice shrinkage, which results in a peak shift towards a high angle on the XRD pattern.7 Copper doping forms 3d mid-gap state in the ZnO band gap and acts as an electron trap and interband transition.8 Besides, the greater ionic radii of silver compared to the zinc ion increase the ZnO's unit cell volume and result in the shifting of the XRD pattern peak towards a lower angle. However, the solubility of silver in the ZnO lattice is difficult due to its greater ionic radii.9 Thus, it instead forms a separate crystal, or aggregate, as a heterojunction. Trang et al.10 reported a small amount of Ag inclusion in the ZnO lattice based on the XRD pattern peak shift and the domination of heterojunction (independent crystal formation). The Ag crystal then forms local contact with ZnO, which facilitates an in situ charge transfer process through the interface. Wang et al.11 also reported the dominance of independent Ag crystal formation instead of its inclusion in the host lattice.
Recently, the type II (staggered), Z-scheme, and S-scheme charge transfer mechanisms have been proposed. These charge transfer mechanisms are beneficial for boosting the photocatalytic activity of the heterostructure. In the type-II mechanism, charge transfer, Fermi level equilibration, and band-bending processes occur as usual. Under light irradiation, the electrons and holes are separated. Then, the electrons migrate from the more negative conduction band (CB) potential of one semiconductor to the other's less negative CB potential. The holes also migrate from a more positive valence band (VB) potential to a less positive one. With this migration, the electrons have been collected at a position of weaker reducing redox potential. Which means a weaker reduction potential than the standard O2/˙O2− reduction potential (−3.33 eV) and weaker oxidation potential than the standard oxidation potential of ˙OH/H2O (−2.38 eV). This indicates no full guarantee for water and oxygen to be oxidized and reduced, respectively.12 In addition, in the traditional Z- and S-scheme mechanisms, the CB electrons and VB holes have greater reduction and oxidation potential, respectively, unlike those in the type II mechanism. However, the CB electrons and VB holes present in the weak reduction and oxidation redox potentials are lost as a result of recombination and quenching. For this reason, recently, the use of noble metals such as silver as charge mediators has been practiced. Besides, the mediator noble metals extend visible light absorption as a result of surface plasmon resonance properties.13,14 Mahyoub et al.14 synthesised a Z-scheme-based CeO2/Ag/ZnO heterostructure. As proposed, the electrons migrate from ZnO CB and recombine with VB holes in CeO2. However, the electrons in the CB of CeO2 react with oxygen, and holes in the VB of ZnO oxidize water with adequate energy. Silver acts as a mediator and absorbs visible light that constitutes about 40% of the solar spectrum. This visible light absorption for silver is associated with the oscillation of electrons with the electric field.15
Recently, several studies have been released for single Ag- and Cu-doped ZnO heterostructure materials. Besides, some works were also reported for Ag and Cu co-doped ZnO heterostructures using different methods, such as chemical bath deposition,16 sol–gel,17 facile and low-temperature chemical and photochemical deposition,18 and co-precipitation.19 Most of the above-mentioned research works reported the host material property improvement due to copper oxide and silver metal incorporation/heterojunction. However, none of these studies reported synthesizing heterostructures with porous morphology using the bottom-up combustion (BUC) method. The BUC approach follows the development of colloidal NPs in solution, gelation of the colloidal NPs through dehydration, and combustion by heating the dehydrated product to a complex ignition temperature.20,21 Once the combustion started in many places on the sample surface, a foam-type porous heterostructure was produced. The combustion techniques quickly produce a porous, pure, and highly stable by-product. It needs cheap synthesis equipment and avoids post-synthesis treatment processes.22 Porosity generation is associated with the evaporation of gaseous by-products. The evolution of gaseous products may further reduce metal ions or metal oxides into zero-valent metal NPs.23,24 There is also a lack of clarity in proposing the most possible charge transfer and visible light absorption mechanisms. Besides, none of these studies also interconnected the crucial ideas of LaMer's nanocrystal heterostructure growth and the hard soft acid–base (HSAB) dopant–host reactivity balance theory. Optimizing crucial parameters such as synthesis temperature, calcination time, and dopant amount was not also seen in detail.25–27 During synthesis, optimizing the solution temperature can also assist in controlling the precursor decomposition to nanocrystal growth process, according to LaMer's theory.28
Thus, this study synthesized pure NPs and heterostructures using the simple BUC approach. The single NPs and Cu–ZnO/CuO (c-zc), Ag/ZnO (za), and Cu–ZnO/Ag/CuO (c-zac) heterostructures were synthesized in the presence of poly(vinyl alcohol) (PVA) as a capping agent. The effects of PVA amount, synthesis temperature, calcination time, and dopant amount were studied and optimized. The 1.00 g of PVA, 50 °C synthesis temperature, and 1 hour calcination time were obtained to be the optima. The crystallinity and formation of the Cu-doped ZnO/Ag/CuO heterostructure were verified by TEM/HRTEM morphology and XRD pattern analysis. The improved optoelectrical properties of the c-zac were verified from the Mott–Schottky, UV-vis-DRS, and PL analyses. The optimized 15c-zac (15% dopant) heterostructure also showed enhanced methylene blue dye (MB-D) degradation potential with a rate constant value of k 0.067 min−1. This application improvement for c-zac is a result of copper doping and the synergistic effect of CuO, Ag, and ZnO heterostructures.
2. Results and discussion
2.1. Characterization
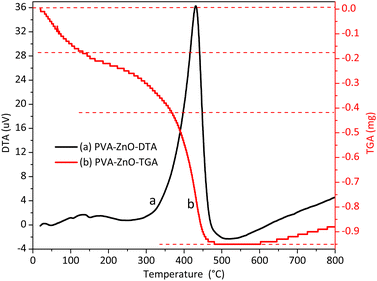 | ||
| Fig. 1 Thermal analysis: DTA-TGA (differential thermal-thermogravimetric analysis) plots of polyvinyl alcohol–zinc precursor complexes before calcinating the sample in the furnace. | ||
Thus, 450 °C is the temperature at which the PVA polymer completely decomposes and gives pure ZnO NPs (as observed from the TGA curve). This temperature of 450 °C was used for further physical analysis (characterization) and application tests.
The crystallite size versus PVA amount, synthesis temperature, calcination time, and dopant percentage plots were depicted as insets in Fig. S1a–d,† respectively.
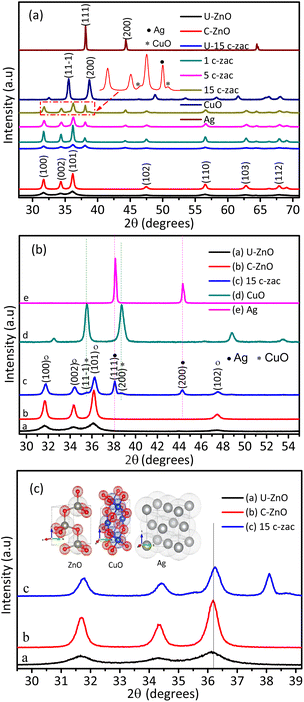
Fig. 2 shows the XRD plots of raw PVA, ZnO, Ag, and CuO NPs, and c-zac heterostructure (15%). The PVA XRD pattern has a peak at 20°, which corresponds to the crystal plane of (101) (JCPDS # 00-053-1847) (see Fig. S1a† inset label a).32 However, after calcinating the NPs and heterostructures containing PVA polymer at 450 °C, the PVA polymer peaks disappeared, indicating the complete decomposition of it. The 2θ values with the respective crystal planes of single ZnO NPs are 31.8 (100), 34 (002), 36 (101), 47.5 (102), 56.6 (110), 62.8 (103), and 67.8° (112), revealing the hexagonal wurtzite structure of ZnO NPs (JCPDS # 00-036-1451) (Fig. 2b). The XRD pattern of the c-zac heterostructure also has similar 2θ peaks like that in ZnO and an additional three silver and two small copper oxide (CuO) independent peaks. These three Ag NPs peaks are associated with the fcc structure, which fits with the single Ag 2θ and corresponding crystal planes of 38 (111), 44 (200), and 64° (220) (JCPDS # 00-004-0783). These two CuO peaks appeared at 2θ, and the corresponding crystal planes of 35.5 (002, 11−1) and 39° (200, 111) are associated with the monoclinic structure of CuO (JCPDS # 00-048-1548). The Scherrer formula (eqn (1)) has been used to calculate the crystallite size of the single NPs and heterostructures.
 | (1) |
The uncalcinated ZnO NPs and 15c-zac (8 nm) heterostructures show a smaller crystallite size compared to their calcined constituents (Fig. 2). However, depending on the pre-photocatalytic test, the 60 minute calcination time was selected and used for further analysis. Besides, calcinating the material to the optimum time assists in the decomposition of impurities, including the PVA polymer. Depending on the reaction conditions and synthesis approach, substitutional and interstitial doping as well as heterojunction may occur due to the doping of metal or metal ions. The substitutional and interstitial doping can cause peak shifts on the XRD pattern depending on the size of ionic radii. The solubility of silver is very low due to its greater ionic radii, which then form a separate independent crystal.10,11 Besides, the decomposition of nitrates and PVA complex results in producing gaseous by-products such as NO2, CO2, and CO, which reduces silver ions.24 Thus, Ag forms a more dominant heterojunction with ZnO than that of its inclusion in the host lattice. The dominance of Schottky contact for Ag and ZnO is also consistent with recent reports.33,34 The radius of the copper ion (0.73 Å) is smaller than zinc ion (0.74 Å) in the tetrahedral structure. Thus, inclusion of copper ions in the ZnO host lattice results in a decrease in unit cell volume and a high angle shift on the XRD pattern.7 The c-zac heterostructure shows a high angle shift compared to the single ZnO (Fig. 2c). This shift indicates the dominance of copper inclusion in the ZnO lattice. The appearance of silver and copper oxide (CuO) peaks on the XRD patterns of 15c-zac indicates the formation of a ZnO/Ag/CuO heterostructure. All together, the formation of Cu-doped ZnO/Ag/CuO heterostructure (c-zac) is witnessed.
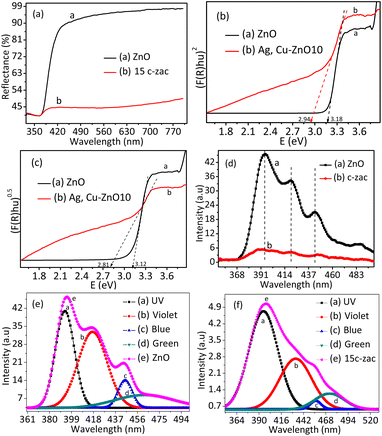
However, this electron–hole recombination process diminished in the indirect materials due to the presence of differences in the k-factor values. This indicates that the photon-excited electrons and holes get relaxation time for the reduction and oxidation redox reactions. Thus, the reactive oxygen species obtained from the redox reaction are beneficial for applications such as photocatalysis. The obtained direct and indirect bandgap values of ZnO are 3.18 and 3.12 eV, respectively. The direct and indirect bandgap value for c-zac heterostructure is found to be 2.94 and 2.81, respectively. The c-zac heterostructure showed greater redshift compared to ZnO NPs, indicating the presence of synergistic effects due to copper and silver. Generally, the crystal momentum value for ZnO is zero, indicating it is a direct bandgap material. However, the creation of defects (mid energy level) associated with doping can change the direct transition to an indirect transition, and electrons get relaxation time.38
The relative band edge potential and n-type or p-type characters of semiconductor materials can be understood by combining the Mott–Schottky plots and DRS-UV-vis analysis. The Mott–Schottky plots for ZnO NPs and c-zac NCs are depicted in Fig. S2a and b,† respectively. Pure ZnO has positive slopes, indicating it has n-type semiconductivity. The negative and positive slopes for the 15c-zac heterostructure confirm the p-type and n-type characteristics, respectively. The p-type and n-type characteristics of the 15c-zac heterostructure occur due to the doping and formation of heterojunction and have a close relationship with the improvement of optoelectric properties. From the Mott–Schottky plot, the CB band edge potential can be determined through extrapolation towards the x-axis. Thus, the CB band edge potential for ZnO and c-zac is found to be −0.92 V and −0.97 V, respectively, versus Ag/AgCl. Supposing that the band edge potential of an n-type semiconductor is 0.1 V more negative,39 the corrected band edge becomes −0.82 and −0.87 V, respectively. Therefore, we determine the VB edge potential for ZnO and c-zac heterostructure to be 2.12 and 1.94 V, respectively, by combining the Mott–Schottky plots and DRS-UV-vis analysis (VB = Eg + CB).
The optical and luminescence characteristics of ZnO and c-zac heterostructures were also characterised by PL analysis (Fig. 3d). The xenon lamp was used as a source at an excitation wavelength of 325 nm. The common emission band at 394 nm (UV region) is associated with the ZnO-near-band edge emission (NBE) transition as a result of electron–hole recombination. The three emission peaks detected in the visible region are associated with the intrinsic ZnO defects deep-level emission. The visible emission that occurs during synthesis may be associated with electron donor level (VO and Zni) or accepter level (VZn and Oi) defects. The accepter level occurred below the CB and the donor level above the VB of the host.40 The violet-blue emission is associated with Zni and the host VB transition; the blue emission is associated with VZn and the host CB transition; green is due to the transition between VO and VZn; and yellow is related to the recombination of holes trapped in Oi and electrons in the CB.41,42
Fig. 3e and f show the Gaussian-shaped constituents of the deconvoluted plot for ZnO NPs and 15c-zac heterostructure. The intensity of PL spectra used in order to understand the charge recombination efficiently. The lower the PL intensity shows the presence of less charge recombination rate, and the higher the PL intensity, the greater the charge recombination rate.43 The intensity of UV emission for doped heterostructure decreased from 46 to 5 arbitrary units. This intensity reduction has a direct relationship with electron–hole recombination hindrance or the presence of charge transfer. This enhanced charge transfer is associated with mid-gap level creation due to copper doping as well as heterojunction within the heterostructure interface (ZnO/Ag/CuO).14,44 This charge transfer process with delayed charge recombination has great importance in different applications, such as catalysis and photocatalysis.45,46 The UV, violet, blue, and green emission for ZnO NPs was observed at about 394, 418, 446, and 460 nm. However, the respective emission peaks for the c-zac heterostructure were observed at 397, 420, 445, and 466 nm, respectively. The UV and blue emissions for the doped heterostructure showed a redshift compared to the ZnO NPs, which is due to the host dopant sp–d strong exchange interaction.47,48 This host electron interaction with localized unpaired dopant 3d electrons creates a new mid-gap level between the host bandgap.
The presence of only expected elements in the EDX elemental composition analysis also shows material purity (Fig. S3a and b†). The obtained composition for copper is lower than the amounts added during synthesis, which is probably its inclusion in the ZnO lattice and its likeness to zinc.
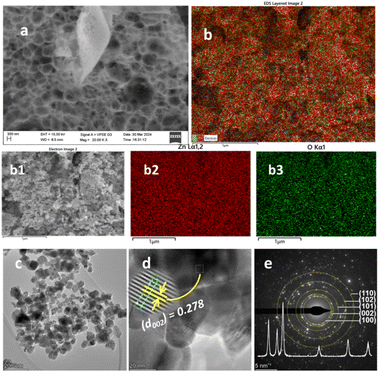
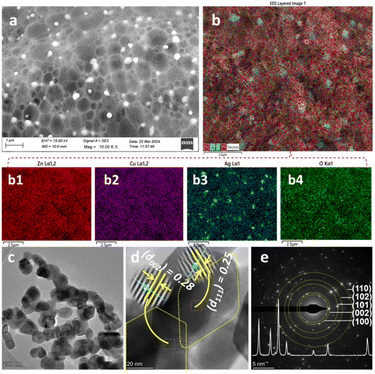
The TEM/HRTEM/SAED images of ZnO and 15c-zac heterostructures are depicted in Fig. 4c–e and 5c–e, respectively. The TEM images of ZnO and 15c-zac heterostructures are depicted in Fig. 4c and 5c, respectively. The image has an agglomerated but less aggregated morphology with a size between 20 and 65 nm. The doped heterostructure also shows more additional porosity and channels compared to bare ZnO NPs. This porosity and channel occur during the evolution of gaseous by-products.23 Fig. 4d and 5d show the HRTEM image analysis for ZnO NPs and c-zac heterostructure, respectively. The d-spacing value of 0.278 nm, obtained from the HRTEM image, for single ZnO NPs matches with the (002) plane of the ZnO crystals. The d-spacing values of 0.280 and 0.25 nm on the c-zac heterostructure are associated with ZnO and Ag crystals, respectively. These d-spacing values correspond to the hexagonal (022) plane of ZnO and the spherical (111) plane of Ag crystallites. The existence of Ag crystals indicates the presence of local contact (Schottky contact) between ZnO and Ag crystals.18,33 Fig. 4e and 5e show the SAED ring images for ZnO and c-zac heterostructures, respectively. The ring and white spots in the SAED image show the crystalline nature of the materials.
2.2. Photocatalysis activity and mechanisms
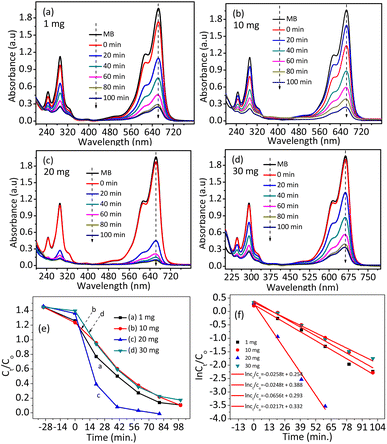
Then, migration of the photon-induced electron and hole on the surface and reaction with adsorbed MB-D occur. The MB-D photocatalytic potential of ZnO NPs, Ag–ZnO, Cu–ZnO, and c-zac is shown in Fig. S5.† ZnO shows less potential (k = 0.0041 min−1) compared to all the other heterostructures. The c-zac heterostructure has better activity (k = 0.023 min−1) compared to the other heterostructures. This is due to the synergistic effects of CuO and Ag crystals. The synergistic effects here indicate a combined effect of the Cu-doped ZnO/Ag/CuO heterostructure, which enhances the optoelectrical and charge transfer properties. The catalyst dose was also optimized by taking different dosage amounts of 1, 10, 20, and 30 mg. The optimum catalyst dosage was obtained to be 20 mg (Fig. 7). The lower photocatalytic potential at lower catalyst amounts is associated with the scarcity of active sites for MB-D sorption. In addition, the lower potential at a higher dosage of 30 mg is associated with turbidity, which prevents light from reaching the surface. Besides, high catalyst amounts also result in decreasing catalyst active sites due to agglomeration in solution.58
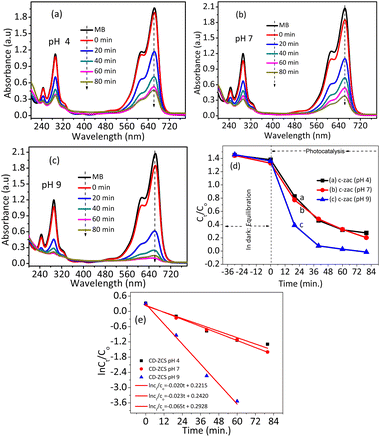
To control the sorption and electrostatic interaction between the catalysts and MB-D solution, pH optimization has been conducted. Fig. 8 shows the effects of pH on the photocatalytic potential of the c-zac heterostructure. In the acidic solution (pH = 4), the catalyst is surrounded by positive hydrogen ions. The electrostatic repulsive interaction between the positively charged MB-D and the catalyst protects the dye's sorption on the catalyst's surface in acidic media. Since there is no photocatalytic reaction without sorption, less photocatalytic activity was observed in acidic pH (k = 0.020 min−1). At a neutral pH of 7, the c-zac heterostructure catalyst degradation activity is relatively better than that at an acidic pH (k = 0.023 min−1). As the solution pH increased to 9, the degradation potential increased significantly (k = 0.065 min−1). At an alkaline pH of 9, the catalyst surface is surrounded by negatively charged hydroxyl ions. Then, the negatively charged catalyst surface and positively charged MB-D electrostatically attract each other. While comparing the photocatalysis potential of this study (k = 0.065 min−1) with the related literature reports,59,60 which have a maximum rate constant value of 0.0261 min−1, the photocatalytic potential for this study is much greater. This enhanced photocatalytic potential is due to the porous nature of the material, which has good pollutant adsorption ability and enhanced optoelectric and charge transfer properties.
As indicated in the XRD pattern analysis interpretation, the crystallite size for the uncalcined 15c-zac heterostructure was about 8 nm. This smaller crystallite size and greater surface area resulted in greater sorption of the dye on the catalyst surface. Of course, this greater sorption property in dark for the uncalcined 5c-zac and 15c-zac heterostructures has been conformed, as shown in Fig. S6b and S7d.† With this information, the photocatalytic activities of calcined and uncalcined ZnO NPs and the c-zac heterostructure were tested at an optimized pH of 9. However, the test showed that the photocatalytic potential for calcined ZnO NPs (k = 0.028 min−1) and c-zac heterostructure (k = 0.067 min−1) is much greater than that of uncalcined ZnO NPs (k = 0.015 min−1) and c-zac heterostructure (k = 0.012 min−1). The decrease in photocatalysis potential for the uncalcined materials is due to a lack of crystallinity and the blockage of the nanocrystals from light by the uncalcinated impurities. Besides, to see the effects of dopant amount, the calcined 5c-zac heterostructure was also tested. Here, the 5c-zac heterostructure showed lower activity (k = 0.017 min−1) than the 15c-zac heterostructure, as shown in Fig. S6g.† The greater photocatalytic potential of heterostructures is a result of the improvement in optical properties and the presence of charge transfer through the interface. The charge transfer is associated with the electron getting relaxation time without recombination.
Thus, reduction and oxidation of oxygen and water for the generation of electroactive species (˙O2− and ˙OH) occur, respectively. In both Z- and S-scheme mechanisms, electrons and holes with less thermodynamic energy are lost. Recently, incorporating a charge mediator such as silver between the two semiconductors was proposed (Fig. S7d†). This mediator insertion was proposed to resolve the electron–hole recombination and quenching problems in the Z- and S-scheme mechanisms.13,14 Copper oxide is a photocatalyst that has enhanced visible light absorption properties.64 Silver also has a surface plasmon resonance property, which involves the oscillation of electrons with the electric field.14 Thus, forming silver and CuO heterojunction can enhance the visible light absorption properties of ZnO and also extend the charge relaxation time for the generation of reactive oxygen species. In this study, the photocatalytic activities of 15c-zac are much better than those of Cu-doped ZnO/CuO as well as Ag/ZnO heterostructures. This indicates that the Z- or S-scheme mechanism in the presence of a silver mediator is the most likely mechanism.
3. Experimental
3.1. Chemicals
The polyvinyl alcohol polymer (PVA), zinc nitrate (Zn(NO3)2·6H2O), copper nitrate (Cu(NO3)2), and silver nitrate (AgNO3, 99%) are chemicals used for this work. These common chemicals are used immediately after purchase without further laboratory purification.3.2. Synthesis of NPs and heterostructures
HSAB theory is a significant theory for selecting dopant–host reactivity balance. Here, solvent hardness is also another crucial consideration for dopant–host reactivity. The soft acid dopant can diffuse and be incorporated into the borderline or hard host acid in hard solvents like alcohol and water.66,67 There are about five common procedures used for the diffusion of dopants in the host lattice.66 The single-source precursors using nitrate metal salts were used for this study. Specifically, the copper and silver soft acid dopants were used to diffuse and exchange Zn in the ZnO lattice.In detail, to synthesize ZnO NPs, first, 1.00 g of PVA was completely dissolved in 50 mL of distilled water while stirring on a magnetic stirrer at a temperature of 70–80 °C.24,29 The PVA aqueous solution was cooled down to a temperature of 50 °C. Then, the Zn(NO3)2·6H2O salt precursor was added and dissolved for about 30 minutes. The solution was then constantly heated to 100 °C (4 h) to remove the solvent and convert the sol to gel. The gel was further heated and combusted by gently increasing the temperature in the range of 150–250 °C. Lastly, the spongy, high-volume combusted product was crushed and calcined at 450 °C for 1 hour. Besides, the effects of PVA amount (0.10–2.00 g), synthesis temperature (30–90 °C), calcination time (1/2–3 h), and dopant amount (0.5–20%) were studied and optimized. To synthesize the c-zc, za, and c-zac heterostructures, the same above-mentioned steps are followed, except for adding the copper nitrate and silver nitrate salt precursors.
3.3. Photocatalytic activity
The photocatalytic activity was conducted by focusing the xenon lamp at a distance of 2 cm. A constant 10 ppm initial concentration of MB-D was used during the experiment. The degradation potential of ZnO NPs, za, c-zc, and c-zac were first tested and optimized. The catalyst amount (1, 10, 20, and 30 mg) and solution pH (4, 7, and 9) were optimized. The degradation potential of calcined and uncalcined ZnO NPs and c-zac with two different dopant concentrations was also tested. To attain catalyst-dye adsorption/desorption equilibration, first the mixture was continuously stirred in the dark for 30 minutes. After the equilibration time, the catalyst-dye mixture was irradiated with a broad-spectrum xenon lamp. An electric fan and water circulation were used to control the reactor temperature. The dye degradation potential was controlled using the UV-vis spectrophotometer with a twenty-minute interval. The percentage efficiency and reaction dynamics were calculated based on the percentage and pseudo-first-order kinetic equations, respectively.363.4. Characterizations
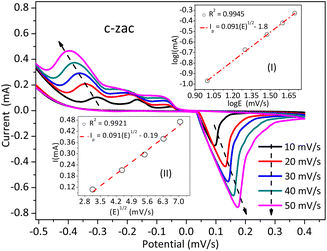
Thermal stability is determined by a thermogravimetric-differential thermal analyzer (DTG-60H). Crystallinity and average crystallite size are examined by X-ray diffractometer (Shimadzu-7000). Morphology, composition, and elemental mapping are studied by field emission-scanning electron microscopes (ZEISS SIGMA VP). Optical properties are observed by double-beam ultraviolet-visible spectroscopy (P9 spectrophotometer). The cyclic voltammetry (CV) (a CHI608E workstation; potentiostat, scan rate, 0.03 (V s−1), sensitivity (0.001 A V−1)) electrochemical analyzer was used to examine the electrochemical properties of ZnO and c-zac. Here, the respective 70![[thin space (1/6-em)]](https://www.rsc.org/images/entities/char_2009.gif) :
:![[thin space (1/6-em)]](https://www.rsc.org/images/entities/char_2009.gif) 15
15![[thin space (1/6-em)]](https://www.rsc.org/images/entities/char_2009.gif) :
:![[thin space (1/6-em)]](https://www.rsc.org/images/entities/char_2009.gif) 15 ratios of graphite powder, silicon oil, and catalyst were mixed to create the NPs and heterostructure paste. Thus, the catalyst paste-modified electrodes as working, the Ag/AgCl standard electrode as a reference, and the platinum wire as a counter electrode were used in the three-electrode system. Besides, a 0.1 M Na2SO4 aqueous solution was used for the Mott–Schottky analysis at four different frequencies of 1, 10, 100, and 1000 Hz with amplitude of 10 mV.
15 ratios of graphite powder, silicon oil, and catalyst were mixed to create the NPs and heterostructure paste. Thus, the catalyst paste-modified electrodes as working, the Ag/AgCl standard electrode as a reference, and the platinum wire as a counter electrode were used in the three-electrode system. Besides, a 0.1 M Na2SO4 aqueous solution was used for the Mott–Schottky analysis at four different frequencies of 1, 10, 100, and 1000 Hz with amplitude of 10 mV.
4. Conclusions
Here, a porous Cu-doped ZnO/Ag/CuO heterostructure is effectively synthesized by the bottom-up combustion approach. A 1.00 g of PVA polymer was obtained to be the optima. Besides, the synthesis temperature of 50 °C and the calcination time of 1 hour were optimized and fixed. The Cu-doped ZnO and ZnO/Ag/CuO formations were confirmed from the HRTEM image and XRD pattern analysis. The obtained crystallite size (XRD) was found to be 10–25 nm. The particle size (TEM) was found to be within the range of 40–75 nm. The porosity observed on the FESEM image is associated with gaseous by-product evolution. The solubility of copper dopant was found to be much better than that of silver. The good silver metal surface distribution was confirmed by the elemental mapping FESEM-EDS analysis. The optical property change for ZnO is associated with copper 3d mid-gap state formation and heterojunction. The mid-gap level is a result of host–dopant sp–d strong exchange interaction. The c-zac heterostructure (k = 0.067 min−1) showed enhanced methylene blue degradation potential compared to single ZnO (k = 0.0041 min−1). The photocatalytic reusability test is also tested and found to be effective until the third cycle. This greater potential is due to the enhanced optoelectric and charge transfer properties. The Z- or S-scheme in the presence of silver as a mediator is a possible mechanism related to the application. However, the dopant level distribution (copper case) using STEM microscopy is our future work. Thus, this modified heterostructure that has good photocatalytic dye degradation potential has noble future outlooks as an environmental pollution control application.Data availability
The data supporting this article have been included as part of the ESI.†Author contributions
Abbay Gebretsadik: investigation and writing—original draft; Bontu Kefale: investigation; Chaluma Sori: data curation; Dereje Tsegaye: writing—review & editing, project administration, and supervision; H. C. Ananda Murthy: validation and writing—review & editing; Buzuayehu Abebe: conceptualization, data curation, methodology, and supervision.Conflicts of interest
There are no conflicts to declare.Acknowledgements
The authors acknowledge Adama Science and Technology University for financial support (ASTU/AS-R/052/2022).Notes and references
- P. O. Oladoye, T. O. Ajiboye, E. O. Omotola and O. J. Oyewola, Results Eng., 2022, 16, 100678 CrossRef CAS.
- B. Abebe, N. K. Gupta and D. Tsegaye, RSC Adv., 2024, 14, 17338–17349 RSC.
- F. Hu, D. Yu, M. Ye, H. Wang, Y. Hao, L. Wang, L. Li, X. Han and S. Peng, Adv. Energy Mater., 2022, 12, 1–10 Search PubMed.
- X. Sun, L. Li, S. Jin, W. Shao, H. Wang, X. Zhang and Y. Xie, eScience, 2023, 3, 100095 CrossRef.
- Y. Hao, F. Hu, S. Zhu, Y. Sun, H. Wang, L. Wang, Y. Wang, J. Xue, Y. Liao, M. Shao and S. Peng, Angew. Chem., Int. Ed., 2023, 62, 1–8 Search PubMed.
- R. Ebrahimi, K. Hossienzadeh, A. Maleki, R. Ghanbari, R. Rezaee, M. Safari, B. Shahmoradi, H. Daraei, A. Jafari, K. Yetilmezsoy and S. H. Puttaiah, J. Environ. Health Sci. Eng., 2019, 17, 479–492 CrossRef CAS PubMed.
- A. Iribarren, E. Hernández-Rodríguez and L. Maqueira, Mater. Res. Bull., 2014, 60, 376–381 CrossRef CAS.
- J. H. Zheng, J. L. Song, Q. Jiang and J. S. Lian, J. Mater. Sci.: Mater. Electron., 2012, 23, 1521–1526 CrossRef CAS.
- B. Divband, M. Khatamian, G. R. K. Eslamian and M. Darbandi, Appl. Surf. Sci., 2013, 284, 80–86 CrossRef CAS.
- T. N. Q. Trang, T. B. Phan, N. D. Nam and V. T. H. Thu, ACS Appl. Mater. Interfaces, 2020, 12, 12195–12206 CrossRef CAS PubMed.
- S. Wang, F. Jia, X. Wang, L. Hu, Y. Sun, G. Yin, T. Zhou, Z. Feng, P. Kumar and B. Liu, ACS Omega, 2020, 5, 5209–5218 CrossRef CAS.
- J. Ran, M. Jaroniec and S. Qiao, Adv. Mater., 2018, 30, 1–31 Search PubMed.
- K. Xu, Z. Liu, S. Qi, Z. Yin, S. Deng, M. Zhang and Z. Sun, RSC Adv., 2020, 10, 34702–34711 RSC.
- S. A. Mahyoub, A. Hezam, F. A. Qaraah, K. Namratha, M. B. Nayan, Q. A. Drmosh, D. Ponnamma and K. Byrappa, ACS Appl. Energy Mater., 2021, 4, 3544–3554 CrossRef CAS.
- X. Liu, A. Dang, T. Li, Y. Sun, T.-C. Lee, W. Deng, S. Wu, A. Zada, T. Zhao and H. Li, ACS Sens., 2023, 8, 1287–1298 CrossRef CAS.
- A. H. Rakhsha, H. Abdizadeh, E. Pourshaban, M. R. Golobostanfard, V. R. Mastelaro and M. Montazerian, Materialia, 2019, 5, 100212 CrossRef CAS.
- A. Modwi, K. K. Taha, L. Khezami, M. Boudina, M. Khairy, O. K. Al-Duaij and S. Talab, Z. Phys. Chem., 2021, 235, 745–767 CrossRef CAS.
- K. Xu, J. Wu, C. F. Tan, G. W. Ho, A. Wei and M. Hong, Nanoscale, 2017, 9, 11574–11583 RSC.
- R. Kant, R. Jakhar and A. Sharma, Mater. Technol., 2022, 37, 2679–2691 CrossRef CAS.
- E. Novitskaya, J. P. Kelly, S. Bhaduri and O. A. Graeve, Int. Mater. Rev., 2021, 66, 188–214 CrossRef CAS.
- S. L. González-Cortés and F. E. Imbert, Appl. Catal., A, 2013, 452, 117–131 CrossRef.
- B. Cai, H. Liu and W. Han, Catalysts, 2020, 10, 1027 CrossRef CAS.
- H. H. Nersisyan, J. H. Lee, J.-R. Ding, K.-S. Kim, K. V. Manukyan and A. S. Mukasyan, Prog. Energy Combust. Sci., 2017, 63, 79–118 CrossRef.
- Y. Gao, F. Meng, X. Li, J. Z. Wen and Z. Li, Catal. Sci. Technol., 2016, 6, 7800–7811 RSC.
- F. Deganello and A. K. Tyagi, Prog. Cryst. Growth Charact. Mater., 2018, 64, 23–61 CrossRef CAS.
- D.-M. Liu, T. Troczynski and W. J. Tseng, Biomaterials, 2002, 23, 1227–1236 CrossRef CAS.
- J. Wang and L. L. Shaw, J. Mater. Sci.: Mater. Med., 2009, 20, 1223–1227 CrossRef CAS.
- V. K. LaMer and R. H. Dinegar, J. Am. Chem. Soc., 1950, 72, 4847–4854 CrossRef CAS.
- B. Liu, Y. You, H. Zhang, H. Wu, J. Jin and H. Liu, RSC Adv., 2016, 6, 110349–110355 RSC.
- P. Budrugeac, J. Therm. Anal. Calorim., 2008, 92, 291–296 CrossRef CAS.
- H. Yang, S. Xu, L. Jiang and Y. Dan, J. Macromol. Sci., Part B: Phys., 2012, 51, 464–480 CrossRef CAS.
- J. Selvi, S. Mahalakshmi, V. Parthasarathy, C. Hu, Y. Lin, K. Tung, R. Anbarasan and A. A. Annie, Polym. Compos., 2019, 40, 3737–3748 CrossRef CAS.
- S. A. Ansari, M. M. Khan, M. O. Ansari, J. Lee and M. H. Cho, J. Phys. Chem. C, 2013, 117, 27023–27030 CrossRef CAS.
- F. A. Alharthi, A. A. Alghamdi, N. Al-Zaqri, H. S. Alanazi, A. A. Alsyahi, A. El Marghany and N. Ahmad, Sci. Rep., 2020, 10, 20229 CrossRef CAS PubMed.
- J. Liu, J. Li, F. Wei, X. Zhao, Y. Su and X. Han, ACS Sustain. Chem. Eng., 2019, 7, 11258–11266 CrossRef CAS.
- B. Abebe, E. A. Zereffa and H. C. A. Murthy, ACS Omega, 2021, 6, 954–964 CrossRef CAS PubMed.
- K. Schneider, J. Mater. Sci.: Mater. Electron., 2020, 31, 10478–10488 CrossRef CAS.
- S. Boulahlib, K. Dib, M. Özacar and Y. Bessekhouad, Opt. Mater., 2021, 113, 110889 CrossRef CAS.
- H. Cai, P. Liang, Z. Hu, L. Shi, X. Yang, J. Sun, N. Xu and J. Wu, Nanoscale Res. Lett., 2016, 11, 104 CrossRef CAS.
- Y. Ma, T.-W. Choi, S. H. Cheung, Y. Cheng, X. Xu, Y.-M. Xie, H.-W. Li, M. Li, H. Luo, W. Zhang, S. K. So, S. Chen and S.-W. Tsang, Nanoscale, 2019, 11, 8736–8743 RSC.
- B. D. Yuhas, D. O. Zitoun, P. J. Pauzauskie, R. He and P. Yang, Angew. Chem., Int. Ed., 2006, 45, 420–423 CrossRef CAS PubMed.
- N. Ali, V. A. Ramasamy, Z. A. Khan, K. Tarafder, A. Kumar, M. K. Wadhwa, B. Singh and S. Ghosh, Sci. Rep., 2019, 9, 20039 CrossRef CAS.
- S. Phanichphant, A. Nakaruk, K. Chansaenpak and D. Channei, Sci. Rep., 2019, 9, 16091 CrossRef.
- S. Ruan, W. Huang, M. Zhao, H. Song and Z. Gao, Mater. Sci. Semicond. Process., 2020, 107, 104835 CrossRef CAS.
- B. Subash, B. Krishnakumar, R. Velmurugan, M. Swaminathan and M. Shanthi, Catal. Sci. Technol., 2012, 2, 2319 RSC.
- H. A. Thabit, N. A. Kabir, A. K. Ismail, S. Alraddadi, A. Bafaqeer and M. A. Saleh, Nanomaterials, 2022, 12, 3068 CrossRef CAS.
- M. Pashchanka, R. C. Hoffmann, A. Gurlo, J. C. Swarbrick, J. Khanderi, J. Engstler, A. Issanin and J. J. Schneider, Dalton Trans., 2011, 40, 4307 RSC.
- R. S. Zeferino, M. B. Flores and U. Pal, J. Appl. Phys., 2011, 109, 014308 CrossRef.
- E. Carlos, R. Martins, E. Fortunato and R. Branquinho, Chem.–Eur. J., 2020, 26, 9099–9125 CrossRef CAS PubMed.
- P. Rong, Y.-F. Jiang, Q. Wang, M. Gu, X.-L. Jiang and Q. Yu, J. Mater. Chem. A, 2022, 10, 6231–6241 RSC.
- B. Abebe and H. C. A. Murthy, RSC Adv., 2022, 12, 5816–5833 RSC.
- M. L. da Silva-Neto, M. C. A. de Oliveira, C. T. Dominguez, R. E. M. Lins, N. Rakov, C. B. de Araújo, L. de S. Menezes, H. P. de Oliveira and A. S. L. Gomes, Sci. Rep., 2019, 9, 11765 CrossRef PubMed.
- L. Lan, G. Gnappi and A. Montenero, J. Mater. Sci., 1993, 28, 2119–2123 CrossRef CAS.
- C.-F. Tang, S. A. Kumar and S.-M. Chen, Anal. Biochem., 2008, 380, 174–183 CrossRef CAS.
- J. Liu, T. Xu, X. Sun, J. Bai and C. Li, J. Alloys Compd., 2019, 807, 151652 CrossRef CAS.
- R. Suresh, K. Giribabu, R. Manigandan, A. Stephen and V. Narayanan, RSC Adv., 2014, 4, 17146 RSC.
- D. Thomas, Z. Rasheed, J. S. Jagan and K. G. Kumar, J. Food Sci. Technol., 2015, 52, 6719–6726 CrossRef CAS.
- Z. Mirzaeifard, Z. Shariatinia, M. Jourshabani and S. M. R. Darvishi, Ind. Eng. Chem. Res., 2020, 59, 15894–15911 CrossRef CAS.
- M. Rabbani, J. Shokraiyan, R. Rahimi and R. Amrollahi, Water Sci. Technol., 2021, 84, 1813–1825 CrossRef CAS PubMed.
- M. Xu, Y. Chen, W. Y. Hu, Y. T. Liu, Q. P. Zhang, H. Yuan, X. Y. Wang, J. X. Zhang, K. Y. Luo, J. Li and G. Xiong, J. Phys. D Appl. Phys., 2020, 53, 025106 CrossRef CAS.
- G. Sun, J. Zhang, B. Cheng, H. Yu, J. Yu and J. Xu, Chem. Eng. J., 2023, 476, 146818 CrossRef CAS.
- G. Sun, Z. Tai, F. Li, Q. Ye, T. Wang, Z. Fang, L. Jia, W. Liu and H. Wang, Small, 2023, 19, 19251–19257 Search PubMed.
- Z. Jiang, B. Cheng, Y. Zhang, S. Wageh, A. A. Al-Ghamdi, J. Yu and L. Wang, J. Mater. Sci. Technol., 2022, 124, 193–201 CrossRef CAS.
- P. Raizada, A. Sudhaik, S. Patial, V. Hasija, A. A. P. Khan, P. Singh, S. Gautam, M. Kaur and V.-H. Nguyen, Arabian J. Chem., 2020, 13, 8424–8457 CrossRef CAS.
- S. Kuriakose, B. Satpati and S. Mohapatra, Phys. Chem. Chem. Phys., 2014, 16, 12741–12749 RSC.
- R. Buonsanti and D. J. Milliron, Chem. Mater., 2013, 25, 1305–1317 CrossRef CAS.
- H. Hu, H. He, J. Zhang, X. Hou and P. Wu, Nanoscale, 2018, 10, 5035–5046 RSC.
Footnotes |
| † Electronic supplementary information (ESI) available. See DOI: https://doi.org/10.1039/d4ra05989a |
| ‡ Department of Prosthodontics, Saveetha Dental College & Hospital, Saveetha Institute of Medical and Technical Science (SIMATS), Saveetha University, Chennai 600077, Tamil Nadu, India. |
| This journal is © The Royal Society of Chemistry 2024 |

