 Open Access Article
Establishment of a Raman microsphere-based immunochromatographic method for the combined detection of influenza A and B viruses and SARS-CoV-2 antigen on a single T-line†
Aolin Zhu‡
 a,
Binbin Zhao‡
 a,
Jiutong Liab,
Xinxia Liac,
Qian Shid,
Xin Zhangd,
Dongmei Lu*e and
Dong Yan*af
aPharmacy Academy of Xinjiang Medical University, Urumqi, 830054, People's Republic of China. E-mail: 252036104@qq.com
bXinjiang Xingyi Bio-Science Co., Ltd, Urumqi, 830011, China
cKey Laboratory of High Incidence Disease Research in Xinjiang (Xinjiang Medical University), Ministry of Education, Urumqi, 830054, China
dDepartment of Clinical Laboratory, Hospital of Xinjiang Production and Construction Corps, No. 232, Qingnian Road, Tianshan District, Urumqi, Xinjiang, China
eRespiratory and Critical Care Medicine, People's Hospital of Xinjiang Uygur Autonomous Region, Urumqi, Xinjiang 830000, China. E-mail: dongmeilu2009@sina.com
fXinjiang Key Laboratory of Biopharmaceuticals and Medical Devices, Urumqi, Xinjiang, China
First published on 22nd November 2024
Abstract
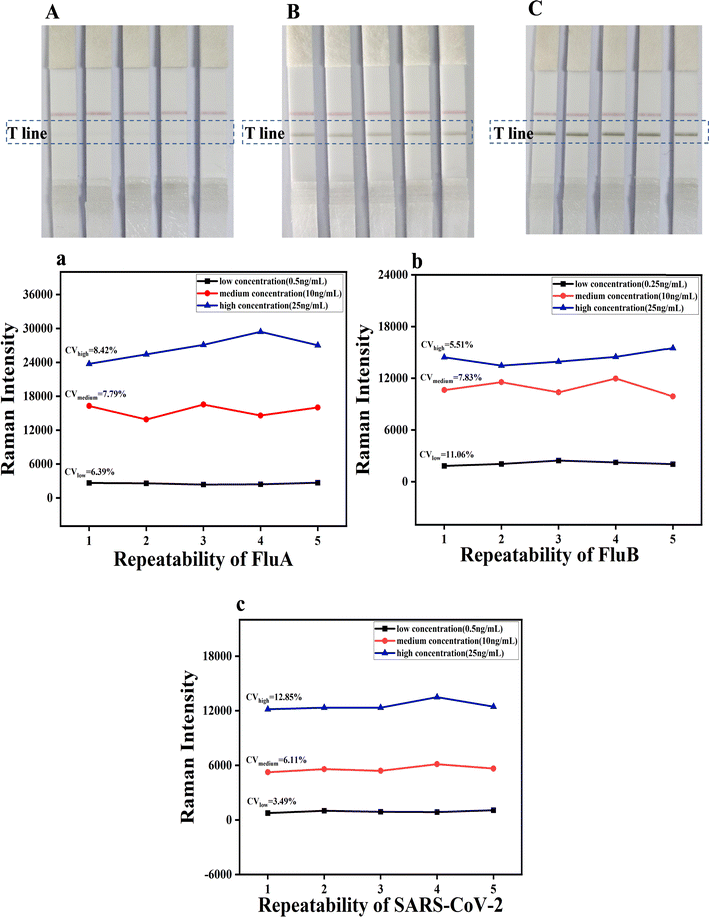
A simple and rapid method based on Raman microsphere immunochromatography was developed in this study for the simultaneous detection of influenza A and B viruses and SARS-CoV-2 on a single test T-line. Three types of Raman microspheres with different Raman characteristics were used as the signal sources and were labelled with monoclonal antibodies against FluA, FluB and SARS-CoV-2, respectively. A mixture of antibodies containing anti-FluA monoclonal antibody, anti-FluB monoclonal antibody and anti-SARS-CoV-2 was sprayed on the detection line (T), and goat polyclonal antibody to chicken (IgY) encapsulated on the quality control line (C), for qualitative detection of these three viruses by the double antibody sandwich method. The results demonstrated that the LOD values were 0.5 ng mL−1 for FluA, 0.25 ng mL−1 for FluB, and 0.5 ng mL−1 for SARS-CoV-2. The method showed good repeatability for the respiratory viral antigens, with CV values below 15%. Oxymetazoline and commonly used oral medications did not interfere with the test results; the strips did not cross-react with common respiratory virus antigens, demonstrating good specificity. This method does not require any complicated pre-treatment, and all three viruses can be detected simultaneously by titrating one sample, which improves the detection efficiency. The Respiratory Pathogen Multiplex provides a scientific basis for preventing and controlling the spread of respiratory diseases by analyzing data to understand epidemiological trends and the spread of pathogens.
1. Introduction
With the gradual metamorphosis of Severe Acute Respiratory Syndrome Coronavirus-2 (SARS-CoV-2) from a pandemic strain to a common epidemic virus, common seasonal respiratory viruses that have been in hiding for the last three years are re-emerging as large-scale epidemics, raising concerns among the public and public health authorities worldwide and gaining increased attention of policymakers.1 Common seasonal respiratory viruses mainly include influenza viruses, Respiratory Syncytial Virus (RSV), Adenoviruses (ADV) and the common coronavirus. Among them, influenza viruses are classified on the basis of their nucleoprotein (NP) and membrane protein (MP) into four types, namely A, B, C and D.2 Influenza A viruses can be transmitted from host to host, mainly through genetic recombination, adaptive mutation, and antigenic variations. The lack of sustained human immunity to influenza A viruses has resulted in several pandemics worldwide as this subtype poses the greatest threat to humans. Influenza B viruses tend to spread in small environments,3 and unlike influenza A viruses, they affect only certain populations, such as children, but are often associated with complications and can be even more harmful to society than influenza A viruses.4 Coronaviruses can adapt to new hosts across species barriers5 and can be transmitted from animals to humans,6 causing a range of predominantly respiratory viral diseases in humans; the symptoms can range from mild fever to severe dyspnea and progress to pneumonia and death. Studies have reported that in some respiratory infections, SARS-CoV-2 is mixed with other respiratory viruses (e.g. influenza A, influenza B and RSV, etc.), which prolongs the duration of the infection7 and further worsens the patient's health condition, leading to a mental and financial burden. Rapid and accurate identification of respiratory viruses not only aids in the precise clinical use of drugs and timely intervention but also provides a solid basis for epidemiological investigation and devising prevention and control measures as respiratory viruses share similar clinical symptoms and transmission and cross-infection routes.Methods currently available for the diagnosis of respiratory viruses include virus isolation and culture methods, serological diagnosis, molecular diagnosis and modern immunological diagnosis.8–11 Traditional virus isolation is the gold diagnostic standard for respiratory viruses,12 while nucleic acid testing and Enzyme-Linked Immunosorbent Assay (ELISA) are the most widely used techniques for detecting viral antigens and antibodies. These diagnostic methods have absolute advantages in accuracy and authority but are relatively complicated and time-consuming.13 Nucleic acid testing requires advanced instrumentation and trained personnel and incurs a high cost but does not meet the demand for immediate detection.14 ELISA experiments involve repeated plate-washing operations, and the steps are laborious.15 The majority of currently employed diagnostic techniques are unable to satisfy the increasing demand for rapid and large-scale field testing of respiratory viruses.
Lateral flow immunoassay (LFIA) test strips have gained considerable traction as a popular point-of-care testing (POCT) tool largely due to their simplicity, cost-effectiveness, and short detection time.16 Conventional LFIA utilizes colloidal gold as the labeling agent and is based on color visualization. However, this method is prone to subjectivity as the results are observed through the naked eye, and it presents relatively limited sensitivity and hence is restricted to qualitative or semi-quantitative detection.17 In recent years, surface-enhanced Raman scattering (SERS) as an optical detection technology has garnered increased interest due to the numerous advantages it offers, including narrow spectral peaks, low optical drift, strong multiplexing ability, high sensitivity, simple operation, fingerprint spectra and the ability to identify a vast number of substances in a single analysis. SERS has found widespread use in protein, bacterial, pathogen and small molecule analyses.18,19 SERS is capable of providing accurate fingerprints even for complex samples at very low concentrations. Some authors have combined SERS with the flow measurement immunoassay (LFIA) technique. In this approach, functional SERS-encoded nanoparticles (SERS tags) are used as signal reporters instead of colloidal gold, thereby combining high sensitivity and quantitative analysis to significantly enhance the detection limits of immunochromatography.20 Notably, the detection capability of SERS-based LFIA is contingent on the efficacy of SERS labelling. A number of studies have demonstrated that SERS signals are largely derived from molecules situated in small ‘hot spots’. These hot spots can be defined as localized areas where the electric field is significantly enhanced. The interaction of a laser beam with the nanoscale noble-metal structures generates hotspot excitation, which amplifies the Raman signal of the substance undergoing detection.21 A number of high-performance SERS substrates have been identified by researchers, including gold nanorods (Au NRs), hollow gold nanospheres, and Au@Ag NPs.22,23 These substrates enable single-molecule detection through SERS technology. Jia et al. used Au@Ag core–shell nanoparticles modified with a bilayer of Raman reporter molecules as SERS substrates for the quantitative detection of Mycoplasma pneumoniae antibodies with a detection limit of 0.1 ng mL−1.24 Russo et al. used gold and silver nano shells as substrates for Raman signal enhancement in the detection of mycovirus protein A and reported a detection limit of 51.8 ng mL−1.25
Recent studies have demonstrated the successful application of SERS-LFA technology to sensitive and quantitative analysis of a diverse range of targets, including viral, inflammatory, and cardiac biomarkers.26–28 The conjugation of Maria's serially encoded gold nanostars with two disease-specific antibodies could reduce the limit of detection in immunoassays by 15-fold for Zika NS1 and by 7-fold for dengue NS1 for a single line of detection on test strips.29 Zhang et al. developed a new lateral flow analysis (LFA) based on Raman dyes (RDs) encoding core–shell surface-enhanced Raman scattering (SERS) nanolabels, which could rapidly quantify three cardiac biomarkers on a single test (T) line, proving valuable in the early diagnosis of acute myocardial infarction (AMI).30 The multiplexing capability of a color-coded assay was demonstrated by Di et al. based on the concurrent detection of aflatoxin B1 (AFB1) and fumonisins type B (FBs) in wheat and wheat-derived food products on a single line of detection utilizing red and blue gold nanoparticles conjugated with antibodies directed towards the two distinct analytes.31 Mao et al. devised a novel CHA-based SERS-LFA apparatus, which enabled the simultaneous detection of miR-21 and miR-196a-5p on a single line, thereby greatly improving the detection efficiency and facilitating the quantitative detection of both miRNAs.32
The technologies used to achieve SERS-LFIA multiplexing have become more sophisticated over time. However, there is no published work on the possibility of detecting three respiratory pathogens simultaneously on a single test line. Accordingly, the objective of this study was to simultaneously detect three respiratory viruses—influenza A, influenza B, and SARS-CoV-2—on a single T-line by SERS-LFA to reduce reagent consumption and cost, shorten the preparation time, and reduce manual operation. The complexity of the assay and the cost of custom Raman instruments can be significantly reduced with a single T-line. Additionally, the multiplicity of a single T-line can be enhanced by utilizing multiple color-coded SERS nanotags. The qualitative test was selected for subsequent ease of use in the clinic. Using the triple test reagent card, only the cutoff value (Yblank + 3SD, Y is the Raman signal value) of each batch of the product can be measured, and a result higher than the cutoff value is considered positive, while a result lower than the cutoff value is considered negative. This allows the direct determination of whether a patient is sick or not. Therefore, this study provides guidance for clinicians to identify patients for treatment and avoid blind drug use and mixed infections, offering a reference for clinical diagnosis.
2. Experimental methods
2.1. Instrumentation and materials
The CT14RD tabletop high-speed freezing centrifuge was obtained from Shanghai Tianmei Biochemical Instrument and Equipment Engineering Co., Ltd. The BSM-220.4 electronic balance was obtained from Shanghai Zhuojing Electronic Technology Co., Ltd. The T-DOA desktop dotting and spraying machine was obtained from Hangzhou Han Sense Technology Co., Ltd. UV-vis adsorption spectra were collected on a spectrometer (L6S, Shanghai Yidian Scientific Instrument Co., Ltd). Transmission electron microscopy (TEM) images of the SERS nanotags were captured by TEM (JEOL JEM-F200, Japan). The diameter and zeta potential values of the nanoparticles were measured on a ZetaSizer Nano ZS90 (Malvern, UK). The Raman spectra of the SERS nanorods and the detection T-line were obtained on a portable Raman spectrometer (Shanghai Lidong Optoelectronic Technology Co., Ltd). For spectral processing, Flavor software, version 1.3.7-R20210805 which accompanies the BLADE-785B-OEM handheld Raman spectrometer was used. The software allows the direct deduction of background baseline and fluorescence signals from the acquired SERS signals and presents them in real time. The algorithm and logic of this process are provided in the ESI (S1).† The excitation wavelength of the laser was 785 nanometres (nm), with a spot diameter of 100 micrometres (μm). The laser power was 100 milliwatts (mW) for each measurement, with an acquisition time of 250 milliseconds (ms).Disodium hydrogen phosphate, sodium dihydrogen phosphate, sodium chloride, aminomethane (Tris), Tween 20, Triton X-100, and sodium chloride (Analytically Pure) were purchased from Sinopharm Chemical Reagent Co., Ltd. PVC base plates and sample pads were purchased from Shanghai Gold Standard Biotechnology Co., Ltd. The Fusion 5 sample pads were purchased from Whatman. The water absorbent pads were purchased from Shanghai Jining Biotechnology Co., Ltd. Bovine serum albumin (BSA) was purchased from Genview. Proclin 300 was purchased from Merck Sigma. Casein was purchased from Tokyo Kasei Kogyo Co., Ltd. The influenza A virus antibody (including the tracer antibody 006 and the capture antibody 009) and the influenza B virus capture antibody 012 were purchased from Fipon Biological Co., Ltd. The influenza A virus antigen was purchased from Suzhou Nearshore Protein Technology Co., Ltd. Sheep anti-chicken antibody was purchased from Chongqing Tansheng Technology Co., Ltd. The influenza B virus antigen and respiratory syncytial antigen were purchased from Shenzhen Heavy Chain Biotechnology Co., Ltd. The SARS-CoV-2 antigen was purchased from Xiamen Wanbo Bio-Technology Co., Ltd. The SARS-CoV-2 antibodies (including tracer antibody 415-1 and capture antibody 415-2) were purchased from Guangzhou Wanfu Bio-technology Co., Ltd. The adenovirus antigen was purchased from Sea Peptide Biotechnology (Shanghai) Co., Ltd. The Mycoplasma pneumoniae antigen was purchased from Shenzhen Heavy Chain Biotechnology Co., Ltd. The Parainfluenza Virus Antibody was purchased from Suzhou East Antibody Co., Ltd. R-Sphere006, R-Sphere013 and R-Sphere026 were obtained from Shanghai Simp Diagnostic Biotechnology Co., Ltd. The experimental water was ultra-pure water obtained from a CJ-A06 system (18.2 MΩ cm−1).
2.2. Synthesis of antibody-conjugated SERS nanotags
To prepare antibody-functionalized SERS nanolabels, FluA monoclonal antibody 006, FluB monoclonal antibody 9C3 and SARS-CoV-2 monoclonal antibody 154 were electrostatically adsorbed onto the surface of R-Sphere013, R-Sphere006 and R-Sphere026, respectively, to form antibody-coupled SERS nanolabels. Briefly, to 1 mL each of the prepared R-Sphere006, R-Sphere013 and R-Sphere026 solutions, 7.5 μg of influenza B virus 9C3 tracer antibody, influenza A virus 006 tracer antibody and SARS-CoV-2 415-1 tracer antibody were added, respectively; the samples were mixed well to react for 15 min, and then 10 μL of 10% BSA was added to close the active end of the unreacted antibodies. After final mixing and reaction for 10 min, the samples were centrifuged (4 °C, 8000 rpm) for 10 min, and the supernatant was discarded. To each of the samples, 100 μL of ultra-pure water was added to redissolve the precipitate to obtain the R-Sphere006-mAbFluB, R-Sphere013-mAbFluA and R-Sphere026-mAbSARS-CoV-2 solutions, which were evenly spread on a 2.5 × 5 cm binding pad and dried for 2 h.2.3. Preparation of a series of standard antigenic solutions
The PBS solution with 1‰Triton was used as the lysate to prepare specific concentrations of influenza A and B viruses and SARS-CoV-2 antigens. A series of standard solutions were prepared by mixing them to achieve respective concentrations (Table 1).| Sample number | 1 | 2 | 3 | 4 | 5 | 6 | 7 | 8 |
|---|---|---|---|---|---|---|---|---|
| FluA (ng mL−1) | 0 | 0.25 | 0.50 | 2.00 | 5.00 | 10.00 | 25.00 | 50.00 |
| FluB (ng mL−1) | 0 | 0.25 | 0.50 | 2.00 | 5.00 | 10.00 | 25.00 | 50.00 |
| SARS-CoV-2 (ng mL−1) | 0 | 0.25 | 0.50 | 2.00 | 5.00 | 10.00 | 25.00 | 50.00 |
2.4. Preparation of test strips
Test strips were prepared as described in the literature.33 The NC membrane (length: 25 mm) was attached to the middle of the PVC backing (length: 80 mm), and a 1![[thin space (1/6-em)]](https://www.rsc.org/images/entities/char_2009.gif) :
:![[thin space (1/6-em)]](https://www.rsc.org/images/entities/char_2009.gif) 1 equimolar mixture of 0.8 mg mL−1 sheep anti-chicken antibody IgY and three capture antibodies (0.4 mg per mL FluA 009 capture antibody, 0.4 mg per mL FluB 012 capture antibody and 0.4 mg per mL SARS-CoV-2 172 capture antibody) was applied to the NC membrane at a rate of 0.8 μL cm−1, followed by a two-hour drying period. Two lines were then produced, with one designated as the control (C) line and the other as the T line. The two lines were separated by a distance of 5 mm. The sample pad (length: 17 mm), coupling pad (length: 4 mm) and absorbent pad (length: 18 mm) were attached to both ends of the NC film in sequence, with each pad overlapping the preceding one by 1.0 mm. Subsequently, using a strip cutter, the pads were cut to a width of 3.4 mm and sealed with a desiccant for storage.
1 equimolar mixture of 0.8 mg mL−1 sheep anti-chicken antibody IgY and three capture antibodies (0.4 mg per mL FluA 009 capture antibody, 0.4 mg per mL FluB 012 capture antibody and 0.4 mg per mL SARS-CoV-2 172 capture antibody) was applied to the NC membrane at a rate of 0.8 μL cm−1, followed by a two-hour drying period. Two lines were then produced, with one designated as the control (C) line and the other as the T line. The two lines were separated by a distance of 5 mm. The sample pad (length: 17 mm), coupling pad (length: 4 mm) and absorbent pad (length: 18 mm) were attached to both ends of the NC film in sequence, with each pad overlapping the preceding one by 1.0 mm. Subsequently, using a strip cutter, the pads were cut to a width of 3.4 mm and sealed with a desiccant for storage.
3. Results and discussion
3.1. Principle of the immunoassay
Fig. 1 illustrates the basic principles of Raman microsphere-based immunochromatography for the simultaneous identification of influenza A, B virus and SARS-CoV-2 antigens. A mixture of the capture antibodies and the structural proteins of the three pathogens, namely influenza A and B viruses and SARS-CoV-2, is immobilized on the T-line of a nitrocellulose membrane, and the tracer antibodies against the structural proteins of the three pathogens are loaded on the surfaces of the Raman microspheres with their respective characteristic spectra, namely R-Sphere013, R-Sphere006 and R-Sphere026, which are mixed and dried on the binding pads. The antigen solution is added dropwise to the sample pad. The sample is chromatographed forward, and the antibodies on the Raman microspheres are re-dissolved. If the sample is positive for one or more viruses in this pathogen group, a specific antigen–antibody reaction takes place at the T-line during chromatography, resulting in the formation of a three-sandwich complex containing the pathogen, which appears grey-black with a certain intensity. The other Raman microsphere antibodies follow the antigen solution and move towards the absorbent pad and are captured by the C-line. If the sample is negative for this group of pathogens, the T-line will not reveal a specific antigen–antibody reaction and will not be stained and will be captured by the C-line as the antigen solution will move towards the absorbent pad. To ensure the validity of the reagent strip, the C-line will show color regardless of whether the result is positive or not. The test strips can be detected for Raman signals at the T-line with a handheld Raman spectrometer, and the spectrograms are analyzed to determine the presence or absence of each pathogen based on the intensity and shifts of the Raman signals at 1618, 2071 and 720 cm−1.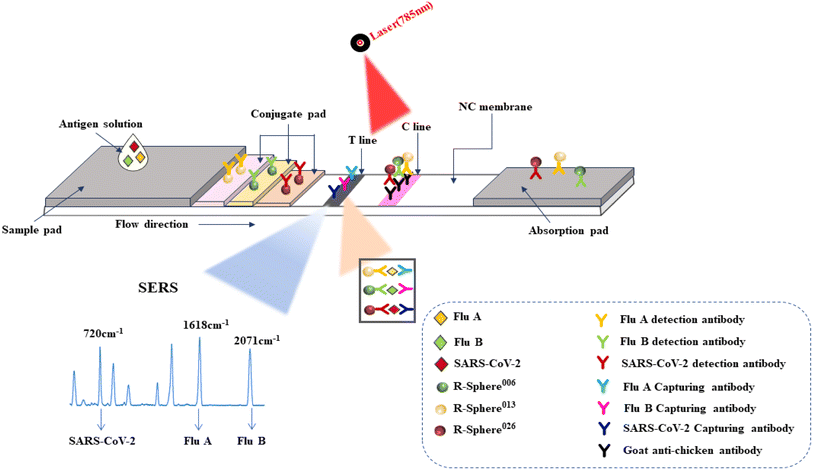 | ||
| Fig. 1 Schematic overview of the assay for the simultaneous detection of influenza viruses A and B and SARS-CoV-2. | ||
3.2. Nanomaterial characterization
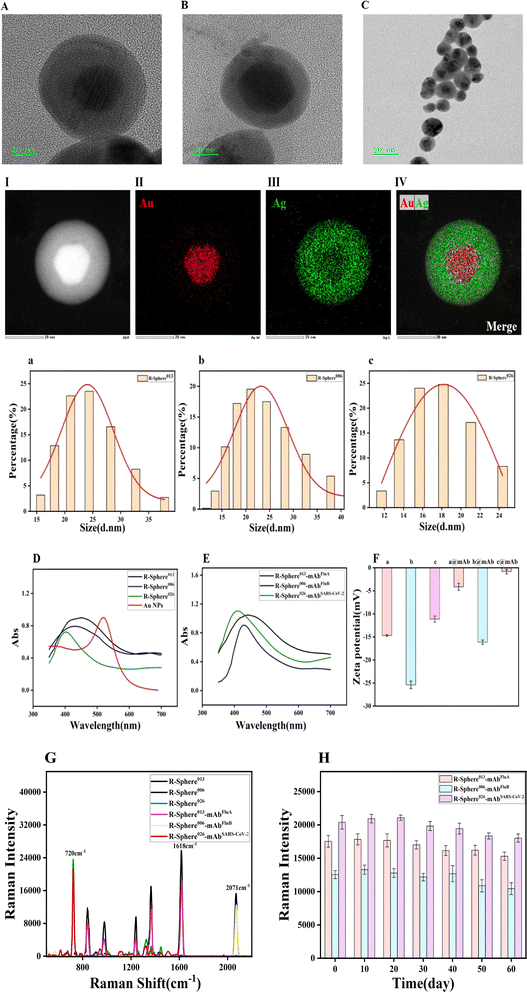
This study involved a typical SERS-based LFIA; silver-shelled nano microspheres with a plasma gold core and molecularly labelled with the Raman reporter (SERS tags) that could be coupled to antibodies and bind to specific target proteins were employed on the T-line. The TEM images (Fig. 2A–C) demonstrated that the R-Sphere013, R-Sphere006 and R-Sphere026 particles exhibited a spherical morphology with uniform particle size and monodisperse distribution. The dark central region observed in the images represents the gold nanocore, while the outer layer is the light silver shell, which demonstrates the successful synthesis of the nano microspheres. To ascertain the configuration of the synthesized nano microspheres, we conducted an elemental mapping analysis of the individual core–shell nano microspheres. The distributions of Au and Ag are indicated in red and green (Fig. 2II and III), respectively, and the energy spectroscopy (EDS) analysis substantiated the simultaneous presence of Au and Ag in the R-Spheres (Fig. 2IV), indicating that the weight proportions of Au and Ag were 16.79% and 83.21%, respectively. Moreover, the diameter of R-Sphere013 obtained by nanoparticle size analysis was about 24.51 ± 5.23 nm, while that of R-Sphere006 was approximately 21.28 ± 5.23 nm, and that of R-Sphere026 was approximately 18.16 ± 3.86 nm (Fig. 2a–c).The UV-visible absorption spectra of the Au NPs, R-Sphere013, R-Sphere006 and R-Sphere026 in the wavelength range of 350–750 nm are presented in Fig. 2D. The maximum absorption peak of Au was at 520 nm. The maximum absorption peaks of R-Sphere013, R-Sphere006 and R-Sphere026 marked in black, blue and green were observed at the wavelengths of 450 nm, 430 nm and 410 nm, respectively. These corresponded with the characteristic absorption peak of Ag when Ag was encapsulated on the surface of the Au NPs, thus indicating the successful synthesis of the Au@Ag core–shell structure. The UV-visible absorption spectra of the SERS nanotags coupled with the respective antibodies exhibited no change in wavelength, indicating that the labelled antibodies did not affect the Raman microspheres (Fig. 2E). Furthermore, the successful coupling of the antibodies with the SERS nanotags was also indicated by the zeta potential (Fig. 2F). The values were −14.7 ± 5.5 for R-Sphere013, −25.2 ± 6.2 for R-Sphere006 and −11.1 ± 5.3 for R-Sphere026. Notably, the zeta potential values changed to −4.1 ± 3.2 for R-Sphere013@mAbFluA, −16.1 ± 5.6 for R-Sphere006@mAbFluB, −0.8 ± 6.9 for R-Sphere026@mAbSARS-CoV-2 which are higher than those of the unmodified microspheres, indicating electrostatic adsorption of the antibodies on the nanomicrospheres. This change in zeta potential proved that the antibody had been successfully modified on these nanomicrospheres.
The Raman signal intensity was elevated as a consequence of the intensified electric field in the gap resulting from the excitation of the gold nuclei by light interaction.34 The Raman shifts observed for R-Sphere026, R-Sphere013 and R-Sphere006 were at 720 cm−1, 1618 cm−1 and 2071 cm−1, respectively. Fig. 3G illustrates that the Raman peaks of R-Sphere013, R-Sphere006 and R-Sphere026 did not interfere with each other. Despite the reduction in the Raman signal, the shifts remained unaltered after antibody coupling. This indicates that the antibody modification exerted a negligible effect on the Raman intensities of the SERS nanotags. This finding establishes the feasibility of simultaneous detection of the three viral antigens. In addition, the Raman microspheres were stored at 4 °C after antibody coupling, and their Raman intensities decreased to some extent with the extension of storage time. After 60 days of storage, their Raman intensities were over 70% of the Raman intensities of the freshly prepared antibody-coupled nanomicrospheres (Fig. 3H), indicating that the SERS nanomicrospheres have good stability after antibody coupling.
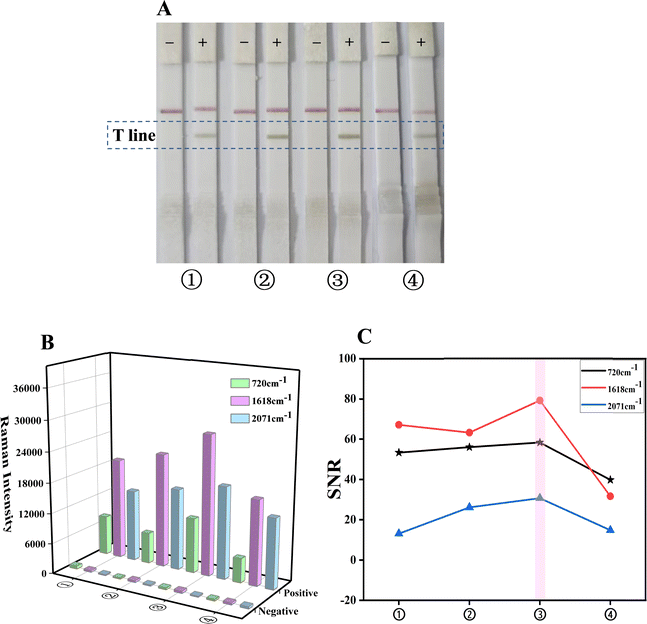 | ||
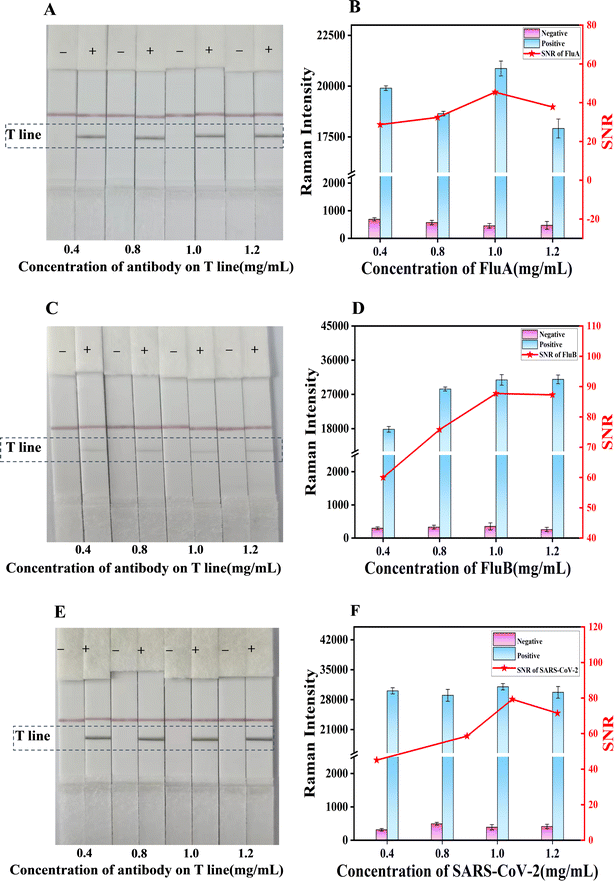
| Fig. 3 Optimization of the sample pad treatment solution: (A) photo of the test strips; (B) SERS signals at 720, 1618 and 2071 cm−1 of the corresponding T-lines; (C) signal-to-noise ratio. | ||
3.3. Optimization of the combined influenza A, B virus and SARS-CoV-2 detection system
3.4. Performance of the triple test strips
Subsequently, 100 μL of FluA, FluB and SARS-CoV-2 solutions at varying concentrations (0, 0.25, 0.5, 2, 5, 10, 25 and 50 ng mL−1) were added to the sample pad. As the concentration of the FluA, FluB and SARS-CoV-2 antigens on the sample pad increased, the color of the test line also became darker. The visual limit of detection (vLOD) for qualitative evaluation was defined as the concentration of FluA, FluB and SARS-CoV-2 corresponding to the lightest color of the test line discernible to the naked eye. As illustrated in Fig. 5B–D, the images of the test strips with varying concentrations of FluA, FluB and SARS-CoV-2 antigen solutions were captured by loading 2, 5 and 5 ng mL−1 for the detection lines of FluA, FluB and SARS-CoV-2, respectively. It was observed that as the antigen concentration increased, the corresponding Raman signals of the detection line also increased (Fig. 5b–d). The Raman intensity value of FluA exceeded 1810 when the concentration was 0.5 ng mL−1, 569 when the concentration of SARS-CoV-2 was 0.5 ng mL−1, and 706 when the concentration of FluB was 0.25 ng mL−1. These results indicate that the respective LODs for FluA, FluB and SARS-CoV-2 were 0.5 ng mL−1, 0.25 ng mL−1 and 0.5 ng mL−1, respectively. Therefore, the sensitivity of the portable Raman spectrometer was approximately four times, twenty times and ten times higher than that of naked-eye visualization.
The established triple detection immunochromatographic system was used for the sensitive detection of mixed solutions of two viruses (influenza A and B/influenza B and SARS-CoV-2/influenza A and SARS-CoV-2) and all three viruses concurrently. This allows for a comparison between the absence of a virus and the identification of a particular virus, in accordance with the previously calculated cutoff values. Fig. 5E illustrates the images of the test strips containing varying concentrations of FluA and FluB antigens combined. The T-line SERS signal (Fig. 5e) indicated an LOD of 0.25 ng mL−1 for FluA and 0.25 ng mL−1 for FluB. Fig. 5F illustrates the images of the test strips with varying concentrations of FluB and SARS-CoV-2 antigens combined. The T-line SERS signal (Fig. 5f) revealed an LOD of 0.25 ng mL−1 for FluB and 0.5 ng mL−1 for SARS-CoV-2. Fig. 5G illustrates the images of the test strips with varying concentrations of FluA and SARS-CoV-2 antigens combined. The T-line SERS signal (Fig. 5g) indicated an LOD of 0.25 ng mL−1 for FluA and 0.5 ng mL−1 for SARS-CoV-2. When the three samples were mixed, the colour of the T-line turned darker as the concentration increased (Fig. 5H), and the SERS signal was also positively proportional to the concentration (Fig. 5h), yielding an LOD of 0.5 ng mL−1 for FluA (1618 cm−1), 0.25 ng mL−1 for FluB (2071 cm−1), and 0.5 ng mL−1 for SARS-CoV-2 (720 cm−1). These results also match well with the results shown in Fig. S2a–h (ESI).† The LOD values obtained for the mixture of the three viral samples are identical to the LOD results obtained with the individual viruses, indicating that the number of viral sample types present in the solution did not affect the qualitative detection of FluA, FluB, and SARS-CoV-2 on a single T-line. Accordingly, the simultaneous detection of the three viruses on a single T-line is approximately three times more rapid than SERS LFA on three T-lines, which is conducive to rapid detection.
Influenza A, influenza B and SARS-CoV-2 were detected by colloidal gold immunochromatography, as shown in Fig. 5I–III, with visual detection limits of 5.00 ng mL−1 for influenza A and 2.00 ng mL−1 for influenza B and SARS-CoV-2. Compared with colloidal gold chromatography, the Raman immunochromatographic technique for triple testing established in this experiment presents increased sensitivity to influenza A, influenza B and SARS-CoV-2 by 10, 8 and 8 times, respectively. This indicates that the triple test strips prepared in this work have high sensitivity.
4. Conclusion
Based on Raman microsphere immunochromatography, we developed a platform for the rapid, qualitative and simultaneous detection of influenza A, influenza B virus and SARS-CoV-2 on a single T-line. Three kinds of Raman nanoparticles (RNPs) with different characteristic Raman spectral peak shifts were used to label the three respiratory viruses for simultaneous detection, and the T-line was scanned using a portable Raman spectrometer. The LOD values obtained were 0.5 ng mL−1 for influenza A, 0.25 ng mL−1 for influenza B, and 0.5 ng mL−1 for SARS-CoV-2, which were 10, 8, and 8 times more sensitive than colloidal gold immunochromatography, respectively. In comparison with three T-line SERS LFA, the quantity and cost associated with the requisite reagents are reduced, the preparation time is shorter, and the experimental operation is streamlined, taking only 15 minutes from the start of the test to reading the results, which is conducive to rapid screening of pathogens with similar clinical symptoms. This assay can provide preliminary test results at a reduced cost. In conclusion, Raman microsphere-based immunochromatographic test strips demonstrate a promising future in the detection of respiratory pathogens.Data availability
Data will be made available on request.Authorship contributions
Aolin Zhu: original draft, writing – review & editing, methodology, investigation, data curation. Binbin Zhao: original draft, writing – review & editing methodology, investigation, data curation. Jiutong Li: writing – review & editing, supervision, resources, project administration, funding acquisition. Xinxia Li: writing – review & editing, supervision, resources, project administration, funding acquisition. Qian Shi: writing – review & editing, supervision, resources. Xin Zhang: writing – review & editing, supervision, resources. Dongmei Lu: writing – review & editing, supervision, resources, project administration. Dong Yan: writing – review & editing, supervision, resources, project administration, funding acquisition.Conflicts of interest
There are no conflicts of interest to declare.Acknowledgements
This research has been funded by the Tianshan Talent Training Program (2023T SYCLJ0028), the National Clinical Key Specialty Construction Project (grant number: Bingcaishe [2023] 16), the Clinical Medical Research Center for Laboratory Medicine of Xinjiang Production and Construction Corps (grant number: Bingkefa [2023] 12), the Science and Technology Research Program in Key Areas of Xinjiang Production and Construction Corps (grant number: 2022AB030 [2022]).References
- X. L. Xu, S. W. Ge, C. N. Chen, M. Wen, J. Y. Fu and J. Mod, Lab. Med., 2021, 36, 140–143 Search PubMed.
- J. Y. Zeng, Selection and Characterization of DNA Aptamers for H1N1, H3N2 and influenza B virus, Huaqiao University, 2021, DOI:10.27155/d.cnki.ghqiu.2021.000644.
- L. Jennings, Q. S. Huang, L. Barr, P. Lee, W. J. Kim, P. Buchy, M. Sannicas, B. A. Mungall and J. Chen, Influenza Other Respir. Viruses, 2018, 12, 383–411 CrossRef PubMed.
- H. Zaraket, A. C. Hurt, B. Clinch, L. Barr and N. Lee, Antiviral Res., 2021, 185, 104970 CrossRef CAS PubMed.
- Y. Chen, Q. Liu and D. Guo, J. Med. Virol., 2020, 92, 418–423 CrossRef CAS PubMed.
- S. Leopardi, E. C. Holmes, M. Gastaldelli, L. Tassoni, P. Priori, D. Scaravelli, G. Zamperin and P. D. Benedictis, Infect., Genet. Evol., 2018, 58, 279–289 CrossRef CAS PubMed.
- L. Bai, Y. L. Zhao, J. Z. Dong, S. Liang, M. Guo, X. J. Liu, W. Xin, Z. X. Huang, X. Y. Sun, Z. Zhang, L. H. Dong, Q. Y. Liu, Y. C. Zheng, D. P. Niu, M. Xiang, K. Song, J. J. Ye, W. C. Zheng, Z. D. Tang, M. L. Tang, Y. Zhou, C. Shen, M. Dai, L. Zhou, Y. Chen, H. Yan, K. Lan and K. Xu, Cell Res., 2021, 31, 395–403 CrossRef CAS PubMed.
- S. V. Vemula, J. Q. Zhao, J. K. Liu, X. Wang, S. Biswas and I. Hewlett, Viruses, 2016, 8, 96 CrossRef PubMed.
- S. H. Zhang, H. Tian, N. Jiang, X. C. Wang, H. Huang, C. C. Li, X. X. Kong, C. Dong, L. Zhou, J. F. Peng, X. L. Guo, H. Jin and L. G. Zhu, J. Southeast Univ., 2023, 42, 439–445 Search PubMed.
- X. G. Wang, G. Lu, J. J. Cheng, S. Q. Cheng, L. T. Zhong, Z. Y. Lai, B. Jia, L. Xu, J. J. Ou, Y. Q. Xiao, X. R. Hu, F. Wang, M. T. Lai, R. Shao, F. Y. Zheng and L. G. Yuan, Heilongjiang Anim. Sci. Vet. Med., 2023, 83–89 Search PubMed.
- J. D. Zhao, Y. H. Li, R. R. Li, V. Timira, B. P. Dasanayaka, Z. Y. Zhang, J. K. Zhang, H. Lin and Z. X. Li, Food Control, 2022, 138, 108983 CrossRef CAS.
- X. Li, Respiratory disease isothermal nucleic acid detection system based on microfluidic technology, University of Chinese Academy of Sciences, 2023, DOI:10.27522/d.cnki.gkcgs.2023.000201.
- Z. W. Zhang, P. Ma, R. Ahmed, J. Wang, D. Akin, F. Soto, B. F. Liu, P. W. Li and U. Demirci, Adv. Mater., 2021, 34, 2103646 CrossRef.
- M. Park, J. W, B. Y. Choi and C. J. Lee, Exp. Mol. Med., 2020, 52, 963–977 CrossRef CAS PubMed.
- Z. Z. Liu, Study on rapid and highly sensitive quantitative detection technology of respiratory viruses based on magnetic SERS immunochromatography, Academy of Military Sciences, 2023, DOI:10.27193/d.cnki.gjsky.2023.000086.
- P. Brangel, A. Sobarzo, C. Parolo, B. S. Miller, P. D. Howes, S. Gelkop, J. J. Lutwama, J. M. Dye, R. A. Mckendry, L. Lobel and M. M. Stevens, ACS Nano, 2018, 12, 63–73 CrossRef CAS PubMed.
- C. W. Wang, C. G. Wang, X. L. Wang, K. L. Wang, Y. H. Zhu, Z. Rong, W. Y. Wang, R. Xiao and S. Q. Wang, ACS Appl. Mater. Interfaces, 2019, 11, 19495–19505 CrossRef CAS PubMed.
- S. S. Lin, Y. S. Zheng, Y. L. Xing, K. Dou, R. Wang, H. W. Cui, R. Wang and F. B. Yu, Talanta, 2024, 280, 126691 CrossRef CAS PubMed.
- C. N. Wang, G. P. Xu, W. J. Wang, Z. Y. Ren, C. M. Zhang, Y. Gong, M. W. Zhao, Y. Y. Qu, W. F. Li, H. T. Zhou and Y. Q. Li, Biosens. Bioelectron., 2023, 237, 115497 CrossRef CAS PubMed.
- Y. Sun, L. Xu, F. D. Zhang, Z. G. Song, Y. W. Hu, Y. J. Ji, J. Y. Shen, B. Li, H. Z. Lu and H. F. Yang, Biosens. Bioelectron., 2017, 89, 906–912 CrossRef CAS PubMed.
- J. Qian, L. L. Zhao, Y. B. Huang, C. X. Zhao, H. Liu, X. R. Liu, Z. Y. Cheng and F. B. Yu, Chem. Eng. J., 2024, 482, 149012 CrossRef CAS.
- L. C. Lu, J. L. Yu, X. X. Liu, X. S. Yang, Z. H. Zhou, Q. Jin, R. Xiao and C. W. Wang, RSC Adv., 2020, 10, 271–281 RSC.
- J. F. Wang, X. Z. Wu, C. W. Wang, Z. Rong, H. M. Ding, H. Li, S. H. Li, N. S. Shao, P. T. Dong, R. Xiao and S. Q. Wang, ACS Appl. Mater. Interfaces, 2016, 8, 19958–19967 CrossRef CAS.
- X. F. Jia, C. W. Wang, Z. Rong, J. Li, K. L. Wang, Z. W. Qie, R. Xiao and S. Q. Wang, RSC Adv., 2018, 8, 21243–21251 RSC.
- L. Russo, M. S. Purrà, C. R. Quijada, B. M. Leonardo, V. Puntes and K. H. Schifferli, Nanoscale, 2019, 11, 10819–10827 RSC.
- Z. Z. Liu, C. W. Wang, S. Zheng, X. S. Yang, H. Han, Y. W. Dai and R. Xiao, Nanomedicine, 2023, 47, 102624 CrossRef CAS PubMed.
- X. X. Liu, X. S. Yang, K. Li, H. F. Liu, R. Xiao, W. Y. Wang, C. W. Wang and S. Q. Wang, Sens. Actuators, B, 2020, 320, 128350 CrossRef CAS.
- Y. Li, X. J. Liu, J. C. Guo, Y. T. Zhang, J. H. Guo, X. G. Wu, B. Wang and X. Ma, Nanomaterials, 2021, 11, 1496 CrossRef CAS PubMed.
- M. S. Purrà, B. R. Solvas, C. R. Quijada, B. M. Leonardo and K. H. Schifferli, ACS Infect. Dis., 2017, 3, 767–776 CrossRef PubMed.
- D. Zhang, L. Huang, B. Liu, E. Su, H. Y. Chen, Z. Z. Gu and X. W. Zhao, Sens. Actuators, B, 2018, 277, 502–509 CrossRef CAS.
- F. Di. Nardo, E. Alladio, C. Baggiani, S. Cavalera, C. Giovannoli, G. Spano and L. Anfossi, Talanta, 2019, 192, 288–294 CrossRef.
- Y. Mao, Y. Sun, J. Xue, W. B. Lu and X. W. Cao, Anal. Chim. Acat., 2021, 1178, 338800 CrossRef CAS.
- Q. Bayin, L. Huang, C. H. Ren, Y. S. Fu, X. Ma and J. H. Guo, Talanta, 2021, 227, 122207 CrossRef CAS.
- R. P. Chen, H. Wang, C. Q. Sun, Y. G. Zhao, Y. He, M. S. Nisar, W. S. Wei, H. Q. Kang, X. L. Xie, C. M. Du, Q. Y. Luo, L. Yang, X. F. Tang and B. H. Xiong, Talanta, 2023, 258, 124401 CrossRef CAS.
- H. F. Liu, E. Dai, R. Xiao, Z. H. Zhou, M. L. Zhang, Z. K. Bai, Y. Shao, K. Z. Qi, J. Tu, C. W. Wang and S. Q. Wang, Sens. Actuators, B, 2021, 329, 129196 CrossRef CAS.
Footnotes |
| † Electronic supplementary information (ESI) available. See DOI: https://doi.org/10.1039/d4ra05483k |
| ‡ These authors contributed equally to this work. |
| This journal is © The Royal Society of Chemistry 2024 |

