 Open Access Article
Innovative multi-layered Fe3O4-Gr/carbon/polypyrrole nanofiber composite: “a new frontier in dielectric enhancement and EMI shielding”
Ujala Anwar a,
Muhammad Rafi
 b,
Naveed A. Noor
 c,
Sadia Nazir
 *d,
Sohail Mumtaz
 e and
Ihab Mohamed Moussaf
aInstitute of Chemical Sciences, Bahauddin Zakariya University, Multan 60000, Pakistan
bDepartment of Basic Sciences (Physics), University of Wah, Quaid-e-Azam Avenue, Wah Cantt 47040, Pakistan
cDepartment of Physics, University of Sargodha, 40100, Sargodha, Pakistan
dDepartment of Physics, University of Lahore, Pakistan. E-mail: sadiamalik.chep@gmail.com
eDepartment of Electrical and Biological Physics, Kwangwoon University, Seoul 01897, South Korea
fDepartment of Botany and Microbiology, College of Science, King Saud University, P.O. Box 2455, Riyadh, 11451, Saudi Arabia
First published on 22nd November 2024
Abstract
This study presents the synthesis and comprehensive characterization of an Fe3O4-Gr/carbon/polypyrrole nanofiber composite, highlighting its morphology as determined through Field Emission Scanning Electron Microscopy (FE-SEM) analysis, which reveals the small rod-like shape of the nano-fibers with an average diameter of 68 nm calculated from Image J software, contributing to a high surface area. X-ray diffraction (XRD) analysis confirms the effective formation of Fe3O4-Gr nanofibers, graphene, carbon, and polypyrrole (PPy), showcasing distinct crystallographic phases that strengthen the material's magnetic and conductive properties. The impedance plane plot indicates two relaxation processes at low and high-frequency regions from low to high-temperature ranges of 273 K to 363 K, reflecting complex electroactive charge transport dynamics within the nanofiber composite. Dielectric measurements demonstrate a high dielectric constant (up to 105) at lower frequencies, with a gradual decrease at higher frequencies, while tangent loss remains below 1 at higher frequencies and increases at lower frequencies with rising temperatures. The MVRH (Mott. Variable Range Hopping) model reveals a localization length of 1.5 Å, indicating localized charge carrier hopping, which contributes to the composite's electrical conductivity. The SPH (Small Polaronic Hopping) model suggests an activation energy of 1.43 eV, consistent with thermally activated charge carrier transport. In accordance with the double-well model, the conductivity plot also confirms the existence of dual relaxation peaks at low and high frequencies. Last but not least, the composite achieves 99.7% absorption and 99.8% attenuation across the x-band frequency range with a total shielding effectiveness (SET) of 28.4 dB at a thickness of 3 mm.
1 Introduction
Innovative materials that can simultaneously meet the requirements of high-performance electromagnetic interference (EMI) shielding and dielectric properties have been developed in the rapidly evolving field of materials science.1 Due to their unique capacity to synergistically combine the strengths of each constituent material, nanocomposites containing magnetic, conductive, and dielectric components have received significant attention.2 The search for novel composites with exceptional performance is being fueled by the fact that traditional materials frequently fail to meet these numerous requirements.3 The multi-layered Fe3O4-Gr/C/PPy nanofiber composite is remarkable in this context because it provides a flexible platform that bridges the gap between conventional materials and the next generation of multifunctional composites.4 The creation of sophisticated nanofiber composites with multiple functional components integrated into a single, synergistic framework has been made possible by recent advancements in nanotechnology.5 Due to their unique combination of dielectric properties and EMI shielding interference, multi-layered Fe3O4-Gr/C/PPy nanofibers have emerged as promising candidates.6 To improve electrical conductivity and stability, graphene (Gr) and carbon layers are combined with Fe3O4-Gr nanofibers, which are renowned for their magnetic properties.7 In addition to providing additional dielectric support, the outer PPy coating also contributes to the composite's overall structural integrity.8Due to its low cost, extensive application, and strong magnetic saturation strength, tri-iron tetraoxide (Fe3O4), sometimes referred to as magnetic ferroferric oxide, is a potent microwave enhancer furthermore, the field of microwave absorption has extensively employed and validated Fe3O4's magnetic loss capability.9 Fe3O4 (iron oxide) nanofibers are an important part of improving dielectric performance because of their outstanding charge storage capacity and inherent magnetic characteristics.10 The electrical characteristics of nanofiber composites are greatly enhanced by graphene (Gr), owing to its exceptional electrical conductivity and large surface area.11 While PPy, a conductive polymer, provides exceptional flexibility and tunable conductivity, carbon layers add further mechanical strength and conductivity.12 The combination of these elements to create Fe3O4-Gr/C/PPy, a single nanofiber composite, is a novel method in material science.13 This composite construction offers exceptional EMI shielding efficiency in addition to improving the dielectric constant and synergistically reducing tangent loss. To achieve unparalleled performance in both dielectric and EMI shielding applications, the layered architecture makes sure that each component's special qualities are fully utilized.14 These mechanisms include interfacial polarization between graphene (Gr) and Fe3O4, conductive loss from the high conductivity in the composites, and magnetic loss from the magnetic oxides.
Materials with a carbon basis are widely utilized as dielectric-type microwave absorbers. Graphene (Gr), carbon nanotubes (CNTs), carbon fibers (CF), and carbon black (CB) are a few examples of these materials.15 These materials primarily rely on strong conductivity and dielectric relaxation to dissipate electromagnetic wave energy.16 Gr has garnered significant interest from scientists recently due to its exceptional properties, such as its exceptional electrical conductivity and high specific surface area.17 However, it's crucial to remember that relying solely on one kind of graphene might not be sufficient to produce the necessary microwave absorption effect.18 In order to get around these challenges, scientists often combine Gr with magnetic oxide materials in order to increase impedance matching, decrease conductivity, and incorporate a range of loss processes.19 Researchers are quite interested in this composite material as a potential means of enhancing electromagnetic absorption.20
The production and characterization of these sophisticated nanofiber composites are explored in this publication, along with how they can transform EMI and dielectric shielding technologies. We hope to offer an extensive study that demonstrates how Fe3O4-Gr/C/PPy nanofibers can establish new benchmarks in material performance, opening the door for future advancements in electronic materials science by utilizing the synergistic benefits of each component within the composite.21 In the field of advanced technology, the multi-layered Fe3O4-Gr/C/PPy composite is well-positioned to tackle some of the most critical problems. It is the perfect option for EMI applications due to its remarkable qualities, which include high dielectric constants, reduced tangent losses, excellent charge transport mechanisms, and great EMI shielding effectiveness. A variety of methods, such as hydrothermal synthesis, electrospinning, and oxidative polymerization of pyrrole, are used to carefully control the morphology and chemical composition of the nanomaterials to optimize the EMI performance characteristics. When the electrical properties are well understood, it will be easier to correlate dielectric properties with electro-active regions over a wide range of temperatures and frequencies.
The electrical properties of solid-state nanofiber composite systems are investigated using impedance spectroscopy (IS), the most active and widely used method for studying electrical transport mechanisms through different electroactive regions (grains, grain boundaries, interfaces, and contact effect). Among the promising candidates, Fe3O4-Gr/C/PPy nanofibers stand out due to their unique structural and well-designed attributes. Fe3O4-Gr/C/PPy nanofiber composites represent a significant leap forward by merging the high magnetic permeability of Fe3O4-Gr, the exceptional conductivity and mechanical strength of graphene and carbon, and the versatile electrochemical properties of PPy. This unique tri-layer structure not only improves dielectric performance but also offers enhanced EMI shielding capabilities, making it a powerful solution for contemporary electronic and electromagnetic applications.
2 Experimental section
2.1. Materials
The following materials and chemicals were obtained from commercial sources for this investigation: polyvinylpyrrolidone (PVP), molecular weight: 1![[thin space (1/6-em)]](https://www.rsc.org/images/entities/char_2009.gif) 300
300![[thin space (1/6-em)]](https://www.rsc.org/images/entities/char_2009.gif) 000, iron(III) nitrate nonahydrate (Fe (NO3)3·9H2O, analytical reagent grade, 98%), (C3H7NO) N,N-dimethylformamide (DMF), glucose (C6H12O6), urea (CH4N2O), ferric chloride hexahydrate (FeCl3·6H2O), n-hexane (C6H14) pyrrole (C4H5N) and ethanol (C2H5OH). All chemicals are of the highest purity available from Sigma-Aldrich and used as received. Deionized (DI) water is used to prepare solutions.
000, iron(III) nitrate nonahydrate (Fe (NO3)3·9H2O, analytical reagent grade, 98%), (C3H7NO) N,N-dimethylformamide (DMF), glucose (C6H12O6), urea (CH4N2O), ferric chloride hexahydrate (FeCl3·6H2O), n-hexane (C6H14) pyrrole (C4H5N) and ethanol (C2H5OH). All chemicals are of the highest purity available from Sigma-Aldrich and used as received. Deionized (DI) water is used to prepare solutions.
2.2. Preparation of Fe3O4-Gr nanofiber
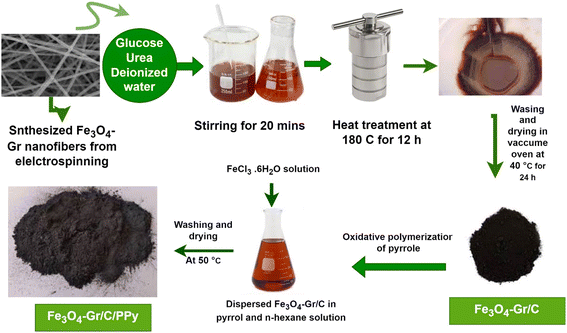
The process involves the production of fibers through electrospinning with diameters ranging from nano to micrometers. First, 9% weight of PVP is dissolved in 50 milliliters of DMF and 50 milliliters of isopropanol at room temperature. The mixture is then stirred for one hour to create a transparent solution. Next, 9% weight of iron nitrate and 0.2% weight of graphene are added to the ready solution. Finally, the mixture is stirred for twelve hours, loaded into a 20 milliliter syringe (20 mL) and pumped to the multi-needle spinneret (needles of 19-gauge). The aluminum foil collector plate is positioned nine centimeters from the needle tip. The electrospinning process is carried out at a voltage of 12 kV, a solution feed rate of 4 mL h−1, a temperature of 30–35 °C, and relative humidity below 22%. An electrically charged solution is stretched through the needle tip when a high voltage is applied between the needle tip and the conducting collector plate. This happens because the electric field is stronger than the surface tension of the droplet. The stretched droplet is ejected as a jet toward a conducting collecting plate with an opposing charge due to the strong electric field. The solvent progressively evaporates during the jet's journey, causing charged fibers to build up on the conducting collection plate. For one hour, the electrospun fibers placed on the collector plate are heated at 200 °C to ensure full drying. Then, the nanofibers are annealed at 450 °C for two hours, with a temperature ramping rate of 3 °C min−1, to form Fe3O4-Gr nanofibers.222.3. Preparation of Fe3O4-Gr/carbon nanofibers composite
In 100 milliliters of water, 0.03 moles of glucose and 0.3 moles of urea are combined to form a Fe3O4-Gr/carbon nanofibers composite. The synthesized Fe3O4-Gr nanofiber was then spread throughout the mixture. After that, the mixture is transferred to a 100 mL Teflon autoclave and heated at 180 °C for 12 hours. The resulting blackish-brown (Fe3O4-Gr/carbon) nanofibers are extracted and then repeatedly cleaned in ethanol and DI water before being dried for ten hours at 50 °C in a vacuum oven.232.4. Preparation of Fe3O4-Gr/carbon/polypyrrole nanofibers composite
This process involves ultrasonically dispersing blackish dark Fe3O4-Gr/carbon powder for one hour in a solution of pyrrole monomers (12 mL) and n-hexane (60 mL). A 12 g FeCl3·6H2O solution is chilled after being dissolved crosswise in 100 mL DI water. For the oxidative polymerization of pyrrole monomer, the precooled oxidant solution (FeCl3·6H2O) is added to the black suspension and agitated for a whole day. The black precipitates that result (Fe3O4-Gr/C/PPy) nanofibers composite is dried at 50 °C after being repeatedly cleaned with ethanol and DI water (Fig. 1).243 Results and discussion
The FE-SEM analysis of Fe3O4-Gr nanofibers reveals a striking rod-like morphology, with an average diameter of approximately 68 nm calculated by image J software, showcasing the successful synthesis of highly uniform and well-defined nanostructures. The Fe3O4-Gr nanofibers are homogeneously distributed along the graphene backbone, adhering closely to the rod-like nanofiber structure as shown in Fig. 2(a). This intimate integration ensures that the magnetic properties of Fe3O4-Gr are effectively harnessed while maintaining the mechanical strength and flexibility imparted by the graphene layers. The small diameter and rod-like shape of the nanofibers increase their surface area, making them highly reactive and ideal for applications where surface interactions are crucial, such as in sensors, catalysis, or energy storage. The surface of these nanofibers exhibits a slightly textured appearance, likely due to the protrusion of Fe3O4-Gr nanofibers from the graphene matrix, which enhances the overall surface roughness. This roughness is advantageous for applications that require strong adhesion or interaction with other materials or interfaces.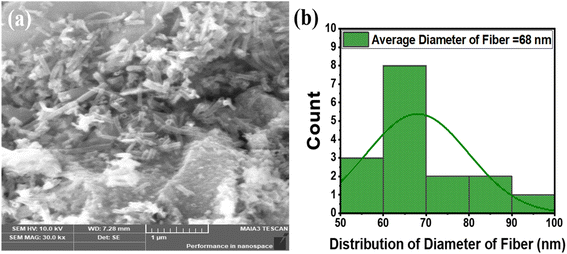 | ||
| Fig. 2 (a) FE-SEM image of Fe3O4-Gr nanofiber at 30k×, (b) histogram of the average diameter of fibers. | ||
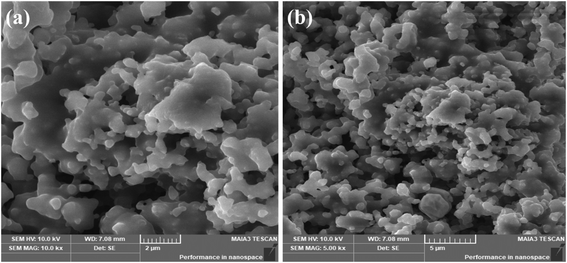
From the FE-SEM analysis, the morphology of the multi-layered Fe3O4-Gr/C/PPy nanofiber composite consists of interconnected stacked nano-spheres with considerable agglomerates. These particles are perfectly integrated into the carbon and graphene layers, which together provide structural support and conductor. As seen in Fig. 3(a and b), the presence of PPy wraps around the sapphire-like formations and ensures uniform coverage and integration across the whole nanofiber, adding flexibility and further conductivity to the composite. Additionally, the FE-SEM pictures show a beautifully textured surface where the durability and functional adaptability of the composite are enhanced by the interaction of the carbon and graphene layers with the PPy matrix. The multi-layered Fe3O4-Gr/C/PPy nanofiber composite's creative design, where the distinct sapphire-like features are deftly incorporated into the fibrous matrix, is highlighted by the FE-SEM analysis.25
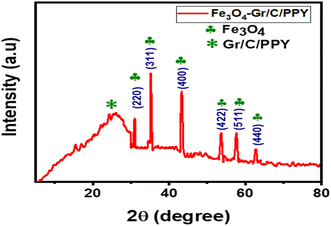
In order to assess the crystal structure and crystallinity of the composites, Fig. 4 displays the XRD diffractogram of the microspheres. The XRD analysis of Fe3O4-Gr/C/PPy nanofibers composite unveils a complex yet highly ordered crystalline structure, reflecting the successful integration of each constituent material. The characteristic diffraction peaks corresponding to Fe3O4-Gr are distinctly visible, confirming the presence of well-crystallized magnetite nanofibers within the composite matrix. These peaks typically observed at 2θ values of approximately 30.1°, 35.4°, 43.1°, 53.5°, 57.1°, and 62.6°, equivalent to the (220), (311), (400), (422), (511), and (440) crystal faces, align with the standard cubic spinel structure of Fe3O4 indicating that the magnetic nanofibers maintain their structural integrity during the composite formation process.23 The amorphous phase of carbon and PPy is responsible for the low-intensity broad diffraction peak at 24°.26 Since amorphous carbon lacks long-range crystalline organization, its diffraction peaks are unclear. The literature reports that a large hump about 24° is seen in amorphous carbon. Regarding PPy, various investigators have documented that its diffraction peak lies within the 24° to 26° range.27,28 The polymer structure's doping and degree of crystallinity are responsible for this discrepancy. The literature also reports that a large peak observed at 24° in this instance shows amorphous PPy caused by scattering from PPy chains at the interplanar gap. Superimposed on these peaks are the broad diffraction patterns attributed to graphene and amorphous carbon, which manifest as a diffuse hump around 2θ = 24–26°. This broad peak signifies the presence of few-layer graphene sheets, which contribute to the overall conductivity and mechanical strength of the composite. The absence of sharp graphene peaks suggests a well-distributed, exfoliated graphene phase, ensuring that the conductive network is efficiently embedded within the composite. The incorporation of PPy is evidenced by the appearance of broad, less intense peaks, typically around 2θ = 20° and 25°, indicative of the semi-crystalline nature of the polymer. These peaks are characteristic of the π–π stacking interactions within the PPy chains, which are crucial for maintaining the polymer's conductivity and flexibility.
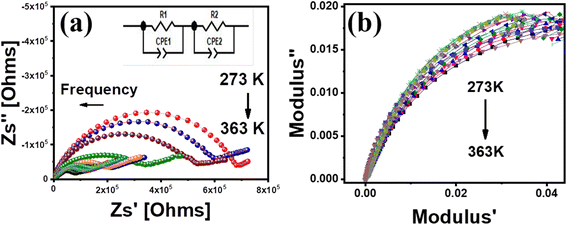
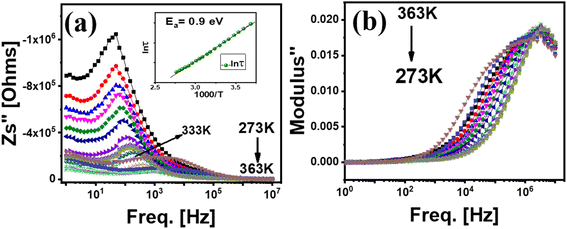
Using Zview software, the impedance plan plots are analyzed to better understand the conduction process in the nanofiber composite by comparing experimental data with an equivalent circuit. As seen in the inset of Fig. 5(a), impedance plane plots obtained in the temperature range of 273–363 K are fitted using an equivalent circuit model (R1Q1) (R2Q2) to fit the experimental data. The suffix 1 & 2 designates the two electro-active areas in the present sample. The departure of capacitance from ideal behavior, which resulted from the existence of several relaxation processes with comparable relaxation periods, is represented by a constant phase element (Q). The corresponding circuit of carbon-coated Fe3O4-Gr is shown by R1Q1.29 A second semicircle that is fitted by adding a second R2Q2 circuit appears at lower frequencies with PPy, indicating a major change in the conduction process as shown in the inset of Fig. 5(a). As the temperature rises, hopping carriers can interact with the electron density of PPy by diffusing from Fe3O4-Gr via the carbon layer. The multi-layered Fe3O4-Gr/C/PPy nanofiber composite exhibits a decrease in resistance due to a strong coupling produced by the increased number of linked channels between the oxide particles and polymers. An increase in carrier mobility causes an impedance to decrease with temperature up to 363 K, as evidenced by the modulation of the impedance plane plot. This shifting behavior of the impedance plane plot can be explained by the existence of an interface between the carbon coating and Fe3O4-Gr, as well as between PPy in the case of the lower impedance values. Two phases of Fe3O4-Gr and PPy with an interface between them are responsible for the occurrence of depressed semicircles with temperature (see Table 1). The Fe3O4-Gr/C/PPy nanofiber composite's bigger semicircle arc, which is evident at lower frequencies, indicates that more charge is transmitted in the presence of a PPy polymer chain.30
| T (K) | R1 (Ω) | R2 (Ω) | n1 | Q1 | n2 | Q2 |
|---|---|---|---|---|---|---|
| 273 | 723![[thin space (1/6-em)]](https://www.rsc.org/images/entities/char_2009.gif) 818 818 |
3351 | 0.77 | 1.14 × 10⁻¹⁰ | 0.63 | 1.99 × 10⁻⁷ |
| 288 | 485![[thin space (1/6-em)]](https://www.rsc.org/images/entities/char_2009.gif) 490 490 |
3043 | 0.74 | 3.31 × 10⁻¹⁰ | 0.62 | 1.27 × 10⁻⁷ |
| 303 | 228![[thin space (1/6-em)]](https://www.rsc.org/images/entities/char_2009.gif) 040 040 |
2890 | 0.71 | 3.11 × 10⁻¹⁰ | 0.60 | 3.59 × 10⁻⁷ |
| 323 | 156![[thin space (1/6-em)]](https://www.rsc.org/images/entities/char_2009.gif) 789 789 |
2211 | 0.70 | 4.19 × 10⁻⁹ | 0.58 | 5.55 × 10⁻⁶ |
| 348 | 89![[thin space (1/6-em)]](https://www.rsc.org/images/entities/char_2009.gif) 273 273 |
2015 | 0.69 | 4.28 × 10⁻⁹ | 0.55 | 4.19 × 10⁻⁶ |
| 363 | 56![[thin space (1/6-em)]](https://www.rsc.org/images/entities/char_2009.gif) 778 778 |
1732 | 0.63 | 5.82 × 10⁻⁹ | 0.51 | 3.10 × 10⁻⁶ |
The Fe3O4-Gr/C/PPy nanofiber composite's impedance plane plot displays intriguing dual relaxation processes that show the intricate interactions between its component materials over a wide temperature range of 273 K to 363 K. Due to the significant conductivity disparities between the PPy matrix and the Fe3O4-Gr nanofibers, the interfacial polarization effect dominates the relaxation process at low frequencies.31 As a result, charges build up at the interfaces, causing the impedance plot to clearly show a semicircle. A second relaxation phase appears at higher frequencies, mostly due to the dipolar polarization of the carbon and graphene layers, which react faster to the alternating current. This high-frequency relaxation suggests effective charge transport mechanisms made possible by the excellent electrical conductivity and large surface area of graphene.32 These relaxation processes' temperature-dependent behavior highlights the material's resilience and plasticity. This high-frequency relaxation indicates excellent charge transport and conductive capabilities inside the polymer network by pointing to the quick alignment and realignment of dipoles in response to the alternating electric field. This high-frequency response is further enabled by the presence of graphene, which offers effective routes for charge carriers.33 The impedance plane plot shows two semicircular arcs, which suggest the existence of two relaxation processes. One important feature of these processes is their relaxation time (τ = RC). In this case, the symbols R, τ, and C stand for the resistance, relaxation period, and capacitance that correspond to the charge carriers in the broad relaxation process. Fig. 5 shows a regular increase in temperature rather than an arbitrary variation. Arithmetic progression is used to set the temperatures, which increase by 5 K every time, spanning from 273 K to 363 K. The controlled and homogeneous temperature changes that are ensured by this step-by-step method are crucial for examining the material's impedance response. As previously mentioned, temperatures increase from top to bottom in descending sequence as represented by the peaks in Fig. 5. Furthermore, a decrease in resistance is shown by the semicircular arcs' increasing shortening as the temperature rises, which is consistent with the behavior of materials where charge transport is facilitated by thermal activation.
With real (M′) and imaginary (M′′) components, the complex modulus (273K–363 K) modulus plane plot offers a more nuanced knowledge of the composite's energy storage and dissipation capabilities when an electric field is applied. As seen in Fig. 5(b), the modulus values are comparatively high at lower temperatures within this range, suggesting that the composite is stiffer and that fewer mobile charge carriers are contributing to the dielectric response. This behavior suggests that the Fe3O4-Gr nanofibers, combined with the graphene and carbon components, create a robust network that resists deformation under an electric field, thereby storing energy efficiently. As the temperature increases towards 363 K, a noticeable shift occurs in the modulus values, particularly in the imaginary component (M′′), where a peak emerges.34 This peak signifies a relaxation process within the composite, corresponding to the temperature at which the motion of dipolar groups and charge carriers becomes more significant. The rise in M′′ with increasing temperature reflects the enhanced mobility of charge carriers and the increased conductivity within the composite matrix, facilitated by the thermally activated hopping mechanisms between localized states.35
The conduction mechanism is explained by using the resistance values (R1 and R2) inside the electro-active zone in an equivalent circuit model approach. For our investigation, we used the MVRH model in concurrence with the SPH model in the temperature range of 273 K to 363 K. Formula for the MVRH model.
| ln(ρ/ρ0) = (T0/T)1/4 | (1) |
The MVRH model provides a profound understanding of the charge transport mechanisms within the Fe3O4-Gr/C/PPy nanofiber composite, particularly in the low to high-temperature range of 273–363 K. A localization length of 1.5 Å is revealed by the MVRH model and is representative of the quantum mechanical constraints controlling electron motion through the nanofiber composite's disordered and heterogeneous matrix, as Fig. 6(a) illustrates. This relatively short localization length indicates that the Fe3O4-Gr nanofibers and graphene sheets have formed potential wells that are tightly confined to charge carriers, resulting in a hopping conduction mechanism that is heavily influenced by the microstructure of the composite. Charge transport at this localization length is primarily aided by hopping between localized states, which is a process that gets more effective at higher temperatures.36 According to the MVRH model, electrons must locate states with energies near the Fermi level at lower temperatures because the hopping distances are constrained.
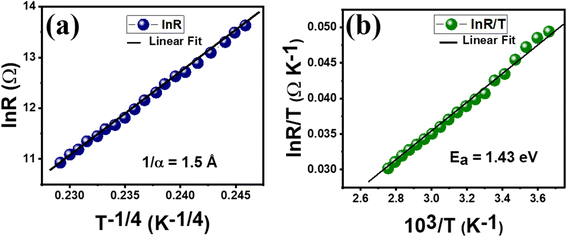 | ||
| Fig. 6 (a) MVRH model versus the inverse of temperature (b) SPH model versus the inverse of temperature for Fe3O4-Gr/C/PPy nanofiber composites. | ||
But when the temperature rises, the thermal energy permits electrons to reach a greater variety of states, increasing the composite's total conductivity and hopping probability. To facilitate the delocalization of charge carriers, the graphene layers offer routes, and the PPy matrix adds flexibility and preserves structural integrity, guaranteeing consistent transport qualities throughout the temperature range.37 Due to their magnetic characteristics, the Fe3O4-Gr nanofibers aid in the creation of localized states, which are necessary for the hopping mechanism.
Expression for SPH Model.
ln(ρ/T) = ln![[thin space (1/6-em)]](https://www.rsc.org/images/entities/char_2009.gif) A + W/kT A + W/kT
| (2) |
In particular, the SPH model provides a detailed understanding of the charge transport dynamics of the multi-layered Fe3O4-Gr/C/PPy nanofiber composite at temperatures between 273 K and 363 K. As demonstrated in Fig. 6(b), the SPH model, which has an activation energy of 1.43 eV, indicates that the conduction mechanism is mainly controlled by the hopping of tiny polarons, which are localized charge carriers that move through the lattice by interacting with the surrounding atomic vibrations (phonons). This unusually large activation energy is consistent with the material's complex and heterogeneous structure.22 Fe3O4-Gr nanofibers produce potential wells that allow electrons to get trapped and generate tiny polarons. The electrical network created by the surrounding graphene and carbon layers makes hopping easier, while the PPy matrix gives the nanofiber composite more structural flexibility so it can withstand the local distortions required for polaron movement. The thermal energy supplied to the system allows the polarons to get beyond the energy barriers related to hopping when the temperature rises from 273 K to 363 K. The contact between polarons and phonons is improved by the higher temperature, which raises the possibility of successful hopping events.38 This temperature-dependent behavior aligns with the SPH model, where the activation energy of 1.43 eV represents the energy required for polarons to move from one localized site to another.
The dielectric constant behavior of the Fe3O4-Gr/C/PPy nanofiber composite at 273K–363 K presents an intriguing profile, where exceptionally high dielectric constant values reaching up to 105 are observed at lower frequencies as seen in Fig. 7(a). This pronounced dielectric response at low frequencies is primarily driven by strong interfacial polarization effects, also known as Maxwell–Wagner–Sillars (MWS) polarization. Within the nanofibers composite, Fe3O4-Gr nanofibers, graphene, and carbon create numerous interfaces, leading to significant charge accumulation.39 The conductive PPy matrix facilitates efficient charge transport, further enhancing the polarization effect. The dielectric constant gradually decreases with increasing frequency, indicating that the polarization mechanisms are frequency-dependent. Higher frequencies cause a decrease in overall polarization and, as a result, a lower dielectric constant because the charges have less time to align with the quickly oscillating electric field.40 This frequency-dependent reduction is typical of the material's loss of electric field response during the shift from interfacial polarization dominance to intrinsic dipolar polarization.41
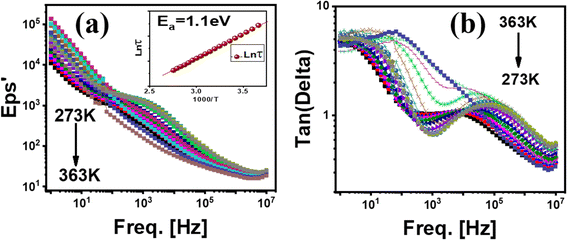 | ||
| Fig. 7 (a) The dielectric constant and (b) tangent loss analysis of the Fe3O4-Gr/C/PPy nanofiber composite. | ||
It's interesting to note that this pattern gets stronger when the temperature rises above 273 K. Elevated temperatures supply thermal energy that causes dipole alignment to be disrupted and decreases interfacial polarization's effectiveness. Higher temperatures can also cause faster relaxation processes, which lower the dielectric constant even more at higher frequencies. The dynamic dielectric behavior of the composite is highlighted by its thermal sensitivity, which can be precisely adjusted for particular applications by manipulation of temperature and frequency parameters. The multi-layered Fe3O4-Gr/C/PPy nanofiber composite is a versatile material for a variety of electronic applications because of its ability to demonstrate a high dielectric constant at low frequencies and a controlled drop with growing frequency and temperature.
The dielectric response of the multi-layered Fe3O4-Gr/C/PPy nanofiber composite exhibits a complex and subtle tangent loss behavior between 273 and 363 K, especially when examined in conjunction with its impedance properties. The nanofibers composite shows consistently sub-1 tangent loss values at higher frequencies, indicating low dielectric loss and effective energy storage. This material's capacity to preserve its dielectric integrity in the face of fast electric field oscillations is demonstrated by its low tangent loss at high frequencies, which guarantees that energy dissipation is kept to a minimum.42 On the other hand, tangent loss is seen to gradually grow with decreasing frequency, especially as temperature increases as seen in Fig. 7(b). The impedance plane plot indicates that there are two separate relaxation processes, which are closely related to this increase. The initial relaxation process, which takes place at lower frequencies, is linked to Maxwell–Wagner–Sillars (MWS) polarization, also known as interfacial polarization, where there is a more noticeable buildup of charges at the interfaces between Fe3O4-Gr nanofibers, graphene, and PP.43 The increasing tangent loss at lower frequencies as temperature rises is a reflection of the greater energy dissipation caused by this charge accumulation.
The second relaxation step is associated with intrinsic dipolar relaxation in the composite material and happens at higher frequencies. Higher frequencies cause some energy loss, but not as much as at lower frequencies because dipoles in the PPy and graphene matrix find it difficult to line up with the quickly oscillating electric field. The interplay between these two relaxation processes creates a complex frequency-dependent dielectric response, where the tangent loss remains low at high frequencies due to efficient dipolar alignment, but increases at lower frequencies as the interfacial polarization dominates.44 The temperature dependence of the tangent loss further accentuates this dynamic behavior. As the temperature rises, thermal energy disrupts the polarization mechanisms, particularly at lower frequencies, where the increased thermal agitation enhances the MWS polarization and leads to higher dielectric losses. This temperature-induced enhancement of the lower-frequency relaxation process contributes to the overall increase in tangent loss with decreasing frequency.
To comprehend the temperature-dependent frequency dependence of Z′′ and M′′, various electro-active sites are investigated in the multi-layered Fe3O4-Gr/C/PPY nanofiber composite. The Z′′ vs. frequency plot of the Fe3O4-Gr/C/PPy nanofiber composite offers a detailed insight into the complex relaxation dynamics within the material across the temperature range of 273 K to 363 K as shown in Fig. 8(a). This plot, which represents the imaginary part of the impedance (Z′′), is particularly revealing of the energy dissipation mechanisms and the relaxation processes that occur as the material responds to an alternating electric field.45 At lower temperatures, specifically between 273 K and 338 K, a prominent relaxation peak emerges at lower frequencies around 102 Hz. This peak signifies the presence of a relaxation process predominantly driven by interfacial polarization, also known as Maxwell–Wagner–Sillars (MWS) polarization. In this temperature range, the composite's heterogeneous structure comprising Fe3O4 nanofibers, graphene, and PPy facilitates significant charge accumulation at the interfaces. The energy associated with the alignment and relaxation of these interfacial charges manifests as the observed peak in Z′′, reflecting the material's energy dissipation in response to the applied field as explained in the previous section of the impedance plane plot.46
As the temperature increases from 343 K to 363 K, a second distinct relaxation peak becomes evident at higher frequencies around 104 Hz. This shift to higher frequencies indicates the activation of another relaxation process, likely linked to dipolar polarization within the composite. At these elevated temperatures, the thermal energy available to the system enhances the mobility of dipoles within the PPy matrix and graphene layers. The faster dynamics of these dipoles allow them to respond more effectively to higher-frequency electric fields, leading to the observed peak in Z′′. This higher-frequency relaxation is characteristic of the material's intrinsic dipolar response, which becomes more prominent as the temperature rises and the dipoles gain sufficient energy to align and relax quickly with the oscillating field.47 As seen in Fig. 8(a), it is noted that the frequency of the peak shifts from 102 Hz to 104 Hz when the temperature is increased from 333 K to 363 K. The curve with the peak at 102 Hz would be the one that corresponds to the data at 333 K in Fig. 8(a). The peak shifts from 102 Hz at 333 K to 104 Hz at 363 K, as shown in the statement. As a result, the measurement at 333 K is represented by the curve with the peak at 102 Hz. By comparing the frequency-dependent spectra of Z′′, one can determine whether the relaxation processes are dominated by the mobility of long-range or short-range charge carriers. The peak frequencies of Z′′ at various temperatures are separated, as seen in Fig. 8(a), from which it can be deduced that short-range charge carriers are what create the mobility. The close range of the Z′′ peak frequencies around higher temperatures indicates that long-range charge carriers dominate carrier mobility. The activation energy of the composite nanofibers in the inset of Fig. 8(a) is 0.9 eV, as determined from the slope using the Arrhenius equation (k = Ae−Ea/RT) this value is consistent with the explanation provided by the SPH model.
The modulus vs. frequency plot of the Fe3O4-Gr/C/PPY nanofiber composite offers a revealing look into the material's dielectric relaxation dynamics, particularly through the observation of a relaxation peak at 106 Hz as shown in Fig. 8(b). The modulus, which emphasizes the bulk properties of the material by minimizing the effects of electrode polarization, allows us to focus on the intrinsic relaxation behavior within the composite. The appearance of the relaxation peak at such a high frequency indicates that the composite exhibits a rapid response to the applied electric field, characterized by the swift alignment and subsequent relaxation of dipoles within the material.29 This peak is strongly indicative of the involvement of localized electric fields within the nanofiber matrix, where the combined effects of Fe3O4-Gr nanofibers, graphene, and PPy create a complex environment for dipole movement.
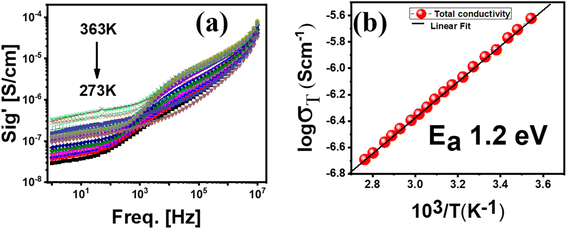
The conductivity behavior can be explained by the formula σt = σdc + Aωs. Where σt is the AC conductivity, ω is the angular frequency (2πf), where A is the polarizability factor and “s” is the temperature-based exponent.48 The conductivity vs. frequency plot for the Fe3O4-Gr/C/PPy nanofiber composite across the temperature range of 273–363 K provides an intricate picture of its charge transport dynamics, particularly through the lens of the double well model as shown in Fig. 9(a). This model, which describes the movement of charge carriers between two energy minima separated by a potential barrier, is key to understanding the two distinct relaxation peaks observed at low and high frequencies. The first relaxation peak indicates a slower, thermally stimulated process at low frequencies. Here, the Fe3O4-Gr nanofibers and the surrounding carbon/graphene network localize charge carriers, which are probably tiny polarons. The carriers can hop between these localized states due to the thermal energy present at these temperatures, which allows them to pass through the energy barrier outlined by the double-well model. As a result, conductivity increases as frequency drops, indicating the material's improved capacity to carry charges over extended periods.
The second relaxation peak, observed at high frequencies, corresponds to a much faster dynamic where the charge carriers experience rapid oscillations within the potential wells. With charge carriers that are nimble enough to sustain conductivity even under fast oscillations, the material can respond to high-frequency electric fields at these frequencies, where the energy from the electric field is enough to enable the carriers to tunnel through or hop across the barrier more frequently, resulting in a sharp increase in conductivity. This behavior is indicative of a nanofiber material that can effectively respond to high-frequency electric fields, with electroactive charge carriers that are agile enough to maintain conductivity even under rapid oscillations. When the temperature rises from 273 K to 363 K, the thermal energy supports both the high-frequency and low-frequency relaxation processes, lowering the potential barrier in the double-well model and enabling more effective charge transport.49 The composite's ability to control charge transport across a broad frequency range from sluggish, thermally activated hopping at low frequencies to fast, field-driven dynamics at high frequencies is demonstrated by this dual relaxation behavior. The dual relaxation peaks of the double well model highlight the versatility of multi-layered Fe3O4-Gr/C/PPy nanofiber composite. Interfacial polarization and charge carrier hopping dominate the material's conductivity at low frequencies, while dipolar relaxation and rapid carrier dynamics take center stage at high frequencies. Because of its dual conductivity characteristic, the composite is especially well-suited for uses requiring strong performance across a broad frequency range, including shielding against electromagnetic interference (EMI).50
A conductivity plot at 107 Hz at various temperatures is displayed in Fig. 9(b). Activation energy is computed for two distinct segments using the Arrhenius model. The activation energy in the high-temperature zone is determined to be 1.2 eV, in agreement with activation energies derived from relaxation constants and the SPH model. The slope is computed from the high-frequency area, indicating a shift in the slope values that points to the possibility of an alternative conduction mechanism. The relatively differing amounts of activation energies for conduction and relaxation processes have been linked to the fact that the conduction mechanism incorporates hopping energy in addition to disorder and polarons. When strong cation–anion–cation interactions outweigh weak cation–cation interactions, these materials display semiconducting or metallic characteristics.
Using the rectangular waveguide approach (x-band), a vector network analyzer determined the overall shielding effectiveness created on the scattering parameters S11, S12, S21, and S22. The SER, SEA, and SET can be expressed as follows.22
SEA = −10![[thin space (1/6-em)]](https://www.rsc.org/images/entities/char_2009.gif) log(1 − Aeff) log(1 − Aeff)
| (3) |
SER = −10![[thin space (1/6-em)]](https://www.rsc.org/images/entities/char_2009.gif) log(1 − R) log(1 − R)
| (4) |
SET = −10![[thin space (1/6-em)]](https://www.rsc.org/images/entities/char_2009.gif) log log![[thin space (1/6-em)]](https://www.rsc.org/images/entities/char_2009.gif) T T
| (5) |
The SER, SEA and SET values over the x-band are calculated using eqn (3)–(5). The shielding effectiveness due to absorption (SEA) of the Fe3O4-Gr/C/PPy nanofiber composite across the x-band frequency range showcases its exceptional capability to mitigate electromagnetic interference (EMI) through energy absorption. With a peak SEA of 24.6 dB at a 3 mm thickness, this composite stands out as a highly efficient absorber, particularly within the x-band spectrum, which is critical for radar and communication systems as seen in Fig. 10(a). The impressive SEA performance in the x-band can be attributed to the synergistic interaction between the composite's magnetic and conductive components. The Fe3O4-Gr nanofibers contribute significantly to magnetic losses, interacting with the incident electromagnetic waves by inducing eddy currents and hysteresis losses.51 These magnetic interactions are especially strong in the x-band frequencies, where the material's magnetic permeability increases the absorption of electromagnetic energy.52 At the same time, the graphene and carbon networks inside the nanofibers form highly conductive pathways that sustain additional absorption mechanisms. These conductive pathways enable the creation of multiple internal reflections within the composite, trapping the electromagnetic waves and converting them into heat through dielectric and ohmic losses.53 The PPy matrix, which is already known for its intrinsic dielectric properties, reinforces this effect by polarizing in response to the electric field component of the incident waves, which helps with dielectric relaxation losses.
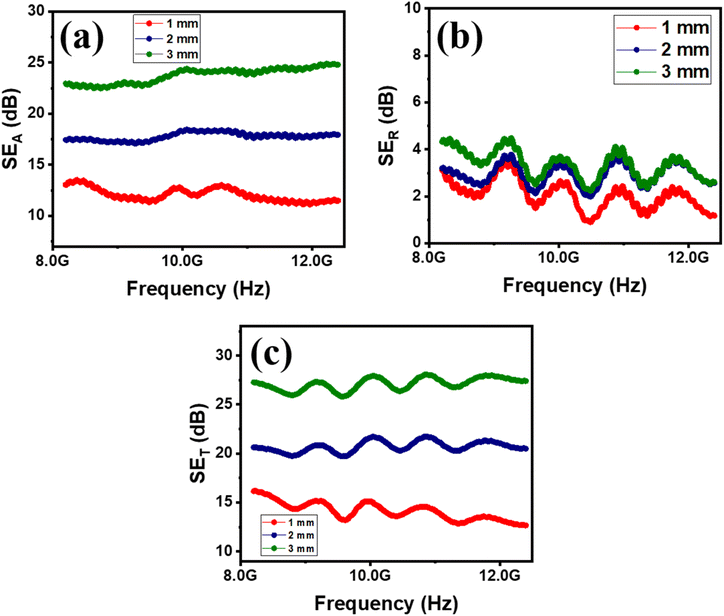 | ||
| Fig. 10 (a) Absorption-based shielding effectiveness (b) reflection-based shielding effectiveness (c) overall shielding effectiveness. | ||
With a recorded value of 3.6 dB at a thickness of 3 mm, the Fe3O4-Gr/C/PPy nanofiber composite's shielding effectiveness due to reflection (SER) across the x-band frequency range offers important insights into the composite's ability to reflect incident electromagnetic waves, as shown in Fig. 10(b). The 3.6 dB value at 3 mm thickness, SER shows that the nanofiber composite efficiently contributes to EMI shielding by reflecting a portion of the incident electromagnetic energy into the environment, even though reflection-based shielding is frequently given less attention than absorption. Multi-layered Fe3O4-Gr/C/PPy nanofiber composite at a thickness of only 3 mm has a total shielding effectiveness (SET) of 28.4 dB across the x-band frequency range (8.2 to 12.4 GHz), which is impressive evidence of this material's comprehensive electromagnetic interference (EMI) shielding capacity as shown in Fig. 10(c). This material's capacity to efficiently attenuate incident electromagnetic waves by combining absorption, reflection, and several internal scattering mechanisms in a synergistic manner is indicated by its high SET value.54 The composite's unique multi-phase architecture, which combines conductive graphene and carbon, dielectric PPy, and magnetic Fe3O4-Gr nanofibers, is the main factor contributing to its remarkable SET. Every element contributes significantly to the total shielding effectiveness.55 Magnetic permeability, which is brought about by the Fe3O4-Gr nanofibers, increases magnetic losses and strengthens the material's capacity to interact with and attenuate the magnetic component of electromagnetic waves. In the x-band, where the material's permeability greatly enhances the total shielding efficacy, this magnetic interaction is especially beneficial.
The graphene and carbon components provide a network of conductive pathways that promote multiple reflections within the nanofiber matrix. These internal reflections increase the path length of the electromagnetic waves within the material, allowing more of the wave energy to be absorbed and dissipated as heat through ohmic and dielectric losses. The conductive nature of these components also contributes to a degree of reflection at the material's surface, adding to the overall SET while ensuring that a significant portion of the energy is contained and absorbed within the material.56 The PPy matrix, with its high dielectric constant, further enhances the composite's ability to polarize in response to the electric field component of the electromagnetic waves. This polarization contributes to dielectric relaxation losses, effectively converting the electromagnetic energy into heat, particularly at lower frequencies within the x-band.
The Fe3O4-Gr/C/PPy nanofibers composite demonstrates an astonishing capability in electromagnetic interference (EMI) shielding, with an effective absorption rate of 99.7% and an attenuation percentage of 99.8% across the x-band frequency range as shown in Fig. 11(a and b). The near-total absorption of 99.7% is indicative of the composite's ability to convert almost all incident electromagnetic energy into heat, effectively neutralizing the potential for interference. This remarkable absorption efficiency is largely driven by the composite's multi-functional architecture. The Fe3O4-Gr nanofibers within the nanofibers contribute significantly to magnetic losses by interacting with the magnetic component of the electromagnetic waves, inducing eddy currents and magnetic hysteresis that dissipate energy as heat. In the x-band frequency region, where the material's magnetic characteristics are tailored to absorb high-frequency waves, this magnetic interaction is most effective.57
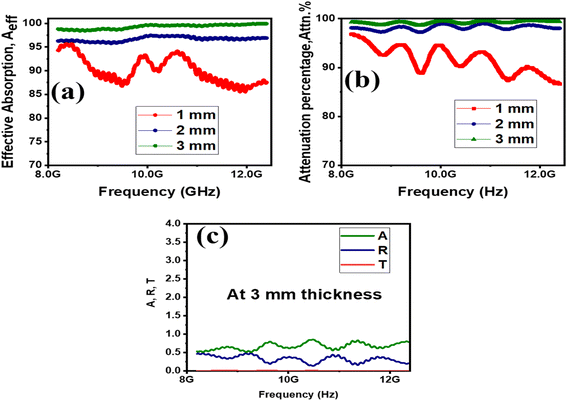 | ||
| Fig. 11 (a) Effective absorption versus frequency (b) attenuation percentage versus frequency (c) A, R and T versus frequency. (figure is updated). | ||
The composite is made possible by the graphene and carbon components acting as conductive routes that allow for various internal reflections. The route length of electromagnetic waves within the material is extended by these internal reflections, facilitating repeated absorption and decreasing the possibility of waves escaping the substance. The conductive path network additionally enhances the absorption capacities of the composite by contributing to dielectric and ohmic losses. The composite's 99.8% attenuation rate highlights its capacity to both absorb and stop electromagnetic waves from propagating.58 The nanofiber material's combined actions of absorption and reflection lead to this significant attenuation. This is made possible by the PPy matrix's high dielectric constant, which polarizes in response to the waves' electric field component, causing dielectric relaxation and energy dissipation. Additionally, for a better understanding of absorption reflection and transmittance phenomenon, a graph is plotted against frequency collected from experimental data at 3 mm thickness of nanofibers composite as seen in Fig. 11(c). A nanofiber material's absorption, reflection, and transmittance typically vary with frequency, especially in the context of electromagnetic interference (EMI) shielding. In general, reflection is established by the nanofiber material's and free space's impedance mismatch. Reflection tends to be higher at lower frequencies in the x-band region, but if the material's impedance is well-matched to free space, it can decrease as frequency increases in the x-band. When the material is tuned for absorption at higher frequencies, reflection may show a non-linear curve that progressively declines with increasing frequency.59 Since nanofiber materials are made to absorb more electromagnetic radiation at higher frequencies, absorption frequently rises with frequency. Certain frequency ranges are likely to see more absorption in materials having conductive and magnetic characteristics. Generally speaking, absorption rises with frequency, peaks, and then, depending on the properties of the nanofiber material, either stabilizes or falls at very high frequencies. When reflection and absorption rise, transmittance falls. At frequencies where the nanofiber material functions well, transmittance is often low because the main objective of EMI shielding materials is to prevent signals.
4 Conclusion
This work uses hydrothermal and electrospinning techniques to synthesize a multi-layered nanofibers composite made of Fe3O4-Gr/C/PPy nanofibers. The FE-SEM analysis reveals that the nanofibers possess a well-defined small rod-like structure with an average diameter of 68 nm, contributing to the composite's high surface area and efficient interaction with electromagnetic waves. The XRD analysis confirms the successful incorporation of Fe3O4-Gr nanofibers carbon, and PPy within the composite. The crystallographic data indicate the presence of well-defined phases, which contribute to the composite's magnetic and conductive properties. The impedance plane plot reveals two distinct relaxation processes at low and high frequencies across the 273 K to 363 K temperature range. The dielectric constant analysis highlights the composite's ability to maintain high dielectric constant values (up to 105) at lower frequencies, with a gradual decrease as the frequency increases. Tangent loss measurements indicate that the composite maintains values less than 1 at higher frequencies, gradually increasing at lower frequencies as temperature rises. The MVRH model provides insights into the composite's charge transport mechanisms, with a localization length of 1.5 Å. The SPH model suggests an activation energy of 1.43 eV, pointing to thermally activated charge transport within the nanofibers composite. The conductivity plot further supports the presence of dual relaxation peaks at low and high frequencies, consistent with the double-well model. The EMI shielding analysis reveals outstanding performance, with a total shielding effectiveness (SET) of 28.4 dB across the x-band frequency range at a 3 mm thickness. The composite demonstrates a near-total absorption of 99.7% and attenuation of 99.8%, driven by its synergistic combination of magnetic, conductive, and dielectric properties.Data availability
Supporting data correlated to this manuscript will be available if mandatory.Author contributions
The original draft of this publication was conceptualized, synthesized, characterized, and written up in part by Ujala Anwar. Dr Muhammad Rafi helped with the experimentation, and editing of the paper, while Dr Naveed A. Noor, Dr Ihab Mohamed Moussa and Sohail Mumtaz helped with the final review, editing, and resource gathering.Conflicts of interest
The authors have no significant financial or non-financial benefits to disclose.Acknowledgements
The authors would like to thank the Researchers Supporting Project number (RSPD2024R741), King Saud University, Riyadh, Saudi Arabia.References
- N. Gulzar, K. Zubair, M. F. Shakir, M. Zahid, Y. Nawab and Z. A. Rehan, Effect on the EMI Shielding Properties of Cobalt Ferrites and Coal-Fly-Ash Based Polymer Nanocomposites, J. Supercond. Novel Magn., 2020, 33(11), 3519–3524, DOI:10.1007/s10948-020-05608-w.
- N. A. Noor, U. Anwar and A. Mahmood, Investigation of the rare earth-based LaYO 3 (Y = Cr and Mn) perovskites by ab-initio approach, Chem. Phys. Lett., 2020, 739(2019), 137031, DOI:10.1016/j.cplett.2019.137031.
- S. Varshney and S. K. Dhawan, Designing of materials for EMI shielding applications, Microwave Mater. Appl., 2017, 575–602, DOI:10.1002/9781119208549.ch13.
- M. F. Shakir, et al., Effect of Nickel - spinal - Ferrites on EMI shielding properties of polystyrene/polyaniline blend, SN Appl. Sci., 2020, 2, 1–13, DOI:10.1007/s42452-020-2535-4.
- R. E. Lu, et al., Magnetic properties of different CoFe2O4nanostructures: Nanofibers versus nanoparticles, J. Mater. Chem. C, 2014, 2(40), 8578–8584, 10.1039/c4tc01415d.
- J. Wang, et al., Core-shell structured Fe/Fe3O4@TCNFs@TiO2 magnetic hybrid nanofibers: Preparation and electromagnetic parameters regulation for enhanced microwave absorption, Carbon, 2020, 165, 275–285, DOI:10.1016/j.carbon.2020.04.090.
- M. Bayat, H. Yang, F. K. Ko, D. Michelson and A. Mei, Electromagnetic interference shielding effectiveness of hybrid multifunctional Fe3O4/carbon nanofiber composite, Polymer, 2014, 55(3), 936–943, DOI:10.1016/j.polymer.2013.12.042.
- Z. Tong, et al., Hierarchical Fe3O4/Fe@C@MoS2 core-shell nanofibers for efficient microwave absorption, Carbon, 2021, 179, 646–654, DOI:10.1016/j.carbon.2021.04.051.
- Z. Zeng, G. Wang, B. F. Wolan, Na Wu, C. Wang, S. Zhao, S. Yue, B. Li and W. He, Printable Aligned Single-Walled Carbon Nanotube Film with Outstanding Thermal Conductivity and Electromagnetic Interference Shielding Performance Article Open access Published: 01 September 2022, Nano-Micro Lett., 2022, 14(1), 179, DOI:10.1007/s40820-022-00883-9.
- C. Zhang, Y. Chen, H. Li, R. Tian and H. Liu, Facile fabrication of three-dimensional lightweight RGO/PPy Nanotube/Fe3O4 aerogel with excellent electromagnetic wave absorption properties, ACS Omega, 2018, 3(5), 5735–5743, DOI:10.1021/acsomega.8b00414.
- B. Saiphaneendra, T. Saxena, S. A. Singh, G. Madras and C. Srivastava, Synergistic effect of co-existence of hematite (α-Fe2O3) and magnetite (Fe3O4) nanoparticles on graphene sheet for dye adsorption, J. Environ. Chem. Eng., 2017, 5(1), 26–37, DOI:10.1016/j.jece.2016.11.017.
- H. Liu, Q. Zhao, K. Wang, Z. Lu, F. Feng and Y. Guo, Facile synthesis of polypyrrole nanofiber (PPyNF)/NiO: X composites by a microwave method and application in supercapacitors, RSC Adv., 2019, 9(12), 6890–6897, 10.1039/c8ra09666j.
- L. P. C. Júnior, D. B. D. S. Silva, M. F. de Aguiar, C. P. de Melo and K. G. B. Alves, Preparation and characterization of polypyrrole/organophilic montmorillonite nanofibers obtained by electrospinning, J. Mol. Liq., 2019, 275, 452–462, DOI:10.1016/j.molliq.2018.11.084.
- P. Xu, et al., Synthesis of electromagnetic functionalized nickel/polypyrrole core/shell composites, J. Phys. Chem. B, 2008, 112(34), 10443–10448, DOI:10.1021/jp804327k.
- K. Y. Park, J. H. Han, S. B. Lee, J. B. Kim, J. W. Yi and S. K. Lee, Fabrication and electromagnetic characteristics of microwave absorbers containing carbon nanofibers and NiFe particles, Compos. Sci. Technol., 2009, 69(7–8), 1271–1278, DOI:10.1016/j.compscitech.2009.02.033.
- J. K. Jung, Y. Il Moon, G. H. Kim and N. H. Tak, Characterization of Dielectric Relaxation Process by Impedance Spectroscopy for Polymers : Nitrile Butadiene Rubber and Ethylene Propylene Diene Monomer, J. Spectrosc, 2020, 2020, 1–15 CrossRef.
- Y. Guo, et al., Constructing fully carbon-based fillers with a hierarchical structure to fabricate highly thermally conductive polyimide nanocomposites, J. Mater. Chem. C, 2019, 7(23), 7035–7044, 10.1039/c9tc01804b.
- Z. Q. Feng, X. Yuan and T. Wang, Porous polyacrylonitrile/graphene oxide nanofibers designed for high efficient adsorption of chromium ions (VI) in aqueous solution, Chem. Eng. J., 2020, 392, 123730, DOI:10.1016/j.cej.2019.123730.
- W. H. Yanan Zhang, Y. Tian, N. Xu, P. Cui, L. Guo, J. Ma, Y. Kang, L. Qin, F. Wu and L. Zhang, In situ Mechanical Foaming of Hierarchical Porous MoC for Assembling Ultra-light, Self-cleaning, Heat-insulation, Flame-retardant, and Infrared-stealth Device, Adv. Funct. Mater., 2024, 2414910, DOI:10.1002/adfm.202414910.
- Y. R. Kumar, et al., Structure, morphology and modeling studies of polyvinylalcohol nanocomposites reinforced with nickel oxide nanoparticles and graphene quantum dots, Environ. Res., 2022, 203(2021), 111842, DOI:10.1016/j.envres.2021.111842.
- W. Huang, M. Song, S. Wang, B. Wang, J. Ma and T. Liu, Dual-Step Redox Engineering of 2D CoNi-Alloy Embedded B , N-Doped Carbon Layers Toward Tunable Electromagnetic Wave Absorption and Light-Weight Infrared Stealth Heat Insulation Devices, Adv. Mater., 2024, 2403322, 1–13, DOI:10.1002/adma.202403322.
- U. Anwar, et al., Synergistic phases in isopropanol electrospun for Fe 2 O 3/Fe 3 O 4 @ C @ MoS 2 nanofibers for enhanced electromagnetic interference shielding characteristics and impedance analysis, Mater. Today Commun., 2024, 39, 109023, DOI:10.1016/j.mtcomm.2024.109023.
- K. Manna and S. K. Srivastava, Fe3O4@Carbon@Polyaniline Trilaminar Core-Shell Composites as Superior Microwave Absorber in Shielding of Electromagnetic Pollution, ACS Sustain. Chem. Eng., 2017, 5(11), 10710–10721, DOI:10.1021/acssuschemeng.7b02682.
- N. Gill, A. L. Sharma, V. Gupta, M. Tomar, O. P. Pandey and D. P. Singh, Enhanced microwave absorption and suppressed reflection of polypyrrole-cobalt ferrite-graphene nanocomposite in X-band, J. Alloys Compd., 2019, 797, 1190–1197, DOI:10.1016/j.jallcom.2019.05.176.
- C. Wan and J. Li, Synthesis and electromagnetic interference shielding of cellulose-derived carbon aerogels functionalized with α-Fe2O3 and polypyrrole, Carbohydr. Polym., 2017, 161, 158–165, DOI:10.1016/j.carbpol.2017.01.003.
- Q. Wang, et al., Enhanced microwave absorption of biomass carbon/nickel/polypyrrole (C/Ni/PPy) ternary composites through the synergistic effects, J. Alloys Compd., 2021, 890, 161887, DOI:10.1016/j.jallcom.2021.161887.
- A. S. Rajan, S. Sampath and A. K. Shukla, An in situ carbon-grafted alkaline iron electrode for iron-based accumulators, Energy Environ. Sci., 2014, 7(3), 1110–1116, 10.1039/c3ee42783h.
- R. Strümpler and J. Glatz-Reichenbach, Conducting polymer composites, J. Electroceram., 1999, 3(4), 329–346, DOI:10.1023/A:1009909812823.
- P. Annie Vinosha, S. Deepapriya, J. D. Rodney, S. Krishnan and S. Jerome Das, Investigation on Elastic, Magnetic, Optical and Electrical Impedance Properties of Dysprosium Doped Nickel Ferrite Nanocrystals, J. Nanosci. Nanotechnol., 2019, 19(12), 8020–8035, DOI:10.1166/jnn.2019.16864.
- R. G. Mahloniya, Polypyrrole Based Nanocomposites As Radiation Shielding Materials : A Mini Review, Polímeros, 2019, 2, 14–42 Search PubMed.
- M. S. A. Darwish, A. Bakry, L. M. Al-Harbi, M. M. Khowdiary, A. A. El-Henawy and J. Yoon, Core/shell PA6 @ Fe3O4 nanofibers: Magnetic and shielding behavior, J. Dispersion Sci. Technol., 2020, 41(11), 1711–1719, DOI:10.1080/01932691.2019.1635025.
- S. H. Yoo, D. Jang, H. I. Joh and S. Lee, Iron oxide/porous carbon as a heterogeneous Fenton catalyst for fast decomposition of hydrogen peroxide and efficient removal of methylene blue, J. Mater. Chem. A, 2017, 5(2), 748–755, 10.1039/c6ta07457j.
- K. Y. Chen, S. Gupta and N. H. Tai, Reduced graphene oxide/Fe2O3 hollow microspheres coated sponges for flexible electromagnetic interference shielding composites, Compos. Commun., 2021, 23(2020), 100572, DOI:10.1016/j.coco.2020.100572.
- G. Mustafa, M. Khalid, A. Dad, C. Kiran and S. Zaheer, Dielectric , impedance , and modulus spectroscopic studies of lanthanum-doped nickel spinel ferrites NiLa x Fe 2- x O 4 nanoparticles, J. Sol-Gel Sci. Technol., 2020, 101, 1–10, DOI:10.1007/s10971-020-05359-z.
- D. C. Sinclair and A. R. West, Impedance and modulus spectroscopy of semiconducting BaTiO3 showing positive temperature coefficient of resistance, J. Appl. Phys., 1989, 66(8), 3850–3856, DOI:10.1063/1.344049.
- M. Rafi, U. Anwar, M. H. Alnasir, A. Ramzan, A. Noor and S. Mumtaz, Rietveld refined structural , optical and temperature dependent impedance spectroscopy of NiO – ZnO heterostructure composite : Synthesized through solid-state method for high-frequency devices, Ceram. Int., 2024, 50(20), 38600–38609, DOI:10.1016/j.ceramint.2024.07.229.
- C. Tian, et al., Constructing uniform core-shell PPy@PANI composites with tunable shell thickness toward enhancement in microwave absorption, ACS Appl. Mater. Interfaces, 2015, 7(36), 20090–20099, DOI:10.1021/acsami.5b05259.
- S. Karmakar, H. Tyagi, D. P. Mohapatra and D. Behera, Dielectric relaxation behavior and overlapping large polaron tunneling conduction mechanism in NiO–PbO μ-cauliflower composites, J. Alloys Compd., 2021, 851, 156789, DOI:10.1016/j.jallcom.2020.156789.
- A. B. Abou Hammad, A. G. Darwish and A. M. El Nahrawy, Identification of dielectric and magnetic properties of core shell ZnTiO3/CoFe2O4 nanocomposites, Appl. Phys. A: Mater. Sci. Process., 2020, 126(7), 1–12, DOI:10.1007/s00339-020-03679-z.
- N. Yousefi, et al., Highly aligned graphene/polymer nanocomposites with excellent dielectric properties for high-performance electromagnetic interference shielding, Adv. Mater., 2014, 26(31), 5480–5487, DOI:10.1002/adma.201305293.
- W. Huang, X. Zhang, J. Chen, Q. Qiu, Y. Kang and K. Pei, High-Density Nanopore Confined Vortical Dipoles and Magnetic Domains on Hierarchical Macro/Meso/Micro/Nano Porous Ultra-Light Graphited Carbon for Adsorbing Electromagnetic Wave, Adv. Sci., 2023, 2303217, 1–10, DOI:10.1002/advs.202303217.
- A. Durán, H. Tiznado, J. M. Romo-Herrera, D. Domínguez, R. Escudero and J. M. Siqueiros, Nanocomposite YCrO3/Al2O3: Characterization of the core-shell, magnetic properties, and enhancement of dielectric properties, Inorg. Chem., 2014, 53(10), 4872–4880, DOI:10.1021/ic4029589.
- O. Farooq, M. Anis-Ur-Rehman and A. Ul Haq, Tailoring of electrical properties in nanostructured (NiO)0.25(Fe2O3)0.75 composite and compound for sensing applications, Mater. Res. Express, 2020, 7(1), 0–9, DOI:10.1088/2053-1591/ab5536.
- H. Gao, C. Wang, Z. Yang and Y. Zhang, 3D porous nickel metal foam/polyaniline heterostructure with excellent electromagnetic interference shielding capability and superior absorption based on the pre-constructed macroscopic conductive framework, Compos. Sci. Technol., 2021, 213, 108896, DOI:10.1016/j.compscitech.2021.108896.
- S. Carrara, V. Bavastrello, D. Ricci, E. Stura and C. Nicolini, Improved nanocomposite materials for biosensor applications investigated by electrochemical impedance spectroscopy, Sens. Actuators, B, 2005, 109(2), 221–226, DOI:10.1016/j.snb.2004.12.053.
- S. Cetiner, F. Kalaoglu, H. Karakas and A. S. Sarac, Dielectric , FTIR Spectroscopic and Atomic Force Microscopic Studies on Polypyrrole- poly (acrylonitrile- co -vinyl acetate), Polym. Compos., 2011, 32(4), 546–557 CrossRef CAS.
- M. S. S. Dorraji, M. H. Rasoulifard, M. H. Khodabandeloo, M. Felekari and M. R. Khoshrou, Microwave absorption properties of polypyrrole-SrFe12O19-TiO2-epoxy resin Nanocomposites: Optimization using response surface methodology, Appl. Surf. Sci., 2016, 383, 9–18, DOI:10.1016/j.apsusc.2016.04.108.
- J. Bisquert and G. Garcia-Belmonte, Interpretation of AC conductivity of lightly doped conducting polymers in terms of hopping conduction, Russ. J. Electrochem., 2004, 40(3), 352–358, DOI:10.1023/B:RUEL.0000019676.99599.bc.
- Y. Zhang, Z. Yang, Y. Yu, B. Wen, Y. Liu and M. Qiu, Tunable Electromagnetic Interference Shielding Ability in a One-Dimensional Bagasse Fiber/Polyaniline Heterostructure, ACS Appl. Polym. Mater., 2019, 1(4), 737–745, DOI:10.1021/acsapm.8b00025.
- H. R. Kim, B. S. Kim and I. S. Kim, Fabrication and EMI shielding effectiveness of Ag-decorated highly porous poly(vinyl alcohol)/Fe 2O 3 nanofibrous composites, Mater. Chem. Phys., 2012, 135(2–3), 1024–1029, DOI:10.1016/j.matchemphys.2012.06.008.
- K. P. Feltz, E. A. Growney Kalaf, C. Chen, R. S. Martin and S. A. Sell, A review of electrospinning manipulation techniques to direct fiber deposition and maximize pore size, Electrospinning, 2017, 2(1), 46–61, DOI:10.1515/esp-2017-0002.
- T. Liu, C. Wang, X. Zhang, H. Huo, H. Li and W. Zhang, Phase Engineering in a Twin-Phase β/γ -MoC x Lightweight Nanoflower with Matched Fermi Level for Enhancing Electron Transport Across the Polarized Interfaces in Electromagnetic Wave Attenuation, Adv. Funct. Mater., 2024, 2410194, 1–12, DOI:10.1002/adfm.202410194.
- B. Dutta, E. Kar, G. Sen, N. Bose and S. Mukherjee, Lightweight, flexible NiO@SiO2/PVDF nanocomposite film for UV protection and EMI shielding application, Mater. Res. Bull., 2020, 124, 110746, DOI:10.1016/j.materresbull.2019.110746.
- V. Fasano, et al., Enhanced Electrospinning of Active Organic Fibers by Plasma Treatment on Conjugated Polymer Solutions, ACS Appl. Mater. Interfaces, 2020, 12(23), 26320–26329, DOI:10.1021/acsami.0c02724.
- S. Li, et al., Materials Today Nano Electrospun nanofiber nonwovens and sponges towards practical applications of waterproofing , thermal insulation , and electromagnetic shielding/absorption, Mater. Today Nano, 2024, 25, 100452, DOI:10.1016/j.mtnano.2024.100452.
- J. Prasad, A. K. Singh, K. K. Haldar, V. Gupta and K. Singh, Electromagnetic interference shielding effectiveness in 3D flower-like MoS2-rGO/gadolinium-doped nanocomposites, J. Alloys Compd., 2019, 788, 861–872, DOI:10.1016/j.jallcom.2019.02.246.
- Y. Cheng, W. Zhu, X. Lu, and C. Wang, Based Composites for Electromagnetic Wave Interference Shielding, 2022, pp. 1–19 Search PubMed.
- B. D. S. Deeraj, G. George, N. R. Dhineshbabu, S. Bose and K. Joseph, Electrospun ZrO2@carbon nanofiber mats and their epoxy composites as effective EMI shields in Ku band, Mater. Res. Bull., 2021, 144, 111477, DOI:10.1016/j.materresbull.2021.111477.
- B. Lyu, Y. Wang, D. Gao, S. Guo, Y. Zhou and J. Ma, Ultra - low reflection electromagnetic interference shielding nanofiber film with effective solar harvesting and self - cleaning, Collagen Leather, 2024, 6(1), 2, DOI:10.1186/s42825-023-00143-5.
| This journal is © The Royal Society of Chemistry 2024 |

