 Open Access Article
Single-molecule detection of modified amino acid regulating transcriptional activity†
Yuki Komoto *ab,
Takahito Ohshiro
 ab,
Yuno Notsuc and
Masateru Taniguchi
 *a
*a
aSANKEN, Osaka University, 8-1, Mihogaoka Ibaraki, Osaka 567-0047, Japan. E-mail: komoto@sanken.osaka-u.ac.jp
bArtificial Intelligence Research Center, Osaka University, 8-1 Mihogaoka, Ibaraki, Osaka 567-0047, Japan
cKakogawa Higashi High School, 232-2 Kakogawachoawazu, Kakogawa, Hyogo 675-0039, Japan
First published on 7th October 2024
Abstract
Acetylation of lysine, a component of histones, regulates transcriptional activity. Simple detection methods for acetyl lysine are essential for early diagnosis of diseases and understanding of the physiological effects. We have detected and recognized acetyl lysine at the single-molecule level by combining MCBJ measurement and machine learning.
In eukaryotes, genomic DNA wrapped around histone proteins forms the nucleosome, constituting the fundamental structure of chromatin.1,2 It is well-known that post-translational modifications of histones, involving chemical alterations of amino acids within proteins, profoundly influence transcriptional activity.1–3 Notably, acetylation of lysine residues in histones, which enhances transcription, has garnered significant attention.1–10 Research into histone acetylation has been actively pursued in the context of various diseases, including Alzheimer's disease, Parkinson's disease, and cancer.6,8,9 Detection of lysine acetylation is typically performed using techniques such as mass spectroscopy, which necessitate cost, time, and the presence of more than 10−15 moles of acetylated lysine for reliable detection.4,9 There is a pressing need within the medical and biological communities for a simpler technique capable of detecting the acetylation at early stages of disease progression.
Single-molecule measurement emerges as a promising method for the novel detection of modified amino acids.11 One of the most typical single-molecule measurement method is mechanically controllable break junction (MCBJ). In MCBJ method, the metal narrow wire fabricated onto flexible substrate is broken by bending the substrate to form nanometer-scale gap.11–13 By directly measuring molecules within the gap, single-molecule measurement offers rapid, sensitive detection without preprocessing.11 Previous studies have successfully demonstrated the detection of amino acids using single-molecule measurement.14–16 Moreover, the ability to differentiate between tyrosine and phosphorylated tyrosine, a notable example of modified amino acids, was demonstrated.14 While some of the 20 amino acids present challenges in achieving maximal single-molecule current discrimination,14,15 recent advancements in machine learning applied to single-molecule measurement data have enhanced molecular differentiation capabilities.17–21 Hence, leveraging machine learning analysis holds promise for advancing the detection and discrimination of modified amino acids. This study aimed to detect and distinguish acetylated lysine at the single-molecule level using single-molecule measurement techniques.
We conducted single-molecule measurements using the Mechanically Controllable Break Junction (MCBJ) method, as illustrated in Fig. 1(A).17,18,22,23 The MCBJ substrates depicted in Fig. 1(B) and (C) were fabricated using nanofabrication techniques.17,18,22 For a comprehensive understanding of the fabrication process, refer to the ESI.† We subjected 1 μM aqueous solutions of L-lysine (Lys) and Nε-acetyl-L-lysine (AcLys) to measurement.
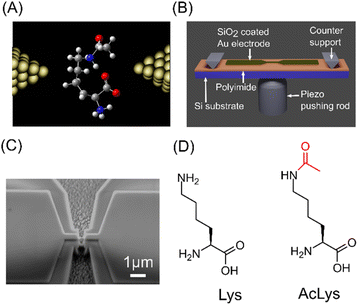 | ||
| Fig. 1 (A) Schematic image of MCBJ measurement. (B) Schematic image of the MCBJ substrate. (C) SEM image of the narrow gold bridge of MCBJ substrate. (D) Molecular structures of Lys and AcLys. | ||
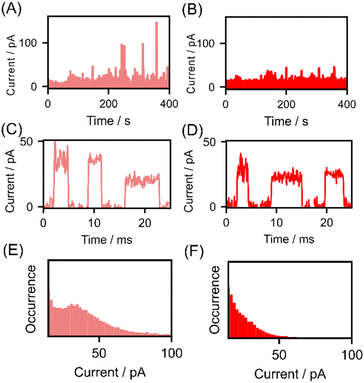
The current–time profiles of lysine and AcLys for measurements conducted with a nanogap width of 0.56 nm are presented in Fig. 2(A) and (B). Notably, pulsed signals were observed during the measurement of both molecules. Fig. 2(C) and (D) illustrates enlarged views of these pulse signals, which are attributed to the passage of a single molecule.17,18 We successfully detected acetylated lysine at the single-molecule level. Analyzing individual signals without employing statistical data is unsuitable because of the variability in the conductance of single-molecule signals.24,25 Therefore, we generated histograms of the maximum currents Ip, as depicted in Fig. 2(E) and (F), a common analytical approach in single-molecule measurements.12,24 In the histogram for lysine, a prominent peak emerged at approximately 38 pA. However, the maximum current of the single-molecule signal for acetylated lysine appeared to be lower than that of lysine, with the histogram lacking a discernible peak at approximately 38 pA. The average maximum current values for lysine and AcLys were 38 and 23 pA, respectively. Statistical analysis indicated a clear distinction between the single-molecule signals of lysine and AcLys. The effect of signal misdetection at low currents can be regarded as insignificant based on the measurement results at blank and low concentrations (ESI†). From the current histogram analysis, the amino acids are not distinguishable from the average Ip. However, statistical analysis indicated a clear distinction between distribution of the single-molecule signals of lysine and AcLys.
First-principles calculations were performed to investigate the reduction in the current resulting from acetylation. The transmission of conduction through a single molecule τ is described by the Breit–Wigner formula, τ = 4ΓLΓR/{(ε − EF)2 + (ΓL + ΓR)2}.25–27 Here, EF, ε, and ΓL,R denote the Fermi level of the electrodes, energy alignment of conduction orbital, and coupling to left/right electrodes, respectively. Energy alignment ε is typically the HOMO level of the measured molecule. The coupling Γ is interaction between the molecule and electrodes. The overlap between the orbital of the metal electrode atom and the orbital of the molecule results in the broadening of the molecular orbital. Γ is level broadening of transmission. The Breit–Wigner model assumes resonance tunneling through the conduction levels of molecules separated by a double barrier that permeates depending on the coupling ΓL/R. Molecular orbitals identical to electrode level provides resonance with maximum transmission. The larger difference of the conduction orbital and the electrode level provides the smaller the transmission. According to the Breit–Wigner formula, the molecular states near the Fermi level of electrodes exhibit high conductance. Consequently, in single-molecule junctions, the conduction orbital is predominantly associated with the HOMO.22,26,27 Thus, we performed Density Functional Theory (DFT) calculations to compute the HOMO of isolated lysine and AcLys molecules by Gaussian.28 Details of the DFT calculations are provided in ESI1.† The calculated HOMO energies are shown in Fig. 3(A) and (B). The HOMO energies were determined to be 3.8 eV and 4.0 eV relative to the Fermi energy of Au(111) for lysine and AcLys, as illustrated in Fig. 3(C).29,30 The energy difference between AcLys and the Fermi energy of the gold electrode was more significant than that of lysine. A larger energy difference causes a decrease in conductance. The orbital shapes of both molecules were similar, with neither orbital being extensively distributed at the acetylated amino group. This suggests that acetylation did not significantly alter the interactions between the molecules and the electrode. Thus, based on our analysis, acetylation is implicated in the reduction in conductance. The consistency between the measurement results and DFT calculations validates the experimental results.
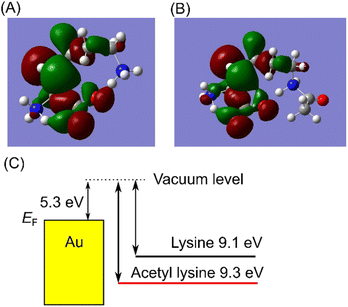 | ||
| Fig. 3 (A and B) Isosurface of HOMO of Lys (A) and AcLys (B) calculated by DFT B3LYP/6-31G. Isovalue is 0.02. (C) Schematic energy diagram of HOMO of Lys and AcLys and Au Fermi level. | ||
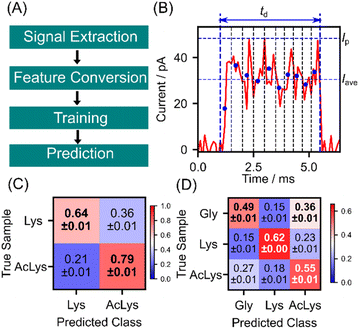
As discussed earlier, lysine and AcLys exhibit distinct currents owing to their different electronic structures, leading to discernible behavior in single-molecule signals. However, the conductance histograms in Fig. 2(E) and (F) demonstrate considerable overlap, making it difficult to differentiate the individual signals based on the current histogram. We applied machine learning techniques for signal identification based on statistical training data to address this issue.17,18 The signal identification process using machine learning is outlined in Fig. 4(A). Initially, signals were extracted from the measured current profiles and converted into features suitable for machine learning classification. These features include the maximum current Ip, average current Iave, signal duration td, and 10-dimensional shape vector (S1, S2. S3, …, S10) of the signal, as depicted in Fig. 4(B). A 10-dimensional shape vector was derived by dividing the signal into 10 sections along the time axis, calculating the average current for each section, and normalizing these values to the maximum current of the signal. Feature vectors were defined as 13-dimensional vector of (Ip, Iave, td, S1, S2, S3, …, S10). Here, each element of the feature vector is standardized to convert to a dimensionless quantity with mean 0 and standard deviation 1. Subsequently, the obtained 13-dimensional feature vectors were divided into training and test data in a 9![[thin space (1/6-em)]](https://www.rsc.org/images/entities/char_2009.gif) :
:![[thin space (1/6-em)]](https://www.rsc.org/images/entities/char_2009.gif) 1 ratio. To mitigate bias in the training data, undersampling was performed to equalize the training data for each class. Then, the random forest classifier was trained with 30
1 ratio. To mitigate bias in the training data, undersampling was performed to equalize the training data for each class. Then, the random forest classifier was trained with 30![[thin space (1/6-em)]](https://www.rsc.org/images/entities/char_2009.gif) 000 training signals and used to predict the test data individually.31 The discrimination results for lysine and AcLys are illustrated in the confusion matrix in Fig. 4(C). The evaluation was conducted using 10-fold cross-validation to ensure an unbiased assessment. The confusion matrix presents the mean and standard deviation of the ten discrimination results. Lys and AcLys were successfully discriminated with an F value of 0.72, where the F-measure served as a performance metric, defined as the harmonic mean of sensitivity and specificity. With a discrimination accuracy of 0.72 for a single molecule, it becomes feasible to identify the target with an accuracy of 90% with 9 signals and 99% with 25 signals through majority voting (ESI2†). Lysine and AcLys were successfully identified using a single-molecule signal. Moreover, considering that proteins encompass amino acids beyond lysine, we extended the analysis to include three other molecules, with glycine as an example of different amino acids. The classification results for the three amino acids are illustrated in Fig. 4(D), with all correctly predicted molecules and an F-measure of 0.56. This result underscores the potential of our approach for post-translational analysis of peptides and proteins.
000 training signals and used to predict the test data individually.31 The discrimination results for lysine and AcLys are illustrated in the confusion matrix in Fig. 4(C). The evaluation was conducted using 10-fold cross-validation to ensure an unbiased assessment. The confusion matrix presents the mean and standard deviation of the ten discrimination results. Lys and AcLys were successfully discriminated with an F value of 0.72, where the F-measure served as a performance metric, defined as the harmonic mean of sensitivity and specificity. With a discrimination accuracy of 0.72 for a single molecule, it becomes feasible to identify the target with an accuracy of 90% with 9 signals and 99% with 25 signals through majority voting (ESI2†). Lysine and AcLys were successfully identified using a single-molecule signal. Moreover, considering that proteins encompass amino acids beyond lysine, we extended the analysis to include three other molecules, with glycine as an example of different amino acids. The classification results for the three amino acids are illustrated in Fig. 4(D), with all correctly predicted molecules and an F-measure of 0.56. This result underscores the potential of our approach for post-translational analysis of peptides and proteins.
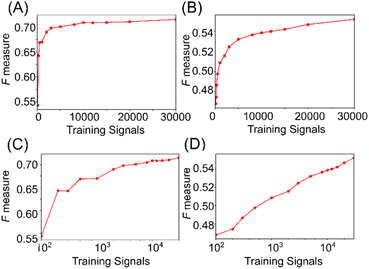
Machine learning has demonstrated the capability to identify single-molecule signals for lysine and AcLys, with classification accuracy dependent on the training data size.21 The relationship between accuracy and the number of training signals is examined in Fig. 5. Fig. 5(a) and (b) illustrate that the discrimination accuracy increased rapidly until the signals reached approximately 3000 on a linear scale. Using approximately 3000 signals in the training data, the discrimination accuracy was determined at 0.7 and 0.5 for distinguishing between two and three molecules. Additionally, plots of accuracy against the logarithm of the number of signals, as depicted in Fig. 5(c) and (d), reveal that the discrimination accuracy increases nearly linearly with the logarithm of the number of signals. These results suggest that the single-molecule signals within the training data exhibited significant diversity. A more accurate identification can be achieved by augmenting the training data comprising a wide distribution of signals in the feature space. Notably, the increase in the discrimination accuracy did not saturate with the number of signals, as shown in Fig. 5(c) and (d). Consequently, augmenting the number of training signals was inferred to effectively enhance accuracy. This analysis offers an effective strategy for achieving high-accuracy single-molecule identification, emphasizing the potential of machine learning in single-molecule measurements.
Conclusions
In summary, we have successfully employed a single-molecule method to detect AcLys, a crucial regulator of transcriptional activation. The single-molecule signals of AcLys demonstrated reduced conductance compared to those of lysine, a finding supported by theoretical calculations, indicating conductance decay due to acetylation. However, single-molecule current histograms revealed differences between the two molecules, and a significant overlap was observed. However, through machine learning classification of single-molecule signals, we successfully identified acetylated amino acids with an accuracy exceeding 0.7. More importantly, it was confirmed that the identification accuracy increased with the number of signals. This suggests that the further acquisition of training data will improve identification performance. Overall, our findings highlight the potential of combining experimental and computational approaches, along with machine learning techniques, for precisely identifying and characterizing modified amino acids at the single-molecule level. Our developed method paves the way for the quantitative evaluation of acetylated lysin of biosamples treated with enzymes. For application to real samples, it is necessary to remove contamination derived from bio-samples. The noise removal method we have developed enables the application of this method to real samples.18,32 Measurement data on real samples and more large training dataset will be required in the future to apply this method to real samples. The possibility of identifying acetyllysine in a single molecule demonstrated in this study establishes the first step toward a new method of measuring biosamples.Data availability
Data for this article, including raw data for current measurement, feature data for machine learning classification, and source codes for analysis, are available at Zenodo at https://zenodo.org/records/13683579.Author contributions
Conceptualization, Y. K., T. O. and M. T.; experiment, Y. K., T. O. and Y. N.; analysis, Y. K., T. O. and Y. N.; visualization, Y. K.; writing – original draft, Y. K.; writing – review & editing, Y. K., T. O. and M. T. All authors have approved the final version of the manuscript.Conflicts of interest
There are no conflicts to declare.Notes and references
- B. D. Strahl and C. D. Allis, Nature, 2000, 403, 41–45 CrossRef CAS.
- T. Kouzarides, Cell, 2007, 128, 693–705 CrossRef CAS PubMed.
- G. Millán-Zambrano, A. Burton, A. J. Bannister and R. Schneider, Nat. Rev. Genet., 2022, 23, 563–580 CrossRef.
- D. G. Christensen, J. T. Baumgartner, X. Xie, K. M. Jew, N. Basisty, B. Schilling, M. L. Kuhn and A. J. Wolfe, mBio, 2019, 10, 10–1128 Search PubMed.
- J. Baeza, J. A. Dowell, M. J. Smallegan, J. Fan, D. Amador-Noguez, Z. Khan and J. M. Denu, J. Biol. Chem., 2014, 289, 21326–21338 CrossRef PubMed.
- B. A. Nacev, L. Feng, J. D. Bagert, A. E. Lemiesz, J. Gao, A. A. Soshnev, R. Kundra, N. Schultz, T. W. Muir and C. D. Allis, Nature, 2019, 567, 473–478 CrossRef CAS PubMed.
- J. Gräff, D. Kim, M. M. Dobbin and L.-H. Tsai, Physiol. Rev., 2011, 91, 603–649 CrossRef.
- G. Park, J. Tan, G. Garcia, Y. Kang, G. Salvesen and Z. Zhang, J. Biol. Chem., 2016, 291, 3531–3540 CrossRef CAS.
- K. Zhang, M. Schrag, A. Crofton, R. Trivedi, H. Vinters and W. Kirsch, Proteomics, 2012, 12, 1261–1268 CrossRef CAS PubMed.
- J. M. Levenson, K. J. O'Riordan, K. D. Brown, M. A. Trinh, D. L. Molfese and J. D. Sweatt, J. Biol. Chem., 2004, 279, 40545–40559 CrossRef CAS PubMed.
- E. M. Dief, P. J. Low, I. Díez-Pérez and N. Darwish, Nat. Chem., 2023, 15, 600–614 CrossRef CAS PubMed.
- H. Song, M. A. Reed and T. Lee, Adv. Mater., 2011, 23, 1583–1608 CrossRef CAS PubMed.
- M. A. Reed, C. Zhou, C. J. Muller, T. P. Burgin and J. M. Tour, Science, 1997, 278, 252–254 CrossRef CAS.
- T. Ohshiro, M. Tsutsui, K. Yokota, M. Furuhashi, M. Taniguchi and T. Kawai, Nat. Nanotechnol., 2014, 9, 835–840 CrossRef CAS.
- L. A. Zotti, B. Bednarz, J. Hurtado-Gallego, D. Cabosart, G. Rubio-Bollinger, N. Agrait and H. S. J. van der Zant, Biomolecules, 2019, 9, 1–13 CrossRef.
- Y. Zhao, B. Ashcroft, P. Zhang, H. Liu, S. Sen, W. Song, J. Im, B. Gyarfas, S. Manna, S. Biswas, C. Borges and S. Lindsay, Nat. Nanotechnol., 2014, 9, 466–473 CrossRef CAS PubMed.
- M. Taniguchi, T. Ohshiro, Y. Komoto, T. Takaai, T. Yoshida and T. Washio, J. Phys. Chem. C, 2019, 123, 15867–15873 CrossRef CAS.
- Y. Komoto, T. Ohshiro and M. Taniguchi, Chem. Commun., 2020, 56, 14299–14302 RSC.
- W. Bro-Jørgensen, J. M. Hamill, R. Bro and G. C. Solomon, Chem. Soc. Rev., 2022, 51, 6875–6892 RSC.
- T. Fu, Y. Zang, Q. Zou, C. Nuckolls and L. Venkataraman, Nano Lett., 2020, 20, 3320–3325 CrossRef CAS PubMed.
- Y. Komoto, J. Ryu and M. Taniguchi, Chem. Commun., 2023, 59, 6796–6810 RSC.
- T. Furuhata, Y. Komoto, T. Ohshiro, M. Taniguchi, R. Ueki and S. Sando, Chem. Sci., 2020, 11, 10135 RSC.
- N. Agraıt, A. L. Yeyati and J. M. van Ruitenbeek, Phys. Rep., 2003, 377, 81–279 CrossRef.
- L. Venkataraman, J. E. Klare, I. W. Tam, C. Nuckolls, M. S. Hybertsen and M. L. Steigerwald, Nano Lett., 2006, 6, 458–462 CrossRef CAS.
- Y. Kim, T. Pietsch, A. Erbe, W. Belzig and E. Scheer, Nano Lett., 2011, 11, 3734–3738 CrossRef CAS.
- A. Vezzoli, Nanoscale, 2022, 14, 2874–2884 RSC.
- Y. Komoto, S. Fujii, H. Nakamura, T. Tada, T. Nishino and M. Kiguchi, Sci. Rep., 2016, 6, 1–9 CrossRef.
- M. J. Frisch, G. W. Trucks, H. B. Schlegel, G. E. Scuseria, M. A. Robb, J. R. Cheeseman, G. Scalmani, V. Barone, B. Mennucci, G. A. Petersson, Gaussian 09 Revision A.1, Gaussian Inc., Wallingford CT, 2009, vol. 66, p. 219 Search PubMed.
- C. D. Zangmeister, S. W. Robey, R. D. van Zee, Y. Yao and J. M. Tour, J. Phys. Chem. B, 2004, 108, 16187–16193 CrossRef CAS.
- H. B. Michaelson, J. Appl. Phys., 1977, 48, 4729–4733 CrossRef CAS.
- F. Pedregosa, G. Varoquaux, A. Gramfort, V. Michel, B. Thirion, O. Grisel, M. Blondel, P. Prettenhofer, R. Weiss and V. Dubourg, J. Mach. Learn. Res., 2011, 12, 2825–2830 Search PubMed.
- Y. Komoto, T. Ohshiro, T. Yoshida, E. Tarusawa, T. Yagi, T. Washio and M. Taniguchi, Sci. Rep., 2020, 10, 11244 CrossRef CAS.
Footnote |
| † Electronic supplementary information (ESI) available. See DOI: https://doi.org/10.1039/d4ra05488a |
| This journal is © The Royal Society of Chemistry 2024 |

